 Xiukun Wang
 Zheng Zhang
 Rundong Gong1
 Sen Wang
- 1Unconventional Petroleum Institute, China University of Petroleum (Beijing), Beijing, China
- 2Key Laboratory of Unconventional Oil and Gas Development (China University of Petroleum (East China)), Ministry of Education, Qingdao, China
- 3China National Oil and Gas Exploration and Development Company Ltd., Beijing, China
The oil–water two-phase flow mechanism is the critical issue for producing shale oil reservoirs after huge-volume hydraulic fracturing treatment. Due to the extremely low permeability of the shale matrix, the two-phase experimental measurement is impossible for shale samples. In this work, a pore network model is proposed to simulate steady-state oil–water flow with mixed wettability under consideration. The model is first applied in Berea sandstone, and the calculated relative permeabilities are validated with experimental studies for different wettability scenarios. Then, the three-dimensional FIB-SEM imaging of the Jimsar shale sample is used to extract a representative shale pore network with 13,419 pores and 31,393 throats. The mean values of pores and throats are 29.75 and 19.13 nm, and the calculated absolute permeability is 0.005 mD. With our proposed model, the calculated relative permeability curves show a high residual oil saturation for all the wettability conditions. Specifically, the oil-wet and mixed-wet conditions yield lower residual oil compared with the water-wet condition. For 50–50 mixed-wet conditions, the water phase relative permeability is much higher for smaller pores being oil-wet than the larger pores being oil-wet.
Introduction
Worldwide, the shale oil and gas reservoirs are important supplementary unconventional resources for the petroleum industry. The shale boom helps the United States to regain status as the top oil-producing country and changes the political and energetical situations for the whole world. In China, the Jimsar shale oil in Xinjiang province is one of the most high-potential shale pay zones (Yang et al., 2018). Because almost all the multifractured horizontal wells are commonly used to develop shale oil reservoirs, the oil–water two-phase flow becomes vital after a huge amount of fracturing water injection. Due to the extremely low permeability of the shale matrix, the two-phase experimental measurement is impossible for shale samples. The digital rock physics and pore-scale modeling methods are believed to be a substitute for laboratory multiphase flow experimental studies. Conventionally, the digital rock data set is obtained by a micro-CT scanner with a resolution of around 1 μm; however, the pore and throat sizes of the shale matrix are much smaller, and most pore diameters are less than 100 nm. Recently, the focused ion beam scanning electron microscope (FIB-SEM) imaging technique is introduced to reconstruct shale digital rock data (Kelly et al., 2016). This approach works by creating an image of the surface layer of a sample, which is then stripped away using a beam of charged particles to reveal the layer beneath. The new surface can then be imaged, and so on, through the whole sample.
As for pore-scale modeling methods, there are mainly two types: direct numerical simulation and pore network modeling. The former method consists of conventional grid-based CFD methods, e.g., VOF (Raeini et al., 2014), and the lattice Boltzmann method (Ramstad et al., 2010). As for the huge amount of the digital rock data, direct numerical simulation is almost impossible for multiphase flow simulation because of the high computational demand. The pore network modeling method relieves the computational effort by representing the detailed pore space via interconnected pores and throats. The pore network extraction algorithms include central axis extraction, maximum sphere filtration, watershed segmentation, etc. (Dong and Blunt, 2009; Rabbani et al., 2014). With the irregular, cross-sectional, triangular-shaped pores and throats, multiphase could coexist in a capillary balance, which leads to the birth of quasi-static pore network models (Øren et al., 1998; Valvatne and Blunt, 2004). To the best of our knowledge, the previous pore-scale modeling studies of fluids flow in shale mainly focus on single-phase flow and synthetic networks (Guo et al., 2018; Wang and Sheng, 2018).
In this work, a pore network model is proposed to simulate steady-state oil–water flow with mixed wettability under consideration. The model is first applied in Berea sandstone, and the calculated relative permeabilities are validated with experimental studies for different wettability scenarios. Then, three-dimensional FIB-SEM imaging of the Jimsar shale sample is used to extract a representative shale pore network used within our proposed model to investigate the oil–water flow mechanisms.
Methodology and Validation
Following the work by Ryazanov et al. (2009), the four-pointed, star-shaped, cross-sectional area is used to improve the representative accuracy of irregular triangles. The geometrical diagram is shown in Figure 1. Then, the crossing area
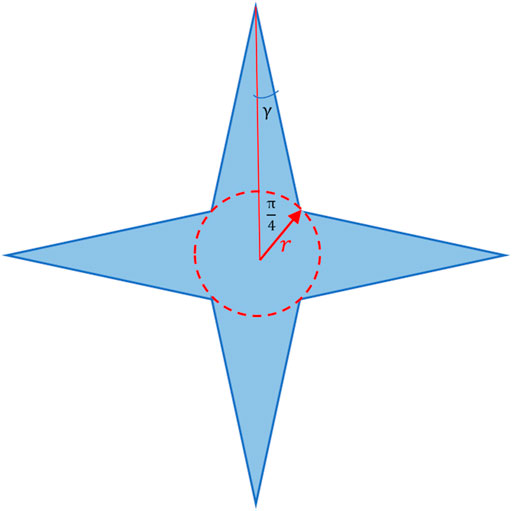
FIGURE 1. Four-pointed, star-shaped, cross-section area of pores and throats.
The crude oil within shale formations is supposed to be accumulated by primary drainage, where the initial water coexists and the corresponding water saturation can be calculated by the maximum drainage capillary pressure
where
As for oil–water flow encountered in field practice, the steady-state water injection is used for pore scale simulating shale oil–water flow processes, in which the capillary pressure decreases from maximum value to zero and then to the negative maximum. Because the shale oil formations are believed to be mixed-wet, the displacement mechanisms are divided into water-wet and oil-wet pores.
First, for water-wet throats, spontaneous snap-off and piston-like filling are considered, and the corresponding threshold capillary pressures are given in Eq. 5 and Eq. 6.
where
For water-wet pore bodies, cooperative pore filling is also considered, and the corresponding threshold capillary pressure is formulated in Eq. 7.
where
After inlet capillary pressure reduces to negative, the oil-wet pores and throats are filled by forced water injection, which is similar to the process of primary drainage except for the existence of sandwiched oil film. When
where
As for oil-wet throat forced snap-off, due to the minimum value of corresponding threshold pressure, the happening probability is quite low (Blunt, 2017), which is not considered in this work.
During the water injection process, the oil and water saturation are updated by the microdisplacement mechanisms as shown. The efficient graph-based NetworkX (Hagberg et al., 2008) package is used to recheck the trapped oil clusters. For every capillary pressure decreasing step, the phase conductance of every pore and throat are updated by their balanced water saturation. Then, an adjacent matrix is established by putting the conductance values on the corresponding positions. Given an arbitrary pressure drop between the inlet and outlet, the pressure of every pore and throat are calculated. Then, the outlet face flow rate is obtained. Finally, we apply Darcy’s equation, and the absolute and phase effective permeability are computed.
Applying the proposed pore network model to the Berea sandstone pore network data extracted using Dong and Blunt’s software, the absolute permeability yields 1.78 mD, which is close to the experimental value of 2.45 mD. The error is caused by the micro-heterogeneity. The relative permeability curves for water-wet and 50–50 mixed-wet scenarios are shown in Figure 2, in which the contact angle of water-wet and oil-wet pores are set as 60° and 120°, respectively. The experimental measured data matches the pore network calculated curves, which validates our model to predict oil–water flow mechanisms within a 3-D digitalized rock.
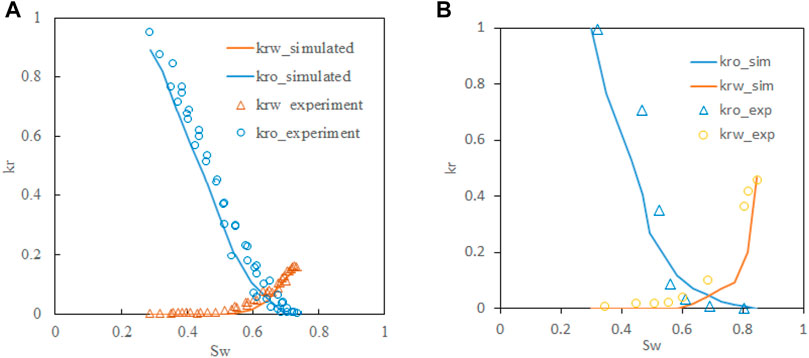
FIGURE 2. Pore network model–calculated relative permeability curves of Berea sandstone validated by experimental data (Valvatne and Blunt, 2004) (A) for water-wet, (B) for 50–50 mixed-wet.
Pore Network Modeling of Oil–Water Flow in Jimsar Shale
The Jimsar shale sample is used in this study to digitalize the pore space in three dimensions. The FIB-SEM experiment is implemented, in which the resolution is 20 nm∗20 nm∗20 nm and the data size is 500∗500∗500. Applying the fast Fourier transformation, the noisy artifacts are removed from the 3-D image. The pore space is segmented by setting a threshold grayscale value, and the maximum sphere algorithm is used to extract the pore network. The 3-D pore space and pore network are visualized in Paraview (Ahrens et al., 2015) as shown in Figure 3.
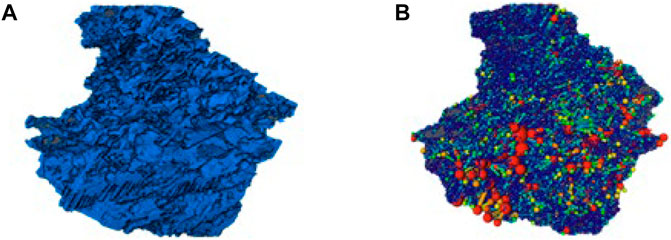
FIGURE 3. Jimsar shale pore space and pore network visualization in Paraview; (A) pore space distribution, (B) pore network visualization.
There are 13,419 pores and 31,393 throats for the Jimsar shale pore network, and the connected porosity is 16.35%, which is close to the experimentally measured 19%. The loss of porosity is due to the unresolvable voxel for pores and throats less than 20 nm. Applying statistics of the pore network properties, the mean radius of pores and throats are 29.75 and 19.13 nm. The average pore–throat aspect ratio is 2.29 although we have several bigger pores and throats as shown in Figure 3.
Applying our proposed pore network model, the absolute Darcy permeability is calculated as 0.004–0.006 mD for x, y, and z flowing directions, which is also a reasonable value for the shale oil reservoir in the formation conditions. Note that the gas slippage and formation deformation (Sheng et al., 2019; Sheng et al., 2020; Pang et al., 2020; Pang et al., 2021) are not considered. With the 50–50 mixed-wet scenario, i.e., half of the pores and throats are water-wet and the other half are oil-wet. The contact angle of water-wet and oil-wet pores are set as 60° and 120°, respectively. Setting the larger or smaller half pores and throats to be oil-wet, the simulated relative permeability curves are shown in Figure 4.
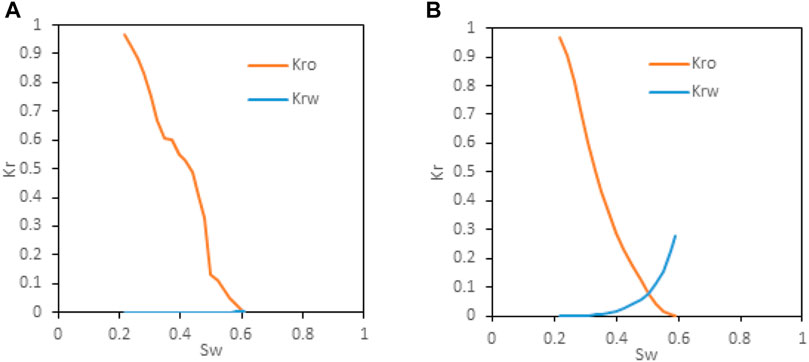
FIGURE 4. Oil–water relative permeability of Jimsar shale with 50–50 mixed-wet conditions, (A) larger pores being oil-wet, (B) smaller pores being oil-wet.
According to the figure, both wettability scenarios indicate a high residual oil saturation (i.e., close to 40%) and a narrow two-phase flow region, which means that the oil recovery of shale oil is much lower than conventional highly permeable reservoirs. For larger pores being oil-wet, the water phase relative permeability is extremely low, and the endpoint value is less than 0.01, which means water within the shale matrix almost will not flow, which is quite similar to the phenomenon of permeability jail (Shanley et al., 2004). For the oil-wet smaller pore scenario, the water phase relative permeability increases much faster with the increase of water saturation, and the endpoint is around 0.3. The differences suggest that the larger pores contribute the most flow ability. When larger pores are oil-wet, water first fills the water-wet smaller pores, and then, the oil-filled larger pores are trapped with no escape channels. However, when larger pores are water-wet, water first fills them and then extends to smaller oil-wet pores. The distribution of oil-wet pores plays a significant role in the oil-water flow mechanisms even though the overall wettability of both conditions is 50–50 mixed-wet. The future studies need to enlarge the pore network model to be more representative of the shale formations, which induces two challenges: experimental requirements and computational demand. The first one can be relieved by generating topological effective pore networks. The second challenge needs a more efficient pore network simulator, which is under the development of our future work.
Conclusion
A pore network model is proposed to simulate oil–water flow with mixed wettability scenarios. The model is applied in Berea sandstone, and the calculated relative permeabilities are validated with experimental studies for different wettability scenarios. Then the three-dimensional FIB-SEM imaging of the Jimsar shale sample is used to extract a representative shale pore network and our proposed model is used to investigating the oil–water flow mechanisms. The mean values of pores and throats are 29.75 and 19.13 nm, and the calculated absolute permeability is 0.005 mD. The calculated relative permeability curves show a high residual oil saturation for all the wettability conditions. The distribution of oil-wet pores plays a significant role in the oil-water flow mechanisms even though the overall wettability of both conditions is 50–50 mixed-wet.
Data Availability Statement
The raw data supporting the conclusion of this article will be made available by the authors, without undue reservation.
Author Contributions
All authors listed have made a substantial, direct, and intellectual contribution to the work and approved it for publication.
Funding
This work is supported by Beijing Municipal Natural Science Foundation (No. 2214077) and the Opening Fund of Key Laboratory of Unconventional Oil and Gas Development (China University of Petroleum (East China)), Ministry of Education (No. 19CX05005A-3).
Conflict of Interest
Author ZZ is employed by China National Oil and Gas Exploration and Development Company Ltd.
The remaining authors declare that the research was conducted in the absence of any commercial or financial relationships that could be construed as a potential conflict of interest.
Publisher’s Note
All claims expressed in this article are solely those of the authors and do not necessarily represent those of their affiliated organizations, or those of the publisher, the editors and the reviewers. Any product that may be evaluated in this article, or claim that may be made by its manufacturer, is not guaranteed or endorsed by the publisher.
References
Ahrens, J., Geveci, B., and Law, C. (2005). Paraview: An End-User Tool for Large Data Visualization. The visualization handbook. 717 (8), 717–731. doi:10.1016/b978-012387582-2/50038-1
Blunt, M. J. (2017). Multiphase Flow in Permeable media: A Pore-Scale Perspective. Cambridge: Cambridge University Press.
Dong, H., and Blunt, M. J. (2009). Pore-Network Extraction From Micro-Computerized-Tomography Images. Phys. Rev. E Stat. Nonlin Soft Matter Phys. 80 (3), 036307. doi:10.1103/PhysRevE.80.036307
Guo, B., Ma, L., and Tchelepi, H. A. (2018). Image-Based Micro-Continuum Model for Gas Flow in Organic-Rich Shale Rock. Adv. Water Resour. 122, 70–84. doi:10.1016/j.advwatres.2018.10.004
Hagberg, A., Swart, P., and S Chult, D. (2008). Exploring Network Structure, Dynamics, and Function Using NetworkX (No. LA-UR-08-05495; LA-UR-08-5495). Los Alamos, NM (United States): Los Alamos National Lab.(LANL).
Kelly, S., El-Sobky, H., Torres-Verdín, C., and Balhoff, M. T. (2016). Assessing the Utility of FIB-SEM Images for Shale Digital Rock Physics. Adv. Water Resour. 95, 302–316. doi:10.1016/j.advwatres.2015.06.010
Øren, P.-E., Bakke, S., and Arntzen, O. J. (1998). Extending Predictive Capabilities to Network Models. SPE J. 3 (04), 324–336. doi:10.2118/52052-pa
Pang, Y., Fan, D., and Chen, S. (2021). A Novel Approach to Predict Gas Flow in Entire Knudsen Number Regime Through Nanochannels With Various Geometries. SPE J., 1–20. doi:10.2118/205506-pa
Pang, Y., Hu, X., Wang, S., Chen, S., Soliman, M. Y., and Deng, H. (2020). Characterization of Adsorption Isotherm and Density Profile in Cylindrical Nanopores: Modeling and Measurement. Chem. Eng. J. 396, 125212. doi:10.1016/j.cej.2020.125212
Rabbani, A., Jamshidi, S., and Salehi, S. (2014). An Automated Simple Algorithm for Realistic Pore Network Extraction from Micro-Tomography Images. J. Pet. Sci. Eng. 123, 164–171. doi:10.1016/j.petrol.2014.08.020
Raeini, A. Q., Blunt, M. J., and Bijeljic, B. (2014). Direct Simulations of Two-Phase Flow on Micro-CT Images of Porous Media and Upscaling of Pore-Scale Forces. Adv. Water Resour. 74, 116–126. doi:10.1016/j.advwatres.2014.08.012
Ramstad, T., Øren, P.-E., and Bakke, S. (2010). Simulation of Two-Phase Flow in Reservoir Rocks Using a Lattice Boltzmann Method. Spe J. 15 (04), 917–927. doi:10.2118/124617-pa
Ryazanov, A. V., Van Dijke, M. I. J., and Sorbie, K. S. (2009). Two-Phase Pore-Network Modelling: Existence of Oil Layers During Water Invasion. Transp Porous Med. 80 (1), 79–99. doi:10.1007/s11242-009-9345-x
Shanley, K. W., Cluff, R. M., and Robinson, J. W. (2004). Factors Controlling Prolific Gas Production From Low-Permeability Sandstone Reservoirs: Implications for Resource Assessment, Prospect Development, and Risk Analysis. Bulletin. 88 (8), 1083–1121. doi:10.1306/03250403051
Sheng, G., Su, Y., and Wang, W. (2019). A New Fractal Approach for Describing Induced-Fracture Porosity/Permeability/Compressibility in Stimulated Unconventional Reservoirs. J. Pet. Sci. Eng. 179, 855–866. doi:10.1016/j.petrol.2019.04.104
Sheng, G., Zhao, H., Su, Y., Javadpour, F., Wang, C., Zhou, Y., et al. (2020). An Analytical Model to Couple Gas Storage and Transport Capacity in Organic Matter With Noncircular Pores. Fuel. 268, 117288. doi:10.1016/j.fuel.2020.117288
Valvatne, P. H., and Blunt, M. J. (2004). Predictive Pore‐Scale Modeling of Two‐Phase Flow in Mixed Wet Media. Water Resour. Res. 40 (7), W07406. doi:10.1029/2003wr002627
Wang, X., and Sheng, J. J. (2018). Pore Network Modeling of the Non-Darcy Flows in Shale and Tight Formations. J. Pet. Sci. Eng. 163, 511–518. doi:10.1016/j.petrol.2018.01.021
Keywords: shale oil, pore network modeling, two-phase flow, relative permeability, mixed-wettability
Citation: Wang X, Zhang Z, Gong R and Wang S (2021) Pore Network Modeling of Oil–Water Flow in Jimsar Shale Oil Reservoir. Front. Earth Sci. 9:738545. doi: 10.3389/feart.2021.738545
Received: 09 July 2021; Accepted: 30 July 2021;
Published: 13 September 2021.
Edited by:
Yu Pang, University of Calgary, CanadaReviewed by:
Guanglong Sheng, Yangtze University, ChinaPing Yue, Southwest Petroleum University, China
Copyright © 2021 Wang, Zhang, Gong and Wang. This is an open-access article distributed under the terms of the Creative Commons Attribution License (CC BY). The use, distribution or reproduction in other forums is permitted, provided the original author(s) and the copyright owner(s) are credited and that the original publication in this journal is cited, in accordance with accepted academic practice. No use, distribution or reproduction is permitted which does not comply with these terms.
*Correspondence: Xiukun Wang, eGl1a3Vud2FuZ0BjdXAuZWR1LmNu