 Shuyu Pang1,2
 Liping Zhu
- 1Key Laboratory of Tibetan Plateau Environment and Landform Process, Institute of Tibetan Plateau Research, Chinese Academy of Sciences, Beijing, China
- 2University of Chinese Academy of Sciences, Beijing, China
- 3CAS Center for Excellence in Tibetan Plateau Earth Sciences, Beijing, China
- 4College of Agriculture and Forestry Economics and Management, Lanzhou University of Finance and Economics, Lanzhou, China
The area and volume changes of 20 lakes that were present during the period 1976–2019 in different parts of the Tibet Plateau were extracted using Landsat remote sensing satellite images on the Google Earth Engine platform. Changes in the water volume of the lakes were analyzed using data from the digital elevation model. Basin scale interpolated meteorological data from the China regional surface meteorological feature dataset and the glacier distribution were used together with GIS technology and spatial statistical methods to reveal the impact of climate change and glacial melting water on the changes occurring in different regions. The results showed that both the area and water volume of the 20 studied lakes were generally stable from 1976–1986, increased significantly from 1986–1991, and decreased significantly from 1991–1995, after which they again began to increase. The increase in both amplitude and rate reached the highest values from 1995–2005, while the rate of increase slowed from 2014–2016. Precipitation and temperature are the main factors that result in the rapid increase of the water volume in closed lakes, but the influence of this phenomenon varies in different areas. The climate is relatively “warm and wet” around the inland enclosed lake areas in the southeast of the plateau where precipitation is the dominant factor and both precipitation and temperature affect the lake water volume in the center of the plateau; however, the climate is comparatively “cold and dry” in the northwest and the increase in glacier meltwater that results from increases in the temperature has a more significant impact.
Highlights
• The lake water volume in 20 studied lakes of TP varied with fluctuations during 1976–1995, and afterwards kept to significantly continue increase from 1995–2019, but the rate of increase slowed during 2014–2016.
• For the lake water volume changes in interior closed lake area of TP, precipitation is dominant drives in southeastern part; both precipitation and temperature are dominant in central part; glacier meltwater caused by rising temperatures has a more significant impact in northwestern part.
• The lake with glacier meltwater water performs weak fluctuations under lower temperature and precipitation conditions (such as before 1995) but is more sensitive to temperature rising in low-precipitation regions (such as the northwestern part).
Introduction
The Tibet Plateau (TP) has the highest altitude, largest area, and the largest number of plateau lakes worldwide, and they are an important component within the underlying surface of the TP. The lakes are mostly closed. Temperature, precipitation, and glacier meltwater and lake evaporation all impact the lake water balance in the region, rendering the lake area and water volume changes sensitive to climatic changes. At the same time, the expansion and contraction of the lakes also alters the energy exchange between the land surface and the atmosphere, affecting regional precipitation (Dai et al., 2018) and evaporation (Wang et al., 2020). Extensive research has been conducted on changes in the amount, area, water level and water volume in the lakes on the TP (Li et al., 2011; Wang et al., 2013; Zhang et al., 2014; Song et al., 2015; Wan et al., 2016; Yang et al., 2017; Zhang et al., 2019a). The results have indicated that, with the relative decrease in precipitation in the monsoon region and the relative increase in precipitation in the westerly dominant region, the lakes are obviously expanding in the northern part of the TP and retreating in the south (Lei et al., 2014; Zhu et al., 2020). Although several studies have paid attention to the regional differences associated with changes in the characteristics of these lakes (Yang et al., 2017) and analyzed the variation in the features of lakes with different supply sources (Qiao et al., 2019), a deep understanding of the spatial differentiation of lake changes has not yet been satisfied due to the vast geographical area covered by the TP with rich landforms and multiple meteorological conditions that differ both from east to west and south to north (Zhang et al., 2019b). This shortage is especially evident in the comparative research that has been conducted investigating the causes of lake changes in different regions (Li et al., 2014; Song and Sheng, 2016), which greatly affects the understanding of the relationship between the lakes and climate change. In recent years, the publicity of large amounts of remote sensing image data and the development of cloud computing technology have enabled researchers to rapidly and extensively estimate the areas covered by and the water volume in these lakes on interannual and even seasonal scales, using remote sensing data. This is conducive to producing an accurate description of lake changes at the regional scale, there by indicating the times at which the inflection points change. The impact of climate change on lake change can be further analyzed, combined with meteorological data set with high temporal resolution which has been gathered in recent years based on multi-source data fusion and has been verified by field observations. (He et al., 2020). Based upon the present preliminary analyses of the regional differentiation of lake changes on the TP (Yang et al., 2017; Qiao et al., 2019), we selected 20 lakes in five different regions of the inland closed lake area on the TP to study a continuous time series of changes in the lake area and water volume on an interannual scale over the past 43 years (1976–2019). The relationships among these changes were analyzed according to regional meteorological data (temperature, precipitation), and replenishment types (glacier meltwater and non-glacier meltwater) in order to further understand the impact that climate change has on lakes in different regions and provide an in-depth understanding of the trends of lake changes in Asian Water Tower under the influence of climate change.
Study Area Features
The strong uplift of the TP since the Cenozoic has resulted in the formation of a series of huge mountain ranges around and inside the plateau (Li and Pan, 2002). The presence of these mountain ranges has led to the formation of a series of interior river systems on the plateau, while the lakes that form in the mountain basins become isolated and form closed lakes. In contrast, the barriers created by the high mountains prohibit the transportation of water vapor and result in spatial differentiation in terms of both climatic conditions and lake replenishment. Because lake replenishment is mainly determined by the meteorological and hydrological conditions of watersheds, this study mainly concerns the relationship between the climate and lake changes at the basin scale. The watershed boundary data used in this study were obtained from HydroSHEDS (Lehner et al., 2006).
Although there are more than 1,600 lakes on TP, the changes of big lakes are more representative for lake spatial-temporal variation features. Previous studies, according to the lake water volume changes of those lake with area great than 50 km2 (Yang et al., 2017) and with area great than 10 km2 (Qiao et al., 2019), have revealed that the lake changes were able to be divided into 5 regions and clearly characterized by regional differentiations. Because we try to know more detailed temporal changes among these regions, and the lake water areas are hoped to be extracted by auto-analyses method in Google Earth Engine (GEE) platform, the 20 enclosed lakes with regular shape and clear water boundary in these 5 regions are chosen. They are Selin Co., Nam Co., Dung Co., and Bam Co. in the southeast; Wulanwula Lak, Xijir Ulan Lak, Dogaicorng Qangco, Ruola Co. in the northwest; Tangra Yum Co., Angzi Co., Yibug Caka, Dagze Lake in the center; Lumajangdong Co., Aksai Chin Lake, Bajabuco, Jieze Caka in the northwest; and Yamdrok Lake, Mapang Yum Co., Laon Co., Paiku Co. in the southern external flow area (Figure 1). Of the selected 20 lake basins, 16 show glacial distribution according to the China Second Glacier Inventory (Guo et al., 2014).
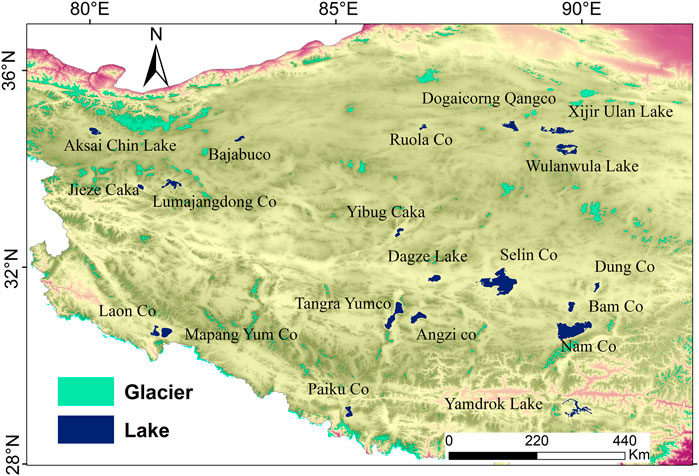
FIGURE 1. Position of the studied lakes on TP and the relationships of the lakes with glaciers.
Data and Methods
Data Sources
Landsat series images were used to extract the lake area according to the water body index. Data from The Shuttle Radar Topography Mission Digital Elevation Model (SRTM DEM) were used to fit the relationship between the changes in the lake area and water volume. The China Meteorological Forcing Dataset (CMFD) was used to extract the watershed-scale temperature and precipitation data. The distribution of glaciers in the basin was determined according to the Second Glacier Inventory Dataset of China. All the data used are shown in Table 1.
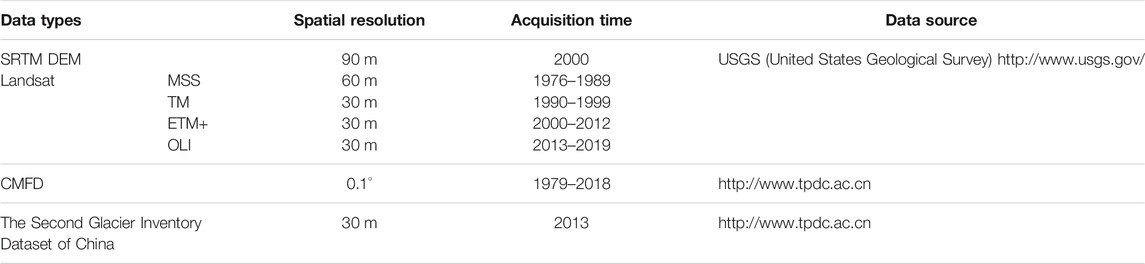
TABLE 1. Data sources used in this study.
Remote Sensing Image Processing and Lake Boundary Extraction
The most frequently-used methods for the extraction of lake boundaries include the single-band threshold (Rundquist et al., 1987; Yang et al., 2015), multi-band ratio (Zhang et al., 2011; Fisher et al., 2016), spectral relationship (Ji et al., 2009), automatic extraction of water body boundary vectorization (Jiang et al., 2014), and unsupervised and supervised classification (Kingsford and Wales, 1997; Li et al., 2011; Song et al., 2013), among others. Of these, the normalized difference water index (NDWI) is most suitable for the study of large-scale lake water bodies because of its simple operation and wide application.
Because we aimed to analyze annual changes that have occurred in the lake area over the past 43 years (1976–2019), the large number of remote sensing images were required. Automatic image processing, lake water boundary determination, and lake area extraction were performed on the Google Earth Engine (GEE) cloud computing platform to obtain the annual area of the 20 studied lakes on the TP over the period 1976–2019. For minimizing the effects of cloud to images and excluding water level differentiation in different seasons, the images for the optimal seasons (September and October of each year) are selected. Besides, the water level is relatively highest in this period. First, simple image preprocessing and cloud removal were performed in GEE, and then the band ratio method was used to calculate the NDWI, for which the thresholds were adjusted until the lake boundary was accurately extracted. The NDWI was calculated using (green band–near infrared band)/(green band + near infrared band) and the areas of the lakes were calculated from the information obtained about the lake boundaries.
Estimation of Changes in the Lake Volume
If the lake water volumes that are associated with different lake areas are known, a lake area-water volume relationship can be constructed. Changes in the volume of lake water can be easily calculated according to changes in the lake area (ΔS) based on remote sensing image analyses. However, the poor accessibility of the lakes on the TP means that few in situ bathymetric surveys of these lakes have been conducted, rendering it difficult to build a lake area-water volume relationship for each lake. Remote sensing allows for the simultaneous extraction of changes in the lake area (ΔS = S1-S2) (e.g., Landsat) and lake water levels (ΔH = H1−H2) (e.g., ICESat or CryoSat) between 2 time points. Then the Eq. 1 is used to estimate relative lake water volume changes (ΔV).
Where ΔV is the change in water volume from lake area S1 to area S2, and H1 and H2 are the lake level elevations that correspond to lake areas S1 and S2.
However, this method is only able to be applied in the water volume changes of lakes which possess lake level and area data. Because the in situ lake level data on TP is fewer and satellite altimetry data that describes lakes are limited (Zhang et al., 2017). The method by using Eq. 1 is therefore insufficient for obtaining information about changes in the water volume of lakes on a large scale.
The SRTM DEM data that were obtained in 2,000 provide topographic data concerning the lake level in 2,000, which was the period during which most of the TP lakes started to expand. The followed lake level increasing reflected in the contour lines of the topographic map allow us to easily extract lake boundary at certain elevation, and the lake area is easily able to be calculated from SRTM. Based on this inference, taking lake elevation and lake water area in Eq. 1 at year 2,000 as H1 and S1, we may calculate the lake areas corresponding to every 1 m lake level rises, then obtain a series of lake water volume changes (ΔVs) of each lake relative to its year 2,000 status. By using the series of lake water volume changes (ΔVs) between its lake level in 2,000 and followed certain lake levels and the corresponding lake areas under the certain lake level, the relations of the lake water volume changes and the corresponding lake area can be established for each lake (Eq. 2).
Where, ΔVi is the lake water volume change between relative lake level i m higher than its 2,000 status, and Si_is the lake area at the lake level i m higher than its 2,000 status, i = 1, 2, 3,.....
Using SRTM DEM data and the polynomial function method, each result of Eq. 2 of the studied 20 lakes were obtained (see Supplementary Appendix Table 1). Yang et al. (2017) used the same method to investigate five lakes with bathymetric data but with different shapes and sizes. Compared with the lake water volume changes derived from the bathymetric data under different lake areas condition, the relative error of the estimated lake water volume changes by this method of lake area-volume change relationship is acceptable in different lakes. The results showed that an overall average relative error was 4.98 %, with 2.17 % for Nam Co., 5.03 % for Tangra Yumco, 5.72 % for Taro Co. 8.71 % for Buruo Co., and 3.29 % for Daxiong Lake. Zhang et al. (2013) used ICESat and Landsat data to study the elevation, area, and volume changes of the ten largest lakes in China from 2003–2009. We chose two lakes (Nam Co. and Selin Co.) to compare the lake water level changes extracted from SRTM DEM data and those measured by ICESat during 2003–2009. The results showed an error of 5.01 % for Selin Co. and 1.98% for Nam Co. Therefore, the acceptable error of lake level changes between those extracted from SRTM DEM and the measured data derived from ICESat indicate that the lake water volume change based on the SRTM DEM method can be applied for estimating lake volume changes on a large scale (Zhang et al., 2013; Yang et al., 2017).
Results
Characteristics of Overall Lake Water Volume Changes
The annual lake areas of the studied 20 lakes over the period 1976–2019 were obtained (except for data that was missing in some years) by interpreting a series of Landsat remote sensing images on the GEE platform. The size grades of the lakes studied are listed in Table 2. Although only two lakes demonstrated areas greater than 2000 km2 (Nam Co. and Selin Co.), which account for the largest proportional area of approximately 40 % of the total area covered by the studied lakes. The areas of the remaining 18 lakes ranged from 100 to 800 km2.
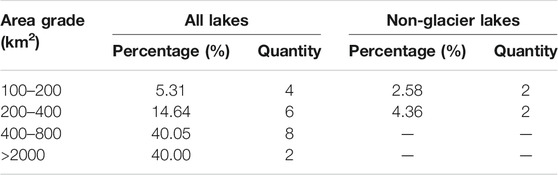
TABLE 2. Distribution of the areas of studied lakes in 2019.
The Annual Average Volume Changes (AAVC) in the amount of lake water were estimated based on the regression equations of lake area and the water volume changes (Supplementary Appendix Table 1). The total area of the 20 studied lakes increased by 2,245.75 km2 (from 8,826.72 km2 to 11,072.47 km2) over the period 1976–2019 with an average annual increase rate of 52.23 km2/yr. However, the area of three lakes; Laon Co. Paiku Co. and Yamdrok Lake decreased by 41.17 km2. In general, the trends in the changes in the area and water volume of the lakes were consistent (Figure 2A). Both the relative changes in lake area and water volume showed that they were stable during the period 1976–1986, with a significant increase from 1986–1991, a decline from 1991–1995, and a large increase from 1995–2019. The Annual Average Area Change Rate (AAACR) and the Annual Average Volume Change Rate (AAVCR) suggest that although the area and water volume of the lake increased, the rate of increase decreased from 2005–2014 as compared with 1995–2005, while the rate at which the AAVCR increased slowed from 2014–2016 and increased again from 2016–2019 (Figure 2B).
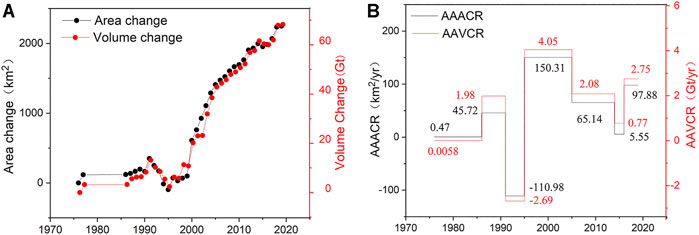
FIGURE 2. Changes in the lake area and water volume of the 20 studied lakes during the period 1976–2019. (A) Changes in the total lake area and water volume changes; (B) Changes in the annual average area change rate (AAACR) and annual average volume change rate (AAVCR).
Table 3 shows the volume change and the AAVCR over seven periods. The water volume of 20 studied lakes increased by 63.67 Gt over the entire study period. The results indicate that 15 of the lakes increased in terms of water volume, while 5 decreased. From 1991–1995, the volume of water in the studied lakes dropped sharply with a net decrease that exceeded the increase during the previous period, resulting in a negative balance in the lake water volume. The volume of lake water started to increase again after 1995, with the largest rate of increase from 1995–2005. The volume of lake water volume in 2001 exceeded that in 1991 (Figure 2A).
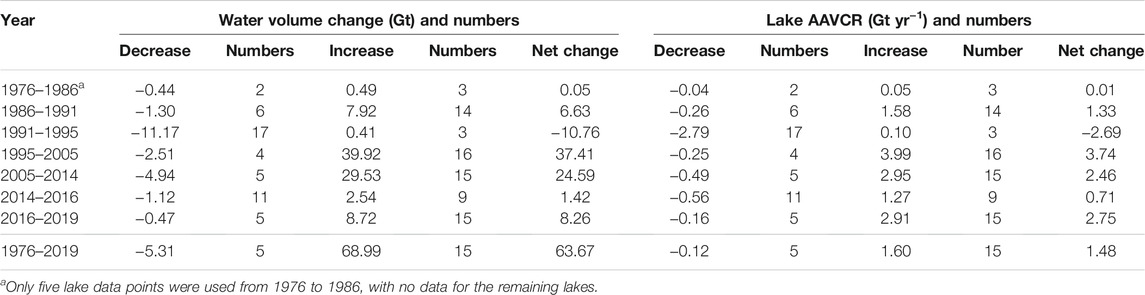
TABLE 3. Lake volume change and Annual Average Volume Change Rate (AAVCR) in different periods during the period 1976–2019.
Five of the lakes (Jieze Caka, Laon Co. Paiku Co. Mapang Yum Co. and Yamdrok Lake) showed a decrease in water volume during 1976–2019, all of which were distributed in southern Tibet. Of these, Yamdrok Lake decreased by 1.77 Gt during the period 1976–2019, with a decrease of 1.87 Gt from 1995–2014 and a gradual recovery since 2014. Yamdrok Lake showed a 0.514 m/y decreasing trend of water-level change from 2004–2009 (Wang et al., 2013). The water volume of the lakes in the other regions increased. The largest increase was in Selin Co. which increased by 2.05 Gt from 1986–1991, 21.29 Gt from 1995–2014, and 1.70 Gt from 2016–2019.
Spatial Distribution Characteristics of Lake Water Volume Changes
According to the time series of the lake water volume changes, the studied 20 lakes can be divided into five categories, they are distributed in different areas: A, B1, B2, C, D, and they have various changes in different periods.
Region A (the southeastern part of the closed lake area) is characterized by rising-falling- inhomogeneous rising (rapid rise-slow rise) and shows a significant increase from 1976–1991, which is followed by a decline from 1991–1995 and a transition from a sharp rise to a slow rise from 1995–2019 (Figure 3A). This is consistent with the conclusion that the lakes in Selin Co. and the surrounding area are in a state of continuous expansion (Li et al., 2011). The overall characteristics of the lake water volume change in region B change from a fall to a rapid rise. According to the degree of overall decline in the first period changes, the area can be divided into two sub-regions: B1 and B2. Region B1 (the northeastern part of the closed lake area) shows an increase in lake water during 1976–1986 and a decrease during the period 1991–1995, while the amount of lake water in region B2 (the central part of the closed lake area) declined from 1976–1995. The lake water in both sub-zones rose rapidly after 1995 (Figures 3B,C). Although the changes in the four lakes of region C (the northwestern part of the closed lake area) were not consistent, all the other three lakes except Bajabuco showed a slow trend of increase. This is because Bajabuco received less water supplies due to its location in a non-glacier meltwater replenishment area with low precipitation in the northwest (Figure 3C). The lake water in region D (southern TP) shows a fluctuating decrease (Figure 3D).
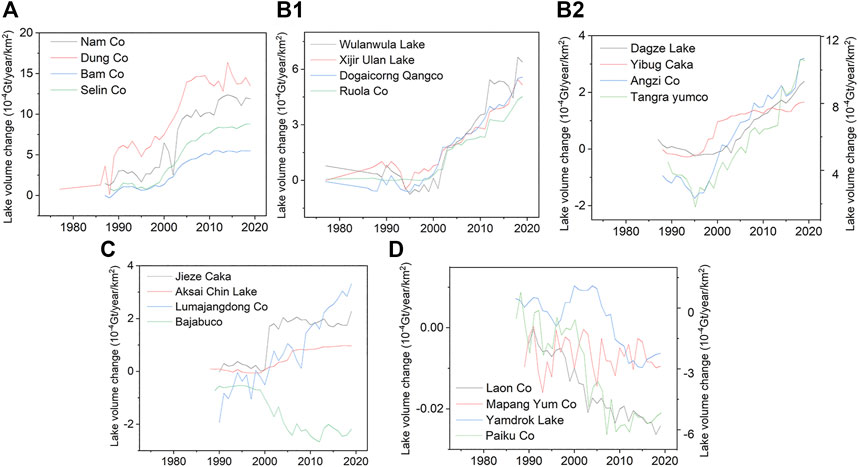
FIGURE 3. Main types of lake volume changes in each district (vertical ordinate is the relative lake volume change, unit is 10−4 Gt/year/km2).
Figure 4 shows the changing features of the AAVCR_B for the 20 studied lakes during the seven periods 1976–1986, 1986–1991, 1991–1995, 1995–2005, 2005–2014, 2014–2016, and 2016–2019. The changes can be divided into three types: rising-falling-inhomogeneous rising, falling-rapid rising, and fluctuating falling. The different types have relatively high spatial concentrations in different regions.
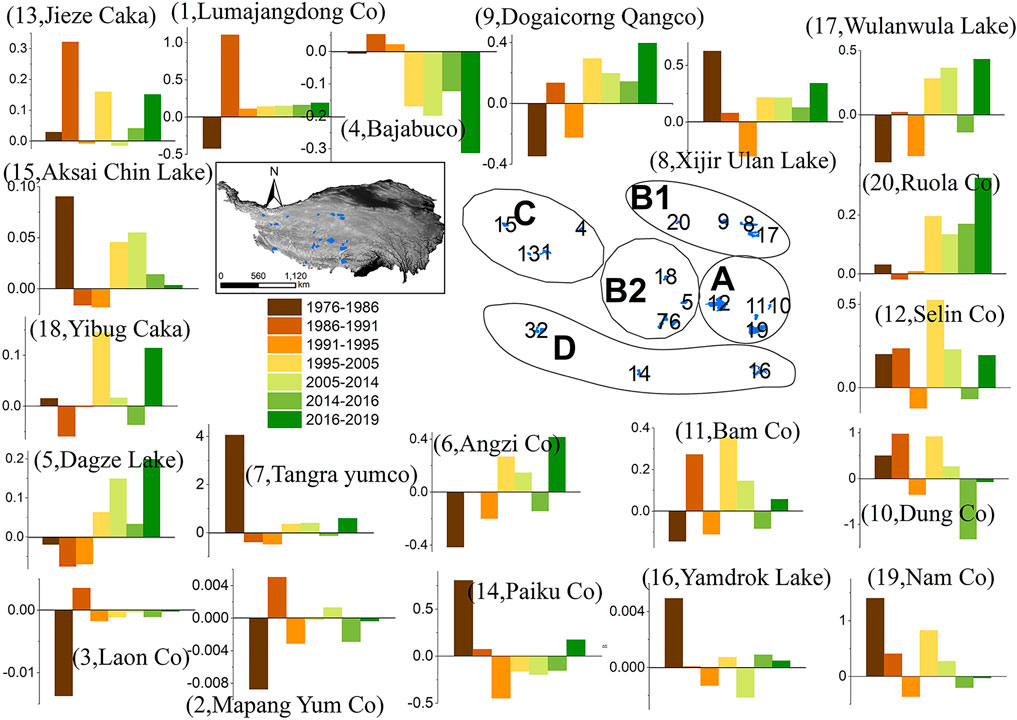
FIGURE 4. Spatial distribution features of AAVCR_B for the 20 studied lakes in different periods during the period 1976–2019.
Table 4 shows the annual average volume change rate per unit basin area of lake water (AAVCR_B) in different regions at different periods. The AAVCR_B of the lake water is higher in the east and lower in the west of the closed lake area of the TP, but the AAVCR_B of lake water in southern Tibet has been decreasing. From 1976–1986, the AAVCR_B decreased in regions B1 and C and increased in regions A, B2, and D. From 1986–1991, the AAVCR_B of most regions continued to increase, except for region B2. From 1991–1995, the AAVCR_B of most regions decreased, except for an increase in region C. From 1995–2005, except for the decrease observed in the AAVCR_B of region D, that of all other regions increased, and region A had the highest AAVCR_B, both in time and region. Although the AAVCR_B in regions A and B1 were highest in all regions during the period 2005–2014, this rate of increase slowed as compared with those in the previous period. During this period, the AAVCR_B in regions C and D decreased. However, the AAVCR_B in regions A and B during the period 2016–2019 indicate a rapid increase in the volume of lake water.

TABLE 4. AAVCR_B of lakes in different regions and periods from 1976 to 2019.
Discussion
Influence of Lake Shape Parameters on Lake Volume Change
Parameters that are associated with the shape of lakes such as area, depth, length, and basin area affect the water volume change within a lake via the amount of surface area that is available for evaporation and the ranges covered by lake water systems. Because the impact that meteorological factors have on lake water replenishment is related to the basin or lake area as well as the absolute or relative changes in the total lake water volume, it is necessary to consider changes in the lake water volume from the perspective of the lake area, lake basin area, and lake replenishment coefficient (basin area/lake area).
As shown in Figure 5, changes in the water volume of a lake are related to both the area of the lake and the lake basin, but no obvious relationship is observed with the lake replenishment coefficient. This shows that the larger the lake area and lake basin area, the more drastic the change in lake water volume. Therefore, when comparing the differences in water volume changes between different lakes, it is necessary to exclude the impact that the lake area and basin area have on lake water volume changes. Here, we used an index to calculate the lake water volume change rate per unit basin area (AAVCR_B, the annual average volume change rate of the lake/basin area), which can be used as an index to compare the different changes in water volume between different lakes in different periods, indicating the speed of the lake water volume change. The larger the value, the faster the volume of water within a lake increases. Conversely, the smaller the value, the slower the increase in the volume of lake water. An overall decrease in lake water volume is represented by a negative value.
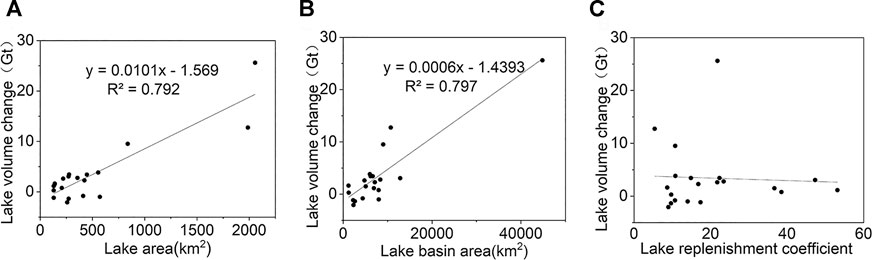
FIGURE 5. Relationship between lake area, basin area, replenishment coefficient and lake volume change. (A) Lake area and lake volume change; (B) lake basin area and lake volume change; and (C) lake replenishment coefficient and lake volume change.
Impact of Climate Change on Lake Changes
Climatic change has a significant impact on the spatial differentiation of changes in the lake water volume on the TP. As one of the most important replenishment sources for lakes, changes in precipitation can significantly affect the water volume change in lakes that are mainly replenished by precipitation (Zhu et al., 2019). On the one hand, temperature changes affect the freezing status of glaciers and permafrost, which leads to changes in the amount of melt water produced by glaciers (Yao et al., 2012) and underground ice in frozen soil (Zhao et al., 2019) that reaches the lakes. On the other hand, rising temperatures will also enhance evaporation and inhibit increases in the amount of lake water (McVicar et al., 2012; Xie et al., 2015). The study area has an arid and semi-arid climate (Yin et al., 2005), but the harsh natural environment of the TP has resulted in little availability of data concerning evaporate and runoff, which limits calculation of the lake water balance. Therefore, trend comparison and partial correlation analysis were used to discuss the possible effects of temperature and precipitation on the changes in lake water volume for both the entire study area and the sub-regions.
Relationship Between Overall Lake Water Volume and Climate Change
From 1986–2018, both the Annual Average Precipitation Anomaly (AAPA) and the Annual Average Temperature Anomaly (AATA) in the lake basins showed basically the same change trend as the AAVC_B (Figures 6A,C), indicating that precipitation and temperature affect the overall changes in the lake water volume in the study area. In terms of time periods, the decrease in precipitation and constant lake water volume were not consistent from 1976–1995 (Figure 6B); however, the rising temperature during that period implies that glacier meltwater was responsible for a large proportion of the lake water replenishment. The increase in both temperature and precipitation from 1995–2014 was consistent with the varying trend in the volume of lake water, indicating that precipitation and glacier meltwater replenishment had a significant impact on the increase in the volume of lake water. This is consistent with the research results of Zhang et al. (2014), they proved the accelerated glacier melt and/or increased difference of precipitation minus evaporation since the 1990s. The precipitation in 2016–2019 decreased compared with that of the previous period; however, both the temperature and the volume of lake water increased, indicating that precipitation had less effect on lake water volume changes (Figures 6B,D). The main reason for the increase in the lake water volume was the production of glacier meltwater as the temperature increased.
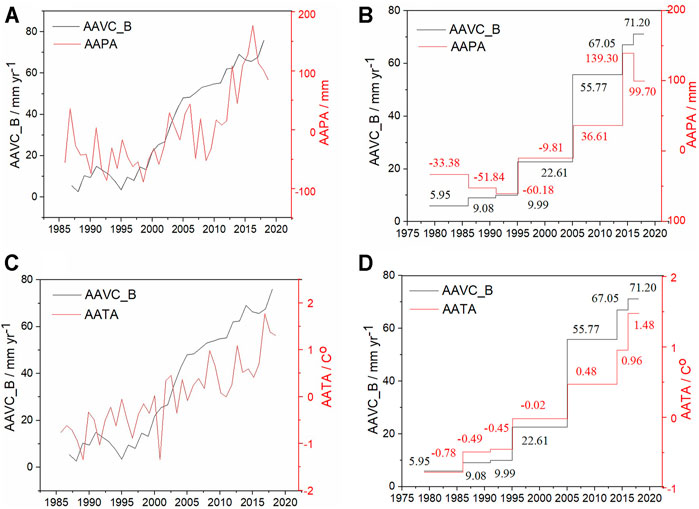
FIGURE 6. (A) Overall changes in lake volume and precipitation; (B) AAVC_B and precipitation change in different periods; (C) Overall changes in lake volume and temperature; (D) AAVC_B and temperature changes during different periods.
Table 5 lists the partial correlation coefficients of the lake water volume to precipitation under temperature control and lake water volume to temperature under precipitation control. It can be seen that both the precipitation and temperature were significantly positively correlated with lake water volume during the entire study period (1979–2018) with partial correlation coefficients of 0.59 and 0.52, respectively, indicating that precipitation was slightly more significant than temperature in promoting the increase in the lake water volume during the entire period. The positive relationship between rising temperature and the increase in lake water volume indicated that the increase in the amount of glacier meltwater offset the evaporation caused by rising temperatures over the entire study area from 1979–2018.
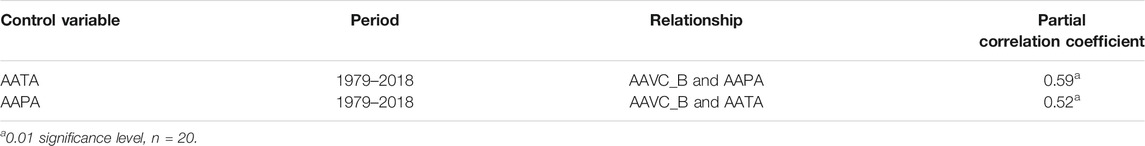
TABLE 5. Relationship between lake volume changes and climate factors. Partial correlation coefficient of AAVC_B and AAPA when the control variable is AATA; Partial correlation coefficient of AAVC_B and AATA when the control variable is AAPA.
Relationship Between the Volume of Lake Water and Climate Change in Each Region
Based on the temporal change features of the overall AAVC_B in the study area, the AAVC_B for the periods 1976–1986, 1986–1991, 1991–1995, 1995–2005, 2005–2014, 2014–2016, and 2016–2018 in the five regions were analyzed to discuss the effect of precipitation and temperature on lake water volume in each region.
Figure 7 shows the variation curves of AAVC_B, AAPA, and AATA in each region. There are also obvious spatial differences in the impact that climate change has had on lake water volume. Precipitation had a greater impact on the changes in lake water volume in the relatively “warm and wet” regions (A and B), whereas variations in temperature that led to glacier melting and evaporation and precipitation jointly affect the changes in lake water volume in the relatively “cold and dry” region (C). No obvious relationship is observed between temperature and precipitation in terms of the lake water volume changes in region D (southern Tibet). It is apparent that while the changes in precipitation and temperature have a significant impact on the overall lake water volume on the TP, there are differences in the degree of impact over different periods and in different regions.
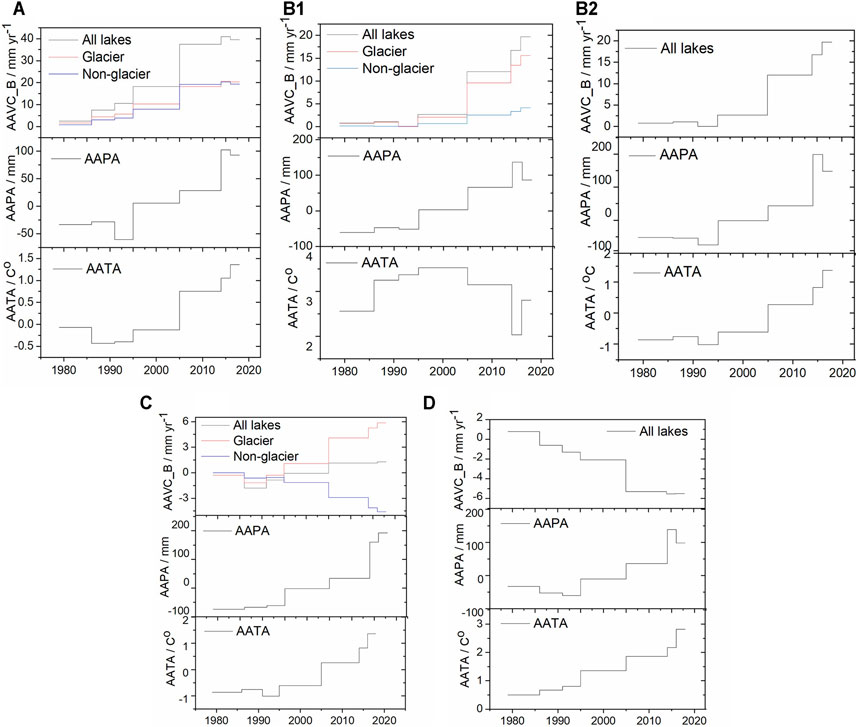
FIGURE 7. Changes in AAVC_B, AAPA and AATA during different periods and in different regions.
Influence of the Type of Replenish on Changes in the Lake Water Volume
Glaciers are distributed in most of the lake basins on the TP (Figure 1) and glacier meltwater is an important source of lake water supply, as indicated by the positive relationships between temperature and lake volume changes. The lack of a quantitative estimation for glacier meltwater in the individual lake basins means that it is difficult to quantitatively evaluate the contribution rate of glacier meltwater and precipitation to lake changes at the watershed scale. Here, only the impact of glacier meltwater on lake water volume from the perspective of the differences in lake basins with or without glacier distribution is discussed.
Comparison of Changes in Lake Water Volume Associated with Different Types of Replenish
There were no glaciers in four of the 20 lake basins studied. The volume of water in these lakes increased by 7.45 Gt between 1976 and 2019, accounting for only 8.85 % of the total increase in the 20 studied lakes. Although the changes in the water volume of lakes without glacier meltwater replenishment contributes little to the total changes in the volume of water in the studied lakes, comparison of the change trends of AAVCR_B for lakes with and without glacier meltwater might indicate the influence of glacier meltwater on changes in lake water volume. In order to determine whether there is a significant difference between the two types of replenished lakes, changes in the AAVCR_B of these lakes were analyzed over seven periods (1976–1986, 1986–1991, 1991–1995, 1995–2005, 2005–2014, 2014–2016, and 2016–2019). The AAVCR_B of two different replenish type lakes in seven periods were used as the 14 attributes with which to perform Principal Component Analysis (PCA). Figure 8 indicates that there are obvious differences in the water volume change of lakes with and without glacier meltwater replenishment over various time periods. From 1986–1991, the water volume of lakes with glacier meltwater decreased, while those without glacier meltwater increased. However, during the period 2014–2016, the change tendency reversed for these two types of lakes; for example, the water volume in lakes fed by glacier meltwater increased and vice versa. During the periods 1976–1986, 1995–2005 and 2005–2014, the water volume in both lakes with and without glacier meltwater increased with differing rates of change. The increase rate in lakes with glacier meltwater was significantly higher than that without replenish by glacier meltwater. This is probably due to the continued temperature increase that resulted in an increase in the amount of glacier meltwater reaching the lakes.
FIGURE 8. (A) PCA analysis results for AAVCR_B with glacier meltwater supplied lakes; (B) PCA analysis results for AAVCR_B with non-glacier meltwater replenished lakes.
Responses of Lakes with Different Replenish Types to Climate
Both glacier meltwater lakes and non-glacier meltwater lakes are found in regions A, B1 and C. Because glacier meltwater is one of the important supply sources that maintain lake water stability, under the same climate background, comparison between the water volume changes of lakes with or without glacier meltwater can be sued to distinguish the different responses of these types of lake to changes in precipitation and temperature.
Figure 8 shows the changing trend of AAVC_B in all lakes and glacier meltwater replenish lakes in different regions. Whether the AAVC_B is lower or higher, the AAVC_B of lakes without glacier meltwater supply in region A is always lower than that of all lakes, indicating that glacier meltwater has a significant impact on the control of lake water changes. In region B, the AAVC_B of lakes with glacier meltwater was similar to that of all lakes during low precipitation periods and lower during high precipitation periods, indicating that glacier meltwater did not affect lake water volume more than precipitation changes. In region C, the AAVC_B of lakes with glacier meltwater was almost the same as that of all lakes, indicating that glacier meltwater exerts an important influence on lake water volume changes. Lei et al. (2017) believed that the rapid expansion of lakes in the north-central and northeastern parts of the TP was mainly affected by the significant increase in summer precipitation, while the rapid expansion of lakes in the northwestern TP was more related to glacier melting and snow during the spring season. Qiao and Zhu (2017) studied the area and water-level changes of 34 lakes in the northwestern TP and found that glacier meltwater was the main factor leading to changes in the lakes of this area. Under the low precipitation conditions that occurred during the period 1991–1995 in regions A and B1, the fluctuations in the water volume of lakes without glacier meltwater were sensitive to changes in precipitation, while lakes with glacier meltwater exhibited weak fluctuations and had low sensitivity to changes in precipitation as a result of the supply of glacier meltwater. Therefore, in the overall situation of lake changes that are dominated by precipitation in the TP, the temporal and spatial characteristics of lake changes may sensitively reflect the difference between the westerlies and Indian monsoon precipitation, while lake changes in some areas are obviously affected by glacier meltwater, indicating that there is a complex mechanism controlling the water cycle that is influenced by both the westerlies and the Indian monsoon (Zhang et al., 2020).
Impact of Regional Correlation on Lake Water Volume Changes
The global autocorrelation method Moran’s I measures spatial autocorrelation by judging whether there is aggregation in a global space and evaluating whether it is clustering, discrete, or random, while the spatial aggregation LISA graph drawn by the local autocorrelation Moran’s I shows where there are aggregations or outliers. Moran’s I statistic of spatial autocorrelation is expressed by:
Where
Regional temperature, precipitation, and lake water volume changes were used as relevant factors to explore the correlation between regional lake water volume changes and different climatic factors, and the statistical results are shown in Figure 9.
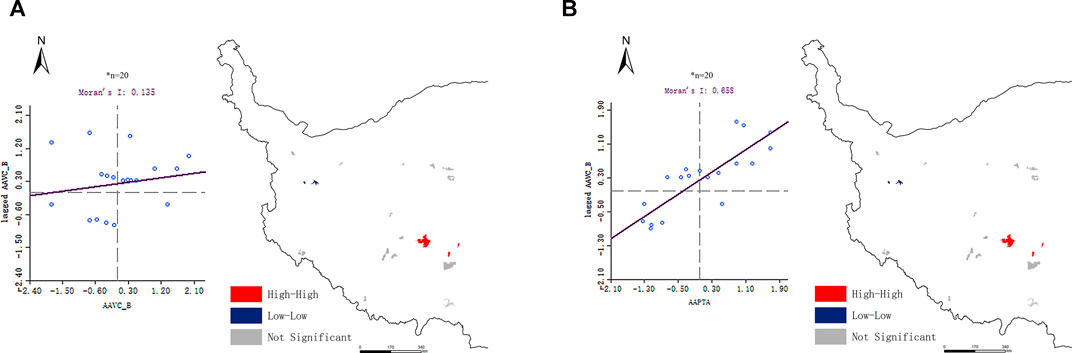
FIGURE 9. Moran’s I index scatter plot and spatial aggregation LISA plot of lake water volume changes and the relationship between climate element changes in the study area. (A) Spatial autocorrelation of regional lake water volume changes; (B) Multivariate spatial correlation of temperature, precipitation, and lake water volume changes.
Figure 9A indicates that the water volume changes in Serlin Co. Dung Co. and Bam Co. have a high-high positive correlation at the 0.05 significance level, indicating that they have same change tendency under high increase conditions. Jieze Caka and Lumajangdong Co. show a low-low positive correlation, indicating that the water volume of lakes in the northwestern TP change in the same manner under conditions of low increase. The multivariable spatial correlation between climate factors and lake water volume changes shows that at a significance level of 0.01 (Figure 9B), the water volume changes and climate elements (temperature, precipitation) of Serlin Co. Dung Co. and Bam Co. are also obviously high-high relative, indicating that both high temperatures and high precipitation promote the increase of lake water volume in the relative “warm and wet” region. This is consistent with the increase in the lake water volume in this region over the past 40 years that has occurred because more water vapor from the Indian Ocean can reach the region. Since the lake water volume in region A is increasing, the three lakes are different from Nam Co. From this, we reasoned that although Nam Co. has also increased, in addition to the increase in water vapor, there may be more contributions to the rise of glacier meltwater. Or maybe the growth of the three lakes is faster or more, and the increase of Nam Co. is slower. The climatic factors (temperature, precipitation) of Lumajangdong Co. and Jieze Caka show a low-low positive correlation with lake water volume changes at a significant level of 0.001, indicating an increase in the volume of lake water under the low precipitation and temperature conditions that prevail in this relative “cold and dry” region. This is also in accordance with the small change observed in the lake water volume in this region during the period 1970–1980s, which showed a decline over the entire study period. This means that the two lakes are mainly affected by water vapor, and Bajabuco and Aksai Chin lake are different from these two lakes. Perhaps they are primarily influenced by the melting water of the merged glacier.
Conclusion
1) The Interannual variation in the lake water volume in the closed lake area of the TP sheds light on their temporal change features and change amplitudes. For the 20 studied lakes in different regions of the TP during 1976–2019, the total lake water volume was basically stable from 1976–1986, increased significantly from 1986–1991, and decreased significantly from 1991–1995. The decrease in water volume during the period 1991–1995 exceeded the increase in water volume that was observed during the previous period, which resulted in a negative balance in the lake water volume. After that, the lake water volume continued to increase significantly from 1995–2019. The lake water volume in 2001 exceeded that in 1991. The highest rate of increase was observed during 1995–2005, and the rate of increase slowed during 2014–2016.
2) The temporal and spatial characteristics of the changes in lake water volume reflect the response of the lake changes to precipitation and temperature in different regions and different periods. In the relatively “warm and wet” southeastern part of the interior closed lake area, precipitation is the dominant factor affecting the change in lake water volume. In the central part of the interior closed lake area, increases in both precipitation and temperature together affect the lake water volume change. In the northwestern part of the interior closed lake area, the climate is relatively “cold and dry”, and the increase in glacier meltwater caused by rising temperatures has a more significant impact on the lake area, leading to water volume change. In the wide valleys and basins between the Gangdise–Nyainqentanglha Mountains and the Himalayas in the southern TP, lake water volume changes have no obvious relationship with temperature and precipitation due to the heterogeneity of the climate, the topography, and replenishment by glacier.
3) The water volume change in lakes with different replenish types can reflect differences in precipitation and temperature. When the temperature is low (such as before 1995), the water volume fluctuations of lakes with glacier meltwater are relatively weak and their sensitivity to precipitation is low; however, the water volume in lakes that are not fed with glacier meltwater decreases significantly. When the temperature rises, lake water volume changes in low-precipitation regions (such as the northwestern part of the interior closed lake area) are more affected by glacier meltwater. Therefore, to accurately evaluate the response process and mechanism of the water cycle in these lakes to the westerlies and Indian monsoon, the various sources that affect the lake water balance require thorough study.
Data Availability Statement
The original contributions presented in the study are included in the article/Supplementary Materials, further inquiries can be directed to the corresponding author.
Author Contributions
LZ designs the research, constructs data analyses and improves the text. SP performs the data extraction and calculations and writes the text. SP and RY develop the methodology.
Funding
This research was supported by the MOST key R & D project (2018YFB0505005), the Second Tibetan Plateau Scientific Expedition and Research (STEP) (2019QZKK0202), NSFC project (41831177) and the CAS Alliance of Field Observation Stations (KFJ-SWYW038).
Conflict of Interest
The authors declare that the research was conducted in the absence of any commercial or financial relationships that could be construed as a potential conflict of interest.
Publisher’s Note
All claims expressed in this article are solely those of the authors and do not necessarily represent those of their affiliated organizations, or those of the publisher, the editors and the reviewers. Any product that may be evaluated in this article, or claim that may be made by its manufacturer, is not guaranteed or endorsed by the publisher.
Acknowledgments
The authors thank editage for improving language during the preparation of this article.
Supplementary Material
The Supplementary Material for this article can be found online at: https://www.frontiersin.org/articles/10.3389/feart.2021.738018/full#supplementary-material
References
Chen, D. L., Xu, B. Q., Yao, T. D., and Guo, Z. (2015). Assessment of Past, Present and Future Environmental Changes on the Tibetan Plateau. Sci. Bull. 60, 3025–3035. doi:10.1360/n972014-01370
Dai, Y., Yao, T., Li, X., and Ping, F. (2018). The Impact of lake Effects on the Temporal and Spatial Distribution of Precipitation in the Nam Co basin, Tibetan Plateau. Quat. Int. 475, 63–69. doi:10.1016/j.quaint.2016.01.075
Fisher, A., Flood, N., and Danaher, T. (2016). Comparing Landsat Water index Methods for Automated Water Classification in Eastern Australia. Remote Sensing Environ. 175, 167–182. doi:10.1016/j.rse.2015.12.055
Guo, W., Xu, J., Liu, S., and Wu, L. (2014). The Second Glacier Inventory Dataset of China. Version 1.0. Lanzhou, China: Cold and Arid Regions Science Data Center at Lanzhou.
He, J., Yang, K., Tang, W., Lu, H., Qin, J., Chen, Y., et al. (2020). The First High-Resolution Meteorological Forcing Dataset for Land Process Studies over China. Sci. Data 7, 25. doi:10.1038/s41597-020-0369-y
Ji, L., Zhang, L., and Wylie, B. (2009). Analysis of Dynamic Thresholds for the Normalized Difference Water index. Photogramm. Eng. Remote Sensing. 75, 1307–1317. doi:10.14358/PERS.75.11.1307
Jiang, H., Feng, M., Zhu, Y., Lu, N., Huang, J., and Xiao, T. (2014). An Automated Method for Extracting Rivers and Lakes from Landsat Imagery. Remote Sensing 6, 5067–5089. doi:10.3390/rs6065067
Junli, L., Sheng, Y. W., Yongwei, S., Jiancheng, L., and Zhanfeng, S. (2011). Remotely Sensed Mapping of Inland lake Area Changes in the Tibetan Plateau. J. Lake Sci. 23, 311–320. doi:10.18307/2011.0301
Kingsford, R., and Wales, N. S. (1997). GIS Database for Wetlands of the Murray-Darling Basin. Murray-Darling Basin Comm.
Lehner, B., Verdin, K., and Jarvis, A. (2006). HydroSHEDS Technical Documentation. Version 1. 0. Washington, DC: World Wildlife Fund US, 1–27.
Lei, Y., Yang, K., Wang, B., Sheng, Y., Bird, B. W., Zhang, G., et al. (2014). Response of Inland lake Dynamics over the Tibetan Plateau to Climate Change. Climatic Change 125, 281–290. doi:10.1007/s10584-014-1175-3
Lei, Y., Yao, T., Yang, K., Sheng, Y., Kleinherenbrink, M., Yi, S., et al. (2017). Lake Seasonality across the Tibetan Plateau and Their Varying Relationship with Regional Mass Changes and Local Hydrology. Geophys. Res. Lett. 44, 892–900. doi:10.1002/2016gl072062
Li, B., and Pan, B. (2002). Progress in Paleogeographic Study of the Tibetan Plateau. Geogr. Res. 21, 61–70. doi:10.11821/yj2002010008
Li, Y., Liao, J., Guo, H., Liu, Z., and Shen, G. (2014). Patterns and Potential Drivers of Dramatic Changes in Tibetan Lakes, 1972-2010. PLOS ONE 9, e111890. doi:10.1371/journal.pone.0111890
McVicar, T. R., Roderick, M. L., Donohue, R. J., Li, L. T., Van Niel, T. G., Thomas, A., et al. (2012). Global Review and Synthesis of Trends in Observed Terrestrial Near-Surface Wind Speeds: Implications for Evaporation. J. Hydrol. 416-417, 182–205. doi:10.1016/j.jhydrol.2011.10.024
Qiao, B., Ju, J., Zhu, L., Chen, H., Kai, J., and Kou, Q. (2021). Improve the Accuracy of Water Storage Estimation-A Case Study from Two Lakes in the Hohxil Region of North Tibetan Plateau. Remote Sensing 13, 293. doi:10.3390/rs13020293
Qiao, B., and Zhu, L. (2019). Difference and Cause Analysis of Water Storage Changes for Glacier-Fed and Non-glacier-fed Lakes on the Tibetan Plateau. Sci. Total Environ. 693, 133399. doi:10.1016/j.scitotenv.2019.07.205
Qiao, B., and Zhu, L. (2017). Differences and Cause Analysis of Changes in Lakes of Different Supply Types in the north-western Tibetan Plateau. Hydrol. Process. 31, 2752–2763. doi:10.1002/hyp.11215
Qiao, B., Zhu, L., and Yang, R. (2019). Temporal-spatial Differences in lake Water Storage Changes and Their Links to Climate Change throughout the Tibetan Plateau. Remote Sensing Environ. 222, 232–243. doi:10.1016/j.rse.2018.12.037
Rundquist, D. C., Lawson, M. P., Queen, L. P., and Cerveny, R. S. (1987). The Relationship between Summer-Season Rainfall Events and Lake-surface Area1. Jawra J. Am. Water Resour. Assoc. 23, 493–508. doi:10.1111/j.1752-1688.1987.tb00828.x
Song, C., Huang, B., and Ke, L. (2013). Modeling and Analysis of lake Water Storage Changes on the Tibetan Plateau Using Multi-mission Satellite Data. Remote Sensing Environ. 135, 25–35. doi:10.1016/j.rse.2013.03.013
Song, C., and Sheng, Y. (2016). Contrasting Evolution Patterns between Glacier-Fed and Non-glacier-fed Lakes in the Tanggula Mountains and Climate Cause Analysis. Climatic Change 135, 493–507. doi:10.1007/s10584-015-1578-9
Song, C., Ye, Q., and Cheng, X. (2015). Shifts in Water-Level Variation of Namco in the central Tibetan Plateau from ICESat and CryoSat-2 Altimetry and Station Observations. Sci. Bull. 60, 1287–1297. doi:10.1007/s11434-015-0826-8
Wan, W., Long, D., Hong, Y., Ma, Y., Yuan, Y., Xiao, P., et al. (2016). A lake Data Set for the Tibetan Plateau from the 1960s, 2005, and 2014. Sci. Data 3, 160039. doi:10.1038/sdata.2016.39
Wang, B., Ma, Y., Su, Z., Wang, Y., and Ma, W. (2020). Quantifying the Evaporation Amounts of 75 High-Elevation Large Dimictic Lakes on the Tibetan Plateau. Sci. Adv. 6, eaay8558. doi:10.1126/sciadv.aay8558
Wang, X., Gong, P., Zhao, Y., Xu, Y., Cheng, X., Niu, Z., et al. (2013). Water-level Changes in China's Large Lakes Determined from ICESat/GLAS Data. Remote Sensing Environ. 132, 131–144. doi:10.1016/j.rse.2013.01.005
Xie, H., Zhu, X., and Yuan, D.-Y. (2015). Pan Evaporation Modelling and Changing Attribution Analysis on the Tibetan Plateau (1970-2012). Hydrol. Process. 29, 2164–2177. doi:10.1002/hyp.10356
Yang, R., Zhu, L., Wang, J., Ju, J., Ma, Q., Turner, F., et al. (2017). Spatiotemporal Variations in Volume of Closed Lakes on the Tibetan Plateau and Their Climatic Responses from 1976 to 2013. Climatic Change 140, 621–633. doi:10.1007/s10584-016-1877-9
Yang, Y., Liu, Y., Zhou, M., Zhang, S., Zhan, W., Sun, C., et al. (2015). Landsat 8 OLI Image Based Terrestrial Water Extraction from Heterogeneous Backgrounds Using a Reflectance Homogenization Approach. Remote Sensing Environ. 171, 14–32. doi:10.1016/j.rse.2015.10.005
Yao, T., Thompson, L., Yang, W., Yu, W., Gao, Y., Guo, X., et al. (2012). Different Glacier Status with Atmospheric Circulations in Tibetan Plateau and Surroundings. Nat. Clim Change 2, 663–667. doi:10.1038/nclimate1580
Yin, Y., Wu, S., Zheng, D., and Yang, Q. (2005). Regional Difference of Aridity/Humidity Conditions Change over China during the Last Thirty Years. Chin.Sci.Bull. 50, 2226–2233. doi:10.1007/bf03182674
Zhang, F. F., Zhang, B., Li, J. S., and Qian, S. (2011). Comparative Analysis of Automatic Water Identification Method Based on Multispectral Remote Sensing. Proced. Environ. Sci. 11, 1482–1487. doi:10.1016/j.proenv.2011.12.223
Zhang, G., Chen, W., and Xie, H. (2019a). Tibetan Plateau's Lake Level and Volume Changes from NASA's ICESat/ICESat‐2 and Landsat Missions. Geophys. Res. Lett. 46, 13107–13118. doi:10.1029/2019GL085032
Zhang, G., Luo, W., Chen, W., and Zheng, G. (2019b). A Robust but Variable lake Expansion on the Tibetan Plateau. Sci. Bull. 64, 1306–1309. doi:10.1016/j.scib.2019.07.018
Zhang, G. Q., Xie, H. J., Yao, T. D., and Kang, S. (2013). Water Balance Estimates of Ten Greatest Lakes in China Using ICE- Sat and Landsat Data. Chin. Sci. Bull. 58 (26), 2664–2678. doi:10.1007/s11434-013-5818-y
Zhang, G., Yao, T., Xie, H., Yang, K., Zhu, L., Shum, C. K., et al. (2020). Response of Tibetan Plateau Lakes to Climate Change: Trends, Patterns, and Mechanisms. Earth-Science Rev. 208, 103269. doi:10.1016/j.earscirev.2020.103269
Zhang, G., Yao, T., Xie, H., Zhang, K., and Zhu, F. (2014). Lakes’ State and Abundance across the Tibetan Plateau. Chin. Sci. Bull. 59, 3010–3021. doi:10.1007/s11434-014-0258-x
Zhao, L., Hu, G. J., Zou, D. F., and Wu, X. (2019). Permafrost Changes and its Effects on Hydrological Processes on Qinghai-Tibet Plateau. Bull. Chin. Acad. Sci. 34, 1233–1246. doi:10.16418/j.issn.1000-3045.2019.11.006
Zhu, L. P., Ju, J. T., Qiao, B. J., and Ju, J. (2019). Recent lake Changes of the Asia Water Tower and Their Climate Response: Progress, Problems and Prospects. Chin. Sci. Bull. 64, 2796–2806. doi:10.1360/TB-2019-0185
Keywords: Tibet Plateau, lake area and water volume, interannual change, climate change, regional differences
Citation: Pang S, Zhu L and Yang R (2021) Interannual Variation in the Area and Water Volume of Lakes in Different Regions of the Tibet Plateau and Their Responses to Climate Change. Front. Earth Sci. 9:738018. doi: 10.3389/feart.2021.738018
Received: 08 July 2021; Accepted: 28 September 2021;
Published: 20 October 2021.
Edited by:
Qiao Liu, Institute of Mountain Hazards and Environment, Chinese Academy of Sciences (CAS), ChinaReviewed by:
Chunqiao Song, Nanjing Institute of Geography and Limnology (CAS), ChinaJuraj Parajka, Vienna University of Technology, Austria
Copyright © 2021 Pang, Zhu and Yang. This is an open-access article distributed under the terms of the Creative Commons Attribution License (CC BY). The use, distribution or reproduction in other forums is permitted, provided the original author(s) and the copyright owner(s) are credited and that the original publication in this journal is cited, in accordance with accepted academic practice. No use, distribution or reproduction is permitted which does not comply with these terms.
*Correspondence: Liping Zhu, bHB6aHVAaXRwY2FzLmFjLmNu