 Heng Li
 Zhao Duan2*
- 1College of Geological Engineering and Surveying, Chang’an University, Xi’an, China
- 2College of Geology and Environment, Xi’an University of Science and Technology, Xi’an, China
The frequency of catastrophic geological disasters has been increasing significantly, causing tremendous losses of life and property. The study of landslide motion remains incomplete. The variables H/L (ratio of landslide height to length) are often used to describe landslide motion; however, they may also be affected by the height of the landslide itself. To better understand landslide dynamics, this paper aimed to 1) identify the process of landslide motion in relation to height; 2) understand the range of influence of sliding bodies according to height; and 3) construct a formula of landslide disaster range based on the travel distance of the slide center and changes in the center and shape of the sliding body. In this paper, medium-fine quartz sand was used in experiments to observe the movement patterns and sliding body barycenter variations occurring during landslides. We describe the changes that occur during landslides and their deposits’ morphological characteristics and barycenter variations with height. Based on these observations, a landslide model is derived. This paper proposes a new method of estimating the effects of landslides, which can help to mitigate the effects of disasters.
Introduction
Due to human activities and global climate change, the frequency of catastrophic geological hazards has increased significantly, causing tragic losses of life and property (Berger, McArdell, and Schlunegger 2011; Zhou, Cui, and Yang 2013; Opiso et al., 2016; Aaron et al., 2017; Duan, Yan, et al., 2021; Yan, Duan, and Sun 2021). A variety of geological hazards are related to the rapid diffusion of particulate matter across complex terrain and basement strata, such as landslides, rock collapses, pyroclastic collapses, debris flows, ice and snow collapses, and pyroclastic flows (Dufresne 2012). There have been many studies on landslide runout distance in recent years. For example, Okura et al. used real-scale outdoor rockfall experiments and associated numerical simulations to illustrate the mechanism by which the amount of rockfall affects its runout distance (Yoichi Okura et al., 2000). They also developed a computer simulation model for the dry and non-viscous flow of granular materials and used this to perform response analysis to quantitatively determine the physical properties of the particles and the effect of slope inclination on the distance traveled (Y Okura, Kitahara, and Sammori 2000). More recently, Zou et al. determined the effects of volume, topography, materials, and triggering factor on landslide mobility from 55 catastrophic historical landslides (Zou et al., 2017). Xu et al. presented a data-driven framework for estimating the potential landslide runout distance (Xu et al., 2019).
In landslide dynamics research, the landslide H-to-L ratio can be used to describe the movement capacity of geological hazards. The smaller the H/L ratio, the stronger a landslide’s movement ability. There are some differences in the names and formulas used to describe this ratio (Scheidegger 1973; Staron 2008; Lucas, Mangeney, and Ampuero 2014; Crosta et al., 2015). It has been referred to as the “Fahrboschung" (Evans and Clague 1994; Geertsema et al., 2006; Hungr 2006), “reach angle" (Scheidegger 1973; Corominas 1996) “effective friction coefficient” (Staron 2008), and “apparent friction coefficient” (Scheidegger 1973; Bouchut et al., 2015; Duan et al., 2020; H. Q.; Yang et al., 2018; Staron 2008; Magnarini et al., 2019; G.; Wang, Sassa, and Fukuoka 2003; Q.; Yang et al., 2011; Legros 2002). By associating H/L with the mass of the sliding body, it has been found that a larger sliding mass body results in a lower H/L and stronger landslide movement ability. However, the influences of H on the H/L ratio and on landslide movement ability have not been systematically studied under the condition that the landslide mass remains unchanged.
Experiments can help to understand the movement mechanism involved in particle flows and have been widely used in research on the movement of geological hazards in recent years. They can also evaluate relevant physical parameters to improve slip distance predictions and verify numerical models (Duan et al., 2020; Iverson, George, and Logan 2016; Ng et al., 2017; H. Q. Yang et al., 2018; Y.-F. Wang et al., 2016). Some experimental studies have focused on the geometry of geohazard deposits in complex geological conditions (Kim et al., 2020; Crosta et al., 2017; Ng et al., 2017; Crosta et al., 2015). For example, Crosta et al. (Crosta et al., 2015; 2017) focused on a landslide collapsing onto an erodible layer or shallow water. Ng et al. (Ng et al., 2017) established a discrete element model to explore the interaction between dry granular flow and rigid barrier deflectors. Pudasaini and Jaboyedoff presented a general analytical model for superelevation in landslide (Pudasaini and Jaboyedoff 2020). Many experimental studies considered the relationship between runout distance and the volume of sliding body. There are still few studies on the variation process of length, width and height of the sliding body.
This article aims to experimentally investigating the displacement and deformation of sliding body during the whole motion. To better understand landslide dynamics, this paper focuses on the following research objectives: 1) to reveal the evolution of length, width and height of sliding bodies at different landslide heights; and 2) to construct a landslide length prediction formula.
Methods and Materials
Slip Sand Experiment
In this paper, changes in the sliding body’s motion pattern and center of gravity during a landslide were studied via a slip sand experiment. As shown in Figure 1, the experimental apparatus consisted of a sandbox, slanted plate, horizontal plate, high-speed camera, and three-dimensional scanner. The sandbox, slanted plate, and horizontal plate were made of Plexiglas. The slanted and horizontal plates had the same dimensions of 1.5 m length and 1.2 m width. The slanted plate could be connected to the horizontal plate at any angle using a bracket. There were two grooves on the slanted plate for fixing the sandbox at any position via screws. The sandbox’s inner dimensions were 300 mm in length, 150 mm in width, and 120 mm in height. The sandbox was filled from the top with sand and sealed with a breathable cover plate. The bottom of the sandbox featured a swing door with a switch set at the front of the sandbox. When the spring door switch was triggered, the door opened within 0.25 s and the sand in the box would slide out freely without boundary constraint. The millimeter-level 3D dynamic scanner recorded images at 120 frames/s, extracted key point coordinates at eight frames/s, and collected digital elevation model data and positional and morphological data during movement of the sliding body.
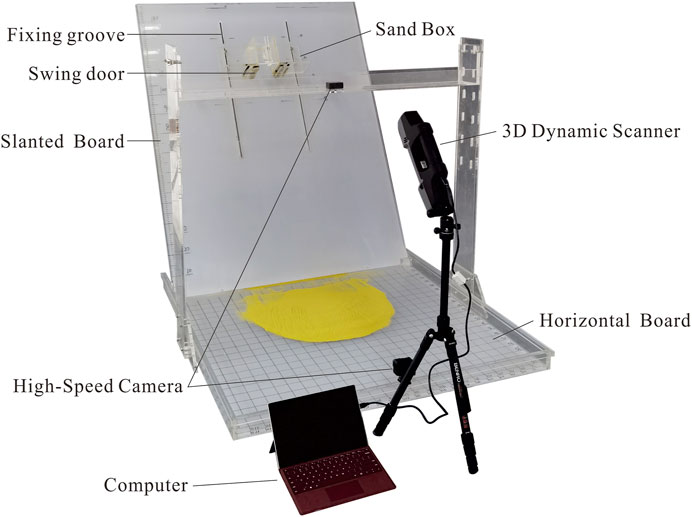
FIGURE 1. Experimental apparatus.
Landslide distance is a very complex problem due to the influence of many factors. In order to better clarify the influence of landslide height on landslide runout distance, this paper unified the variables like angle of the landslide and mechanical strength of the soil, simplified the sliding surface, the geomorphology, and ignored the influence of factors like rainfall (water content changes), and earthquake (dynamic loading). This highlighted the effect of landslide height changes on the evolution of the sliding body’s length, width, height and barycenter. Most of the landslide angles ranged from 20° to 60°. Smaller landslide angles can lead to a lack of differentiation in landslide heights. In this paper, a larger landslide angle is selected in order to better demonstrate the difference in height. Therefore, the angle of the slanted plate used in this experiment was set to 60°. The volume of the sand body was 5.4 × 103 cm3. The initial heights of the trailing edge of the sandbox (H) were 65, 70, 75, 80, 85, 90, 95, 100, 105, and 110 cm. The experiment was carried out according to the following steps: 1) Fill the sandbox with 5.4 × 103 cm3 of sand; 2) turn on the high-speed camera and 3D dynamic scanner; 3) trigger the sandbox swing door and let the sand slide down freely; and 4) analyze the motion pattern of the sliding body.
Properties of Sand Samples
Medium-to-fine quartz sand was used as the sliding material because its flow characteristics are similar to those of natural flowslides. This type of sand is widely used in indoor landslide simulation experiments (Viroulet et al., 2013; Crosta et al., 2015), (Figure 2A). Its dry density was 1.5 g/cm3, its non-uniformity coefficient Cu was 2.39, and its curvature coefficient Cc was 1.19. The average diameter of sand particles was 0.2 mm and the specific surface area was 0.02 m2kg−4. The cumulative particle size percentage was 87.71% in the range of 0.075–0.5 mm. The internal friction angle φ was 33.86° and the cohesion C was 13.56. Particle size curves are shown in Figure 2B.
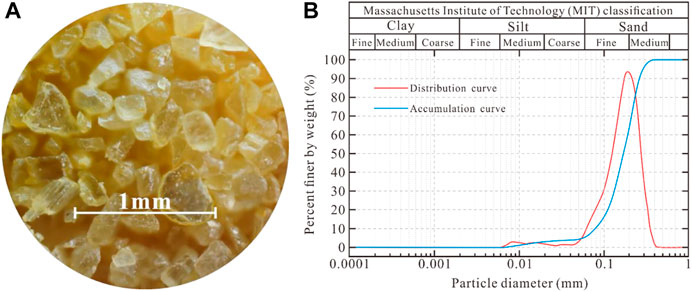
FIGURE 2. (A) Experimental material and (B) particle-size distribution and accumulation curves.
In this experiment, the friction coefficient between the sand and the slanted plate was tested by an improved direct shear test. This test is modified from the direct shear test by replacing the soil that would normally under the shear surface with Plexiglas. It is necessary to ensure frictional movement of the sand along the surface of the Plexiglas during shear. After graded pressurized shearing, the friction coefficient between the sand body and Plexiglas was measured to be 0.474.
Typical Movement Process
The whole landslide process was recorded by a high-speed camera and 3D scanner. Reverse modeling was carried out to restore the whole landslide process from the 3D scanner data. In the experiment, the landslide movement process was similar and the morphological changes in the sliding body were similar at different heights. Taking H = 110 cm as an example, the whole sliding process can be divided into two stages, as shown in Figure 3.
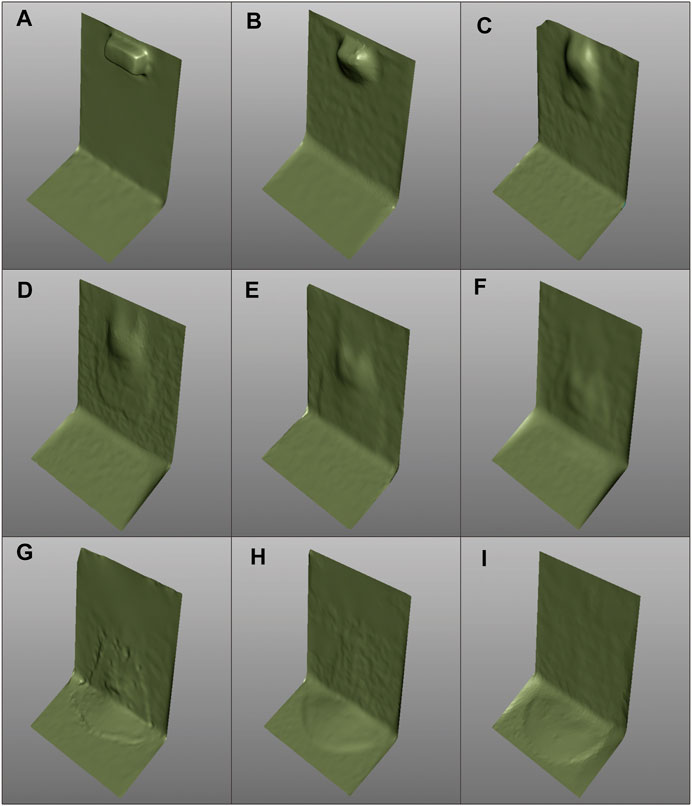
FIGURE 3. Sliding process diagram.
The first stage is the movement of the sliding body from the initial position to the point where the tip of the sliding body is in contact with the horizontal plate, a process that lasts about 500 ms. (Figure 3A–E). The slide exited the sandbox and moved along the slanted plate (A, B), during which time the slide unfolded first in the moving direction and thus formed an overall elongated shape with a wide front and narrow back (C-E). This may be the result of the unfolding occurring first in the sliding body directly adjacent to the slanted plate part and then gradually transferring to the area away from the slanted plate. The upper sliding body largely maintained its original form and remained in the rear position of the whole sliding body (this part eventually became the peak of the deposit).
The second stage was from the time when the tip of the slide contacted the horizontal plate to the time the end of the slide completely fell, and lasted about 500 ms (Figure 3F–I). When the tip of the sliding body contacted the horizontal plate, its spreading speed decreased significantly. Meanwhile, the sliding body at the slanted plate was still in the process of expansion; therefore, the overall length of the sliding body was in a state of slow elongation (F, G). At the same time, the part that maintained its original shape in the slanted plate stage also began to move towards the front of the sliding body and gradually expanded. When this part of the slide reached the plate, there was only a thin layer of residual slide (H) on the slanted plate. When this thin layer completely slid off, the whole slide stopped and the sliding process was complete (I).
The lower the landslide height H, the shorter the whole sliding process and the smaller the impact range of the whole landslide. The differences in landslide length, width, height, and center of gravity from different drop heights will be discussed in detail later. For the convenience of discussion, a diagram of the landslide process’s variables is shown in Figure 4.
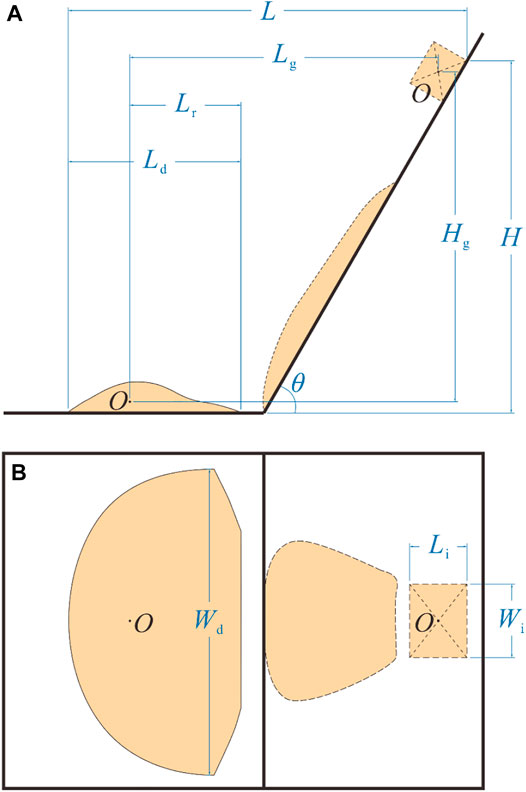
FIGURE 4. Diagram of the variables involved in the landslide process (A) Profile (B) Planform.
Results
Length of Sliding Body
Figure 5 shows the variation in sliding body length with drop height.
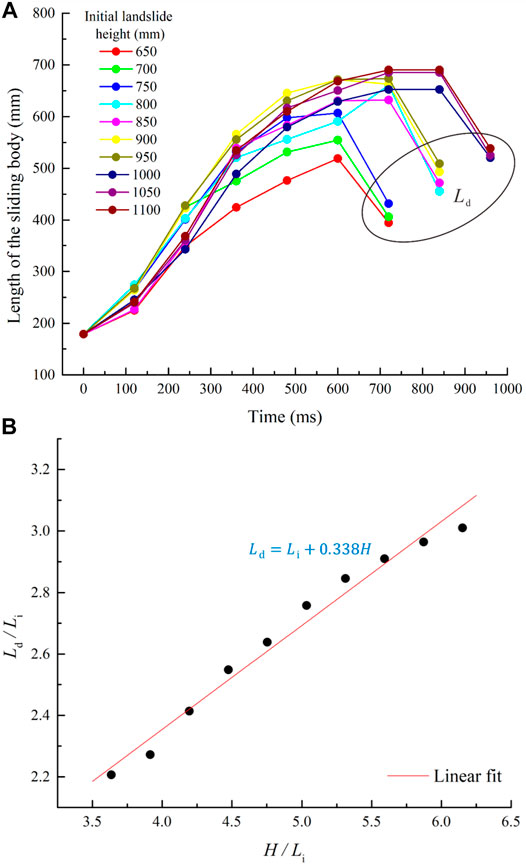
FIGURE 5. (A) Variation in sliding body length during the landslide process and (B) lengths of deposits.
The curves of sliding body length with drop height are generally similar (Figure 5A). According to the two stages defined in Typical movement process, the length of the sliding body increases rapidly in the first stage, then grows slowly and shrinking rapidly in the second stage. The variations in sliding body length between different initial landslide heights are not significant in the first stage. In the second stage, differences in sliding body length began to appear; the length peaked after a slow increase, then narrowed as it rapidly shortened.
By carefully observing the changes in the morphology of the sliding body throughout the landslide process, it was found that the reason for the change in sliding body length is that the tip of the slide advances rapidly in the first stage. Meanwhile, the trailing end of the slide advances slowly due to the unfolding of the bottom of the sliding body. When the landslide process enters the second stage, the tip of the sliding body impacts the bottom plate and slows down the landslide’s advance due to energy loss, but it still advances slightly faster than the trailing end of the sliding body. The length of the sliding body, therefore, increases slowly. When most of the slide reaches the flat plate, the sliding body remaining on the sloping plate is thin. At this time, the back end of the sliding body falls rapidly, the length of the sliding body therefore rapid shortening.
Figure 5B shows that the higher the initial height, the longer the final sliding body length. The final length of the sliding body can be expressed as:
According to Eq. 1, the final length of the sliding body changes with the initial length, which is a linear increasing function starting from the initial length
Width of Sliding Body
Figure 6A shows the variation in sliding body width with drop height.
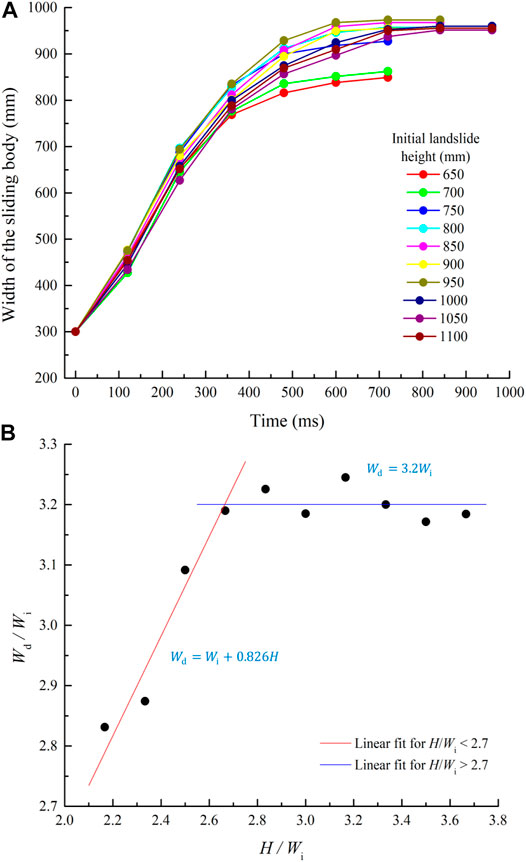
FIGURE 6. (A) Variation in sliding body width during the landslide process and (B) widths of deposits.
The curves of the variations in sliding body width are generally similar. In the first stage of sliding, the sliding body width increases linearly and rapidly, and is relatively unaffected by the initial height. The sliding body width tends to maintain a constant value in the second stage and shows some variation with initial height.
The final sliding body widths at different initial heights are shown in Figure 6B and :
Equation 2 is a piecewise function with significantly different values before and after the cut-off point
Height of Sliding Body
The variations in sliding body height over time from different initial heights are shown in Figure 7.
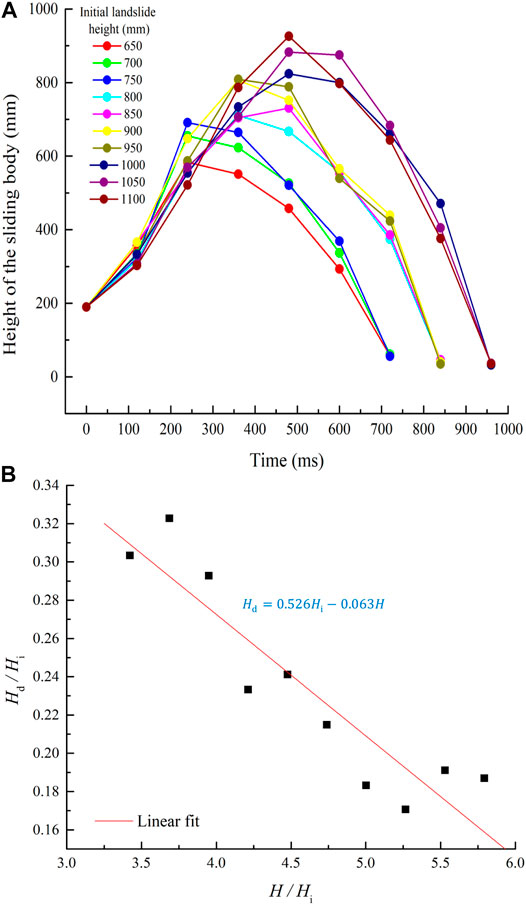
FIGURE 7. (A) Variation in sliding body height during the landslide process and (B) height of deposits.
Figure 7A compares the variations in sliding body height during the process of landslides from different initial heights. The curves have similar shapes. As with the change in length of the sliding body, the height increases rapidly in the first stage, decreases slowly, and then decreases rapidly in the second stage. The sliding body height variation with initial height was not significant in the first stage. However, variation starts to appear in the second stage, reaches a maximum after some slow growth. The final height of the shortened sliding body is significantly less than the initial height of the sliding body.
As shown in Figure 7B, The equation for the final height of the sliding body is:
Barycenter of Sliding Body
The barycenter of a landslide varies mainly in the sliding direction and little in the lateral direction. So, only changes in the center of gravity in the sliding direction are discussed. The aspect ratio
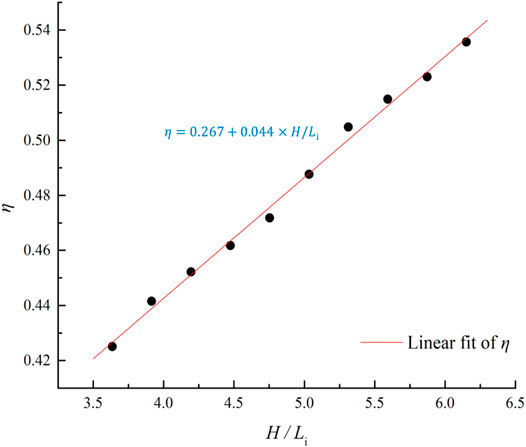
FIGURE 8. Plot of position of the sliding body barycenter
As shown in Figure 8,
The growth in
Discussion
Variation of Sliding Body
It can be seen from Figures 5–7 that the sliding body undergoes a process of growth followed by decrease in the length and height directions, which is due to the change in the force state of the sliding body when it contacts the horizontal board. As a result of the change in the direction of support and frictional resistance, the sliding body is more impeded in the direction of falling and forward direction. The sliding body consequently starts to shorten in length and height from a stretched state and gradually stops the motion. The magnitude of the friction coefficient in this process and its effects on the landslide height to length ratio will be discussed in the next section.
Unlike the variation in the length and height of the sliding body, the width gradually remains stable after an apparent increase. The sliding body is not subjected to external forces in the width direction during the whole process. The reason for its growth in the width direction is due to the shear stresses generated by the compression when gravity and support forces act on the sliding body. Meanwhile, because the sliding body is not subjected to external forces in the width direction throughout, the sliding body does not show significant shortening in this direction. Despite the fact that the changing regularity of the sliding body in width differs from that in length and height, the time point at which it tends to flatten out is consistent with the time point at which the length and height of the sliding body shorten.
Effective Friction Coefficient μ
In order to analyze the effective friction coefficient μ on the sliding surface, force analysis was carried out on the sliding body. The force analysis diagram is shown in Figure 9.
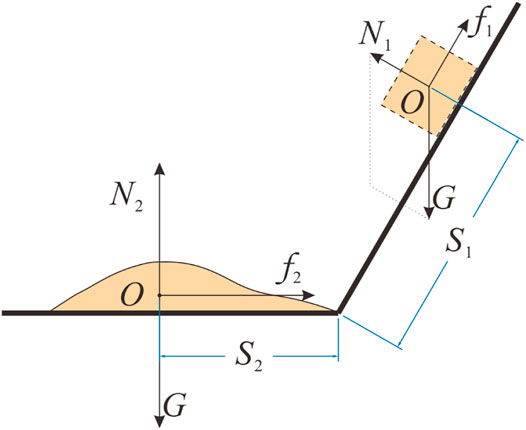
FIGURE 9. Force analysis of the experimental landslide.
In the sliding stage, the sand body always moves along the direction of the slanted plate, so the resultant force it receives in the vertical direction of the slanted plate is zero, then:
The combined force along the slanted plate is the component force of gravity in that direction and the friction between the slanted plate and the sliding body. So, in the direction of the slanted plate, there is:
The value of the frictional force is equal to the product of the friction coefficient
Since the size of the friction force is only related to the roughness of the contact surface and not to the contact area, and since the total gravity of the sliding body and the force between the sliding body and plate do not change during the landslide process, the total friction force between the sliding body and Plexiglas plate does not change during the landslide process.
By substituting Eqs 5, 7 into Eq. 6, we can obtain:
When the sliding body reaches the bottom and slides horizontally, the resultant force on the sand body in the vertical direction of the plate is zero and the force on the plate is the friction force
Combining Eqs 9–11, we can obtain:
When the sliding body reaches the plate, according to the law of conservation of energy:
At the moment when the sliding body hits the plate, it satisfies the momentum theorem in the vertical direction. The instantaneous impulse transfer process involves the energy loss as the sliding body hits the plate. The energy lost in the process is:
Substituting Eq. 13 into Eq. 14, we can obtain:
At the moment when the sliding body impacts the plate, in addition to the impact energy loss, there is also some energy loss due to an increase in horizontal friction due to increased impact pressure. Although the impact force is usually large, this part of the energy is very small compared with the energy loss of vertical impact because this time period is less than 0.02 s, and the sliding distance of the sliding body is also limited. Therefore, this component of energy loss is ignored.
According to the conservation of energy during the whole landslide process:
Combining Eqs 8, 12, 15–17 can be obtained after simplification:
In this study, the volume of the sliding body, the initial shape of the sliding body, and the morphological characteristics of the sliding surface were all the same, therefore the errors caused by these factors were eliminated in the experiment. Therefore, the H/L, Hg/Lg and μ values were more stable than those obtained from real landslides. Figure 10 shows the H/L, Hg/Lg, and μ curves calculated from Eq. 18 for different values of H.
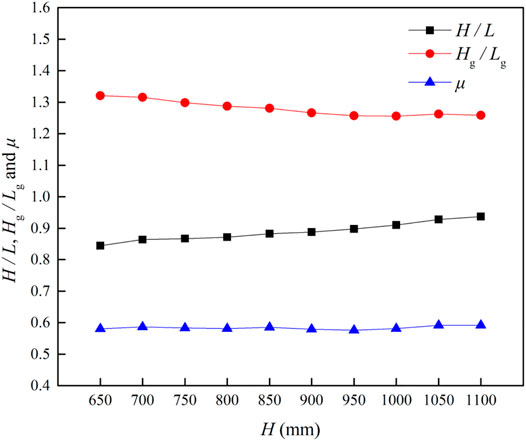
FIGURE 10. Variations in H/L, Hg/Lg, and μ with H.
As can be seen from Figure 10, the value of H/L increases slowly with H. In contrast, Hg/Lg decreases slowly with increases in H. Only μ is relatively stable in relation to H. According to the direct shear test described in Properties of sand samples, the friction coefficient between the sliding body and slanted plate was 0.474, which is also closer to
Range of Landslide
The range of a landslide in the length direction is usually described in terms of the overall landslide length
In Eq. 18, the first term is the projection of the slope of the landslide, the second term is the movement distance of the barycenter in the horizontal stage, and the third term is the distance between the barycenter and the toe of the sliding body.
The displacement equation of the center of gravity at the plate stage can be derived from Eq. 17:
In Eq. 18,
The landslide’s range of influence in the width direction is equivalent to the final width of the landslide body, as described by Eq. 2. It is meaningful to study the change in width of the landslide body, because width and length changes are both important parts of the impact range. In some areas threatened by geological hazards such as landslides and collapses, residents need to be relocated. The width of the landslide is an important factor determining the number of residents to be relocated.
The range of the landslide in the height direction is shown by Eq. 3. Because the scope of a landslide hazard is usually only determined by the length and width while the height has little influence, there are few studies on this aspect.
Although the volume of the sliding body
Comparison With Previous Studies
Many studies have included a variety of experimental as well as real landslide statistics. However, because the formulae in this research require many parameters that have received less attention, the statistics in many of the relevant papers are difficult to compare with the results in this paper. For example, Johnson (Johnson and Campbell 2017) focused on the relationship between slide volume and H/L in his paper, while the initial shape of the sliding body and the slide angle were not described in detail. Lucas (Lucas et al., 2011; Lucas, Mangeney, and Ampuero 2014) provided a summary of geomorphic data for large Martian landslides, but the values of the landslide slope in his research are mostly situated between 5 and 30°, which deviates significantly from the 60° in this paper. After screening the data from multiple papers, the actual landslide data from Duan’s research (Duan, Cheng, et al., 2021) and the experimental data from Crosta’s research (Crosta et al., 2017) are finally selected to compare with the results from this paper, as shown in Table 1.
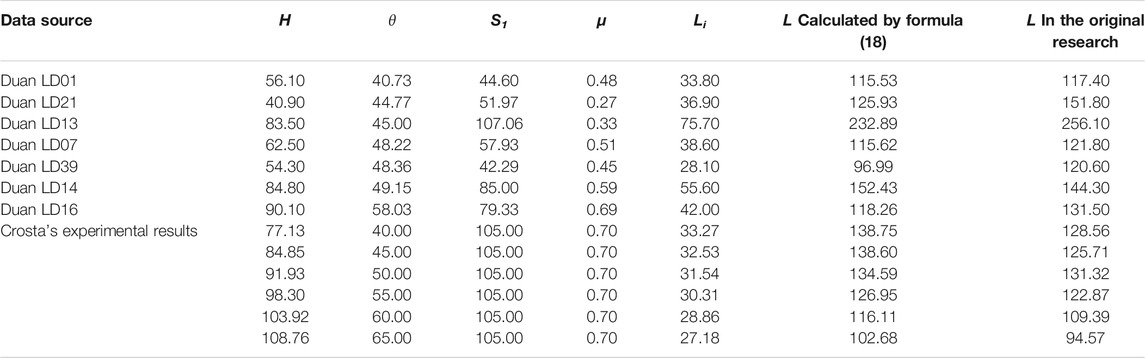
TABLE 1. Summary of properties for the landslides from reality and experiments.
It should be noted that only data for landslides with slope angles between 40 and 80° are presented, because excessive angle differences can make the comparison meaningless. To make the data applicable to Eq. 18, the value of μ are approximately use the value of H/L, and the values of and S1 in Duan’s article (Duan, Cheng, et al., 2021) was calculated by the following approximate equations:
Since Crosta et al.'s data H,
Conclusion
Through a series of experiments, this paper studied the movement of landslides of different heights, deformation of the sliding bodyand the movement distance of the barycenter. We proposed an equation describing the landslide range, which are helpful to understand the movement of some landslides. Based on the experimental observations, results, and analysis, the main conclusions are as follows:
1) In the experiment, the movement processes of landslides with different initial heights were found to be similar, as were the morphological changes in the landslide body. The whole landslide process took about 1,000 ms. The lower the landslide height, the shorter the duration of the whole sliding process and the smaller the landslide impact area. During the process of landslide, the length of the sliding body increases linearly from its initial length; the width of the sliding body is gradually maintained after growth; the height of the sliding body decreases with increases in landslide height.
2) The barycenter of the sliding body pushes toward the front of the slide as the height of the slide increases; however, determination of the barycenter’s location in the final sliding body needs further study for cases of
3) The length of a landslide can be estimated by Eq. 18 in this paper. The landslide length prediction equation proposed in this paper is closer to the actual landslide distance at about 60°, but the validation data that the authors found are still insufficient, and more cases are necessary to support the formula in the future.
Data Availability Statement
The raw data supporting the conclusions of this article will be made available by the authors, without undue reservation.
Author Contributions
Experiments: HL, YW, and CD. Drafting the paper: HL. Make important revisions to the paper: ZD and FZ. For approval to the final version of the paper: ZD.
Funding
This study would not have been possible without financial support from the Special Fund for the National Natural Science Foundation of China under Grant nos. 41790442, 41702298 and 41602359, as well as the Project Supported by Natural Science Basic Research Plan in Shaanxi Province of China under Grant no. 2017JQ4020.
Conflict of Interest
The authors declare that the research was conducted in the absence of any commercial or financial relationships that could be construed as a potential conflict of interest.
Publisher’s Note
All claims expressed in this article are solely those of the authors and do not necessarily represent those of their affiliated organizations, or those of the publisher, the editors and the reviewers. Any product that may be evaluated in this article, or claim that may be made by its manufacturer, is not guaranteed or endorsed by the publisher.
Abbreviations
References
Aaron, J., Hungr, O., Stark, T. D., and Baghdady, A. K. (2017). Oso, Washington, Landslide of March 22, 2014: Dynamic Analysis. J. Geotech. Geoenviron. Eng. 143 (9), 05017005. doi:10.1061/(ASCE)GT.1943-5606.0001748
Berger, C., McArdell, B. W., and Schlunegger, F. (2011). Direct Measurement of Channel Erosion by Debris Flows, Illgraben, Switzerland. J. Geophys. Res. 116 (F01002), a–n. doi:10.1029/2010JF001722
Bouchut, F., Fernández-Nieto, E. D., Mangeney, A., and Narbona-Reina, G. (2015). A Two-phase Shallow Debris Flow Model with Energy Balance. Esaim: M2an 49 (1), 101–140. doi:10.1051/m2an/2014026
Corominas, J. (1996). The Angle of Reach as a Mobility Index for Small and Large Landslides. Can. Geotech. J. 33 (2), 260–271. doi:10.1139/t96-005
Crosta, G. B., De Blasio, F. V., De Caro, M., Volpi, G., Imposimato, S., and Roddeman, D. (2017). Modes of Propagation and Deposition of Granular Flows onto an Erodible Substrate: Experimental, Analytical, and Numerical Study. Landslides 14 (1), 47–68. doi:10.1007/s10346-016-0697-3
Crosta, G. B., De Blasio, F. V., Locatelli, M., Imposimato, S., and Roddeman, D. (2015). Landslides Falling onto a Shallow Erodible Substrate or Water Layer: An Experimental and Numerical Approach. IOP Conf. Ser. Earth Environ. Sci. 26 (1), 012004. doi:10.1088/1755-1315/26/1/012004
Crosta, G. B., Imposimato, S., and Roddeman, D. (2009). Numerical Modeling of 2-D Granular Step Collapse on Erodible and Nonerodible Surface. J. Geophys. Res. 114 (F3), F03020. doi:10.1029/2008JF001186
Duan, Z., Cheng, W.-C., Peng, J.-B., Rahman, M. M., and Tang, H. (2021). Interactions of Landslide Deposit with Terrace Sediments: Perspectives from Velocity of Deposit Movement and Apparent Friction Angle. Eng. Geology 280, 105913. doi:10.1016/j.enggeo.2020.105913
Duan, Z., Wu, Y.-B., Tang, H., Ma, J.-Q., and Zhu, X.-H. (2020). An Analysis of Factors Affecting Flowslide Deposit Morphology Using Taguchi Method. Adv. Civil Eng. 2020, 1–14. doi:10.1155/2020/8844722
Duan, Z., Yan, X., Sun, Q., Tan, X., and Dong, C. (2021). Effects of Water Content and Salt Content on Electrical Resistivity of Loess. Environ. Earth Sci. 80 (14), 469. doi:10.1007/s12665-021-09769-2
Dufresne, A. (2012). Granular Flow Experiments on the Interaction with Stationary Runout Path Materials and Comparison to Rock Avalanche Events. Earth Surf. Process. Landforms 37 (14), 1527–1541. doi:10.1002/esp.3296
Evans, S. G., and Clague, J. J. (1994). Recent Climatic Change and Catastrophic Geomorphic Processes in Mountain Environments. Geomorphology 10 (1–4), 107–128. doi:10.1016/b978-0-444-82012-9.50012-8
Geertsema, M., Clague, J. J., Schwab, J. W., and Evans, S. G. (2006). An Overview of Recent Large Catastrophic Landslides in Northern British Columbia, Canada. Eng. Geology 83 (1–3), 120–143. doi:10.1016/j.enggeo.2005.06.028
Hungr, O. (2006). Rock Avalanche Occurrence, Process and Modelling. Dordrecht, Netherlands: Landslides from Massive Rock Slope Failure, 243–266. doi:10.1007/978-1-4020-4037-5_14
Iverson, R. M., George, D. L., and Logan, M. (2016). Debris Flow Runup on Vertical Barriers and Adverse Slopes. J. Geophys. Res. Earth Surf. 121 (12), 2333–2357. doi:10.1002/2016JF003933
Johnson, B. C., and Campbell., C. S. (2017). Drop Height and Volume Control the Mobility of Long‐Runout Landslides on the Earth and Mars. Geophys. Res. Lett. 44 (24), 12,091–12,097. doi:10.1002/2017GL076113
Kim, G.-B., Cheng, W., Sunny, R. C., Horrillo, J. J., McFall, B. C., Mohammed, F., et al. (2020). Three Dimensional Landslide Generated Tsunamis: Numerical and Physical Model Comparisons. Landslides 17 (5), 1145–1161. doi:10.1007/s10346-019-01308-2
Legros, François. (2002). The Mobility of Long-Runout Landslides. Eng. Geology 63 (3–4), 301–331. doi:10.1016/S0013-7952(01)00090-4
Lucas, A., Mangeney, A., and Ampuero, J. P. (2014). Frictional Velocity-Weakening in Landslides on Earth and on Other Planetary Bodies. Nat. Commun. 5 (1), 3417. doi:10.1038/ncomms4417
Lucas, A., Mangeney, A., Mège, D., and Bouchut, F. (2011). Influence of the Scar Geometry on Landslide Dynamics and Deposits: Application to Martian Landslides. J. Geophys. Res. 116 (E10), E10001. doi:10.1029/2011JE003803
Magnarini, G., Mitchell, T. M., Grindrod, P. M., Goren, L., and Schmitt, H. H. (2019). Longitudinal Ridges Imparted by High-Speed Granular Flow Mechanisms in Martian Landslides. Nat. Commun. 10 (1), 4711. doi:10.1038/s41467-019-12734-0
Ng, C. W. W., Choi, C. E., Goodwin, G. R., and Cheung, W. W. (2017). Interaction between Dry Granular Flow and Deflectors. Landslides 14 (4), 1375–1387. doi:10.1007/s10346-016-0794-3
Okura, Y., Kitahara, H., and Sammori, T. (2000). Fluidization in Dry Landslides. Eng. Geology 56 (3–4), 347–360. doi:10.1016/S0013-7952(99)00118-0
Okura, Y., Kitahara, H., Sammori, T., and Kawanami, A. (2000). The Effects of Rockfall Volume on Runout Distance. Eng. Geology 58 (2), 109–124. doi:10.1016/S0013-7952(00)00049-1
Opiso, E. M., Puno, G. R., Alburo, J. L. P., and au, A. L. (2016). Landslide Susceptibility Mapping Using GIS and FR Method along the Cagayan de Oro-Bukidnon-Davao City Route Corridor, Philippines. KSCE J. Civ Eng. 20 (6), 2506–2512. doi:10.1007/s12205-015-0182-x
Phillips, J., Hogg, A., Kerswell, R., and Thomas, N. (2006). Enhanced Mobility of Granular Mixtures of Fine and Coarse Particles. Earth Planet. Sci. Lett. 246 (3), 466–480. doi:10.1016/j.epsl.2006.04.007
Pudasaini, S. P., and Jaboyedoff, M. (2020). A General Analytical Model for Superelevation in Landslide. Landslides 17 (6), 1377–1392. doi:10.1007/s10346-019-01333-1
Scheidegger, A. E. (1973). On the Prediction of the Reach and Velocity of Catastrophic Landslides. Rock Mech. 5 (4), 231–236. doi:10.1007/BF01301796
Staron, L. (2008). Mobility of Long-Runout Rock Flows: A Discrete Numerical Investigation. Geophys. J. Int. 172 (1), 455–463. doi:10.1111/j.1365-246X.2007.03631.x
Viroulet, S., Sauret, A., Kimmoun, O., and Kharif, C. (2013). Granular Collapse into Water: Toward Tsunami Landslides. J. Vis. 16 (3), 189–191. doi:10.1007/s12650-013-0171-4
Wang, Gonghui., Sassa, Kyoji., and Fukuoka, Hiroshi. (2003). “Downslope Volume Enlargement of a Debris Slide–Debris Flow in the 1999 Hiroshima, Japan, Rainstorm. Eng. Geology 69 (3–4), 309–330. doi:10.1016/S0013-7952(02)00289-2
Wang, Y.-F., Xu, Q., Cheng, Q.-G., Li, Y., and Luo, Z.-X. (2016). Spreading and Deposit Characteristics of a Rapid Dry Granular Avalanche across 3D Topography: Experimental Study. Rock Mech. Rock Eng. 49 (11), 4349–4370. doi:10.1007/s00603-016-1052-7
Xu, Q., Li, H., He, Y., Liu, F., and Peng, D. (2019). Comparison of Data-Driven Models of Loess Landslide Runout Distance Estimation. Bull. Eng. Geol. Environ. 78 (2), 1281–1294. doi:10.1007/s10064-017-1176-3
Yan, X., Duan, Z., and Sun, Q. (2021). Influences of Water and Salt Contents on the Thermal Conductivity of Loess. Environ. Earth Sci. 80 (2), 52. doi:10.1007/s12665-020-09335-2
Yang, H. Q., Xing, S. G., Wang, Q., and Li, Z. (2018). Model Test on the Entrainment Phenomenon and Energy Conversion Mechanism of Flow-like Landslides. Eng. Geology 239, 119–125. doi:10.1016/j.enggeo.2018.03.023
Yang, Q., Cai, F., Ugai, K., Yamada, M., Su, Z., Ahmed, A., et al. (2011). Some Factors Affecting Mass-Front Velocity of Rapid Dry Granular Flows in a Large Flume. Eng. Geology 122 (3–4), 249–260. doi:10.1016/j.enggeo.2011.06.006
Zhou, J.-w., Cui, P., and Yang, X.-g. (2013). Dynamic Process Analysis for the Initiation and Movement of the Donghekou Landslide-Debris Flow Triggered by the Wenchuan Earthquake. J. Asian Earth Sci. 76, 70–84. doi:10.1016/j.jseaes.2013.08.007
Keywords: landslide, falling height, runout distance, sliding body, experiment
Citation: Li H, Duan Z, Wu Y, Dong C and Zhao F (2021) The Motion and Range of Landslides According to Their Height. Front. Earth Sci. 9:736280. doi: 10.3389/feart.2021.736280
Received: 05 July 2021; Accepted: 25 August 2021;
Published: 08 September 2021.
Edited by:
Chong Xu, Ministry of Emergency Management, ChinaCopyright © 2021 Li, Duan, Wu, Dong and Zhao. This is an open-access article distributed under the terms of the Creative Commons Attribution License (CC BY). The use, distribution or reproduction in other forums is permitted, provided the original author(s) and the copyright owner(s) are credited and that the original publication in this journal is cited, in accordance with accepted academic practice. No use, distribution or reproduction is permitted which does not comply with these terms.
*Correspondence: Zhao Duan, ZHVhbnpoYW9AeHVzdC5lZHUuY24=