 Lingjie Yu
 Keyu Liu1,4*
 Zhejun Pan
95% of researchers rate our articles as excellent or good
Learn more about the work of our research integrity team to safeguard the quality of each article we publish.
Find out more
ORIGINAL RESEARCH article
Front. Earth Sci. , 11 October 2021
Sec. Economic Geology
Volume 9 - 2021 | https://doi.org/10.3389/feart.2021.735647
This article is part of the Research Topic Advances in the Exploration and Development of Unconventional Oil and Gas: From the Integration of Geology and Engineering View all 32 articles
Pore connectivity is crucial for shale gas production. However, the three-dimensional (3D) characteristics and distribution of pore networks and, more fundamentally, the underlying role of different pore types on pore connectivity in shales are inadequately understood. By comparing the 3D pore connectivity derived from direct microstructural imaging of pores filled with Wood’s metal at a pressure corresponding to the finest accessible pore throat in the resolution ranges that may be achieved by X-ray micro-CT and SEM, it is possible to evaluate pore connectivity of different types of shales. The pore connectivity of three shales including a mixed mudstone, siliceous shale, and argillaceous shale from the Silurian Longmaxi Formations is investigated via combined broad ion beam (BIB) polishing, and SEM and X-ray micro-CT imaging after Wood’s metal injection at a pressure up to 380 MPa. The three shales show significant differences in pore connectivity. The mixed mudstone shows excellent pore connectivity in the matrix; the siliceous shale shows an overall poor connectivity with only a small amount of OM (organic matter) pores immediately adjacent to microfractures displaying interconnectivity, while the pores in the argillaceous shale, dominated by plate-like clay pores, are largely not interconnected.
Shales are sedimentary rocks containing both organic and inorganic constituents with microstructures exhibiting a high degree of complexity and heterogeneity. A decade-long successful exploration and development of shale gas in the USA indicates that the nanoscale pore system in shales can exert a major control on the storage capacity and mechanical and transport properties of shales (Hu et al., 2012; Loucks et al., 2012; Clarkson et al., 2013; Gu et al., 2016; Ko et al., 2017). In order to elucidate the complex pore system in these highly heterogeneous shales, various methods have been developed to investigate the pore structures of shales. Scanning electron microscopy (SEM), transmission electron microscopy (TEM), and scanning transmission X-ray microscopy (STXM) are commonly used direct imaging methods that could provide useful information to characterize pore types, pore sizes, pore morphologies, and connectivity of the pore networks (Bernard et al., 2012; Klaver et al., 2012; Klaver et al., 2015a). Pore types have recently been systematically described for unconventional reservoir formations, including organic matter pores, interparticle mineral pores, intraparticle mineral pores, and microfractures (Loucks et al., 2012; Clarkson et al., 2013; Milliken et al., 2013). Atomic force microscopy (AFM) is a high-resolution method that integrates both 3D surface morphology and quantitative analysis which have been employed to describe the nanoscale pore structures within organic rocks, facilitating visual characterization or semiquantitative analysis (Zhao et al., 2019; Jubb et al., 2020; Chen et al., 2021). The recent development of atomic force microscopy-based infrared spectroscopy (AFM-IR) was also employed to examine the molecular structure of organic matters to provide an insight into the chemical diversities of an inertinite composition (Jubb et al., 2020). Nuclear magnetic resonance (NMR) as a rapid and nondestructive method to distinguish pore types, and fluid types and states, has been widely applied to calculate the total porosity, estimate organic and inorganic matter porosity, characterize pore size distributions, estimate permeability, and interpret wettability (Gao et al., 2018; Yuan et al., 2018; Liu et al., 2020; Ma et al., 2020; Zhang et al., 2020; Liu et al., 2021). The fluid invasion approaches including high-pressure mercury intrusion capillary pressure (MICP) testing and low-pressure adsorption (LPA) have often been used to characterize pore structures of shales (Yao et al., 2008; Clarkson et al., 2013; Tian et al., 2013; Afsharpoor and Javadpour, 2018; Sang et al., 2018). MICP may significantly underestimate the porosity of shales because of incomplete mercury intrusion into fine pores, which are smaller than 3 nm. Both conformance and compression effects lead to an overestimation of porosity and affect the pore throat size distribution (Comisky et al., 2011; Kuila and Prasad, 2013; Peng et al., 2017). The water immersion porosimetry (WIP) technique was developed to measure the total porosity of shale samples for its simple and rapid advantage, and the density and porosity obtained are quite precise and highly reproducible (Kuila et al., 2014). However, this technique may overestimate porosity in samples with significant amounts of water-soluble minerals, and it is also not recommended for smectite-rich shales or shales with high illite–smectite expandability.
Although considerable work has been carried out to characterize the complex pore networks of shales, the connectivity of matrix pores lacks attention, and their characterization is quite challenging. Spontaneous imbibition is a simple, convenient, and useful experimental method to measure the pore connectivity and wettability of shale samples using different fluids including saturated brine, kerosene, and n-decane via assessing the imbibition slope on the log cumulative imbibition versus log imbibition time plot (Hu et al., 2012; Yang et al., 2017a; Sun et al., 2017; Kibria et al., 2018; Meng et al., 2020a; Meng et al., 2020b; Wang et al., 2021). The pore connectivity and wettability characteristics could be qualitatively assessed according to the different imbibition behaviors in different media and along different imbibition directions of samples. However, this method has the disadvantage of being unable to visualize or distinguish pores, and it may also result in imbibition-induced cracks for shales with high-content swelling clay, changing the original connectivity. Focused ion beam scanning electron microscopy (FIB-SEM) and X-ray computed tomography (X-ray CT) have the advantage and application prospects of evaluating the 3D pore morphology and its connectivity in porous media (Curtis et al., 2012; Ma L. et al., 2016; Wang Y. et al., 2016; Kelly et al., 2016; Tang et al., 2016; Wu et al., 2020). FIB-SEM can create a 3D display in a microscale domain by stacking a series of 2D images with a resolution generally as small as ∼5 nm/pixel. It can describe nanoscale pores and organic matter (OM) in detail and obtain the results including porosity, permeability, pore spatial orientation, fracture distribution, fractal dimensions, transport path tortuosity, and length by numerical processing (Keller et al., 2013). However, FIB-SEM tomography often does not resolve the connecting pore throat in fine-grained rocks, and 3D cutting volume is generally in the range of 30 μm, which is smaller than the representative volume element (RVE) of heterogeneous samples; therefore, the 3D network derived may not be a representative of the sample investigated (Kelly et al., 2016). Micro-CT imaging is commonly used for the digital core analysis of conventional reservoir rocks, which can provide the structural linkage between microscopic volumes and core-plug volumes, but is not able to achieve the resolution required for characterizing the structure of nanopore systems in shales. X-ray nano-computed tomography (nano-CT) can distinguish pores with diameters down to 50 nm (Wang P. et al., 2016; Wang Y. et al., 2016; Tang et al., 2016). However, both techniques still require means to overcome the lack of sensitivity of X-ray attenuation to distinguish pores from organic matters (OMs) in organic-rich shales, both of which are characterized by an extremely low X-ray density. In order to enhance the contrast between OMs and pores, different agents have been introduced to improve the image quality during CT imaging. Xenon was used as a high X-ray contrasting gas to improve images of pores and fracture networks in sandstones, carbonates, shales, and coals (Vega et al., 2013; Mayo et al., 2015). X-ray opaque liquid diiodomethane (CH2I2) was employed to facilitate imaging at micron-to-centimeter scales to characterize pore size, tortuosity, and dynamically visualize the process of fluid diffusion in shales (Fogden et al., 2014; Fogden et al., 2015). Wood’s metal (WM; 50% Bi, 25% Pb, 12.5% Zn, and 12.5% Cd) with a melting point around 80°C has similar physical properties to mercury and can be progressively injected into micro- to nanopores with an increasing pressure. WM can significantly improve the imaging contrast and resolution of micro- and nanopores and can be investigated using the BIB-SEM techniques because the nanopores filled with WM at a high temperature would be “cemented” by solid WM after cooling to room temperature. A handful of studies have used the WM injection method in studying pore structures of porous media including cement-based materials (Nemati, 2000), synthetic polymer (Lloyd et al., 2009), sandstone (Hu et al., 2012; Desbois et al., 2016), salt (Hildenbrand and Urai, 2003), and clay-rich mudstone (Hildenbrand and Urai, 2003; Klaver et al., 2015b). Although the superiority of the WM intrusion has been known for decades, its application on shales is still quite limited. ((Houben (2013) applied WM injection on Haynesville shale and Bossier shale using injection pressures up to 316 MPa (Hu et al., 2015) injected a liquid into a Barnett shale sample at 600 MPa and found no noticeable connected matrix porosity. Small-angle scattering (SAS) techniques, including USAXS/SAXS and USANS/SANS, have the advantage of nondestructively probing both accessible and inaccessible pores ranging in size from nanometers to micrometers by introducing high-pressure deuterated methane or deuterated water into the shale matrix (Mastalerz et al., 2012; Clarkson et al., 2013; Ruppert et al., 2013; Bahadur et al., 2014; Lee et al., 2014; Bahadur et al., 2015; King et al., 2015; Okolo et al., 2015; Yang et al., 2017b). Previous studies show that the pore size distributions (PSDs) of shale samples obtained from USANS/SANS are in a good agreement with those obtained from the low-pressure N2 adsorption (Clarkson et al., 2013; Yang et al., 2017b; Sang et al., 2018).
Despite the importance of pore connectivity to gas transport, our current understanding on the three-dimensional (3-D) spatial distribution of pore networks is still limited. More fundamentally, the underlying role of different types of pores in matrix pore connectivity needs to be clarified. 3D pore connectivity can be obtained directly from microstructural imaging of pores filled with WM at a pressure corresponding to maximum accessible pore throat, which is in the imaging resolution range that can only be resolved by SEM. Therefore, coupled WM injection and high-resolution SEM imaging has the unique advantage to characterize pore connectivity of different types of shales. The Lower Silurian Longmaxi (S1l) shales in the Sichuan Basin, China, have become a major shale gas exploration target interval since the discovery of the Fuling gas field. Shales with different lithofacies have different mineral and organic compositions and distribution, leading to a remarkable difference in pore structures and associated pore connectivity. It is thus important to clarify the difference in the matrix pore connectivity of argillaceous, siliceous, and mixed shales, which are the three main shale types in the Longmaxi Formation. In this present work, pore connectivity of the above three types of shales was investigated using a combination of BIB-SEM and X-ray micro-CT after Wood’s metal injection at a pressure up to 380 MPa. The overall connectivity of three shales will be compared using different techniques. The impacts of lamina and pore types on pore connectivity will also be discussed in detail. A schematic illustration of the connectivity in the shales will be proposed.
Three core samples from the Silurian Longmaxi Formation in the Sichuan Basin were studied. The subsampling process was carefully designed in order to make the best use of the core and reduce the heterogeneous effect. The core plugs are approximately 3 cm in length and 5 cm in diameter. They were first drilled to obtain cylindrical core plugs of about 25 mm in length and 25 mm in diameter to measure porosity using the helium gas expansion. The core plugs were then drilled parallel to their bedding planes to obtain small cylindrical plugs of about 2 mm in diameter for X-ray tomography and Wood’s metal injection. One part of the sample was further cut by a low-speed diamond saw to obtain two thin slices of about 5 mm thick. One slice was scanned by micro-XRF mapping to obtain the information about shale fabric and mineralogy after mechanical polishing. The other slice was used to make a thin section for the optical microscopic examination. A rectangular block with about 10 mm × 10 mm × 5 mm was cut for broad ion beam (BIB) polishing for the SEM analysis. Crushed particles about 3–5 mm in diameters were used for the high-pressure mercury injection measurement. Shale powders (<100 mesh) were used to carry out the experiment including X-ray diffraction (XRD), total organic carbon (TOC) content analysis, and low-pressure nitrogen sorption measurement.
A dedicated pressure vessel for WM injection was made according to the design of Klaver and coauthors (Klaver et al., 2015b) with some improvements. In order to facilitate the pullout of the upper and lower steel piston rods, a screw sleeve device was designed (Figure 1A). By rotating the screw sleeve downward, an opposite force would apply to the piston rod, which facilitates its pullout. Considering the micro-CT analysis after WM injection, the predrilled cylindrical sample of 2 mm diameter was used in this study instead of block cubic samples used by Klaver and coauthors (Klaver et al., 2015b). The core samples were first placed into PTFE (polytetrafluoroethylene) tubes and then loaded into holes in the steel base to prevent sample floating over the melted metal alloy. Up to six samples can be placed into the steel base at one time. Prior to the WM injection experiment, the steel base with samples was oven-dried at 105°C for at least 24 h. For the WM injection experiment, the steel base was placed into the pressure vessel that was preheated to approximately 100°C. After half an hour when the vessel and the steel base was fully equilibrated to 100°C, the melted alloy was poured into the vessel and the top piston rod was then put in place. Pressure was then applied via an external hydraulic rig equipped with a pressure gauge and increased stepwise through an automated program. The pressure was increased by 30–50 MPa stepwise at 30–40 min intervals until reaching a maximum of 380 MPa (Figure 1B). Taking an interfacial tension of 0.420 N m−1 and a wetting angle of 140°, this pressure corresponds to an accessible pore throat diameter of 3.8 nm (Hildenbrand and Urai, 2003; Klaver et al., 2015b). The entire pressure loading procedure would take around 5 h. The maximum pressure was maintained for at least 12 h. After the WM injection experiment, heating was stopped to let the system cool down, while the pressure was maintained at the maximum value until the temperature decreased to room temperature. The pressure was released finally, and the solidified WM cylinder containing samples were then extracted from the pressure cell. After mechanically cutting, the cylinder sample injected with WM was pushed out of the steel base. The PTFE tube wrapping the cylindrical sample was removed, and the WM membrane on the core surface was polished manually using silicon carbide papers. A part of the cylinder was scanned directly by X-ray micro-CT, whereas the rest was used for ion polishing and SEM observation. In order to prevent the melting of WM during ion polishing, a BIB polishing procedure with eight steps was set with a voltage at 1.5 KV working 15 min and 4 KV working for 60 min alternatingly, to avoid heating the sample above a temperature of 40°C.
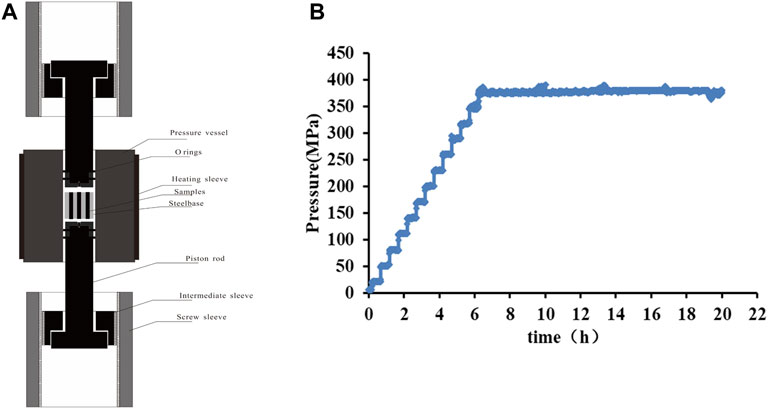
FIGURE 1. (A) Schematic illustration of the Wood’s metal injection setup and (B) injection pressure time plot showing a step-wise pressure increase up to 380 MPa during Wood’s metal injection.
A Bruker X-ray diffractometer (D8 Advance) was used to obtain the mineralogical compositions of powder samples (<100 mesh) with a step of 0.02° scanning from 3° to 65° at room temperature. The working voltage and current are set to 40 kV and 40 mA, respectively. TOC was measured using a LECO CS-230 infrared carbon-sulfur analyzer. Prior to the TOC measurement, inorganic carbon was removed using a 7% hydrochloric acid solution at 80°C for at least 5 h.
The micro-X-ray fluorescence analysis was carried out with a Bruker M4 Tornado micro-XRF mapping (full-spectral imaging) system, equipped with a microfocused Rh source with a polycapillary optic that is able to focus the beam to a small (∼25 μm) spot size, thereby generating a high-intensity beam with a spatial-resolution sufficient for excellent chemical mapping of materials. The detector system employs two silicon-drift detectors (SDDs), which can be used individually or in-tandem, to collect fluorescence spectra from the specimen. The qualitative data in the form of X-ray area maps and quantitative data can be rapidly acquired for a wide range of elements (as light as Na, using a vacuum). The experiments were carried under vacuum at 20 mbar. The system is equipped with a motorized sample stage allowing the acquisition of 2D elemental distribution maps with the pixel size as small as 4 μm.
Quantitative data of pore structures of samples were acquired by both low-pressure nitrogen sorption and MICP. A low-pressure nitrogen sorption analysis was performed on crushed samples with particle sizes at the range of 60–80 mesh using a Micromeritics ASAP 2460 Surface Area and Porosimetry Analyzer. N2 adsorption isotherms and pore structure parameters including specific surface area (SSA), median pore size, and total pore volume were obtained under −196°C with relative pressure (P/Po) range from 0.001 to 0.998. The Brunauer–Emmett–Teller (BET) method is used to obtain the SSA value. Both Horvath–Kawazoe (HK) and Barrett–Joyner–Halenda (BJH) methods were applied to determine pore volume and pore size distribution. The BJH model developed in 1951, which is based on the Kelvin’s capillary condensation theory and corrected for multilayer adsorption, is being widely used for mesopores and macropores (Barrett et al., 1951). The conventional HK models for silt-shaped pores (carbons) are mainly applied for determining the micropore size distribution (Horváth. and Kawazoe, 1983). MICP was conducted using crushed particles of 3–5 mm in diameter with a Micromeritics AutoPoreⅣ 9520. The surface tension and mercury’s contact angle were adopted as 0.485 N m−1 and 140°, respectively. With the pressure increasing to 414 MPa, the intruded mercury volume appears to depict an intrusion curve. Assuming that the pore system in the porous media can be represented by a bundle of nonintersecting tubes, a pore size distribution curve can be obtained from the intruded mercury volume at each pressure step. The Washburn equation is applied to calculate pore throat diameters from pressure values (Washburn, 1921). It is necessary to carry out the conformance correction during the data processing of MICP. However, there is no well-established and standard method for correction. ((Comisky et al. (2011) developed a method for determining closure and actual entry pressures by comparing the calculated pore volume compressibility with the linear part of the pore volume on the compressibility vs. pressure curve. ((Peng et al. (2017) proposed a new way for conformance correction based on comparing mercury injection volume vs. pressure curves between epoxy-coated and uncoated samples. In this study, we regarded the mercury injection volume at the fixed pressure of 0.1 MPa as the conformance effect. It is quite simple and direct to derive the final cumulative mercury injection volume at each pressure point by subtracting the conformance volume. The correction of volume compression is not considered because the noncorrected option in the MICP software was chosen for data processing.
X-ray computed tomography was performed using a commercially available Phoenix Nanotom micro-CT system (GE Sensing & Inspection Technologies, Wunstorf, Germany), equipped with a 180 kV/15 W high-power nanofocus tube with tungsten targets, offering four modes to be selected according to the density and diameter of the tested samples. A flat panel CCD detector with a size of 105 × 105 mm2 and a maximum resolution of 2048 × 2048 pixels is installed in the imaging system capable of adjusting voxel sizes down to 500 nm. A total of 1,000 projections were acquired during a rotation of 360° with a rotation step-size of 0.36° and a total time around 100 min. For each rotation step, three projections were captured and averaged for noise reduction. During this study, the samples were scanned using mode 1 with a 100–120 KV source voltage and corresponding 100–110 mA current. Volume reconstruction and visualization were done with raw images using the Avizo Fire 9 software (FEI VSG). In order to quantify the pore volume invaded by Wood’s metal, 3D visualization of a skeleton of the pore morphology was extracted from the segmented images using the Avizo Pore Network Model.
Samples were mechanically polished using carbide papers in advance. In order to get high quality, damage-free surface for a high-resolution SEM observation, a Leica EM TIC 3X Argon beam polisher was used with a working voltage set to 4 KV.
In addition to the XRD and XRF measurements, QEMSCAN technology was also used to visually inspect mineral distribution and shale fabric on the mechanically polished thin sections to quantitatively evaluate the content of minerals. This analytical methodology scans the electron beam over the field of view at a predetermined beam step ping interval. At each step, a mineralogical determination is made using a combination of the BSE (backscattered electron) images and EDS (energy dispersive spectra), yielding mineralogical images. A 5 μm beam stepping interval was employed to provide a detailed mineralogical characterization of the sample. For high-resolution images, a representative area of each sample was selected and was measured at a resolution of 1 μm. Detailed procedures for conducting QEMSCAN can be found in references (Liu et al., 2005; Tang et al., 2016; Guanira et al., 2020).
The TOC contents of the three studied shales are in the range of 0.96–6.11 wt% with helium porosities ranging from 4.63 to 7.31% (Table 1). According to mineral compositions, the three shales analyzed belong to different categories following the terminology and classification scheme proposed by Gamero–Diaz (Diaz et al., 2012) (Figure 2). Sample Sw-1 is a silica-rich argillaceous mudstone, having the highest clay content of 56%. Sample WY23-6-6 contains 32% carbonate, typical of mixed mudstone. Sample JY9 is rich in quartz and feldspar with a total content of 64%, the highest among all.
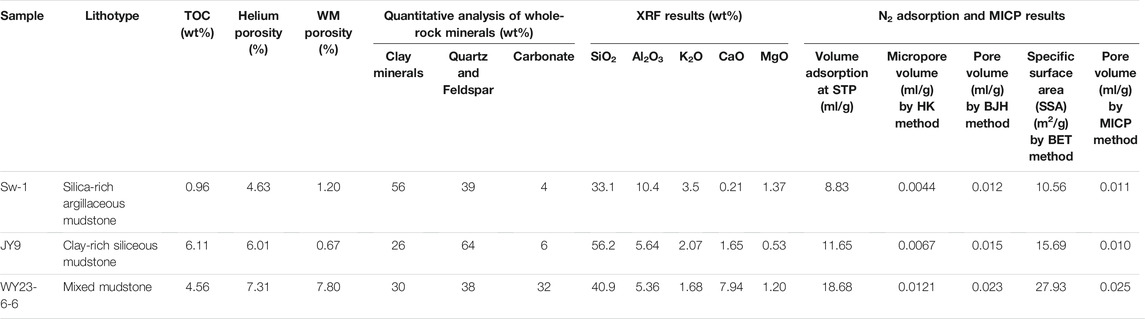
TABLE 1. Elemental and mineral compositions and pore structure measurement data of the samples investigated.
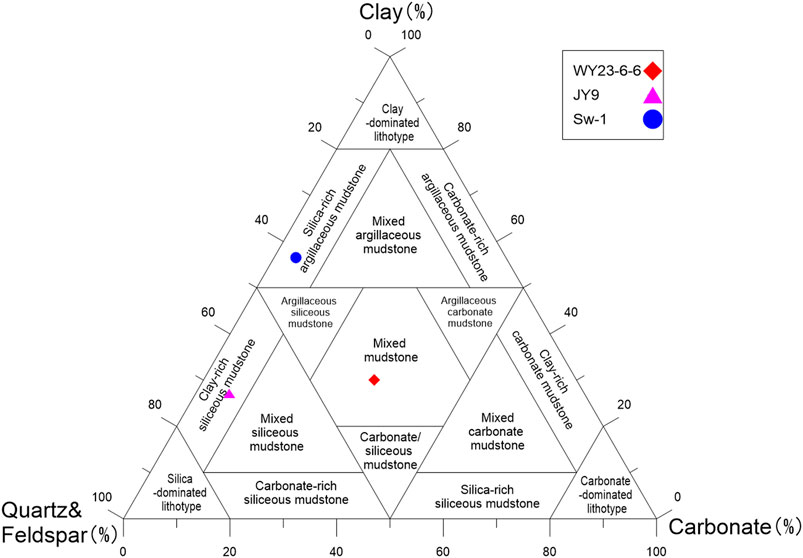
FIGURE 2. Classification scheme for organic-bearing mudstones based on bulk mineralogies for the three shale samples (after Gamero–Diaz (Diaz, 2012)).
Micro-XRF mapping was applied to characterize both the element distribution and rock fabrics of the samples. This method is useful for characterizing the compositions and sedimentary structures of the sites where small core plugs were drilled for the WM injection experiment. The major elements expressed in oxides wt% (SiO2, Al2O3, MgO, CaO, and K2O) are presented in Table 1. It is revealed that the sample WY23-6-6 (the mixed mudstone) has the highest content of CaO (7.94%), consistent with its high carbonate content. The sample Sw-1 has the highest content of Al2O3, indicative of its high abundance in clay minerals. The sample JY9 has the highest content of SiO2 of 56.2%. Elemental maps of the three samples are presented in Figure 3. The sample WY23-6-6 contains fine laminae of carbonate at microscopic scales.
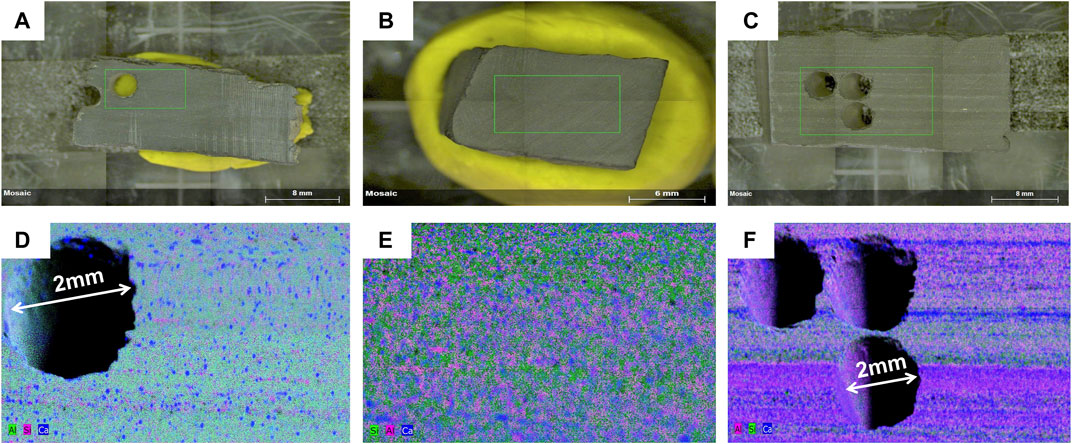
FIGURE 3. XRF images of the three shale samples investigated, showing fine sedimentary structures and predominant mineral (elemental) compositions. (A,D), Sample Sw-1; (B,E), Sample JY9; (C,F), Sample WY23-6-6.
Based on the SEM observation of BIB polished thin sections, pores within gas shales could be categorized into mineral matrix pores, organic matter pores, and microfracture pores according to the description presented by Loucks et al. (Loucks et al., 2012). Mineral matrix pores include InterP pores and IntraP pores, which are observed between mineral particles and within mineral particles. Pores within organic matters are defined as OM pores. Figure 4 presents SEM images with different magnifications (Figures 4A–C) to illustrate the distribution of pores and minerals in sample Sw-1, which has a low organic matter content (TOC = 0.96%). The mineral matrix pores are mainly developed between and within clay minerals. Various sizes of nonclay mineral grains are observed as inclusions in the fine-grained clay matrix. Flaky microcracks are commonly observed. They were possibly caused by shrinking of clay minerals during the dehydration process and/or the unloading effect after the retrieval from subsurface. Sample JY9 with the highest organic matter content (TOC = 6.11%) is dominant by organic matter hosted pores with pore sizes ranging from several nanometers to over one hundred nanometers (Figures 4D–F). These pores may be connected by narrow throats in three dimensions, but 3D imaging would be required to confirm their connection. SEM images suggest that there are few microfracture pores in this sample. Sample WY23-6-6 with the highest content of carbonate exhibits calcareous and siliceous lamina under a low magnification in Figure 5A, consistent with the results of XRF imaging (Figure 3). There are two forms of organic matter in this sample, one is distributed along bedding planes, and the other is dispersed in the pores between mineral particles in Figure 5B. The organic matter in the intergranular pores had probably undergone thermal cracking by expelled oil in the early stage, and the organic pores were quite well-developed (Figures 5B,C). The interparticle pores associated with carbonate and feldspar (Figures 5D–F). These mineral grains are chemically unstable under certain diagenetic environments and may undergo dissolution.
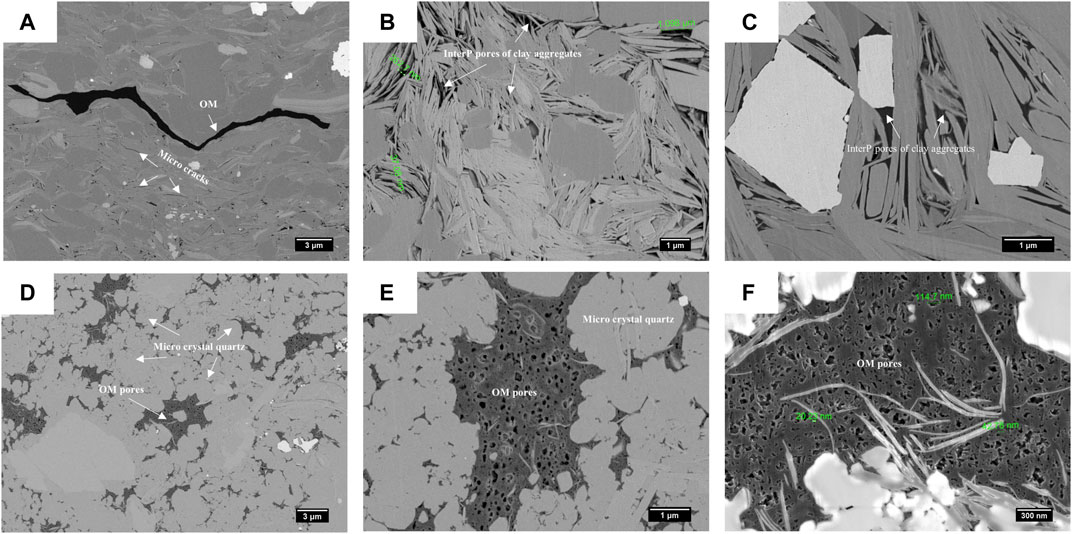
FIGURE 4. SEM images of shale samples before WM injection. (A–C) Sample Sw-1, argillaceous mudstone, consisting mainly of flaky pores in the clay minerals. (D–F) Sample JY9, siliceous mudstone with well-developed organic pores.
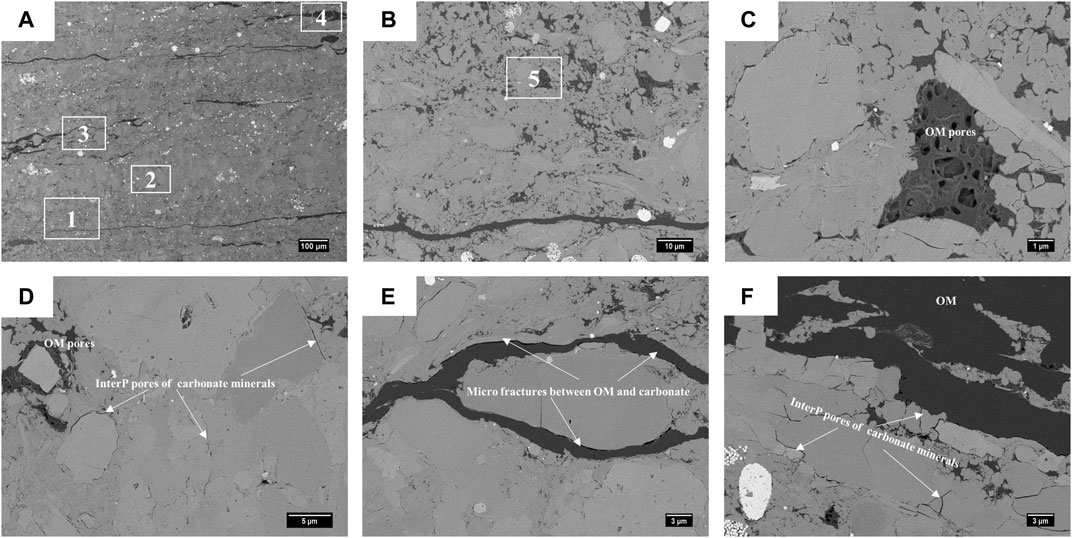
FIGURE 5. SEM images of sample WY23-6-6 before WM injection (mixed mudstone, lamination developed with organic matter (OM) pores, and interparticle pores at the edge of carbonate particles). (B) An enlargement of rectangle area 1 marked in (A), showing abundant OM. (C) An enlargement of rectangle area 5 marked in (B), showing well-developed OM pores. (D) An enlargement of rectangle area 2 marked in (A), showing well-developed interP pores in carbonate laminae. (E,F) An enlargement of rectangle areas 3 and 4 marked in (A), showing microfractures at the edge of OM and interP pores around carbonate particles.
The experiments of low pressure N2 adsorption and MICP are commonly used to measure pore volumes and describe pore types of porous media including concrete, shales, and silica gels. The isotherms of adsorption and desorption of N2 of the three samples at liquid nitrogen temperature (Figure 6A) exhibit a hysteresis pattern. The larger the area formed by the hysteresis curve, the more developed the ink bottle–shaped pores are. Compared with the flaky clay pores, most of the organic matter pores are foam shaped, and the ink bottle characteristics are more obvious. Sample SW-1 is composed mainly of clay pores with a maximum adsorption volume of 8.83 ml/g. In comparison, the adsorption volumes of samples JY9 and WY23-6-6 are larger, being 11.65 and 18.68 ml/g, respectively, indicating that pores in the two samples were better developed. The pore volumes were calculated using adsorption curve data listed in Table 1 with the micropore volume being obtained using the HK model, while the meso- and macropore volumes were derived using the BJH model. Three different mathematical forms of PSD data presentation including incremental pore volume versus diameter (dV), differential pore volume versus diameter (dv/d(d)), and the log differential pore volume versus diameter (dV/dlog(d)) were commonly used to analyze pore structures derived from the N2 adsorption and MICP methods. Liu et al. (Liu and Ostadhassan, 2019) compared the results using different data presentation forms and recommended the use of the dv/d(d) plot to characterize PSD in N2 adsorption and the use of dV/dlog(d) for MICP. The dV/d(d) plots in Figure 6C with data from the BJH model shows unimodal characteristics for all the samples with maximum values around 2-3 nm. The dV/dlog(d) plots in Figure 6D with data from the MICP method shows that the Y values of sample WY23-6-6 in the range of 2–8 nm is much higher than the other two samples. The results of nitrogen adsorption and mercury injection indicate that sample WY23-6-6 contains the most developed pores.
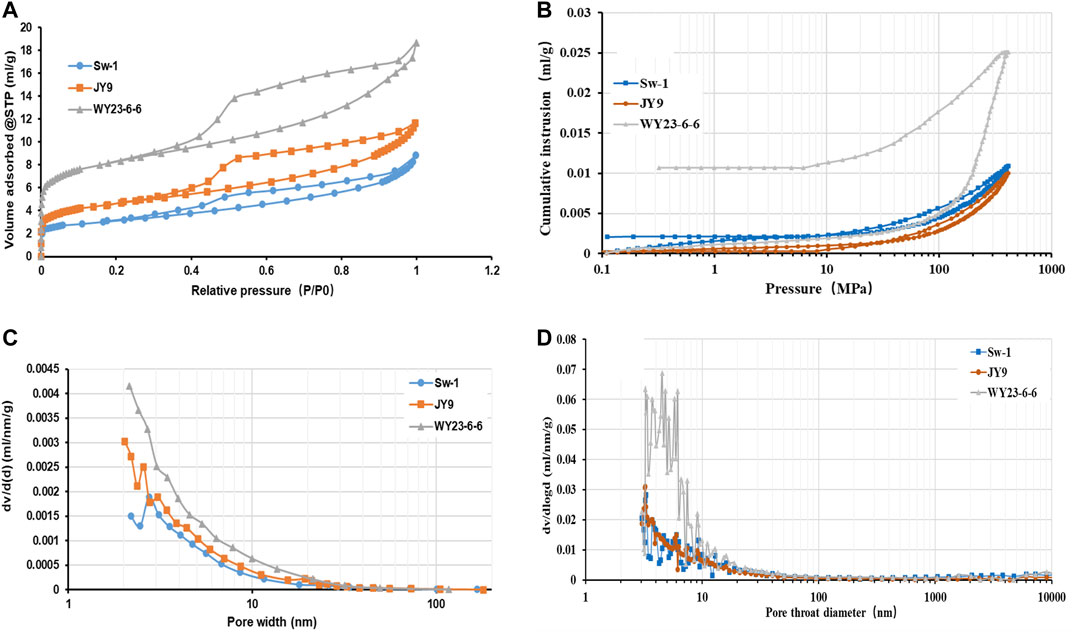
FIGURE 6. N2 adsorption isotherms and MICP results for the three shale samples. (A) Isotherms of N2 adsorption and desorption. (B) Mercury intrusion and extrusion curves. (C) dV/d(d) plots derived from N2 adsorption data. (D) dV/log(d) plots derived from MICP data.
Pores that develop in shales are complex with different types and structures in micrometer and nanometer scales because the shapes, sizes, and connectivity of pores vary greatly among different OM and minerals. After the WM injection experiments, core plug samples of 2 mm in diameter polished on an Argon beam milling machine were then observed under SEM to obtain 2D images for the connectivity analysis. In the SEM images of postintruded samples, the white color represents the solidified metal in pores and fractures. It is worth noting that heavy minerals in shales including pyrite would show similar brightness both in SEM and CT images, which may result in an overestimation of the porosity when simply using the image processing statistics. Fortunately, with the high-resolution model, it is easy to differentiate intruded metals from originally deposited heavy minerals based on their overall morphologies under SEM. For the argillaceous mudstone sample (SW-1), several fractures, mainly along bedding planes, have been invaded by Wood’s metal, which can be clearly seen under low-magnification SEM images in Figure 7A. Parts of the microfractures and interpores around the strawberry-like pyrite have also been invaded by metals (In Figure 7B). The minimum diameters of WM injected pores can be as small as <5 nm (Figure 7C), which is in a good agreement with the theoretical calculation of 3.8 nm. Despite the well-developed flaky pores with clay minerals in the matrix of sample SW-1, very few pores are accessible to the WM alloy, even under high pressure. Therefore, it can be inferred that clay pores, which have suffered strong diagenetic compaction, would be mainly connected locally in one dimension, leading to an overall poor connectivity in three dimensions. For the siliceous mudstone sample (JY9) in Figure 7D, microcracks are less well-developed compared with sample Sw-1. A part of the organic pore clusters adjacent to microfractures within approximately 50 μm in distance has been invaded by WM via the microfractures. Figure 7F shows that two dispersed organic matter pore clusters are connected by inorganic intergranular pores, which may act as potential pathways. For the mixed mudstone sample (WY23-6-6), WM invasion is pervasive among the well-developed inorganic particle edge pores. In addition to inorganic pores, organic pore clusters can also be clearly seen in bright color, indicative of WM intrusion (Figure 7G). A close-up view of the organic matter zones (Figures 7H,I) shows obvious differential invasion within OM pores, indicating that WM can be injected into most of the large pores but not the small ones.
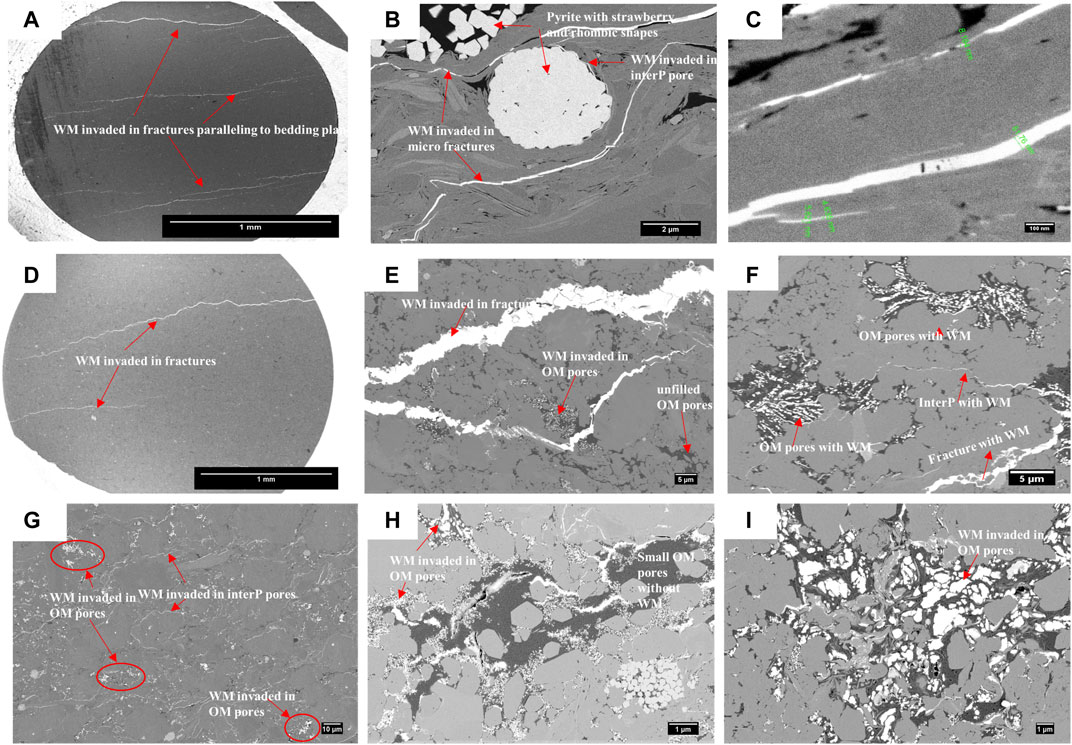
FIGURE 7. SEM images of the three shale samples investigated after WM injection. (A–C) Images of the argillaceous shale sample (sample SW-1) showing that WM intruded mainly in fractures along bedding planes with few in clay matrix pores. (D–F) Images of sample JY9, massive siliceous shale or mudstone, showing that WM intruded in both fractures and matrix pores including OM pores and interpores adjacent to fractures. (G–I) Images of sample WY23-6-6, the laminar mixed shale, showing that WM intruded in most of matrix pores including OM pores and interP pores.
The tomography and 3D network reconstruction of WM in the three samples are displayed in Figure 8 with the results showing distinct differences. The subvolumes of the alloy-impregnated samples are 1000 μm × 1000 μm × 1000 μm (at a resolution of 1 μm). In Figures 8A,D,G, 2D slices perpendicular to the bedding plane after 3D reconstruction show the invaded range of the alloy in the matrix pores after an initial injection into fractures along the bedding plane. In the 2D X-ray CT slices, similar to what had been observed on the SEM images, most of the bright spots or lines represent intruded metal. Compared with samples SW-1 and JY9, the bright color shown in Figure 8G of sample WY23-6-6 covers almost the entire area, indicating that the WM entered most of the matrix pores adjacent to fractures. The mass fractions of heavy metals in the three samples are quite low according to the X-ray diffraction results. Therefore, it is acceptable to calculate the volume fraction of WM by grayscale segmentation without considering the errors caused by heavy mineral impacts. By using the Avizo software, WM is extracted and reconstructed by threshold segmentation as shown in Figures 8B,E,H, and the volume fractions of WM (WM porosity) calculated according to the grayscale value for samples Sw-1, JY9, and WY23-6-6 are 1.2, 0.67, and 7.8%, respectively. The porosities obtained by the helium expansion method of the three samples are 4.63, 6.01, and 7.31% (Table 1). WM porosity is much less than helium porosity for samples JY9 and SW-1. However, for sample WY23-6-6, two porosities are close to each other. This suggests that the mixed mudstone sample (WY23-6-6) has a good connectivity between the fractures and matrix pores, while there appears poor microfracture pore interconnectivity for samples Sw-1 and JY9.
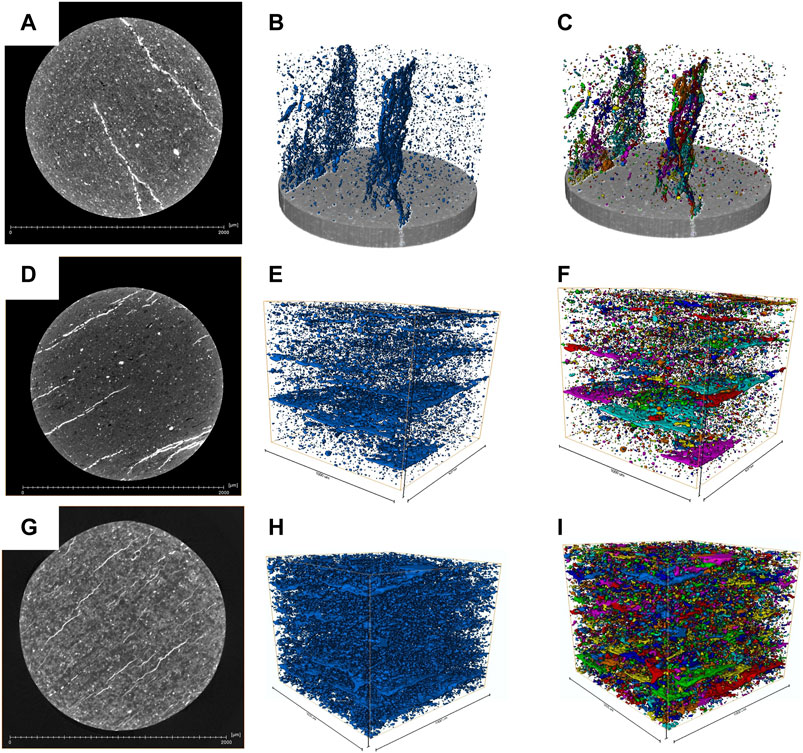
FIGURE 8. X-ray CT images after WM injection. (A,D,G) 2D slices for samples Sw-1, JY9, and WY23-6-6 perpendicular to the bedding plane. (B,E,H) Subvolumes with 1000 μm × 1000 μm × 1000 μm at a resolution of 1 μm. WM reconstructed and volume fractions of WM calculated according to the grayscale threshold segmentation with the results of 1.2, 0.67, and 7.8%, respectively. (C,F,I) Pore rendering for samples Sw-1, JY9, and WY23-6-6 with different colors indicating different clusters.
Laminae are common sedimentary structures in nature and are formed by the compositional layering from different mechanisms including depositional, diagenesis, biological activity, clay mineral alignment, and/or the lenticular distribution of organic matters (O'Brien, 1990; Schieber, 1998; Yawar and Schieber, 2017). The roles of shale laminae on gas migration and accumulation have been well documented (O'Brien, 1990; Liang et al., 2018; Wang C. et al., 2019; Zhu et al., 2020). Shale laminae in the Longmaxi Formation in the Fuling gas field have been categorized into three types (Wang C. et al., 2019) based on lamina density and the maximum thickness of individual laminae, and the pore structures are found to be strongly affected by lamina types. Laminae are usually associated with interfaces of different lithologies or structures, which are often the weak place of contact and easy to open under stress, and thus may play beneficial roles in the hydraulic fracturing (Mokhtari and Tutuncu, 2016; Tan et al., 2017; Zhang et al., 2019). Lamina parallel microfractures are main fluid flow paths in shale reservoirs and often lead to strong vertical–horizontal permeability anisotropy in shales (Ma Y. et al., 2016; Tan et al., 2019). The thickness of individual laminae in shales is generally less than 10 mm, typically in the range of 0.05–1.00 mm. The laminae in the three samples are quite different at microscale on QEMSCAN images (Figure 9). Sample WY23-6-6 displays strong lamination including siliceous and calcareous with abundant microfractures developed parallel to the lamina. Moreover, the sample also develops a greater volume of nanopores, as indicated by the N2 adsorption and MICP results. The microfractures and nanopores are also accessible to Wood’s metal injection at a high pressure up to 380 MPa. In comparison, sample Sw-1 is dominated by clay laminae. Due to their relative low stiffness and susceptible to compaction under high stress, clay laminae display poor connectivity between the matrix pores and the microfractures as indicated by the Wood’s metal injection, N2 adsorption, and MICP results of sample Sw-1. Sample JY9 is in a lack of laminae, and thus the matrix has an overall poor connectivity. Therefore, lamination seems to be a limiting factor for matrix pore connectivity in the shale samples studied.
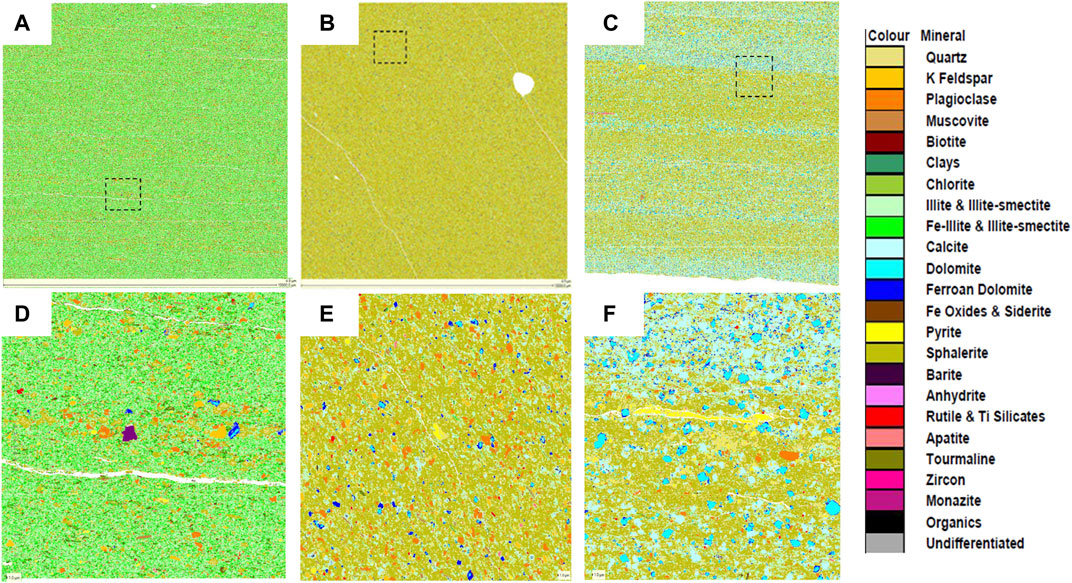
FIGURE 9. QEMSCAN results for the three shale samples with an imaging resolution of 5 and 1 μm. (A,D) Sample Sw-1, argillaceous shale, fine-to-medium silt size grains of quartz and plagioclase within an illite-dominated clay matrix, with a fine lamination defined by the preferential alignment of flakes of clays. (B,E) Sample JY9, siliceous shale, homogeneous, comprising predominantly medium-to-coarse silt grade quartz. (C,F) Sample WY23-6-6, mixed shale, comprising thick bands of medium to coarse-grained quartz and fine-to medium-grained carbonate bands, with an illite clay matrix.
As stated earlier, the pores of shale matrix mainly include intraparticle organic pores, shrinkage cracks of organic matter, clay mineral pores, and inorganic mineral interP and intraP pores. Controlled by diagenetic and hydrocarbon generation processes, different pores have different pore structure distribution characteristics under different geological conditions, which can significantly impact on pore connectivity.
Previous studies suggested that the degree of pore development in organic matters is related to their type, thermal maturity, mineral contact, stress, and other factors (Bernard et al., 2012; Mastalerz et al., 2013; Chen and Xiao, 2014; Davudov and Moghanloo, 2018). Sample JY9 obtained from the bottom of the Longmaxi Formation has a high TOC content with approximately 80% of the reservoir storage space being provided by organic pores. However, it should be pointed out that the development of intraparticle pores in organic matters is highly heterogeneous. Different organic matter particles may develop different pores, and the pore development may be different even in different parts of the same particle of organic matter. More importantly, large organic pores may be connected through nano-organic pores that cannot be observed with SEM. Previous studies have shown that the pore structures of shales of the Longmaxi Formation are the characteristic of fractal, and the fractal dimensions are positively correlated to the TOC content, indicating that the complexity of pore structure is mainly associated with organic matter pores, especially the micropores, which act as predominant throats for the migration pathways (Yao et al., 2008; Yang et al., 2016). As shown in Figure 10 A and B, the large organic pores developed in sample JY9 are interconnected with numerous small pores. These pores are characteristic of ink-bottle–hole type with the pore throat being as small as 5 nm or less, which is difficult for WM to enter under the injection pressure used in the present study. Sample WY23-6-6 also develops large and small pores within organic matters (Figures 10D,E). The difference in the characteristics of the pore throats makes it difficult for WM to enter into the small pores (Figures 7H,I). Another type of pores related to organic matters is the shrinkage cracks around the organic matter, often distributed in long strips. They are not seen in sample JY9 and occasionally observed in sample Sw-1. However, they are an abundant pore type in sample WY23-6-6 because of the presence of long-strip organic matter in matrix, which can significantly improve the connectivity (Figure 10C).
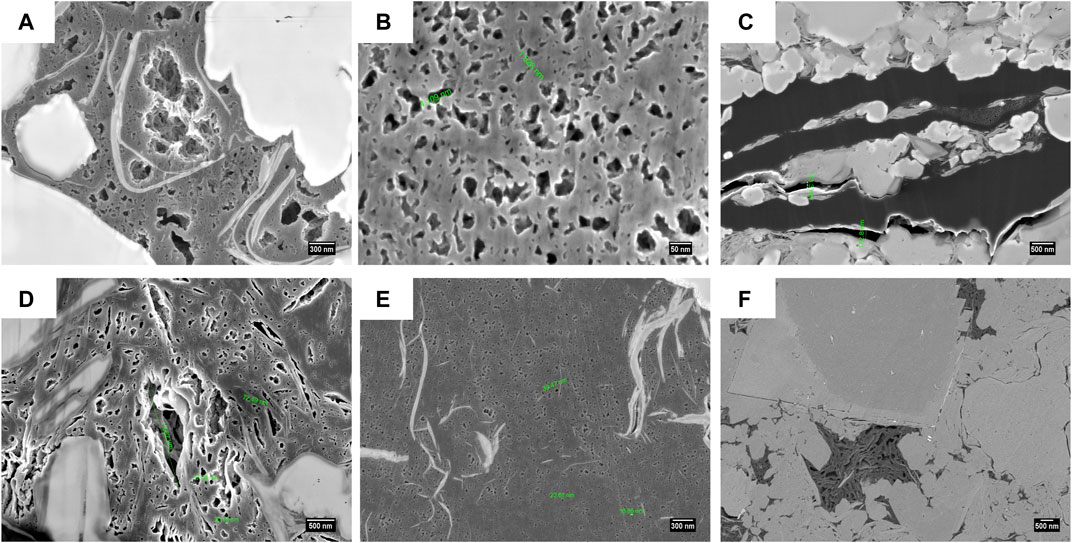
FIGURE 10. Matrix pore characteristics of selected samples. (A,B) Sample JY9, siliceous shale, various sizes of OM pores showing that large pores are interconnected with small pores. (D,E) Sample WY23-6-6, mixed shale, various sizes of OM pores in different OM from μm to approximately 20 nm. (C) Microfractures along banded organic matter in sample WY23-6-6. (F) InterP pores with carbonate grains observed in sample WY23-6-6.
The development degree of clay mineral pores is mainly controlled by the degree of diagenesis after deposition. For the Longmaxi Formation shale, it is currently in an overmature stage, and smectite had already converted to illite. The pores mainly present as one-dimensional flattened and elongated shapes. At the same time, due to the strong hydrophilicity of the clay mineral surface, the bound water on the surface is difficult to be completely removed. Although the sample is dried before the WM injection experiment, the bound water in the nanoscale pores of the clay mineral may still be intact, making the WM difficult to enter even under high pressure conditions. Similarly, this part of the pores will also have a significant inhibitory effect on gas flow due to the presence of high capillary forces under reservoir conditions.
The pores between grains or interP pores are larger than the organic pores or clay mineral pores, generally in the range of hundreds of nanometers to microns. These interP pores in shales mainly exist between carbonate, quartz, and feldspar particles. However, the genetic origin of the quartz would play different roles in pore types and pore evolution. Many studies have been done to identify quartz of biogenic origin by crystalline morphology, luminescence, grain size, and geochemical proxies and to clarify its impact on the pore development (Milliken et al., 2016; LU et al., 2018; Liu et al., 2019; Xu et al., 2021). These studies showed that biogenic silica formed the opal framework in the early stage and then transformed into a stiff quartz crystal in the later stage resulting in a tight structure. In sample JY9, the biogenic quartz tightly formed with few or no interP pores. The edges of carbonate particles are prone to develop interP pores, which are mainly related to dissolution after the peak stage of oil generation (Wang H. et al., 2019; Nie et al., 2019). Sample WY23-6-6, which has better connectivity, not only develops calcareous laminae but also develops interP pores (Figure 10F). These interP pores connect the dispersed organic matter pores and the lamina fractures, thereby forming a larger effective interconnected pore networks.
Therefore, we propose a connectivity model as shown schematically in Figure 11. The pores of individual particles of organic matter interconnect with each other, but the conductivity of fluid is not high due to the ink-bottle structure. Different organic matters connect mainly through the developed grain-edge fractures to form a three-dimensional pore network and form efficient fluid flow channels through bedding fractures and cracks.
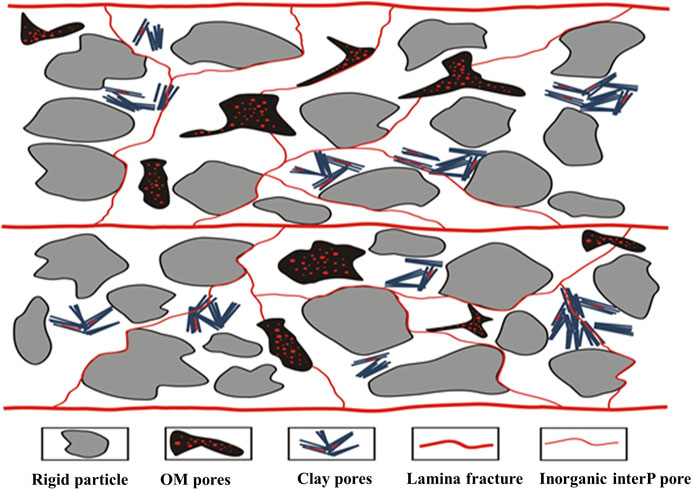
FIGURE 11. Schematic illustration of favorable interconnected pore systems in shales.
Because of the high proportion of pores in the shale matrix, a large proportion of gas would be stored in the matrix inorganic pores as free gas and in the organic pores as adsorbed gas (Pan and Connell, 2015). During the shale gas development, gas needs to be first desorbed from the organic pore walls, diffuse through cracks or the matrix pores containing free gas, and then migrate to the natural and/or hydraulically fractured pore networks, and finally to be produced from the horizontal well via hydraulic fracturing. Therefore, pore connectivity, especially that of the matrix pores, plays a key role in the shale gas production and its long-term production behavior. For shales with pore structures similar to that of samples Sw-1 and JY9, the gas stored in matrix pores may have greater difficulty in flowing to the fracture system to be produced. However, for shales with a pore structure similar to that of sample WY23-6-6, the matrix gas can flow much more easily to the fracture systems during the production.
Three different shales from the Longmaxi Formation, Sichuan Basin, southern China, were investigated with high-resolution 2D and 3D imaging before and after Wood’s metal injection with a maximum injection pressure of 380 MPa, corresponding to pore throat diameters of approximately 5 nm. The following conclusions can be drawn:
1) Micro- or nanocracks and interparticle inorganic pores provide the dominant interconnectivity pathways, while organic matter pores (OM pores) provide the bulk storage space in shales.
2) The mixed shale/mudstone shows an excellent connectivity with the presence of well-developed interparticle pores, capable of effectively connecting ink-bottle-like OM pores.
3) The siliceous shale shows an overall poor connectivity with only a small amount of OM pores immediately adjacent to the micro- and nanofractures displaying interconnectivity.
4) The argillaceous shale contains the most matrix pores and is dominated by plate-like clay mineral pores, which are largely inaccessible.
The original contributions presented in the study are included in the article/Supplementary Material. Further inquiries can be directed to the corresponding author.
LY took part in sample selection, carrying out the experiment, data processing, and draft preparation. KL contributed to method optimization, data interpretation, and manuscript modification. MF was responsible for experiment device design. ZP took part data interpretation with the pore structure.
All claims expressed in this article are solely those of the authors and do not necessarily represent those of their affiliated organizations or those of the publisher, the editors, and the reviewers. Any product that may be evaluated in this article, or claim that may be made by its manufacturer, is not guaranteed or endorsed by the publisher.
Authors LY and MF are employed by SINOPEC.
The remaining authors declare that the research was conducted in the absence of any commercial or financial relationships that could be construed as a potential conflict of interest.
We acknowledge the National Natural Science Foundation of China (nos. 41690133 and 41821002) for their financial support.
The Supplementary Material for this article can be found online at: https://www.frontiersin.org/articles/10.3389/feart.2021.735647/full#supplementarymaterial
Afsharpoor, A., and Javadpour, F. (2018). Pore Connectivity Between Organic and Inorganic Matter in Shale: Network Modeling of Mercury Capillary Pressure. Transp Porous Med. 125 (3), 503–519. doi:10.1007/s11242-018-1132-0
Bahadur, J., Melnichenko, Y. B., Mastalerz, M., Furmann, A., and Clarkson, C. R. (2014). Hierarchical Pore Morphology of Cretaceous Shale: A Small-Angle Neutron Scattering and Ultrasmall-Angle Neutron Scattering Study. Energy Fuels 28 (10), 6336–6344. doi:10.1021/ef501832k
Bahadur, J., Radlinski, A. P., Melnichenko, Y. B., Mastalerz, M., and Schimmelmann, A. (2015). Small-Angle and Ultrasmall-Angle Neutron Scattering (SANS/USANS) Study of New Albany Shale: A Treatise on Microporosity. Energy Fuels 29 (2), 567–576. doi:10.1021/ef502211w
Barrett, E. P., Joyner, L. G., and Halenda, P. P. (1951). The Determination of Pore Volume and Area Distributions in Porous Substances. I. Computations from Nitrogen Isotherms. J. Am. Chem. Soc. 73 (1), 373–380. doi:10.1021/ja01145a126
Bernard, S., Horsfield, B., Schulz, H.-M., Wirth, R., Schreiber, A., and Sherwood, N. (2012). Geochemical Evolution of Organic-Rich Shales with Increasing Maturity: A STXM and TEM Study of the Posidonia Shale (Lower Toarcian, Northern Germany). Mar. Pet. Geology. 31 (1), 70–89. doi:10.1016/j.marpetgeo.2011.05.010
Chen, J., and Xiao, X. (2014). Evolution of Nanoporosity in Organic-Rich Shales During Thermal Maturation. Fuel 129, 173–181. doi:10.1016/j.fuel.2014.03.058
Chen, S., Li, X., Chen, S., Wang, Y., Gong, Z., and Zhang, Y. (2021). A New Application of Atomic Force Microscopy in the Characterization of Pore Structure and Pore Contribution in Shale Gas Reservoirs. J. Nat. Gas Sci. Eng. 88, 103802. doi:10.1016/j.jngse.2021.103802
Clarkson, C. R., Solano, N., Bustin, R. M., Bustin, A. M. M., Chalmers, G. R. L., He, L., et al. (2013). Pore Structure Characterization of North American Shale Gas Reservoirs Using USANS/SANS, Gas Adsorption, and Mercury Intrusion. Fuel 103, 606–616. doi:10.1016/j.fuel.2012.06.119
Comisky, J. T., Santiago, M., Mccollom, B., Buddhala, A., and Newsham, K. E. (2011). “Sample Size Effects on the Application of Mercury Injection Capillary Pressure for Determining the Storage Capacity of Tight Gas and Oil Shales,” in Canadian Unconventional Resources Conference, Calgary, Alberta, November 15–17, 2011. doi:10.2118/149432-MS
Curtis, M. E., Sondergeld, C. H., Ambrose, R. J., and Rai, C. S. (2012). Microstructural Investigation of Gas Shales in Two and Three Dimensions Using Nanometer-Scale Resolution Imaging. Bulletin 96 (4), 665–677. doi:10.1306/08151110188
Davudov, D., and Moghanloo, R. G. (2018). Impact of Pore Compressibility and Connectivity Loss on Shale Permeability. Int. J. Coal Geology. 187, 98–113. doi:10.1016/j.coal.2018.01.008
Desbois, G., Urai, J. L., Hemes, S., Schröppel, B., Schwarz, J.-O., Mac, M., et al. (2016). Multi-scale Analysis of Porosity in Diagenetically Altered Reservoir Sandstone from the Permian Rotliegend (Germany). J. Pet. Sci. Eng. 140, 128–148. doi:10.1016/j.petrol.2016.01.019
Diaz, H. G., Miller, C. K., and Lewis, R. E. (2012). sCore: A Classification Scheme for Organic Mudstones Based on Bulk Mineralogy. AAPG Search Discov. article 40951, 1–18.
Fogden, A., McKay, T., Turner, M., Marathe, R., and Senden, T. (2014). “Micro-CT Analysis of Pores and Organics in Unconventionals Using Novel Contrast Strategies,” in Unconventional Resources Technology Conference (URTeC), Denver, CO, August 25–27, 2014. doi:10.15530/urtec-2014-1922195
Fogden, A., Olson, T., Turner, M., and Middleton, J. (2015). “Dynamic Micro-CT Imaging of Diffusion in Unconventionals,” in Unconventional Resources Technology Conference (URTeC), San Antonio, TX, July 20–22, 2015. doi:10.15530/urtec-2015-2154822
Gao, F., Song, Y., Li, Z., Xiong, F., Chen, L., Zhang, X., et al. (2018). Quantitative Characterization of Pore Connectivity Using NMR and MIP: A Case Study of the Wangyinpu and Guanyintang Shales in the Xiuwu basin, Southern China. Int. J. Coal Geology. 197, 53–65. doi:10.1016/j.coal.2018.07.007
Gu, X., Mildner, D. F. R., Cole, D. R., Rother, G., Slingerland, R., and Brantley, S. L. (2016). Quantification of Organic Porosity and Water Accessibility in Marcellus Shale Using Neutron Scattering. Energy Fuels 30 (6), 4438–4449. doi:10.1021/acs.energyfuels.5b02878
Guanira, K., Valente, T. M., Ríos, C. A., Castellanos, O. M., Salazar, L., Lattanzi, D., et al. (2020). Methodological Approach for Mineralogical Characterization of Tailings from a Cu(Au,Ag) Skarn Type Deposit Using QEMSCAN (Quantitative Evaluation of Minerals by Scanning Electron Microscopy). J. Geochemical Exploration 209, 106439. doi:10.1016/j.gexplo.2019.106439
Hildenbrand, A., and Urai, J. L. (2003). Investigation of the Morphology of Pore Space in Mudstones-First Results. Mar. Pet. Geology. 20 (10), 1185–1200. doi:10.1016/j.marpetgeo.2003.07.001
Horváth, G., and Kawazoe, K. (1983). Method for the Calculation of Effective Pore Size Distribution in Molecular Sieve Carbon. J. Chem. Eng. Jpn. 16 (6), 470–475. doi:10.1252/jcej.16.470
Houben, M. E. (2013). Situ Characterization of the Microstructure and Porosity of Opalinus Clay. Saint-Ursanne, Switzerland: Mont Terri Rock Laboratory. .
Hu, Q., Ewing, R. P., and Dultz, S. (2012). Low Pore Connectivity in Natural Rock. J. Contaminant Hydrol. 133, 76–83. doi:10.1016/j.jconhyd.2012.03.006
Hu, Q., Ewing, R. P., and Rowe, H. D. (2015). Low Nanopore Connectivity Limits Gas Production in Barnett Formation. J. Geophys. Res. Solid Earth 120 (12), 8073–8087. doi:10.1002/2015JB012103
Jubb, A. M., Hackley, P. C., Birdwell, J. E., Hatcherian, J. J., and Qu, J. (2020). Examination of Inertinite Within Immature Eagle Ford Shale at the Nanometer-Scale Using Atomic Force Microscopy-Based Infrared Spectroscopy. Int. J. Coal Geology. 231, 103608. doi:10.1016/j.coal.2020.103608
Keller, L. M., Schuetz, P., Erni, R., Rossell, M. D., Lucas, F., Gasser, P., et al. (2013). Characterization of Multi-Scale Microstructural Features in Opalinus Clay. Microporous Mesoporous Mater. 170, 83–94. doi:10.1016/j.micromeso.2012.11.029
Kelly, S., El-Sobky, H., Torres-Verdín, C., and Balhoff, M. T. (2016). Assessing the Utility of FIB-SEM Images for Shale Digital Rock Physics. Adv. Water Resour. 95, 302–316. doi:10.1016/j.advwatres.2015.06.010
Kibria, M. G., Hu, Q., Liu, H., Zhang, Y., and Kang, J. (2018). Pore Structure, Wettability, and Spontaneous Imbibition of Woodford Shale, Permian Basin, West Texas. Mar. Pet. Geology. 91, 735–748. doi:10.1016/j.marpetgeo.2018.02.001
King, H. E., Eberle, A. P. R., Walters, C. C., Kliewer, C. E., Ertas, D., and Huynh, C. (2015). Pore Architecture and Connectivity in Gas Shale. Energy Fuels 29 (3), 1375–1390. doi:10.1021/ef502402e
Klaver, J., Desbois, G., Littke, R., and Urai, J. L. (2015a). BIB-SEM Characterization of Pore Space Morphology and Distribution in Postmature to Overmature Samples from the Haynesville and Bossier Shales. Mar. Pet. Geology. 59, 451–466. doi:10.1016/j.marpetgeo.2014.09.020
Klaver, J., Desbois, G., Urai, J. L., and Littke, R. (2012). BIB-SEM Study of the Pore Space Morphology in Early Mature Posidonia Shale from the Hils Area, Germany. Int. J. Coal Geology. 103, 12–25. doi:10.1016/j.coal.2012.06.012
Klaver, J., Hemes, S., Houben, M., Desbois, G., Radi, Z., and Urai, J. L. (2015b). The Connectivity of Pore Space in Mudstones: Insights from High-Pressure Wood's Metal Injection, BIB-SEM Imaging, and Mercury Intrusion Porosimetry. Geofluids 15 (4), 577–591. doi:10.1111/gfl.12128
Ko, L. T., Loucks, R. G., Ruppel, S. C., Zhang, T., and Peng, S. (2017). Origin and Characterization of Eagle Ford Pore Networks in the South Texas Upper Cretaceous Shelf. Bulletin 101 (03), 387–418. doi:10.1306/08051616035
Kuila, U., McCarty, D. K., Derkowski, A., Fischer, T. B., and Prasad, M. (2014). Total Porosity Measurement in Gas Shales by the Water Immersion Porosimetry (WIP) Method. Fuel 117, 1115–1129. doi:10.1016/j.fuel.2013.09.073
Kuila, U., and Prasad, M. (2013). Specific Surface Area and Pore-Size Distribution in Clays and Shales. Geophys. Prospecting 61 (2), 341–362. doi:10.1111/1365-2478.12028
Lee, S., Fischer, T. B., Stokes, M. R., Klingler, R. J., Ilavsky, J., McCarty, D. K., et al. (2014). Dehydration Effect on the Pore Size, Porosity, and Fractal Parameters of Shale Rocks: Ultrasmall-Angle X-ray Scattering Study. Energy Fuels 28 (11), 6772–6779. doi:10.1021/ef501427d
Liang, C., Cao, Y., Liu, K., Jiang, Z., Wu, J., and Hao, F. (2018). Diagenetic Variation at the Lamina Scale in Lacustrine Organic-Rich Shales: Implications for Hydrocarbon Migration and Accumulation. Geochimica et Cosmochimica Acta 229, 112–128. doi:10.1016/j.gca.2018.03.017
Liu, G., Zhai, G., Zou, C., Cheng, L., Guo, X., Xia, X., et al. (2019). A Comparative Discussion of the Evidence for Biogenic Silica in Wufeng-Longmaxi Siliceous Shale Reservoir in the Sichuan basin, China. Mar. Pet. Geology. 109, 70–87. doi:10.1016/j.marpetgeo.2019.06.016
Liu, K., and Ostadhassan, M. (2019). The Impact of Pore Size Distribution Data Presentation Format on Pore Structure Interpretation of Shales. Adv. Geo-energy Res. 3 (2), 187–197. doi:10.26804/ager.2019.02.08
Liu, Y., Gupta, R., Sharma, A., Wall, T., Butcher, A., Miller, G., et al. (2005). Mineral Matter-Organic Matter Association Characterisation by QEMSCAN and Applications in Coal Utilisation. Fuel 84 (10), 1259–1267. doi:10.1016/j.fuel.2004.07.015
Liu, Z., Liu, D., Cai, Y., and Qiu, Y. (2021). Permeability, mineral and Pore Characteristics of Coals Response to Acid Treatment by NMR and QEMSCAN: Insights into Acid Sensitivity Mechanism. J. Pet. Sci. Eng. 198, 108205. doi:10.1016/j.petrol.2020.108205
Liu, Z., Liu, D., Cai, Y., Yao, Y., Pan, Z., and Zhou, Y. (2020). Application of Nuclear Magnetic Resonance (NMR) in Coalbed Methane and Shale Reservoirs: A Review. Int. J. Coal Geology. 218, 103261. doi:10.1016/j.coal.2019.103261
Lloyd, R. R., Provis, J. L., Smeaton, K. J., and van Deventer, J. S. J. (2009). Spatial Distribution of Pores in Fly Ash-Based Inorganic Polymer Gels Visualised by Wood's Metal Intrusion. Microporous Mesoporous Mater. 126 (1), 32–39. doi:10.1016/j.micromeso.2009.05.016
Loucks, R. G., Reed, R. M., Ruppel, S. C., and Hammes, U. (2012). Spectrum of Pore Types and Networks in Mudrocks and A Descriptive Classification for Matrix-Related Mudrock Pores. Bulletin 96 (6), 1071–1098. doi:10.1306/08171111061
Lu, L., Qin, J., Shen, B., Tenger, B., and Liu, W. (2018). The Origin of Biogenic Silica in Siliceous Shale from Wufeng-Longmaxi Formation in the Middle and Upper Yangtze Region and its Relationship with Shale Gas Enrichment. Earth Sci. Front. 25 (4), 226–236. doi:10.13745/j.esf.yx.2017-5-5
Ma, L., Taylor, K. G., Lee, P. D., Dobson, K. J., Dowey, P. J., and Courtois, L. (2016a). Novel 3D Centimetre-To Nano-Scale Quantification of an Organic-Rich Mudstone: The Carboniferous Bowland Shale, Northern England. Mar. Pet. Geology. 72, 193–205. doi:10.1016/j.marpetgeo.2016.02.008
Ma, X., Wang, H., Zhou, S., Feng, Z., Liu, H., and Guo, W. (2020). Insights into NMR Response Characteristics of Shales and its Application in Shale Gas Reservoir Evaluation. J. Nat. Gas Sci. Eng. 84, 103674. doi:10.1016/j.jngse.2020.103674
Ma, Y., Pan, Z., Zhong, N., Connell, L. D., Down, D. I., Lin, W., et al. (2016b). Experimental Study of Anisotropic Gas Permeability and its Relationship with Fracture Structure of Longmaxi Shales, Sichuan Basin, China. Fuel 180, 106–115. doi:10.1016/j.fuel.2016.04.029
Mastalerz, M., He, L., Melnichenko, Y. B., and Rupp, J. A. (2012). Porosity of Coal and Shale: Insights from Gas Adsorption and SANS/USANS Techniques. Energy Fuels 26 (8), 5109–5120. doi:10.1021/ef300735t
Mastalerz, M., Schimmelmann, A., Drobniak, A., and Chen, Y. (2013). Porosity of Devonian and Mississippian New Albany Shale across A Maturation Gradient: Insights from Organic Petrology, Gas Adsorption, and Mercury Intrusion. Bulletin 97 (10), 1621–1643. doi:10.1306/04011312194
Mayo, S., Josh, M., Nesterets, Y., Esteban, L., Pervukhina, M., Clennell, M. B., et al. (2015). Quantitative Micro-porosity Characterization Using Synchrotron Micro-CT and Xenon K-Edge Subtraction in Sandstones, Carbonates, Shales and Coal. Fuel 154, 167–173. doi:10.1016/j.fuel.2015.03.046
Meng, M., Ge, H., Shen, Y., Hu, Q., Li, L., Gao, Z., et al. (2020a). The Effect of clay-swelling Induced Cracks on Imbibition Behavior of Marine Shale Reservoirs. J. Nat. Gas Sci. Eng. 83, 103525. doi:10.1016/j.jngse.2020.103525
Meng, M., Ge, H., Shen, Y., Li, L., Tian, T., and Chao, J. (2020b). The Effect of Clay-swelling Induced Cracks on Shale Permeability During Liquid Imbibition and Diffusion. J. Nat. Gas Sci. Eng. 83, 103514. doi:10.1016/j.jngse.2020.103514
Milliken, K. L., Ergene, S. M., and Ozkan, A. (2016). Quartz Types, Authigenic and Detrital, in the Upper Cretaceous Eagle Ford Formation, South Texas, USA. Sediment. Geology. 339, 273–288. doi:10.1016/j.sedgeo.2016.03.012
Milliken, K. L., Rudnicki, M., Awwiller, D. N., and Zhang, T. (2013). Organic Matter-Hosted Pore System, Marcellus Formation (Devonian), Pennsylvania. Bulletin 97 (2), 177–200. doi:10.1306/07231212048
Mokhtari, M., and Tutuncu, A. N. (2016). Impact of Laminations and Natural Fractures on Rock Failure in Brazilian Experiments: A Case Study on Green River and Niobrara Formations. J. Nat. Gas Sci. Eng. 36, 79–86. doi:10.1016/j.jngse.2016.10.015
Nemati, K. M. (2000). Preserving Microstructure of Concrete Under Load Using the Wood’s Metal Technique. Int. J. Rock Mech. Mining Sci. 37 (1), 133–142. doi:10.1016/S1365-1609(99)00099-4
Nie, H., Sun, C., Liu, G., Du, W., and He, Z. (2019). Dissolution Pore Types of the Wufeng Formation and the Longmaxi Formation in the Sichuan Basin, South China: Implications for Shale Gas Enrichment. Mar. Pet. Geology. 101, 243–251. doi:10.1016/j.marpetgeo.2018.11.042
O'Brien, N. R. (1990). Significance of Lamination in Toarcian (Lower Jurassic) Shales from Yorkshire, Great Britain. Sediment. Geology. 67 (1), 25–34. doi:10.1016/0037-0738(90)90025-O
Okolo, G. N., Everson, R. C., Neomagus, H. W. J. P., Roberts, M. J., and Sakurovs, R. (2015). Comparing the Porosity and Surface Areas of Coal as Measured by Gas Adsorption, Mercury Intrusion and SAXS Techniques. Fuel 141, 293–304. doi:10.1016/j.fuel.2014.10.046
Pan, Z., and Connell, L. D. (2015). Reservoir Simulation of Free and Adsorbed Gas Production from Shale. J. Nat. Gas Sci. Eng. 22, 359–370. doi:10.1016/j.jngse.2014.12.013
Peng, S., Zhang, T., Loucks, R. G., and Shultz, J. (2017). Application of Mercury Injection Capillary Pressure to Mudrocks: Conformance and Compression Corrections. Mar. Pet. Geology. 88, 30–40. doi:10.1016/j.marpetgeo.2017.08.006
Ruppert, L. F., Sakurovs, R., Blach, T. P., He, L., Melnichenko, Y. B., Mildner, D. F. R., et al. (2013). A USANS/SANS Study of the Accessibility of Pores in the Barnett Shale to Methane and Water. Energy Fuels 27 (2), 772–779. doi:10.1021/ef301859s
Sang, G., Liu, S., Zhang, R., Elsworth, D., and He, L. (2018). Nanopore Characterization of Mine Roof Shales by SANS, Nitrogen Adsorption, and Mercury Intrusion: Impact on Water Adsorption/retention Behavior. Int. J. Coal Geology. 200, 173–185. doi:10.1016/j.coal.2018.11.009
Schieber, J. (1998). Possible Indicators of Microbial Mat Deposits in Shales and Sandstones: Examples from the Mid-proterozoic Belt Supergroup, Montana. U.S.A. Sediment. Geology 120 (1), 105–124. doi:10.1016/S0037-0738(98)00029-3
Sun, M., Yu, B., Hu, Q., Yang, R., Zhang, Y., and Li, B. (2017). Pore Connectivity and Tracer Migration of Typical Shales in South China. Fuel 203, 32–46. doi:10.1016/j.fuel.2017.04.086
Tan, P., Jin, Y., Han, K., Hou, B., Chen, M., Guo, X., et al. (2017). Analysis of Hydraulic Fracture Initiation and Vertical Propagation Behavior in Laminated Shale Formation. Fuel 206, 482–493. doi:10.1016/j.fuel.2017.05.033
Tan, Y., Pan, Z., Feng, X.-T., Zhang, D., Connell, L. D., and Li, S. (2019). Laboratory Characterisation of Fracture Compressibility for Coal and Shale Gas Reservoir Rocks: A Review. Int. J. Coal Geology. 204, 1–17. doi:10.1016/j.coal.2019.01.010
Tang, X., Jiang, Z., Jiang, S., and Li, Z. (2016). Heterogeneous Nanoporosity of the Silurian Longmaxi Formation Shale Gas Reservoir in the Sichuan Basin Using the QEMSCAN, FIB-SEM, and Nano-CT Methods. Mar. Pet. Geology. 78, 99–109. doi:10.1016/j.marpetgeo.2016.09.010
Tian, H., Pan, L., Xiao, X., Wilkins, R. W. T., Meng, Z., and Huang, B. (2013). A Preliminary Study on the Pore Characterization of Lower Silurian Black Shales in the Chuandong Thrust Fold Belt, Southwestern China Using Low Pressure N2 Adsorption and FE-SEM Methods. Mar. Pet. Geology. 48, 8–19. doi:10.1016/j.marpetgeo.2013.07.008
Vega, B., Dutta, A., and Kovscek, A. R. (2013). CT Imaging of Low-Permeability, Dual-Porosity Systems Using High X-ray Contrast Gas. Transp Porous Med. 101 (1), 81–97. doi:10.1007/s11242-013-0232-0
Wang, C., Zhang, B., Hu, Q., Shu, Z., Sun, M., and Bao, H. (2019a). Laminae Characteristics and Influence on Shale Gas Reservoir Quality of Lower Silurian Longmaxi Formation in the Jiaoshiba Area of the Sichuan Basin, China. Mar. Pet. Geology. 109, 839–851. doi:10.1016/j.marpetgeo.2019.06.022
Wang, H., He, Z., Zhang, Y., Bao, H., Su, K., Shu, Z., et al. (2019b). Dissolution of Marine Shales and its Influence on Reservoir Properties in the Jiaoshiba Area, Sichuan Basin, China. Mar. Pet. Geology. 102, 292–304. doi:10.1016/j.marpetgeo.2018.12.017
Wang, P., Jiang, Z., Chen, L., Yin, L., Li, Z., Zhang, C., et al. (2016a). Pore Structure Characterization for the Longmaxi and Niutitang Shales in the Upper Yangtze Platform, South China: Evidence from Focused Ion Beam-He Ion Microscopy, Nano-Computerized Tomography and Gas Adsorption Analysis. Mar. Pet. Geology. 77, 1323–1337. doi:10.1016/j.marpetgeo.2016.09.001
Wang, X., Wang, M., Li, Y., Zhang, J., Li, M., Li, Z., et al. (2021). Shale Pore Connectivity and Influencing Factors Based on Spontaneous Imbibition Combined with A Nuclear Magnetic Resonance Experiment. Mar. Pet. Geology. 132, 105239. doi:10.1016/j.marpetgeo.2021.105239
Wang, Y., Pu, J., Wang, L., Wang, J., Jiang, Z., Song, Y.-F., et al. (2016b). Characterization of Typical 3D Pore Networks of Jiulaodong Formation Shale Using Nano-Transmission X-ray Microscopy. Fuel 170, 84–91. doi:10.1016/j.fuel.2015.11.086
Washburn, E. W. (1921). The Dynamics of Capillary Flow. Phys. Rev. 17 (3), 273–283. doi:10.1103/physrev.17.273
Wu, J., Yuan, Y., Niu, S., Wei, X., and Yang, J. (2020). Multiscale Characterization of Pore Structure and Connectivity of Wufeng-Longmaxi Shale in Sichuan Basin, China. Mar. Pet. Geology. 120, 104514. doi:10.1016/j.marpetgeo.2020.104514
Xu, H., Zhou, W., Hu, Q., Yi, T., Ke, J., Zhao, A., et al. (2021). Quartz Types, Silica Sources and Their Implications for Porosity Evolution and Rock Mechanics in the Paleozoic Longmaxi Formation Shale, Sichuan Basin. Mar. Pet. Geology. 128, 105036. doi:10.1016/j.marpetgeo.2021.105036
Yang, R., Hao, F., He, S., He, C., Guo, X., Yi, J., et al. (2017a). Experimental Investigations on the Geometry and Connectivity of Pore Space in Organic-Rich Wufeng and Longmaxi Shales. Mar. Pet. Geology. 84, 225–242. doi:10.1016/j.marpetgeo.2017.03.033
Yang, R., He, S., Hu, Q., Sun, M., Hu, D., and Yi, J. (2017b). Applying SANS Technique to Characterize Nano-Scale Pore Structure of Longmaxi Shale, Sichuan Basin (China). Fuel 197, 91–99. doi:10.1016/j.fuel.2017.02.005
Yang, R., He, S., Yi, J., and Hu, Q. (2016). Nano-scale Pore Structure and Fractal Dimension of Organic-Rich Wufeng-Longmaxi Shale from Jiaoshiba Area, Sichuan Basin: Investigations Using FE-SEM, Gas Adsorption and Helium Pycnometry. Mar. Pet. Geology. 70, 27–45. doi:10.1016/j.marpetgeo.2015.11.019
Yao, Y., Liu, D., Tang, D., Tang, S., and Huang, W. (2008). Fractal Characterization of Adsorption-Pores of Coals from North China: An Investigation on CH4 Adsorption Capacity of Coals. Int. J. Coal Geology. 73 (1), 27–42. doi:10.1016/j.coal.2007.07.003
Yawar, Z., and Schieber, J. (2017). On the Origin of Silt Laminae in Laminated Shales. Sediment. Geology. 360, 22–34. doi:10.1016/j.sedgeo.2017.09.001
Yuan, Y., Rezaee, R., Verrall, M., Hu, S.-Y., Zou, J., and Testmanti, N. (2018). Pore Characterization and Clay Bound Water Assessment in Shale with a Combination of NMR and Low-Pressure Nitrogen Gas Adsorption. Int. J. Coal Geology. 194, 11–21. doi:10.1016/j.coal.2018.05.003
Zhang, R., Hou, B., Han, H., Fan, M., and Chen, M. (2019). Experimental Investigation on Fracture Morphology in Laminated Shale Formation by Hydraulic Fracturing. J. Pet. Sci. Eng. 177, 442–451. doi:10.1016/j.petrol.2019.02.056
Zhang, W., Huang, Z., Li, X., Chen, J., Guo, X., Pan, Y., et al. (2020). Estimation of Organic and Inorganic Porosity in Shale by NMR Method, Insights from Marine Shales with Different Maturities. J. Nat. Gas Sci. Eng. 78, 103290. doi:10.1016/j.jngse.2020.103290
Zhao, S., Li, Y., Wang, Y., Ma, Z., and Huang, X. (2019). Quantitative Study on Coal and Shale Pore Structure and Surface Roughness Based on Atomic Force Microscopy and Image Processing. Fuel 244, 78–90. doi:10.1016/j.fuel.2019.02.001
Keywords: shale gas, matrix pores, pore connectivity, wood’s metal, Longmaxi Formation
Citation: Yu L, Liu K, Fan M and Pan Z (2021) Pore Connectivity Characterization Using Coupled Wood’s Metal Intrusion and High-Resolution Imaging: A Case of the Silurian Longmaxi Shales From the Sichuan Basin, China. Front. Earth Sci. 9:735647. doi: 10.3389/feart.2021.735647
Received: 03 July 2021; Accepted: 23 August 2021;
Published: 11 October 2021.
Edited by:
Rui Liu, Southwest Petroleum University, ChinaReviewed by:
Rui Yang, China University of Geosciences Wuhan, ChinaCopyright © 2021 Yu, Liu, Fan and Pan. This is an open-access article distributed under the terms of the Creative Commons Attribution License (CC BY). The use, distribution or reproduction in other forums is permitted, provided the original author(s) and the copyright owner(s) are credited and that the original publication in this journal is cited, in accordance with accepted academic practice. No use, distribution or reproduction is permitted which does not comply with these terms.
*Correspondence: Keyu Liu, bGl1a2V5dUB1cGMuZWR1LmNu
Disclaimer: All claims expressed in this article are solely those of the authors and do not necessarily represent those of their affiliated organizations, or those of the publisher, the editors and the reviewers. Any product that may be evaluated in this article or claim that may be made by its manufacturer is not guaranteed or endorsed by the publisher.
Research integrity at Frontiers
Learn more about the work of our research integrity team to safeguard the quality of each article we publish.