- 1Earth System Science and Departement Geografie, Vrije Universiteit Brussel, Brussels, Belgium
- 2Water Problems Institute, Russian Academy of Sciences, Moscow, Russia
- 3FRC SSC RAS, Sochi, Russia
- 4Tien Shan High Mountain Research Center, National Academy of Science of the Kyrgyz Republic, Bishkek, Kyrgyzstan
- 5Research Center for Ecology and Environment of Central Asia, Bishkek, Kyrgyzstan
- 6Cryolithology and Glaciology Department, Geographical Faculty, Lomonosov Moscow State University, Moscow, Russia
- 7Institute of Geography, Russian Academy of Science, Moscow, Russia
- 8National Research University “Higher School of Economics”, Faculty of Geography and Geoinformation Technologies, Moscow, Russia
The mean specific mass balance of a glacier represents the direct link between a glacier and the local climate. Hence, it is intensively monitored throughout the world. In the Kyrgyz Tien Shan, glaciers are of crucial importance with regard to water supply for the surrounding areas. It is therefore essential to know how these glaciers behave due to climate change and how they will evolve in the future. In the Soviet era, multiple glaciological monitoring programs were initiated but these were abandoned in the nineties. Recently, they have been re-established on several glaciers. In this study, a reconstruction of the mean specific mass balance of Bordu, Kara-Batkak and Sary-Tor glaciers is obtained using a surface energy mass balance model. The model is driven by temperature and precipitation data acquired by combining multiple datasets from meteorological stations in the vicinity of the glaciers and tree rings in the Kyrgyz Tien Shan between 1750 and 2020. Multi-annual mass balance measurements integrated over elevation bands of 100 m between 2013 and 2020 are used for calibration. A comparison with WGMS data for the second half of the 20th century is performed for Kara-Batkak glacier. The cumulative mass balances are also compared with geodetic mass balances reconstructed for different time periods. Generally, we find a close agreement, indicating a high confidence in the created mass balance series. The last 20 years show a negative mean specific mass balance except for 2008–2009 when a slightly positive mass balance was found. This indicates that the glaciers are currently in imbalance with the present climatic conditions in the area. For the reconstruction back to 1750, this study specifically highlights that it is essential to adapt the glacier geometry since the end of the Little Ice Age in order to not over- or underestimate the mean specific mass balance. The datasets created can be used to get a better insight into how climate change affects glaciers in the Inner Tien Shan and to model the future evolution of these glaciers as well as other glaciers in the region.
Introduction
High Mountain Asia (HMA) comprises several glacierised mountain ranges such as the Himalayas, Karakoram, Pamir and Tien Shan. It contains the highest concentration of glaciers outside the polar areas (Rounce et al., 2020). According to Farinotti et al. (2019), approximately 7,000 km3 of ice is stored in these mountain ranges, which is the largest ice volume on Earth outside the polar regions and Alaska. These large ice volumes are key for the streamflow regimes of rivers and summer freshwater provision for the surrounding densely populated arid lowlands of countries such as China, India, Kyrgyzstan, Kazakhstan, and Uzbekistan. Hence, these mountain ranges are considered the water towers of Asia (Chen et al., 2016). However, despite the large importance of glaciers in HMA, information about their actual state, behaviour and evolution remains scarce (Farinotti et al., 2015). Furthermore, the lack of consistent long-term temporal and spatial monitoring inhibits gaining insight into the mechanisms driving glacier changes.
One of the most frequently used indicators of climate change is the glacier-wide mean mass balance, or mean specific mass balance, which is determined by the sum of all processes adding mass to the glacier (accumulation) and all processes removing mass from the glacier (ablation) during 1 year (Zemp et al., 2013). The mean specific mass balance depends on the climate, but also on the glacier geometry. Techniques for measuring and monitoring glacier mass balances have expanded over the last century from in situ point measurements, which require an extensive field campaign, to remote sensing and modeling approaches, mainly based on satellite measurements (e.g., Brun et al., 2017; Davaze et al., 2020; Sommer et al., 2020; Barandun et al., 2021; Miles et al., 2021; Thomson et al., 2021) and unoccupied aerial vehicle (UAV) measurements (Van Tricht et al., 2021; Vincent et al., 2021).
The Tien Shan, a mountain range stretching over 3,000 km, covers regions from the east of Uzbekistan to Kyrgyzstan and from south-eastern Kazakhstan to Xinjiang in China. This glaciated mountain range has about 15,000 glaciers and covers a surface area of around 12,300 km2 (Barandun et al., 2020). In this mountain range, multiple glacier mass balance monitoring sites were established in the mid-1950s during the period of the USSR (e.g., Dikikh, 1982; Makarevich et al., 1984; Glazirin, 1985; Makarevich et al., 1985; Dyurgerov et al., 1995). However, almost all of these observation programmes were abandoned during the (early) 1990s. In 2010, in situ glacier observations were reinitiated by different international projects such as Capacity Building and Twinning for Climate Observing Systems (CATCOS), Central Asian Water (CAWa), Cryospheric Climate Services for improved Adaptation (CICADA) and Contribution to High Asia Runoff from Ice and Snow (CHARIS) (Hoelzle et al., 2017; Satylkanov, 2018). Consequently, the number of glaciers under observation in Kyrgyzstan has been steadily increasing. However, significant gaps of in situ measurements between the mid-1990s to around 2010 hinder interpretations of long-term trends. Therefore, mass balances are typically reconstructed using models for glaciers in the area, such as for Abramov glacier (Barandun et al., 2015, 2018; Kronenberg et al., 2021), Glacier No. 354 (Kronenberg et al., 2016; Barandun et al., 2018), Batysk Sook glacier (Kenzhebaev et al., 2017), Golubin glacier (Kronenberg et al., 2016; Barandun et al., 2018), and others.
In this study, we reconstruct the annual and the historical mean specific mass balance of Bordu glacier (WGMS ID. 829), Kara-Batkak glacier (WGMS ID. 813) and Sary-Tor glacier (WGMS ID. 805), all located in the Inner Tien Shan, between 1750 and 2020 with a surface energy mass balance model. The model is forced with precipitation and temperature observations as well as with tree ring proxies. A Little Ice Age (LIA) glacier geometry is reconstructed for each glacier based on detectable positions of frontal and lateral moraines to represent the glacier state at the end of the LIA. The model is calibrated using observed mass balances integrated in elevation bands of 100 m for the 2013–2020 period. A detailed comparison is made between the modelled mass balances and the observed mass balances as well as with geodetic mass balances for different time periods (Cogley, 2009; Pieczonka and Bolch, 2015; Brun et al., 2017; Goerlich et al., 2017; Shean et al., 2020).
Selected Glaciers and Data
Bordu, Kara-Batkak and Sary-Tor Glaciers
The Bordu, Kara-Batkak and Sary-Tor glaciers are located in the Inner Tien Shan, south of lake Issyk-Kul, in Kyrgyzstan (Figure 1). While Bordu and Sary-Tor glaciers are situated on the north-western slopes of the Ak-Shyirak massif, Kara-Batkak glacier is located in the Terskey Ala-Too range (Figure 1). More specifically, Bordu and Sary-Tor glaciers are located close to the Kumtor Gold Mine in the valleys east of Glacier No. 354 (Kronenberg et al., 2016). Both glaciers have an elevation range between 3,900 and 4,800 m above sea level (a.s.l.) and consist of one large glacier tongue with smaller hanging tributaries. For Sary-Tor glacier, the hanging glacier on the eastern side is not considered in this study (Figure 1).
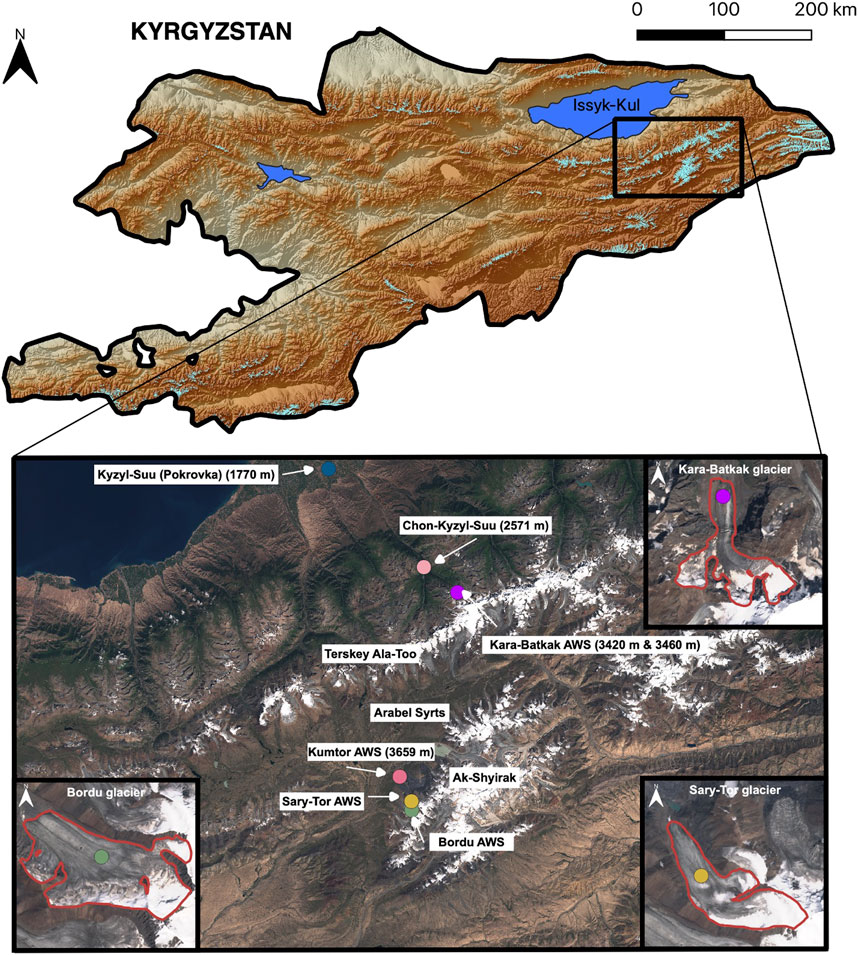
FIGURE 1. Location of the automatic weather stations (AWS) on and nearby the respective glaciers used in this study. The satellite image is a composite Sentinel-2 true colour image from 11–13 August 2019.
Ice thickness measurements on Sary-Tor glacier were performed revealing a maximum ice thickness of 159 m and an ice volume of 0.135 km3 (Petrakov et al., 2014). Based on the reflectivities from the radar measurements, the Sary-Tor glacier is assumed to be a polythermal glacier containing temperate ice over the bed (Petrakov et al., 2014). Regarding Bordu glacier, ice thickness measurements in 2017 showed ice thicknesses of up to 148 m with an estimated ice volume of 0.291 km3 (Van Tricht et al., 2021). The Kara-Batkak glacier (spanning 3,300–4,400 m a.s.l.) consists of a terminus part and several flat areas separated by steep icefalls, while the accumulation area is divided into three separate catchments. Ice thickness measurements on this glacier revealed a maximum ice thickness of 114 m and an ice volume of 0.096 km3 in 2017 (Van Tricht et al., 2021).
Mass Balance Measurements
The three selected glaciers have been subject to different glaciological measurements. Between 1984 and 1989, mass balance (MB) measurements were performed on Sary-Tor glacier and used to estimate the total balance in the entire Ak-Shyirak (Ushnurtsev, 1991; Dyurgerov et al., 1995). However, in 1990, all measurements were interrupted. In 2014, detailed MB measurements were reinitiated by the Tien Shan High Mountain Scientific Research Center as part of the CHARIS Project (Satylkanov, 2018). MB measurements on Bordu glacier were started in 2015 and are continued today. The Kara-Batkak glacier is one of the few glaciers in the area with a relatively large amount of data with a mean specific mass balance series dating back to 1957 (Dyurgerov et al., 1995; WGMS, 2020). However, between 1998 and 2013, glaciological measurements were interrupted. For the 1957–1998 period, MB calculations on Kara-Batkak glacier were made based on a vertical precipitation gradient for accumulation and a combination of stake measurements on the glacier snout as well as measurements of liquid runoff at a gauge at the meltwater lake near the glacier terminus. Hence, the mass balance data of 1957–1998 are associated with a larger uncertainty compared to direct measurements. In 2013, glaciological measurements were reinitiated (Satylkanov, 2018).
For all three glaciers, the present-day annual measurements consist of density, ablation stake and snow pit measurements at the end of the summer season, as well as measurements of snow depth and density from snow pits for the winter balance at the end of spring (typically in May). The latter generally shows the amount of snow between the end of summer and the end of spring as little or no melt occurs on the glaciers during winter months. Although in theory only the surface mass balance is measured in this way, we consider it as mass balance values, since basal and internal mass balance are assumed to be generally much smaller compared to the surface mass balance. All the point measurements are then extrapolated to mean specific mass balance values for 100 m elevation bands taking into account the area of the elevation bands (Figure 2). Eventually, the mean specific mass balance for the entire glacier is calculated as the weighted mean of all these banded values, using their areas as weights (Figure 3). One of the main error sources in these data is due to the calculation of the mass balance in the upper bands (> 4,200 m a.s.l. for Kara-Batkak glacier and >4,400 m a.s.l. for Bordu and Sary-Tor glaciers) as these elevations are often unreachable due to crevasses and the risk for avalanches. Hence, accumulation, ablation and mass balance in these areas are typically assessed, based on the available data from other bands, sparse measurements, from transient snowline dynamics, and from temporal trends of the glaciers as a whole.
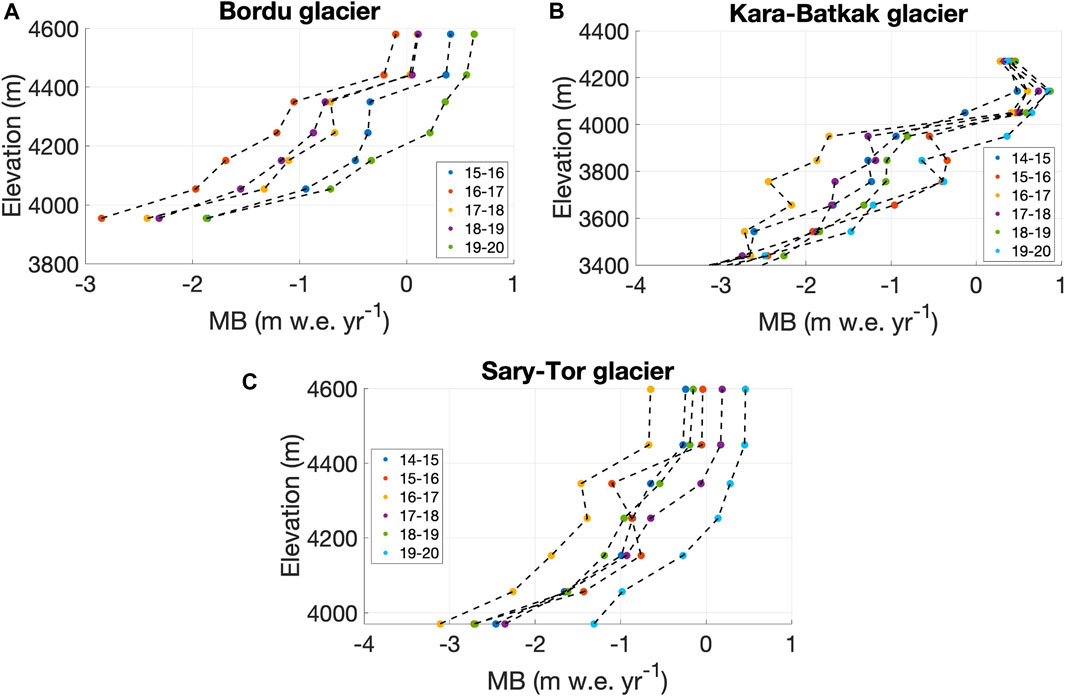
FIGURE 2. Mass balance (MB) profiles of the different years covered since the re-initiation of the measurements on the glaciers considered in this study, averaged in bands of 100 m. Data are retrieved from the WGMS (2020).
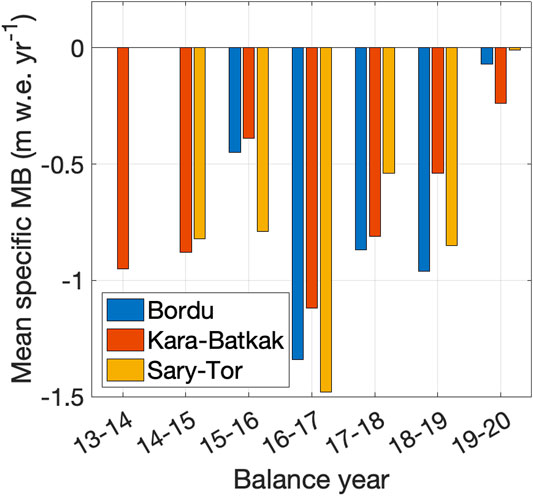
FIGURE 3. Annual mean specific mass balance (MB) of the different glaciers since the re-initiation of the monitoring programmes (in m w.e. yr−1).
Reconstruction of Historical Climate Datasets
The climate regime in the Inner Tien Shan is characterised by a strong seasonal variation in precipitation and low air temperatures. Precipitation increases during spring and reaches a maximum during summer. Between May and September, about 75% of the annual precipitation occurs (Aizen, 1995; Kutuzov and Shahgedanova, 2009). During winter, the Siberian high over the area brings cold and dry air masses with very limited precipitation (Aizen, 1995). Therefore, accumulation peaks in spring and prolongs to early summer, when the precipitation increases, and temperatures remain low. In summer, air temperatures rise above zero creating unfavorable conditions for snow accumulation. However, the frequent (snow) showers observed in summer temporarily create a snow layer reducing the melt (in particular for the higher areas) substantially. Hence, the selected glaciers are considered examples of spring-accumulation type glaciers (Yang et al., 2013). This type of glaciers has a significantly larger sensitivity to warming compared to winter-type glaciers. Warming on spring- and summer-accumulation type glaciers prolongs the melting season, causes a significant reduction in snow accumulation due to an increased fraction of liquid precipitation, and decreases the surface albedo (Fujita and Ageta, 2000).
The surface energy mass balance model applied in this study is driven by temperature and precipitation data at hourly resolution. To reconstruct a continuous historical dataset covering 1750–2020 for the location of the glaciers, several temperature and precipitation datasets are combined by establishing correlations between overlapping periods. This reconstruction is described in the sections below. The locations of the consulted meteorological stations are shown in Figure 1. Two separate datasets are prepared. One for the Kumtor-Tien Shan meteorological station (used for Bordu and Sary-Tor glaciers) and one for Chon-Kyzyl-Suu meteorological station (used for the Kara-Batkak glacier) (see Figure 4). The used data is summarised in Table 1. Data from the local glacier meteorological stations which were installed recently, are used to find the lapse rate and atmospheric transmissivity which is discussed further below.
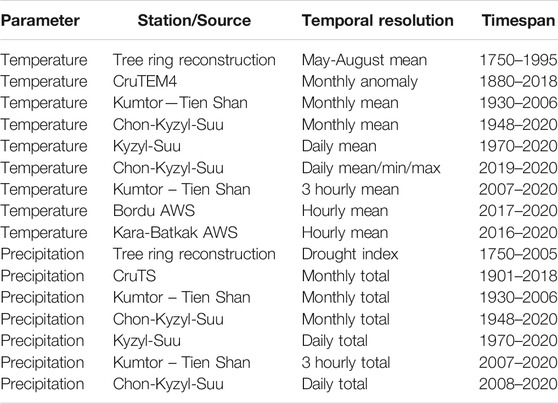
TABLE 1. Temperature and precipitation datasets and timespans included in this study. Kumtor-Tien Shan, Chon-Kyzyl-Suu and Kyzyl-Suu are three (automatic) weather stations.
Meteorological Datasets for Kumtor–Tien Shan
To represent the meteorological conditions on Bordu and Sary-Tor glaciers, a temperature and precipitation dataset is created for Kumtor-Tien Shan. The Kumtor-Tien Shan station is located at the foot of the Ak-Shyirak massif, in the Arabel Syrts (high plateaus) (see Figure 1). The station has a data record going back to 1930 with monthly mean temperatures and monthly total precipitation (Table 1). It has been used for a large number of studies so far because of its very high location in the middle of the Inner Tien Shan (Dyurgerov et al., 1995; Khromova et al., 2003; Kronenberg et al., 2016; Petrakov et al., 2016; Kenzhebaev et al., 2017; Rybak et al., 2019). Since February 1, 2005, temperature and precipitation are measured at 3 hourly time steps but the data records appear to be mostly continuous from the summer of 2006 onwards. The current meteorological station is operated by the Kumtor Gold Company and located at the mining site at 3,659 m a.s.l. In August 1996, the meteorological station was transferred to a location approximately 2.5 km to the southeast of the former station (Petrakov et al., 2016; Kenzhebaev et al., 2017). In addition to the displacement in distance, the meteorological station was shifted from the valley bottom (3,614 m a.s.l.) to a more elevated site on the valley flank (3,659 m a.s.l) (Engel et al., 2012).
Since the relocation, temperatures at Kumtor appear to be substantially higher, especially during the coldest months. This is most likely caused by the present-day position of the meteorological station on the valley flank. Especially at night, dense cold air sinks to the bottom of the valley, resulting in lower temperatures, particularly during winter. To correct for this relocation and to obtain a homogenised historical dataset for the present-day location, temperature measurements before and after the transfer are correlated with the nearby meteorological station of Kyzyl-Suu (former Pokrovka), located approximately 50 km northwards (see Figure 1). A bias correction is applied to all the data before August 1996 to have a consistent dataset for the present-day location of the meteorological station. No correction is made for precipitation as it is assumed that precipitation differences over such a short distance and height difference are limited. The climatic diagram of the Kumtor-Tien Shan station for the period 1991–2020 is shown in Figure 4A, in which it is also compared with the Chon-Kyzyl-Suu station (Figure 4B).
To extend the 3 hourly data from the Kumtor-Tien Shan station (2007–2020) (Table 1) into the past, the 3 hourly values of the dataset covering 13 years are repeated in the past up to 1750. These values are then adjusted to match the monthly means of Kumtor-Tien Shan (1930–2006), CruTEM (Climatic Research Unit gridded land-based TEMperature database) (1881–1929) (Jones et al., 2012) and the monthly temperatures inferred from tree rings (1750–1880) (Solomina et al., 2014). To reconstruct May-August temperature (1750–1995), Solomina et al. (2014) used a maximum latewood density chronology, a measure of the peak density of latewood cells in a tree ring chronology, obtained from Picea schrenkiana, at multiple high and low elevation sites in the Central Tien Shan. Solomina et al. (2014) also used maximum density of spruce rings from Kara-Batkak, Sarykungey and Saryimek valleys (58 cores). The resulting reconstructed mean May-August temperatures are then scaled such that the mean and standard deviation matches the dataset at Kumtor-Tien Shan for the overlapping period of 30 years. To reconstruct monthly temperatures, the anomaly regarding the May-August temperature is then repeated for the other months, making the anomaly the same for all months in a particular year. To obtain a smooth transition between the temperature reconstructions from the different datasets, all temperature data are converted into anomalies with respect to overlapping periods and scaled by the ratio of standard deviations between the two subsequent datasets.
A similar procedure is applied for the precipitation data. The 3 hourly data (precipitation sums) from 2007–2020 are repeated in the past and scaled to match the monthly sums measured at Kumtor-Tien Shan (1930–2006), from CruTS (Climatic Research Unit gridded Time Series) (1901–1929) (Harris et al., 2014) and reconstructed from a drought index from tree ring reconstructions (1750–1900) (Solomina et al., 2014). Solomina et al. (2014) used the drought coefficient combining temperature and precipitation of the warm period for the current and previous year (June-September). Finally, an hourly dataset is created by linearly interpolating the 3 hourly temperatures and by equally spreading the 3 hourly precipitation sums over the hour intervals.
The average annual temperature obtained in this way shows a clear increase since the beginning of the 20th century (Figures 5A,B). A temporary stabilization followed in the 1970s, but since the 21st century temperatures have been rising faster again. The annual precipitation sums do not indicate a clear trend although the average annual precipitation in the 19th century seems to have been lower (Figures 5C,D). The average precipitation at Kumtor-Tien Shan over the entire period is 314 mm with a standard deviation of 70 mm (22%), which is relatively high (Pritchard, 2019), likely related to the convective nature of the summer precipitation.
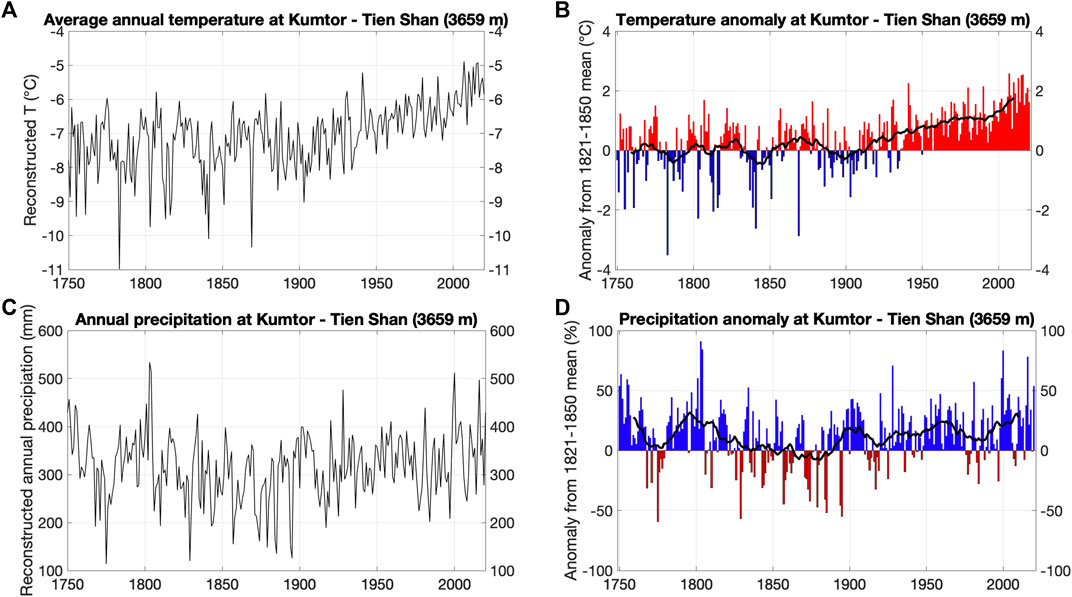
FIGURE 5. Upper panels: Reconstructed and measured annual temperatures (A) and temperature anomalies (B) (from the 1821–1850 mean, assumed as the coldest period at the end of the LIA) at the Kumtor–Tien Shan meteorological station. Lower panels: Reconstructed and measured annual precipitation (C) and precipitation anomalies (D) (from the 1821–1850 mean) at the Kumtor–Tien Shan meteorological station.
Meteorological Datasets for Chon-Kyzyl-Suu
For Kara-Batkak glacier, we consider Chon-Kyzyl-Suu as the base station for the MB model. The Chon-Kyzyl-Suu station is located in the extended Kara-Batkak glacier valley at 7 km from the glacier terminus, at an elevation of 2,571 m a.s.l (see Figure 1). It has been operational since 1948 (although observations temporarily ceased when the USSR fell apart). Due to additional large data gaps in this Chon-Kyzyl-Suu weather station data for the last decade, we use the same Kumtor-Tien Shan 3 hourly dataset for the period 2007–2020. The data is scaled to the Chon-Kyzyl-Suu location by finding a temperature correlation between both datasets for 1948–2006. As such, temperatures in Chon-Kyzyl-Suu are obtained from the Kumtor-Tien Shan station using (TChon-Kyzyl-Suu = 0.85 * TKumtor-TienShan + 6) with an R2 of 0.94. The presence of a slope different from 1 in this relation indicates that there is another factor besides height alone that leads to temperature differences between the two stations. Differences in cloudiness, which are very prominent in the region (Aizen et al., 1995), and shading are expected to be responsible for additional temperature differences between both stations, as they can strongly influence temperature differences in mountainous areas (Barry, 2008). Like the Kumtor-Tien Shan dataset, this period with 3 hourly data is repeated in the past up to 1750. The values are then adjusted to match the monthly means of Chon-Kyzyl-Suu (1948–2006), CruTEM (1881–1947) and from tree rings (1750–1880).
For precipitation, we rely on a daily precipitation dataset of Chon-Kyzyl-Suu (2008–2020). The daily sums are divided by 8 to spread these into 3-hourly precipitation sums. The latter is repeated up to 1750 and scaled to match the (reconstructed) monthly totals of Chon-Kyzyl-Suu (1948–2007), CruTS (1901–1947) and from the drought index from Solomina et al. (2014) (1750–1900). Similar to the Kumtor-Tien Shan dataset, the 3-hourly values are then converted into hourly values by equally spreading over hourly intervals.
Despite the lower altitude, the average annual amount of precipitation is significantly higher in Chon-Kyzyl-Suu compared to Kumtor- Tien Shan (622 vs 314 mm). This is because this weather station is located on the north side of the Terksey Ala-Too and this area catches more precipitation coming from the north, additionally enhanced by the influence of the large Issyk-Kul Lake providing moisture (Figures 1, 6C). A similar trend in the average annual temperatures as for the Kumtor-Tien Shan station can be observed (Figures 5, 6).
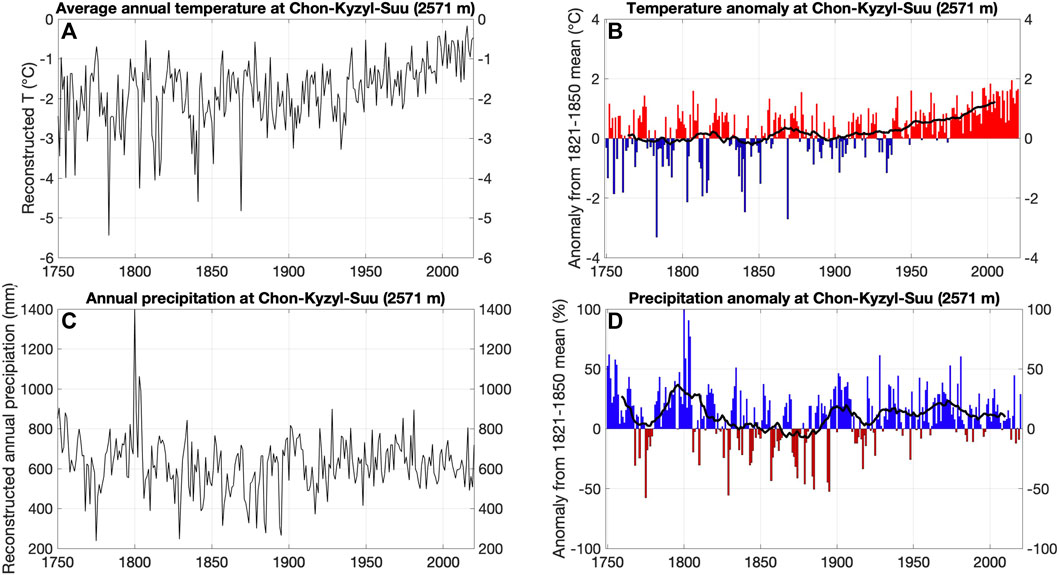
FIGURE 6. Upper panels: Reconstructed and measured annual temperatures (A) and temperature anomalies (B) (from the 1821–1850) at the Chon-Kyzyl-Suu meteorological station. Lower panels: Reconstructed and measured annual precipitation (C) and precipitation anomalies (D) (from the 1821–1850) at the Chon-Kyzyl-Suu meteorological station.
Little Ice Age in the Kyrgyz Tien Shan
The causes and exact timing of the Little Ice Age (LIA) and the maximum extent of glaciers in Kyrgyzstan remain uncertain. In the Tien Shan, the LIA moraines are believed to be typically located a few hundred metres ahead of the glacier terminus and characterised by little to no vegetation cover, massive piling of loose tills and sharp-crested ridges (Solomina et al., 2004; Li et al., 2017). Often, several moraine ridges belong to the LIA, indicating different stages of glacial stagnation within this period.
Obtained lichenometric dates of the LIA moraines range between the 17th to mid-19th century and can be roughly divided into three advancing phases, around 1400–1500, 1700–1750 and 1800–1850 (Savoskul and Solomina, 1996; Solomina et al., 2004). Later, some smaller advances occurred again around 1870–1890, 1910–1930 and 1940–1950. These periods correspond nicely with the meteorological data showing a dip in temperature (negative anomaly) for these periods (Figures 5B, 6B).
In the Terskey Ala-Too, the mountain range in which Kara-Batkak glacier is located, the majority of terminal and lateral moraines formed during the (mid-)19th century and the latest significant advance was dated to the 1910s (Solomina et al., 2004; Kutuzov and Shahgedanova, 2009). Dating of moraines suggests that concerning Kara-Batkak, the maximum LIA extent likely occurred in the first half of the 19th century (Solomina et al., 2004; Li et al., 2017). This seems to be in line with the reconstructed temperature dataset which shows a last major dip around 1850 and two smaller dips around 1910 and 1940 (last periods of advance) (Figures 5B, 6B).
Methods
Mass Balance Equation
A two-dimensional time-dependent surface energy mass balance model is used to model the mass balance in a typical fixed balance year (1 October–30 September). The main equation that is solved is the mass balance equation which corresponds to the sum of mass gain and mass loss for each grid cell (25 m × 25 m) at every time step (in this study every hour):
As shown by Eq. 1, the mass balance at every new time step Bt+1 (m w.e.) is the sum of the mass balance at the previous timestep (Bt), the accumulation or solid precipitation at that timestep (Ps,t) (m w.e.) and the ablation or melt (Mt) (m w.e.), which is determined by the net energy flux per unit area at the glacier surface Ψ (W m−2) (see Energy Balance Equation). Regarding ablation, the retention of meltwater in the snowpack, e.g., by capillary forces or by refreezing, is an important process since it delays and reduces runoff and bare ice exposure (Janssens and Huybrechts, 2000). Hence, ablation in the model consists of runoff rather than purely melt. When no snowpack is present, the runoff over the glacier surface equals the amount of melt (Eq. 1), which instantly runs off the surface such that ablation equals melt. When a snowpack is present, however, not all of this melt instantly generates runoff since part of it is retained in the snowpack. In this case the amount of ablation is reduced by the amount of water which is retained in the snowpack (Rw). In the model, it is assumed that all snowmelt remains in the snowpack until it saturates a maximum fraction of the snow depth (Pmax) (Table 2). We take the latter to be equal to 0.6 (Reeh, 1991; Janssens and Huybrechts, 2000). Hence, mass is only lost when meltwater is not retained in the firn/snow. At every time step, the snow depth and the amount of retained water are updated.
Other contributing accumulation processes, such as snow drift or avalanches (Turchaninova et al., 2019), or mass removing processes, such as sublimation (Che et al., 2019), may have a substantial influence on the local mass balance, but are not included in the model due to a lack of data. E.g., a study by Turchaninova et al. (2019) showed that for Kara-Batkak glacier, avalanches can have a contribution of 10% to the accumulation (in 2015–2016), but especially along the margins of the terminal part.
Energy Balance Equation
The amount of ablation or melt at every time step is calculated using an energy balance model. In this model, the energy fluxes between the glacier and the atmosphere are calculated at every time step. The total energy flux from the atmosphere to the glacier is represented by:
Ψ is determined by the flux of the incoming shortwave solar radiation Qin (W m−2), the albedo or reflectivity of the surface (α) and the atmospheric transmissivity (τ). The term [C0 + C1 × Tair] represents the other (air temperature dependent) components of the radiation balance, i.e. the sum of the longwave radiation balance and the turbulent sensible heat exchange, linearised around the melting point. Tair is the 2 m air temperature (°C), C0 and C1 are tuning parameters which are calibrated for each glacier (see Calibration of the Model and Calibrated Values for C0, C1 and Meteorological Gradients). The first term (1 − α) ∗ τ ∗ Qin or net incoming shortwave radiation is usually the dominant term in Eq. 2. The air temperature dependent fluxes are of intermediate magnitude.
To calculate the incoming solar radiation at every grid cell, it is split up into a direct and a diffuse part, such that a distinction can be made between shaded and non-shaded grid cells. Non-shaded grid cells receive direct solar radiation as well as scattered or diffuse solar radiation, whereas shaded grid cells only receive the diffuse part of the incoming solar radiation. Partitioning the diffuse and direct radiation for each glacier is difficult since no observations of cloud cover are available. Therefore, we implement a typical value of 0.4 for the fraction of diffuse radiation (Table 2) (Voloshina, 2002). Next to that, the amount of incoming diffuse radiation depends on the solar elevation angle. The amount of incoming direct radiation, however, also depends on the angle between the solar rays and the surface. This angle is determined from the slope and aspect of the surface (at 25 m resolution), as well as the solar azimuth. The transmissivity is considered to be constant, at 0.57, which is determined by a comparison between measurements of incoming radiation on Bordu glacier and theoretical incoming radiation at the top of the atmosphere. This value indirectly takes cloud effects into account as the value for clear sky is typically much higher (Voloshina, 2002).
Surface albedo has been proven to be critical for the glacier surface energy balance in the Tien Shan (Che et al., 2019). In this study, the surface albedo is parametrised following Oerlemans and Knap (1998). For every time step, the albedo of snow is calculated using Eq. 3:
Where αfirn is the albedo of firn (0.5), αfrsnow is the albedo of fresh snow (0.75), derived from measured values of the weather station on Bordu glacier and a recent study on glacier albedo in the area (Petrakov et al., 2019). tsnow is the time since the last snowfall event (in number of days) and t* is the e-folding time scale determining how fast the snow albedo approaches the albedo of firn after a snowfall event (21.9 days) (Oerlemans and Knap, 1998). Subsequently, the albedo is determined based on the snow depth (d) through:
where αice is the albedo of bare ice and d* is the characteristic snow depth. Because the glaciers in the Inner Tien Shan are characterised by a high natural dust content (Fujita et al., 2011; Petrakov et al., 2019), as a result of aeolian transport of dust from the deserts and semi-deserts of Central-Asia, the albedo of ice is set at 0.25. This rather low value is confirmed by measurements on Sary-Tor glacier (Petrakov et al., 2019; Rybak et al., 2019) and Grigoriev Ice Cap, which is located nearby (Fuijita et al., 2011), as well as on other glaciers in the area (Voloshina, 2002). d* is set at 3 mm w.e. which was derived for the dry snow season (Brock et al., 2000; Chen et al., 2014). This value is rather low, which appears to be necessary to ensure a sufficiently large albedo during the dry winter months with a thin snowpack on the glaciers in the Inner Tien Shan. Changes in albedo with respect to the temperature at which the snow fell (Giesen and Oerlemans, 2010) and the presence of retained meltwater or accumulation of dirt (Constantin et al., 2020) which might have an important effect locally are not included in the model. The other variables and all constants used in the model are listed in Table 2.
Temperature and Precipitation Forcing
The model is forced at every time step using the temperature and precipitation data from the reconstructed dataset (see Meteorological Datasets for Kumtor–Tien Shan and Meteorological Datasets for Chon-Kyzyl-Suu). For every time step, the air temperature for every grid cell covering the glacier is determined from the air temperature at the nearby meteorological station (Tref in °C), with an elevation Href (m a.s.l.), by interpolating to the elevation of the grid cell (Hsur in m a.s.l.) and using a temperature lapse rate γT (°C m−1), as shown by Eq. 5. The lapse rate is determined for every glacier individually by comparing the measured temperatures of nearby meteorological stations for overlapping periods or are it is taken from the literature (see Calibrated Values for C0, C1 and Meteorological Gradients).
The precipitation at each grid cell on the glacier (Psur in m w.e.) is determined from the hourly precipitation at the nearest reconstruction site (see Reconstruction of Historical Climate Datasets) (Pref,t in m w.e.), by scaling it up to the elevation of the grid cell, through multiplication with a dimensionless scaling factor Pratio (Eq. 6). This scaling factor is determined by the vertical precipitation gradient γP (m w.e. m−1 y−1), the elevation difference between every grid cell and the station, and the yearly precipitation at the nearby meteorological station (Pref,y m w.e. y−1) (Eq. 7).
Accumulation in the model is determined by the amount of solid precipitation (snow). The air temperature is used to determine whether precipitation is solid (adding mass to the glacier) or liquid. Typically, the transition from snow to rain occurs at temperatures between 1 and 2°C. To account for this uncertainty, the snow fraction is linearised around Ts (set equal to 1.5°C) with a transition range of 2° (Barandun et al., 2018; Barandun et al., 2021) (Eqs. 8–10). Hence, below 0.5°C, all precipitation falls as snow, and above 2.5°C, it is all liquid. The fraction of solid precipitation (Ps) is therefore calculated using the following expression:
Geometric Input for the Model
In addition to temperature and precipitation of a nearby location, a Digital Elevation Model (DEM) and a glacier outline are input data for the model. Glacier outlines consist of RGIv6.0 outlines (RGI, 2017), updated using manual delineation on optical satellite data from Sentinel-2 with a spatial resolution of 10 m. The high-resolution DEMs from DigitalGlobe/maxar stereo satellite imagery (HMA DEM) are selected to represent the surface elevation (Shean et al., 2020). The limited number of gaps in these DEMs (occurring in the shaded and steep areas and locally also in the accumulation area) are filled using cubic spline interpolation. To increase the accuracy of the frontal elevation and glacier outline, the HMA DEMs are updated in the frontal area of Bordu and Sary-Tor glaciers using UAV derived Digital Surface Models (DSMs) from 2017 (Bordu) and 2019 (Sary-Tor) (see Table 3) derived from Mavic Pro (Bordu) and DJI Phantom 4 Pro (Sary-Tor) UAV images in the Pix4D software. A slight Gaussian filter is applied to smooth the transition between the HMA and the UAV DSMs.
Reconstruction of Little Ice Age Glacier Geometry
To reconstruct the historical glacier mean specific mass balance since 1750, it is important to take into account the change in glacier geometry. Since the LIA, the glaciers lost a significant fraction of their glacier tongue. This effect needs to be considered to avoid over- or underestimation of the mean specific mass balance in the past. Therefore, the LIA glacier geometry is reconstructed for the three glaciers.
First, the 2D LIA glacier extent is identified and delineated on satellite images and DEMs, using visible end and lateral moraines attributed to the LIA (Pellitero et al., 2015; Carrivick et al., 2019). For the areas where a lateral moraine can only be observed on one side of the valley, the glacier extent is matched by elevation on the opposite side, following Carrivick et al. (2019). Next, the LIA 3D surface is reconstructed by interpolating the elevations of the end and lateral moraines on both sides of the former ablation tongues (Carrivick et al., 2012, 2019). The interpolated elevation is curved with a smooth parabolic shape with the height of the central glacier axis being approximately 10 m higher than the sides of the glacier. We have no data that support significant geometry changes in the accumulation area. Therefore, in the present-day accumulation area, above the visible lateral moraines, the geometry is kept unchanged, such that the reconstructed height of the LIA surface attaches to the current accumulation area at the equilibrium line (EL). The LIA DEM is then slightly smoothed to have a continuous surface. While for Bordu and Kara-Batkak glaciers, the moraines can easily be identified on recent satellite images, for Sary-Tor glacier, the lateral moraines are inferred from Landsat satellite images from 1999 because the Kumtor concession was extended beyond the former terminal part in recent years. Therefore, the original bedrock and moraine can no longer be recognised (on current satellite images).
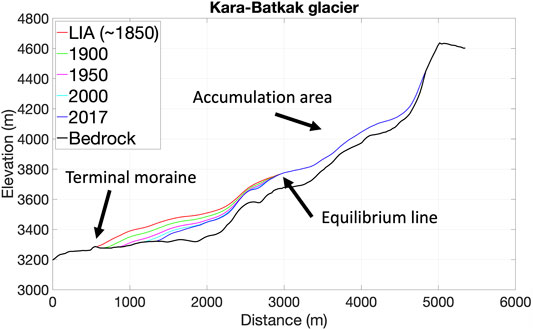
The historical reconstruction of the LIA surface shows that at the end of the LIA, the glaciers were substantially larger with a glacier tongue stretching hundreds of metres into their respective valleys (Figure 7). On average, the three glaciers lost about 30% of their area and 40–50% of their volume since the end of the LIA (Table 4). These values are close to those found for glaciers in the Central Tien Shan (Li and Li, 2014). Furthermore, the decline in glacier area and volume has accelerated in recent decades as more recent estimates have shown larger relative declines (Aizen et al., 2007; Chen et al., 2016).
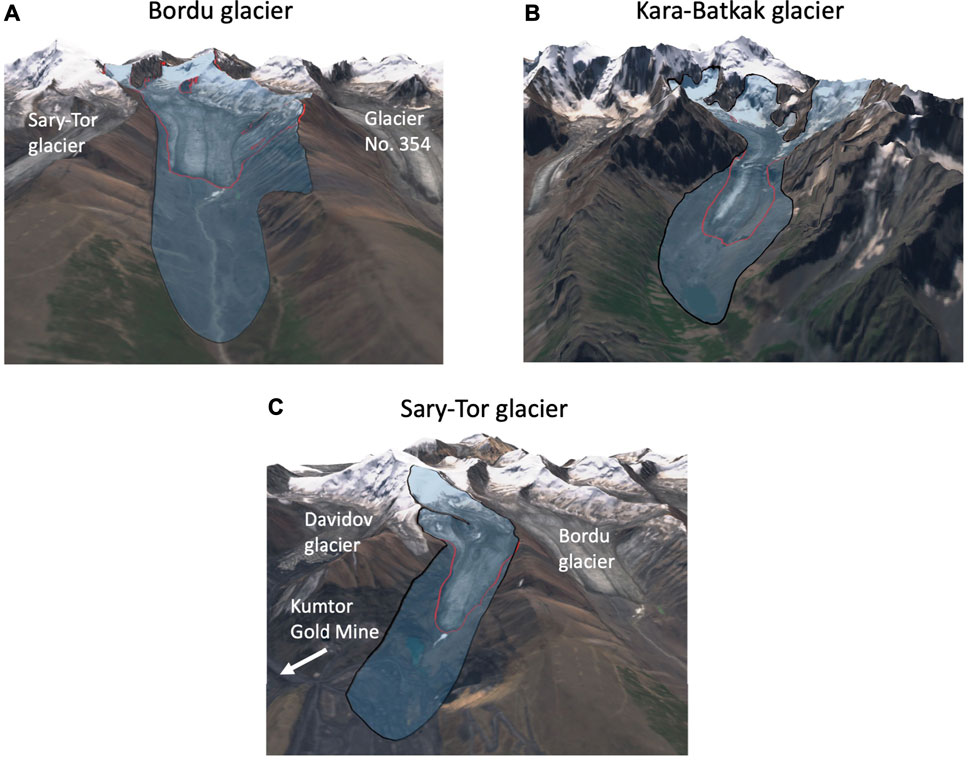
FIGURE 7. LIA glacier surfaces of the three studied glaciers (blue colour). The present-day glacier outline is indicated in red. The LIA outline is indicated in black.

TABLE 4. Characteristics of the LIA glacier geometries. The LIA corresponds to the year 1850, the loss is up to the year 2017.
To obtain the glacier’s elevation at every individual year between 1850 (assumed as the end of the LIA, see Little Ice Age in the Kyrgyz Tien Shan) and 2017, the surface elevation is gradually adjusted. To do this, the total elevation difference for each glacier is calculated by subtracting the LIA DEM from the recent DEM. Then, a second order equation is derived for the total elevation difference on each point on the glacier as a function of its current elevation. This equation is then used for the entire LIA glacier outline. Subsequently, for every year between 1850 and 2017, an annual elevation difference is subtracted by dividing these total elevation differences by the number of years (167). Once the bedrock (for the areas outside the current glacier extent) or present-day surface is reached, the elevation is no longer adjusted. A limitation of this procedure is that temporary glacier advances between 1850 and 2020 are not represented (Aizen et al., 2007), nor are accelerations in the decline of glacier size. Furthermore, before the assumed end of the LIA, the glacier size might have fluctuated, but, the LIA geometry is held constant at its maximum extent before 1850 (Figure 8).
Calibration of the Model
Calibration of the model is done for accumulation and ablation separately. Calibration of the accumulation in the model consists of tuning the precipitation gradient, such that the modelled and observed values of winter balance correspond optimally for the different available balance years (Bordu: 2015–2020, Sary-Tor: 2014–2020, Kara-Batkak: 2013–2020). The precipitation gradient is tuned by minimizing the mismatch between the total amount of precipitation during the winter season and the winter balance data of the different glaciers. The winter balance data of the lowest bands are mostly an underestimation of the total amount of precipitation because not all of the precipitation between September and May occurs in solid state at the lower altitudes and because there might occur some ablation as well. Hence, we use all bands except the lowest two for the minimization procedure. The highest bands are also treated with caution as the accumulation and ablation values in these areas consist mainly of approximations as these regions are often inaccessible for measurements (see Mass Balance Measurements).
Then, the constants C0 (W m−2) and C1 (W m−2 °C−1) in Eq. 2 are calibrated to establish a bulk relation simulating the effects of the air temperature dependent fluxes, which determine the ablation. An increase in C0 shifts the net surface energy flux up or down. An increase in C1 also leads to an increase in the surface energy flux, but in addition determines the influence of temperature on the energy flux. The higher C1, the steeper this gradient, with highest energy fluxes at lower elevations where temperatures are higher. Hence, the calibration consists of finding the optimal combination of C0 and C1, such that the Root Mean Square Error (RMSE) between the observed and modelled mean specific mass balance is minimal for both the individual 100 m bands as well as for the glacier wide mean specific mass balance. Hence, RMSEtot is minimised following:
with n the number of bands, y the number of years, MBmod,gl the modelled glacier wide mean specific mass balance, MBmod,b the modelled mean specific mass balance for each 100 m band, MBmeas,gl the measured glacier wide mean specific mass balance and MBmeas,b the measured mean specific mass balance for each 100 m band.
Estimation of Model Uncertainty
To have an estimate of the uncertainty of the modelled mass balances, each of the three main determining factors (model parameter values, meteorological input data and observational data uncertainty) is examined. The uncertainty of the modelled mass balances affected by the choice of the model parameters is assessed by running the model 1,000 times for the calibration period with a set of parameters that differ from the original ones (see Table 2). Within the interval of possible parameter values, random values are assigned for each run. Subsequently, the distribution of the modelled mean specific mass balance is analysed, and the standard deviation (σpar) is used as a metric for the uncertainty. In the altered parameter sets, the values for the albedos are varied with [±0.05], the transmissivity is varied with [±0.05], corresponding to the interannual variability in incoming solar radiation caused by varying cloud conditions (Giesen et al., 2008), the temperature lapse rate is varied with [±1°C km−1] and the precipitation gradient is varied with [±25%]. All the other parameters are varied with ±5%.
Secondly, the uncertainty associated with the meteorological input data is assessed by running the model over the calibration period and perturbating the temperature data with [±0.5°C] and the precipitation data with [±25%] at every time step for 1,000 runs. Likewise, the standard deviation of all the modelled mass balances is used as a metric for the uncertainty (σclim).
The third contributing factor is the uncertainty related to the observational data against which the tuning parameters are calibrated. It comprises limitations related to the (individual) in-situ mass balance measurements, as well as to subsequent inter- and extrapolation procedures. The main limitation associated with the in-situ glaciological measurements is the data scarcity in the accumulation area. Regarding the subsequent calculation, the partitioning into elevation bands and the use of a stratigraphic system for the mass balance measurements is the main source of error. The latter is due to the fact that the model runs from 1 October–30 September while the mass balance measurements always refer to two consecutive summer surfaces. The estimated accuracy of the measured mass balances is overall ca ± 0.15 m w.e. yr−1, but this increases to ±0.30 m w.e. yr−1 in the areas where a reduced number of measurements can be performed (accumulation areas). To estimate the uncertainty related to the calibration data, the model is calibrated 100 times using randomly perturbed input mass balance data based on assigned uncertainty intervals. Subsequently, the model is run for the found range of optimal C0 values, while keeping C1 fixed, and the standard deviation of the modelled mass balances is used as metric for the calibration uncertainty (σcal).
It is clear that the largest uncertainty arises from the chosen value of the model parameters and the least from the perturbed temperature and precipitation data (see Table 5). This means that the evolution of the mass balance over time can be regarded as robust. The uncertainty with regard to the calibration data lies in between the two uncertainties and is rather small. Considering all the above components together using the error law of addition, the combined total uncertainty is estimated at ± 0.28 m w.e. yr−1 for Bordu glacier, ± 0.27 m w.e. yr−1 for Sary-Tor glacier and ±0.31 m w.e. yr−1 for Kara-Batkak glacier for each year (see Table 5). These values are in line with other studies performed on glaciers in the area (Kronenberg et al., 2016; Kenzhebaev et al., 2017).

TABLE 5. Uncertainty of the modelled mass balances. σpar: uncertainty to varying parameter values, σclim: uncertainty to meteorological input data, σcal: uncertainty to input data for calibration, σmod: total model uncertainty (all values are in m w.e.).
The historical reconstruction of the cumulative mass balance has an additional uncertainty component related to the changing 3D LIA surface between 1850 and 2017. At the start and end year, we assume that the uncertainty related to the reconstruction is limited and we only consider the uncertainty related to the reconstructed DEM over time. For all years (y) between 1850 and 2017, the uncertainty is set equal to (σrec):
such that the uncertainty increases the further away from both end years. Using this method, we find a maximum additional uncertainty of ±0.25 m w.e. yr−1 in 1933–1934.
Results
Calibrated Values for C0, C1 and Meteorological Gradients
The calculated average lapse rate for Kara-Batkak glacier based on the local meteorological stations is −5.2°C km−1 (Table 6), which is close to the value found in Satylkanov (2018). Regarding Bordu and Sary-Tor glaciers, the period under observation of the meteorological stations is too short for an accurate estimation of γT. Therefore, we use a value of −6.0°C km−1 for these glaciers, based on Aizen et al. (1995). Besides, this value was also used by Rybak et al. (2019) for modeling Sary-Tor glacier and lies between the values used for Batysh-Sook glacier (Kenzhebaev et al., 2017) and Glacier No. 354 (Kronenberg et al., 2016), which are located nearby.

TABLE 6. Calibrated values for the precipitation gradients (Yp and Yp2 - see in the table for the abbreviation), the critical elevation (Hcrit), the temperature gradient, C0 and C1 for the different glaciers. For Kara-Batkak glacier, a precipitation reduction factor is adopted between 3,750 and 4,000 m a.s.l.
The found precipitation gradients (Table 6) correspond to the rates found in Aizen et al. (1995). In this research, γP appeared to be 0.6 mm w.e. m−1 for Bordu glacier, 0.5 mm w.e. m−1 for Sary-Tor glacier and 0.3 mm w.e. m−1 for Kara-Batkak glacier. The smaller value for Kara-Batkak glacier may be due to the more closed nature of the valley in which it is located compared to the more exposed position of the weather station (Chon-Kyzyl-Suu).
Above a critical elevation (Hcrit) (Table 6), a decreasing amount of precipitation is implemented to correctly reconstruct the observed MB values with the model. Therefore, precipitation in these areas is calculated using Eq. 15:
Such a negative precipitation gradient in the upper area of a glacier has already been reported for some inner alpine regions (Grünewald and Lehning, 2011) and Central Asian glaciers in particular (Giesen and Oerlemans, 2012). The phenomenon of upper parts of high mountains being drier than the lower slopes can generally be attributed to depletion of precipitable water from the uplifted air mass along the slope (Houze, 2012; Grünewald et al., 2014). For Batysh-Sook glacier, which is located nearby, a linear decrease in accumulation above 4,400 m was also adopted, attributed to wind processes relocating snow and hampering accumulation (Kenzhebaev et al., 2017). Hence, these processes are indirectly included in the calibrated precipitation gradients.
The very large negative gradient for Kara-Batkak Glacier (−4 mm w.e. m−1) (Table 6) is likely also caused by the steepness of the terrain in the highest elevation bands, limiting accumulation. However, the lack of measurements in this area remains a crucial point of uncertainty. Nevertheless, the small size of this highest area of this glacier ensures that the impact of these precipitation amounts is small. Furthermore, concerning Kara-Batkak glacier, between 3,750 and 4,000 m a.s.l, precipitation is not subject to “growth with altitude” due to a combination of steepness and local circulation patterns. As such, a parabolic precipitation reduction factor based on elevation with a minimum of 0.6 is used to match the modelled with the observed accumulation for these elevations.
The calibrated value of 24 W m−2 °C−1 for C1 (Table 6) lies within the range of [8.4–40.5 W m−2 °C−1] found by Giesen and Oerlemans (2012) in a study about the applicability of a similar surface energy mass balance model for glaciers in different climatic regions driven by automatic weather station data. However, the C0 values found in this study are very negative (Table 6). Nevertheless, (substantial) parameter corrections (e.g., a very low value of τ) were also needed to capture the mass balance of Central Asian glaciers and glaciers in a dry climate in the study of Giesen and Oerlemans (2012). One of the possible mechanisms they proposed to explain this was a too low albedo change to sufficiently reduce the melt rate in dry climates. As such, in this study, the parameters for the temperature-dependent fluxes need to be adjusted to oppose a higher and more realistic value for τ, and correctly reproduce the mass balance. Hence, the very low values for C0 found in this study are not entirely unexpected. In addition, another way in which the issues of the low albedo change have been resolved in this study is the use of a low value for d* (see Energy Balance Equation).
Furthermore, it is noticeable that the values of C0 and C1 for the three glaciers (and especially for Bordu and Sary-Tor glaciers) are rather similar. This suggests that these values are relatively constant in the region. In contrast, the meteorological gradients (especially the precipitation gradient) are more variable and constraining these is more complex. Such climatological variability was also observed in a recent study of Barandun et al. (2021) which revealed a complex climate-glacier interplay in the study area. This likely hampers the model to be applied for glaciers for which there are no or insufficient quality observations to tune the gradients.
Modelled Mass Balance Profiles and Mean Specific Mass Balance
We find a close correspondence between modelled and measured mass balances (Table 7). It should be noted, however, that the mass balance model is always applied to the period 1 October–30 September, while mass balance measurements were sometimes carried out earlier. This might explain larger inter-annual differences between the model and the measurements for some individual years (e.g., Sary-Tor in 2015/16, Kara-Batkak in 2017/18) (Table 7). E.g., for Kara-Batkak glacier in 2018/19, the mass balance was already measured in August while in September a significant amount of ablation was found with the model (see Figure 12B). The largest difference between the modelled and measured glacier wide mean specific mass balance is +0.44 m w.e. for Sary-Tor glacier in 2015/16. In this balance year, the overestimation is caused by the less negative MB between 4,200 and 4,400 m a.s.l. (Figure 9).
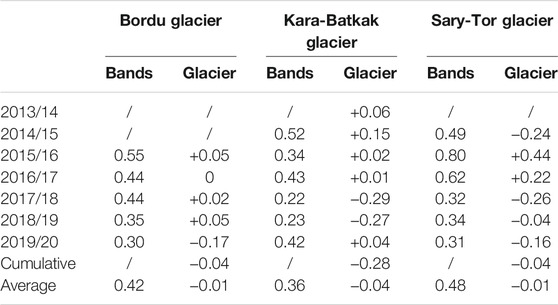
TABLE 7. RMSE values between modelled and observed mean specific mass balance in individual bands (Bands) and difference between the modelled and observed glacier wide mean specific mass balance (Glacier). Values are in m w.e. yr−1.
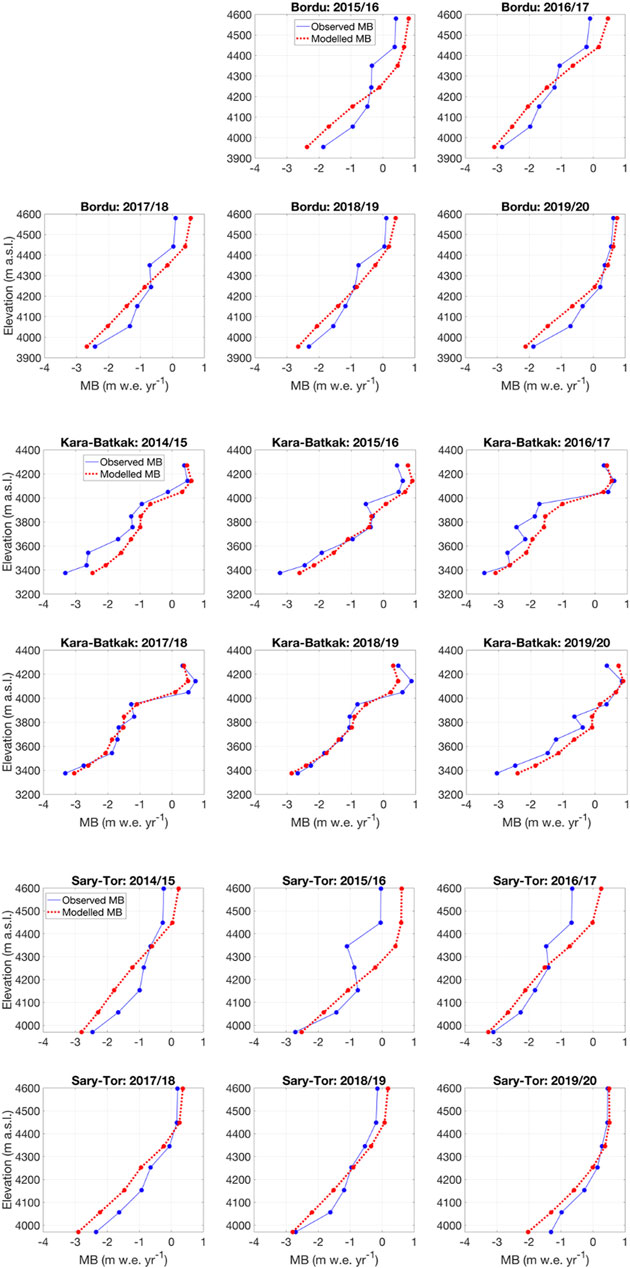
FIGURE 9. Panels with modelled and observed mass balance (MB) in bands of 100 m with interpolations in-between for the three glaciers and for the balance years under consideration (values in m w.e. yr−1).
The graphs (Figure 9) show the measured and modelled mass balance profile for every individual balance year for the three glaciers. Average values for each 100 m band are interpolated to obtain a profile. In general, there is a clear correspondence between the modelled and observed profile. However, for some bands in certain years there are larger deviations (e.g., band 3,900–4,000 m a.s.l. for Kara-Batkak glacier in 2015/16), but this is mainly due to the (inter-annual) variability of the measured profiles. For other years there is an almost complete agreement between measured and modelled mass balance values (e.g., Bordu glacier in 2019/20).
By adding up the local specific mass balance multiplied by grid cell area for each grid cell that covers the glacier and dividing this sum by the surface area of the glacier, the glacier wide mean specific mass balance is determined (Figure 10). Also, for the mean specific mass balance, there is a close agreement between the measured and modelled values. The small deviations that are present in certain years are eliminated when the cumulative sum is determined over the period of observation, as shown by the modelled cumulative mass balance, which is very close to the observations for all three glaciers. Only for Kara-Batkak glacier, there is a relatively small underestimation at the end of the period. However, this is mainly due to the 2017/18 and 2018/19 balance years in which the modelled mean specific mass balance is lower than the measured value. It is striking that Kara-Batkak was the only glacier in Kyrgyzstan with a less negative mean specific mass balance in 2018/19 compared to 2017/18 (WGMS, 2020), which is likely caused by the early measurement of the summer balance in August 2019.
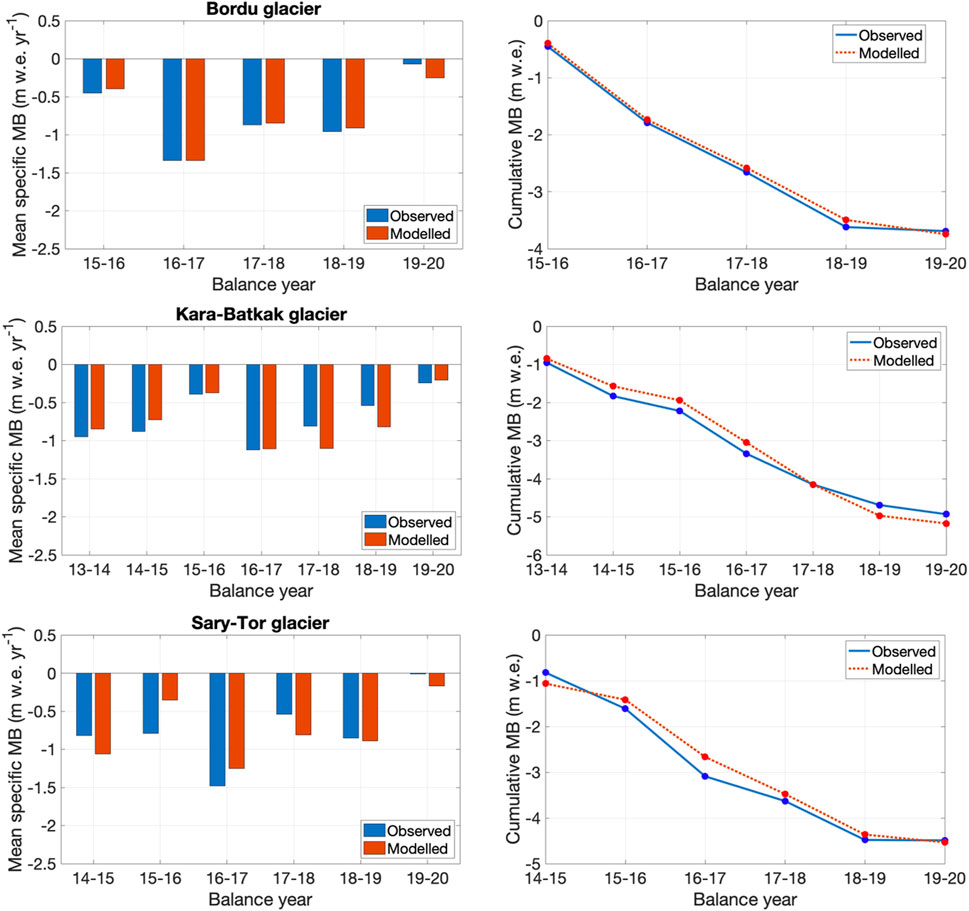
FIGURE 10. Left panels: Modelled and observed mean specific mass balance (MB) for every balance year (in m w.e. yr−1). Right panels: Cumulative mean specific mass balance for the corresponding period (in m w.e.).
The maps with the average mass balance clearly show that the three glaciers have a small accumulation area (MB > 0) and a large ablation area (MB < 0) (Figure 11). For the years under consideration, the average accumulation area ratios (AAR) were 0.36 for Bordu glacier, 0.41 for Sary-Tor glacier and about 0.51 for Kara-Batkak glacier. For the latter, this value was about 0.7 in the 1970s (Kutuzov and Shahgedanova, 2009), which indicates that the EL rose significantly. The small AAR values indicate that the three glaciers are currently all out of balance with the present meteorological conditions.
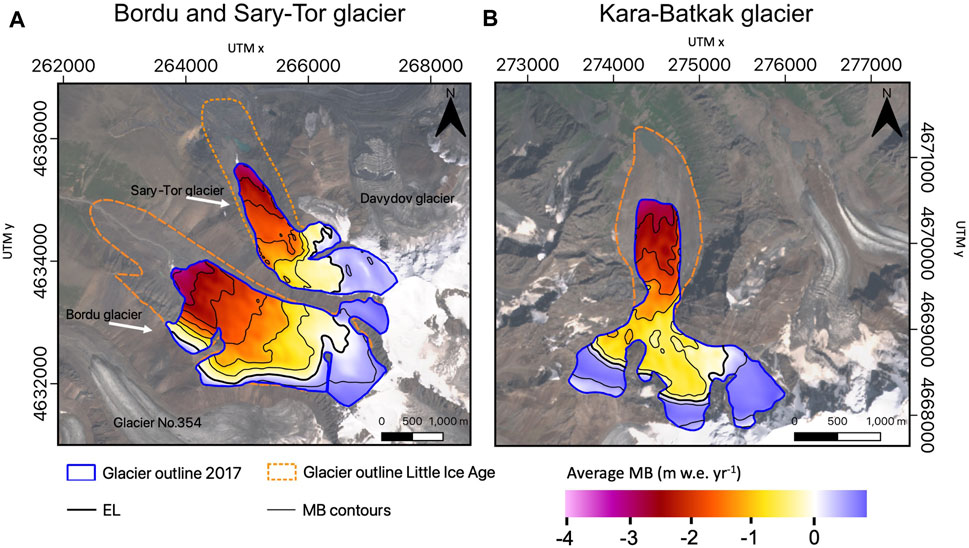
FIGURE 11. Modelled average (of the years for which data is available) mass balance (MB) of the different glaciers. The thick black line indicates the average equilibrium line (MB = 0). Contours are added for every 0.5 m w.e. yr−1. The satellite images are Sentinel-2 true colour images from August 11, 2019.
Annual Mean Mass Balance Evolution
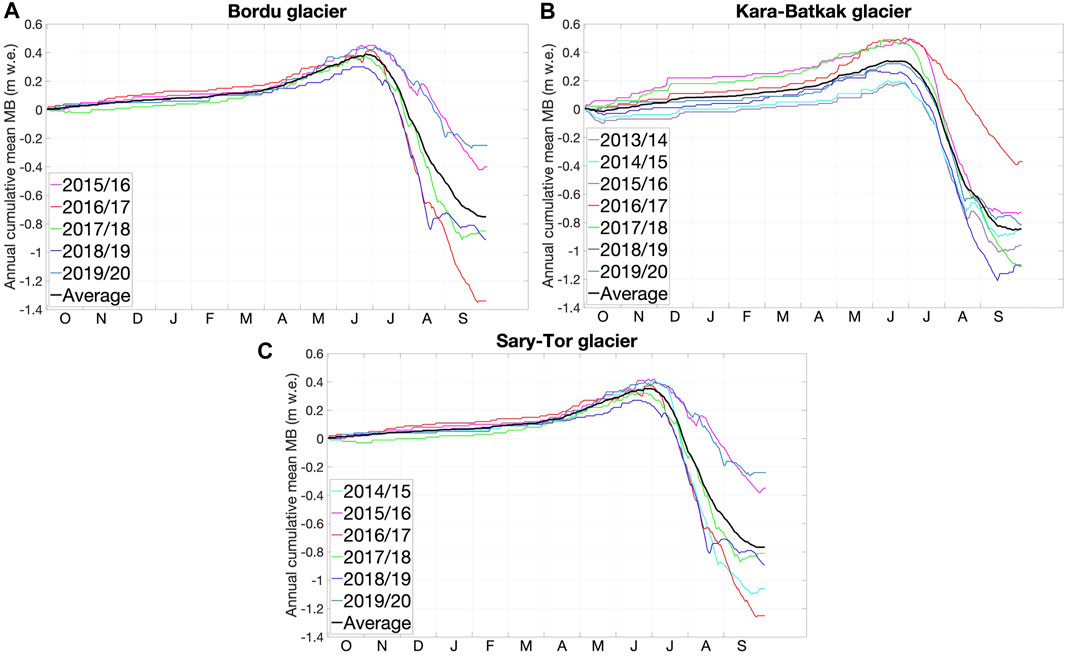
To reveal the path of the cumulative mean mass balance throughout a given balance year, we investigate the evolution from day to day (Figure 12). Little happens between October and March. The cumulative mean mass balance increases slightly due to some snow events but remains relatively close to zero. This is attributed to the blockage of the Siberian high, which provides cold but predominantly dry weather during winter. Between April and early July, the cumulative mean mass balance increases substantially and rapidly. This is due to precipitation episodes that largely fall as snow on the glacier surface. The ablation season especially occurs throughout July and August, resulting in a strong decrease of the cumulative mean mass balance. In September, the amount of ablation decreases with in general by the middle to end of September a minimum in the mass balance. Hence, the glaciers can be considered as examples of the spring-accumulation type with a prolonging accumulation to the early summer period (June). It is also clear that measuring the mass balance in August usually leads to an underestimation of the amount of melt during the ablation season because in general, the cumulative mean mass balance continues to decrease into September (Figure 12).
Comparison With WGMS Mass Balance (1958–1998) for Kara-Batkak Glacier
The comparison with the WGMS data from Kara-Batkak glacier between 1958 and 1998 (see Mass Balance Measurements) shows an acceptable agreement for the results with the adjusting DEM since the LIA (Mean Absolute Error (MAE) = 0.20 m w.e. yr−1, Root Mean Square Error (RMSE) = 0.32 m w.e. yr−1) (Figure 13). The largest differences are found for 1984/85 and 1985/86 for which the mean specific mass balance in the WGMS dataset appears to be very low (< −1.50 m w.e. yr−1), and for 1996/97 for which the mean specific mass balance in the WGMS dataset is very high compared to the data of Tuyuksu glacier, the nearest glacier with MB measurements (Hoelzle et al., 2017). It must be stressed that the mean specific mass balance data in the WGMS dataset were reconstructed based on the water level of the proglacial lake of Kara-Batkak glacier and assumptions on the precipitation gradient, which are very likely accompanied by a substantial error margin. In addition, for the years with the largest deviations, the WGMS data is not consistent with the temperature and precipitation data of those years and their relationship to the other years. Nevertheless, the agreement between model results and the WGMS data is acceptable by the end of the measurement period (1998). There is a difference in cumulative mean specific mass balance of only −4.93 m w.e. which corresponds to −0.12 m w.e. yr−1. Further, the decrease towards a more negative mass balance from 1976 onwards is clearly represented by the model results using the adjusting geometry. It is also clear that the use of the current glacier geometry or LIA geometry would over- or underestimate the cumulative mass balance substantially (Figure 13).

FIGURE 13. (A) WGMS and modelled (using adjusting geometry) mean specific mass balance (MB) between 1958 and 2020. A gap of the measured mean specific mass balances is present for 1998–2013. (B) WGMS and modelled cumulative mean specific mass balance between 1958 and 2020. The thin lines represent the uncertainty range taking into account uncertainty in model parameter values, meteorological input data and mass balance data for calibration. For the run with the adjusting DEM, also the uncertainty regarding the adjusting geometry was considered.
Historical Cumulative Mean Specific Mass Balance
The curve obtained with the adjusting geometry lies midway between the version with the LIA geometry and the current geometry, from around 1880–1900 onwards (Figure 14). For Kara-Batkak, the separation of the LIA DEM version and the adjusting DEM version starts later (Figure 14B), which is caused by the slower retreat between 1850–1900 due to a large ice thickness of the LIA glacier front. For the curves with the adjusting geometries and the fixed LIA DEM, a slight decrease of the cumulative mass balance can already be recognised between 1750 and 1850. This might be due to an overestimation of the glacier geometry in this period. A closer inspection revealed that especially at the front of the glaciers, the modelled MB in this period was negative, leading to a mean specific MB just below 0 m w.e yr−1. Probably, the glacier geometry around 1750 was somewhat smaller than the LIA maximum, such that the real curve between 1750 and 1850 is most likely located between the 2017 version and the LIA version with hence an almost zero cumulative mean specific mass balance. As a result, the cumulative value obtained in 2020 for the adapting geometry may be slightly too negative.
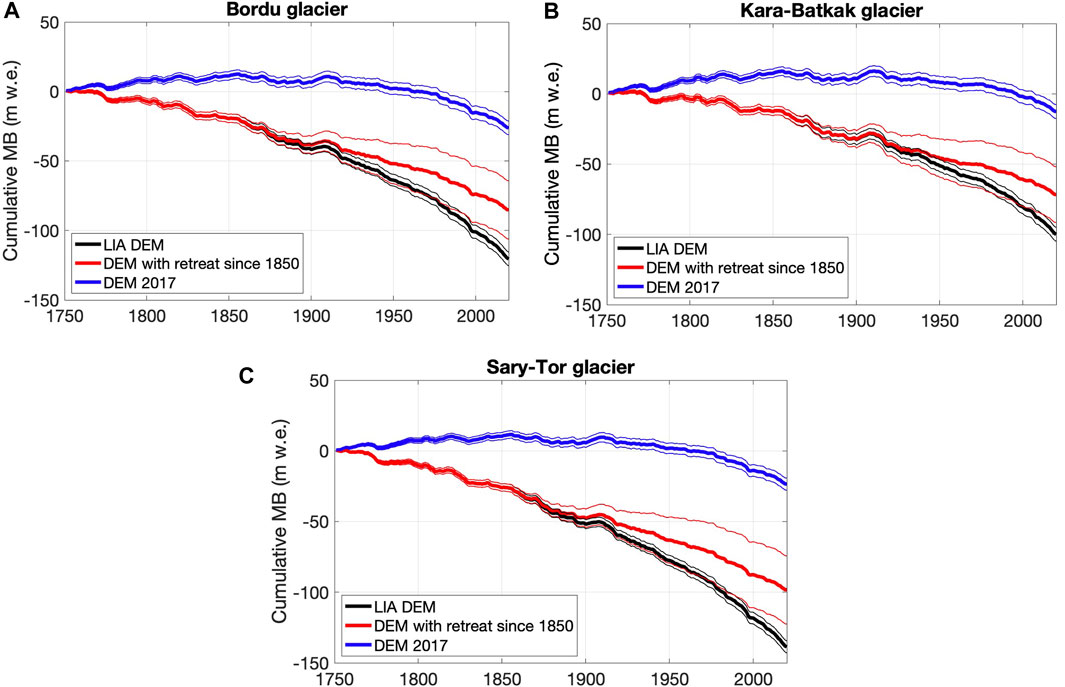
FIGURE 14. Historical cumulative mean specific mass balance (MB) of Bordu (A), Kara-Batkak (B) and Sary-Tor (C) glaciers (in m w.e.). The thin lines represent the uncertainty range taking into account uncertainty in model parameter values, meteorological input data and mass balance data for calibration. For the run with the adjusting DEM, also the uncertainty regarding the adjusting geometry was considered.
Nevertheless, the results for the vast majority of years reveal a negative mean specific mass balance whereby the cumulative value is (strongly) decreasing since 1850 (Figure 14). There are periods with a near-zero or even positive mean specific mass balance, especially at the beginning of the 20th century. The latter corresponds to the last period of glacier growth, as was demonstrated by Solomina et al. (2014), resulting from a series of colder years with increased precipitation (Figures 5, 6). A trend towards an increasingly negative mass balance can be observed in the last decades, starting approximately in 1970.
For the runs with the 2017 DEM version, the cumulative mass balance remains roughly stable (and even rises) until 1900–1910. Afterwards, the cumulative mass balance decreases at an increasing rate, but overall, it remains at a high value. The curve based on the LIA geometry on the other hand, shows a much stronger decrease in the cumulative mass balance, especially over the last decades. This is due to the remaining large LIA glacier tongue resulting in very negative mass balance values over the lowest parts of the ablation area of the LIA geometry. In reality, however, glaciers constantly respond to such negative mass balance trends and adapt to changing climatic conditions through a change in their shape (retreating front), see Reconstruction of Little Ice Age Glacier Geometry.
Discussion
Sensitivity Analysis
The sensitivity of the model with respect to the different parameters is calculated by changing the parameters and analyzing how it affects the modelled mass balances, following Che et al. (2019). The sensitivity is defined as %MB change per 10% parameter change. This range is selected to determine how much variation in the model results occurs for a fixed amount of uncertainty in the parameters, as in Anslow et al. (2008). The modelled mass balances are clearly most sensitive to the albedo of snow, the transmissivity, and the temperature gradient for all three glaciers (Table 8). The latter determines both the amount of melt (by the parameterised long wave radiation and sensible heat exchange), and the distinction between snow and rain. The significantly larger sensitivity of the results to the albedo of snow compared to the albedo of ice (and firn) (Table 8) was also observed by Che et al. (2019) and can likely be attributed to the importance of summer snow which regularly interrupts the melting season. This is why glaciers with spring-accumulation and summer snow showers are more sensitive to temperature increases during the summer months. For the implementation of the model, it is therefore crucial to carefully determine these parameters in particular.
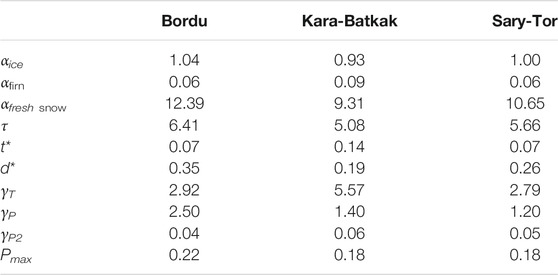
TABLE 8. Sensitivity of the mass balance to changes in the different parameters. Sensitivity is defined as %MB change per 10% parameter change.
Comparison With Geodetic Mass Balances
An independent validation of the mass balance reconstruction is performed by comparing it with geodetic mass balances, derived from DEM subtraction (Table 9). In general, we find a close agreement. However, for certain periods, the differences are more significant. For example, the geodetic mass balance calculated for 2000–2018 for Kara-Batkak glacier derived by Shean et al. (2020) indicates only a very limited mass loss while the observations and the modelled values are much more negative. This could indicate a substantial underestimation of height differences for Kara-Batkak glacier in their study. The best correlations are found for Sary-Tor glacier, for which all compared values correspond closely. This thus constitutes a thorough quality control of the modelled mass balance series, as it indicates that there is no significant over- or underestimation for the periods covered by all the geodetic mass balances.

TABLE 9. Comparison between modelled and geodetic and modelled (revert) mass balances (GEO = observed geodetic mass balance, MOD = the average modelled mean specific mass balance of the overlapping period). All values are in m w.e. yr−1. Comparisons with a difference larger than 0.2 m w.e. yr−1 are indicated in red. (Data are from; 1943–1977: Cogley, 2009; 1964–1980: Goerlich et al., 2017; 1975–1999: Pieczonka and Bolch, 2015; 2000–2016: Brun et al., 2017; 2000–2018: Shean et al., 2020).
Comparison With Other Mass Balance Studies
As mentioned in the introduction, the mass balances of glaciers in the study area were reconstructed in several other studies. Amongst others Popovnin et al. (2021) used a simple relationship to reconstruct the mean specific mass balance of Sary-Tor glacier since 1930. In their study, the glacier wide total accumulation was reconstructed using a linear relationship with air temperature and precipitation sums measured at the Kumtor-Tien Shan meteorological station. Ablation in their approach was based only on average temperatures between May and August, as derived by Konovalov (1977). They found an average value of −0.53 m w.e. yr−1 for the period 1985–2019. This ties well with the value found in this study (−0.52 ± 0.05 m w.e. yr−1). It shows that their simple parameterisation was able to produce results similar to the energy balance model used in this study. For the period 1930–1985, Popovnin et al. (2021) found an average value of -0.31 m w.e. yr−1, while in this study we found a value of −0.39 ± 0.05 m w.e. yr−1. However, when comparing these results, it must be pointed out that they used a constant present-day glacier geometry, whereas in this study the glacier geometry was adapted since the LIA. In the 1950s, Sary-Tor glacier had a much larger glacier tongue (Aizen, 2007), so the mean specific mass balance was much more negative. Further, the modelled mass balance in this study is more in line with the observed geodetic mass balance (see Comparison With Geodetic Mass Balances), which indicates that an adjustment of the glacier geometry is crucial for historical reconstructions.
Kronenberg et al. (2016) reconstructed the seasonal mass balance of Glacier No. 354, located in the valley to the west of Bordu glacier, using a distributed accumulation and temperature-index melt model and data from the Kumtor-Tien Shan station. They found a close agreement between modelled (−0.40 m w.e. yr−1) and observed (geodetic, −0.48 m w.e. yr−1) mean mass balance for the period 2003–2012. For the same period, we find a mass balance of −0.41 ± 0.10 m w.e. yr−1 for Sary-Tor glacier and −0.40 ± 0.10 m w.e. yr−1 for Bordu glacier. These values are very similar and seem to indicate that the mass balance of these three adjacent glaciers located in adjacent parallel valleys is very consistent.
A comparison between the modelled mass balance values for Kara-Batkak glacier with the reconstructed annual mass balance values (2000–2018) of Barandun et al. (2021), obtained from transient snowline and geodetic surveys, reveals a rather large mean absolute difference of 0.50 m w.e. yr−1. However, over the 18 years, the cumulative difference is only 0.69 m w.e. A comparison with the mass balance observations for the overlapping period shows that the reconstructed mass balance from Barandun et al. (2021) deviates strongly in some years, while our model results are more in line with the observations. For example, for the 2015–2016 balance year, MB measurements revealed a mean specific mass balance of −0.39 m w.e. (see Figure 3), the model results showed a mean specific mass balance of −0.37 ± 0.30 m w.e. (see Figure 10B), while the results of Barandun et al. (2021) revealed −1.69 m w.e.
For all three studied glaciers, we find an average mass balance gradient between -0.50 and −0.60 m w.e. yr−1 per 100 m. This value closely matches the value of −0.45 m w.e. yr−1 per 100 m for the nearby Batysh Sook glacier for the period 2004–2016 (Kenzhebaev et al., 2017) and is slightly higher than the values found for other nearby glaciers in the past (Aizen and Zakharov, 1989; Ushnurtsev, 1991). However, Kronenberg et al. (2016) found a value of −0.68 m w.e. yr−1 for Glacier No. 354. Research showed that an ongoing change towards higher gradients might be expected for summer-accumulation type glaciers (Oerlemans, 2001), since for this type of glaciers, a small change in summer accumulation can significantly impact the surface type in the ablation area (snow/ice) and thus considerably change the mass balance gradient (Kronenberg et al., 2016). The same can be said for spring-accumulation type glaciers.
Limitations and Future Work
The lack of validation data for the historical reconstruction up to 1750 does not allow for an independent quality analysis, such as for the last decades, by comparing with geodetic mass balances. It is therefore crucial to point out that the modelled MB series depends on the climatological series that has been reconstructed. Intrinsic problems related to the temperature and precipitation reconstruction from tree rings are the loss of variability and the fact that every month exhibits the same positive or negative signal (see Temperature and Precipitation Forcing). Besides, a drought index has been used as a measure for summer precipitation. As a result, the precipitation series only encompasses the signal surpassing the bi-annual variability.
For the observational part of the climatological series, reliability and homogeneity were maximised by carefully searching for correlations between the different datasets, by correcting for possible biases and by comparing reconstructed values with observations. Here, the main limitations are possible biases or errors in the measured data from the weather stations (e.g., due to the relocation of the Kumtor-Tien Shan station) or by using the monthly anomalies created from different weather stations in the area (such as the CruTEM or CruTS datasets).
Other limitations are related to the simplicity of the model. Different processes such as refreezing and sublimation are not included as independent processes. However, they are included indirectly as a part of accumulation (calibrated through the precipitation gradient) and ablation (calibrated in the value of C0 and C1) in the model. Although assumed to be of minor importance, the melt rates (ablation/runoff) might be overestimated because of the absence of sublimation. Another limitation of the study is the fixed geometry of the accumulation area. There is no direct historical evidence that the accumulation areas reached higher elevations or were much broader during the LIA, but it is possible that accumulation was slightly underestimated in the historical reconstruction. To better constrain the geometry of the glaciers for the historical reconstruction, a three-dimensional glacier model with included ice dynamics could be used.
Conclusion
Glaciers in the Kyrgyz Tien Shan are crucial for many reasons, but despite their importance, information about their actual state, behaviour, and evolution remains scarce. In this study, we calibrated a time-dependent two-dimensional surface energy mass balance model of reduced complexity, suitable for settings with limited data availability such as the Tien Shan, for Bordu, Kara-Batkak and Sary-Tor glaciers. The model was tuned and validated against observed mass balances for the last 5−7 balance years. The calibration of the model showed that the parameters of the energy fluxes are fairly similar for the three glaciers, but that the local meteorological characteristics, such as the precipitation gradient, vary strongly.
By combining multiple meteorological datasets of temperature and precipitation, and reconstructing the maximum Little Ice Age glacier geometry, a historical reconstruction was made of the cumulative mean specific mass balance, since 1750. In general, we found a close agreement between the modelled mass balances and several remote sensing studies providing geodetic mass balances for the last decades, favouring the reliability of the presented mass balance reconstructions. Furthermore, this highlights that a simple energy balance model with a limited amount of input data (only temperature and precipitation) can produce quite accurate results. This allows it to be easily translated to other glaciers and regions, for which sufficient calibration and validation data is available.
Regarding the last 20 years, all years showed a negative mean specific mass balance except for 2008–2009 when a slightly positive mass balance was found. This shows that the glaciers are currently in imbalance with the current climatic conditions, and that they are accompanied by large overall mass loss. This seems to be mainly due to higher average summer temperatures (between May and August) as the amount of precipitation has remained almost constant and these months in particular determine the mass balance of glaciers in the region. Our results are very similar to other studies in the region showing that the patterns of glacial behaviour found in our study are valid over larger distances. The reconstructed historical datasets provide valuable insights in the response of glaciers to climate change in the Inner Tien Shan. Additionally, they may serve as a basis for future glacier (evolutionary) studies in the area.
Data Availability Statement
The mass balance data are available through the WGMS website (https://wgms.ch/). The created climatic datasets and the adjusted outlines can be downloaded from https://doi.org/10.5281/zenodo.5555725. Other data will be provided on request to the corresponding author.
Author Contributions
LVT designed the study, analysed the data and wrote the article. CMP assisted during the entire research, participated in the fieldwork and helped to analyse the data. PH contributed to the study design and assisted during the entire research. OR contributed to the fieldwork and assisted during the research. VP provided the MB data. OS provided the tree ring data. RS organised the fieldwork.
Funding
LVT holds a PhD fellowship of the Research Foundation-Flanders (FWO-Vlaanderen). OR and VP were supported by the RFBR grant No. 20-05-00681.
Conflict of Interest
The authors declare that the research was conducted in the absence of any commercial or financial relationships that could be construed as a potential conflict of interest.
Publisher’s Note
All claims expressed in this article are solely those of the authors and do not necessarily represent those of their affiliated organizations, or those of the publisher, the editors, and the reviewers. Any product that may be evaluated in this article, or claim that may be made by its manufacturer, is not guaranteed or endorsed by the publisher.
Acknowledgments
We would like to thank everyone who participated in fieldwork to collect the mass balance data.
References
Aizen, V. B., Aizen, E. M., and Melack, J. M. (1995). Climate, Snow Cover, Glaciers, and Runoff in the Tien Shan, Central Asia. J. Am. Water Resour. Assoc 31 (6), 1113–1129. doi:10.1111/j.1752-1688.1995.tb03426.x
Aizen, V. B., Kuzmichenok, V. A., Surazakov, A. B., and Aizen, E. M. (2007). Glacier Changes in the Tien Shan as Determined from Topographic and Remotely Sensed Data. Glob. Planet. Change 56, 328–340. doi:10.1016/j.gloplacha.2006.07.016
Aizen, V. B., and Zakharov, V. (1989). Mass Balance and Ice Flow Velocity of Davydov Glacier Basing on Research in 1984–1985. Data Glaciological Stud. 67, 197–202. [in Russian].
Anslow, F. S., Hostetler, S., Bidlake, W. R., and Clark, P. U. (2008). Distributed Energy Balance Modeling of South Cascade Glacier, Washington and Assessment of Model Uncertainty. J. Geophys. Res. 113, F02019. doi:10.1029/2007JF000850
Barandun, M., Fiddes, J., Scherler, M., Mathys, T., Saks, T., Petrakov, D., et al. (2020). The State and Future of the Cryosphere in Central Asia. Water Security 11, 100072. 14 pp. doi:10.1016/j.wasec.2020.100072
Barandun, M., Huss, M., Sold, L., Farinotti, D., Azisov, E., Salzmann, N., et al. (2015). Re-analysis of Seasonal Mass Balance at Abramov Glacier 1968-2014. J. Glaciol. 61 (230), 1103–1117. doi:10.3189/2015JoG14J239
Barandun, M., Huss, M., Usubaliev, R., Azisov, E., Berthier, E., Kääb, A., et al. (2018). Multi-decadal Mass Balance Series of Three Kyrgyz Glaciers Inferred from Modelling Constrained with Repeated Snow Line Observations. The Cryosphere 12, 1899–1919. doi:10.5194/tc-12-1899-2018
Barandun, M., Pohl, E., Naegeli, K., McNabb, R., Huss, M., Berthier, E., et al. (2021). Hot Spots of Glacier Mass Balance Variability in Central Asia. Geophys. Res. Lett. 48, e2020GL092084. doi:10.1029/2020GL092084
Barry, R. G. (2008). Mountain Weather and Climate. 3rd edn. Cambridge: Cambridge University Press, 506. doi:10.1017/CBO9780511754753
Brock, B. W., Willis, I. C., and Sharp, M. J. (2000). Measurement and Parameterization of Albedo Variations at Haut Glacier d'Arolla, Switzerland. J. Glaciol. 46 (155), 675–688. doi:10.3189/172756500781832675
Brun, F., Berthier, E., Wagnon, P., Kääb, A., and Treichler, D. (2017). A Spatially Resolved Estimate of High Mountain Asia Glacier Mass Balances from 2000 to 2016. Nat. Geosci 10 (9), 668–673. doi:10.1038/ngeo2999
Carrivick, J. L., Boston, C. M., King, O., James, W. H. M., Quincey, D. J., Smith, M. W., et al. (2019). Accelerated Volume Loss in Glacier Ablation Zones of NE Greenland, Little Ice Age to Present. Geophys. Res. Lett. 46, 1476–1484. doi:10.1029/2018GL081383
Carrivick, J. L., Davies, B. J., Glasser, N. F., Nývlt, D., and Hambrey, M. J. (2012). Late-Holocene Changes in Character and Behaviour of Land-Terminating Glaciers on James Ross Island, Antarctica. J. Glaciol. 58 (212), 1176–1190. doi:10.3189/2012JoG11J148
Che, Y., Zhang, M., Li, Z., Wei, Y., Nan, Z., Li, H., et al. (2019). Energy Balance Model of Mass Balance and its Sensitivity to Meteorological Variability on Urumqi River Glacier No.1 in the Chinese Tien Shan. Sci. Rep. 9 (1), 13958–14013. doi:10.1038/s41598-019-50398-44
Chen, A., Li, W., Li, W., and Liu, X. (2014). An observational study of snow aging and the seasonal variation of snow albedo by using data from Col de Porte, France. Chin. Sci. Bull. 59 (34), 4881–4889. doi:10.1007/s11434-014-0429-9
Chen, Y., Li, W., Deng, H., Fang, G., and Li, Z. (2016). Changes in Central Asia's Water Tower: Past, Present and Future. Sci. Rep. 6, 35458. doi:10.1038/srep35458
Constantin, J. G., Ruiz, L., Villarosa, G., Outes, V., Bajano, F. N., He, C., et al. (2020). Measurements and Modeling of Snow Albedo at Alerce Glacier, Argentina: Effects of Volcanic Ash, Snow Grain Size, and Cloudiness. The Cryosphere 14 (12), 4581–4601. doi:10.5194/tc-14-4581-2020
Davaze, L., Rabatel, A., Dufour, A., Hugonnet, R., and Arnaud, Y. (2020). Region-Wide Annual Glacier Surface Mass Balance for the European Alps from 2000 to 2016. Front. Earth Sci. 8, 0–14. doi:10.3389/feart.2020.00149
Dikikh, A. N. (1982). The Regime of Modern Glaciation of the Central Tien Shan. Frunze, 159. (Russian: Rezhim sovremennogo oledeneniya Tsentral'nogo Tyan'-Shanya.
Dyurgerov, M. B., Liu, C., and Xie, Z. (1995). Tien Shan Glaciation (Oledenenie Tian Shania). Moscow: VINITI, 237. [In Russian].
Engel, Z., Šobr, M., and Yerokhin, S. A. (2012). Changes of Petrov Glacier and its Proglacial lake in the Akshiirak Massif, central Tien Shan, since 1977. J. Glaciol. 58 (208), 388–398. doi:10.3189/2012JoG11J085
Farinotti, D., Huss, M., Fürst, J. J., Landmann, J., Machguth, H., Maussion, F., et al. (2019). A Consensus Estimate for the Ice Thickness Distribution of All Glaciers on Earth. Nat. Geosci. 12, 168–173. doi:10.1038/s41561-019-0300-3
Farinotti, D., Longuevergne, L., Moholdt, G., Duethmann, D., Mölg, T., Bolch, T., et al. (2015). Substantial Glacier Mass Loss in the Tien Shan over the Past 50 Years. Nat. Geosci 8 (9), 716–722. doi:10.1038/ngeo2513
Fujita, K., and Ageta, Y. (2000). Effect of Summer Accumulation on Glacier Mass Balance on the Tibetan Plateau Revealed by Mass-Balance Model. J. Glaciol. 46 (153), 244–252. doi:10.3189/172756500781832945
Fujita, K., Takeuchi, N., Nikitin, S. A., Surazakov, A. B., Okamoto, S., Aizen, V. B., et al. (2011). Favorable Climatic Regime for Maintaining the Present-Day Geometry of the Gregoriev Glacier, Inner Tien Shan. The Cryosphere 5 (3), 539–549. doi:10.5194/tc-5-539-2011
Giesen, R. H., and Oerlemans, J. (2012). Calibration of a Surface Mass Balance Model for Global-Scale Applications. The Cryosphere 6 (6), 1463–1481. doi:10.5194/tc-6-1463-2012
Giesen, R. H., and Oerlemans, J. (2010). Response of the Ice Cap Hardangerjøkulen in Southern Norway to the 20th and 21st century Climates. The Cryosphere 4 (2), 191–213. doi:10.5194/tc-4-191-2010
Giesen, R. H., Van den Broeke, M. R., and An-Dreassen, L. M.Van den BroekeM. R. (2008). The Surface Energy Balance in the Bblation Zone of Midtdalsbreen, A Glacier in Southern Norway: Interan-nual Variability and the Effect of Cloud. J. Geophys. Res. 113 , D21111. doi:10.1029/2008JD010390
Glazyrin, G. E. (1985). Distribution and Regime of Mountain Glaciers, Leningrad Gidrometeoizdat, 181. (Russian: Raspredeleniye i rezhim gornykh lednikov).
Goerlich, F., Bolch, T., Mukherjee, K., and Pieczonka, T. (2017). Glacier Mass Loss during the 1960s and 1970s in the Ak-Shirak Range (Kyrgyzstan) from Multiple Stereoscopic Corona and Hexagon Imagery. Remote Sensing 9 (3), 275. doi:10.3390/rs9030275
Graham Cogley, J. (2009). Geodetic and Direct Mass-Balance Measurements: Comparison and Joint Analysis. Ann. Glaciol. 50 (50), 96–100. doi:10.3189/172756409787769744
Grünewald, T., Bühler, Y., and Lehning, M. (2014). Elevation Dependency of Mountain Snow Depth. The Cryosphere 8 (6), 2381–2394. doi:10.5194/tc-8-2381-2014
Grünewald, T., and Lehning, M. (2011). Altitudinal Dependency of Snow Amounts in Two Small alpine Catchments: Can Catchment-wide Snow Amounts Be Estimated via Single Snow or Precipitation Stations. Ann. Glaciol. 52 (58), 153–158. doi:10.3189/172756411797252248
Harris, I., Jones, P. D., Osborn, T. J., and Lister, D. H. (2014). Updated High-Resolution Grids of Monthly Climatic Observations - the CRU TS3.10 Dataset. Int. J. Climatol. 34, 623–642. doi:10.1002/joc.3711
Hoelzle, M., Azisov, E., Barandun, M., Huss, M., Farinotti, D., Gafurov, A., et al. (2017). Re-establishing Glacier Monitoring in Kyrgyzstan and Uzbekistan, Central Asia. Geosci. Instrum. Method. Data Syst. 6 (2), 397–418. doi:10.5194/gi-6-397-2017
Houze, R. A. (2012). Orographic Effects on Precipitating Clouds. Rev. Geophys. 50 (1), 1–47. doi:10.1029/2011RG000365
Janssens, I., and Huybrechts, P. (2000). The Treatment of Meltwater Retention in Mass-Balance Parameterizations of the Greenland Ice Sheet. Ann. Glaciol. 31, 133–140. doi:10.3189/172756400781819941
Jones, P. D., Lister, D. H., Osborn, T. J., Harpham, C., Salmon, M., and Morice, C. P. (2012). Hemispheric and Large-Scale Land-Surface Air Temperature Variations: An Extensive Revision and an Update to 2010. J. Geophys. Res. 117, a–n. v4.6.0.0, updated 2018. doi:10.1029/2011JD017139
Kenzhebaev, R., Barandun, M., Kronenberg, M., Chen, Y., Usubaliev, R., and Hoelzle, M. (2017). Mass Balance Observations and Reconstruction for Batysh Sook Glacier, Tien Shan, from 2004 to 2016. Cold Regions Sci. Techn. 135, 76–89. doi:10.1016/j.coldregions.2016.12.007
Khromova, T. E., Dyurgerov, M. B., and Barry, R. G. (2003). Late-twentieth century Changes in Glacier Extent in the Ak-Shirak Range, Central Asia, Determined from Historical Data and ASTER Imagery. Geophys. Res. Lett. 30 16. doi:10.1029/2003GL017233
Konovalov, V. G. (1977). Calculation and Prediction of the Total Glacial Melting in Watersheds of Central Asia. J. Glaciol. 19 (81), 677–678. doi:10.3189/S0022143000029658
Kronenberg, M., Barandun, M., Hoelzle, M., Huss, M., Farinotti, D., Azisov, E., et al. (2016). Mass-balance Reconstruction for Glacier No. 354, Tien Shan, from 2003 to 2014. Ann. Glaciol. 57 (71), 92–102. doi:10.3189/2016AoG71A032
Kronenberg, M., Machguth, H., Eichler, A., Schwikowski, M., and Hoelzle, M. (2021). Comparison of Historical and Recent Accumulation Rates on Abramov Glacier, Pamir Alay. J. Glaciol. 67 (262), 253–268. doi:10.1017/jog.2020.103
Kutuzov, S., and Shahgedanova, M. (2009). Glacier Retreat and Climatic Variability in the Eastern Terskey-Alatoo, Inner Tien Shan between the Middle of the 19th century and Beginning of the 21st century. Glob. Planet. Change 69 (1–2), 59–70. doi:10.1016/j.gloplacha.2009.07.001
Li, Y., and Li, Y. (2014). Topographic and Geometric Controls on Glacier Changes in the central Tien Shan, China, since the Little Ice Age. Ann. Glaciol. 55 (66), 177–186. doi:10.3189/2014aog66a031
Li, Y., Lu, X., and Li, Y. (2017). A Review on the Little Ice Age and Factors to Glacier Changes in the Tian Shan, Central Asia. In book: Glaciers Evolution in a Changing World (October). Vienna, Austria: IntechOpen. doi:10.5772/intechopen.70044
Makarevich, K. G. (1984). Tuyuksu Glaciers (Northern Tien Shan). Leningrad, 171. (Ledniki Tuyuksu (Severnyy Tyan'-Shan), [In Russian].
Makarevich, K. G., Vilesov, E. N., and Shabanov, P. F. (1985). Regime of Glaciers in the Northern Tien Shan for 25 Years (From 1956 to 1981). Data Glaciological Stud. 54, 60–68. (Rezhim lednikov severnogo Tyan'-Shanya za 25 let (s 1956 po 1981), [In Russian].
Miles, E., McCarthy, M., Dehecq, A., Kneib, M., Fugger, S., and Pellicciotti, F. (2021). Health and Sustainability of Glaciers in High Mountain Asia. Nat. Commun. 12, 2868. doi:10.1038/s41467-021-23073-4
Oerlemans, J., and Knap, W. H. (1998). A 1 Year Record of Global Radiation and Albedo in the Ablation Zone of Morteratschgletscher, Switzerland. J. Glaciol. 44 (147), 231–238. doi:10.3189/S002214300000257410.1017/s0022143000002574
Pellitero, R., Rea, B. R., Spagnolo, M., Bakke, J., Hughes, P., Ivy-Ochs, S., et al. (2015). A GIS Tool for Automatic Calculation of Glacier Equilibrium-Line Altitudes. Comput. Geosciences 82, 55–62. doi:10.1016/j.cageo.2015.05.005
Petrakov, D. A., Lavrentiev, I. I., Kovalenko, N. V., and Usubaliev, R. A. (2014). Ice Thickness, Volume and Modern Change of the Sary-Tor Glacier Area (Ak-Shyirak Massif, Inner Tian Shan). Kriosfera Zemli (‘Earth’s Cryosphere’) 18 (3), 91–100.
Petrakov, D. A., Tutubalina, O. V., Shpuntova, A. M., Kovalenko, N. V., Usubaliev, R. A., Azisov, E. A., et al. (2019). Assessment of Glacier Albedo in the Ak-Shyirak Mountains (Inner Tien Shan) from Ground-Based and Landsat Data. Kriosfera Zemli (‘Earth’s Cryosphere’) XXIII (3), 13–24. doi:10.21782/KZ1560-7496-2019-3(13-24
Petrakov, D., Shpuntova, A., Aleinikov, A., Kääb, A., Kutuzov, S., Lavrentiev, I., et al. (2016). Accelerated Glacier Shrinkage in the Ak-Shyirak Massif, Inner Tien Shan, during 2003-2013. Sci. Total Environ. 562, 364–378. doi:10.1016/j.scitotenv.2016.03.162
Pieczonka, T., and Bolch, T. (2015). Region-wide Glacier Mass Budgets and Area Changes for the Central Tien Shan between ∼1975 and 1999 Using Hexagon KH-9 Imagery. Glob. Planet. Change 128, 1–13. doi:10.1016/j.gloplacha.2014.11.014
Popovnin, V. V., Gubanov, A. S., Satylkanov, R. A., and Ermenbayev, B. O. (2021). Mass Balance of the Sary-Tor Glacier Reproduced from Meteorological Data. Led i Sneg (‘Ice and Snow’) 61 (1), 58–74. [In Russian]. doi:10.31857/S2076673421010071
Pritchard, H. D. (2019). Asia's Shrinking Glaciers Protect Large Populations from Drought Stress. Nature 569, 649–654. doi:10.1038/s41586-019-1240-1
Reeh, N. (1991). Parameterization of Melt Rate and Surface Temperature in the Greenland Ice Sheet, Polarforschung, Bremerhaven. Alfred Wegener Inst. Polar Mar. Res. German Soc. Polar Res. 59 (3), 113–128.
RGI Consortium (2017). Randolph Glacier Inventory – A Dataset of Global Glacier Outlines: Version 6.0: Technical Report, Global Land Ice Measurements from Space. Colorado, USA: Digital Media. doi:10.7265/N5-RGI-60
Rounce, D. R., Hock, R., and Shean, D. E. (2020). Glacier Mass Change in High Mountain Asia through 2100 Using the Open-Source Python Glacier Evolution Model (PyGEM). Front. Earth Sci. 7, 1–20. doi:10.3389/feart.2019.00331
Rybak, O. O., Rybak, E. A., Yaitskaya, N., Popovnin, V. V., Lavrentiev, I. I., Satylkanov, R., et al. (2019). Modeling the Evolution of Mountain Glaciers: a Case Study of Sary-Tor Glacier, Inner Tien Shan. Kriosfera Zemli (‘Earth’s Cryosphere’) XXIII (3), 33–51. doi:10.21782/KZ1560-7496-2019-3(33-51
Savoskul, O. S., and Solomina, O. N. (1996). Late-Holocene Glacier Variations in the Frontal and Inner Ranges of the Tian Shan, Central Asia. Holocene 6 (1), 25–35. doi:10.1177/095968369600600104
Satylkanov, R. (2018). Ablation of Ice and Snow of Kara-Batkak Glacier and its Impact on River Flow. Jcc 4 (2), 1–14. doi:10.3233/jcc-180009
Shean, D. E., Bhushan, S., Montesano, P., Rounce, D. R., Arendt, A., and Osmanoglu, B. (2020). A Systematic, Regional Assessment of High Mountain Asia Glacier Mass Balance. Front. Earth Sci. 7, 363. doi:10.3389/feart.2019.00363
Solomina, O., Barry, R., and Bodnya, M. (2004). The Retreat of Tien Shan Glaciers (Kyrgyzstan) since the Little Ice Age Estimated from Aerial Photographs, Lichenometric and Historical Data. Geogr. Ann. Ser. A, Phys. Geogr. 86 (2), 205–215. doi:10.1111/j.0435-3676.2004.00225.x
Solomina, O., Maximova, O., and Cook, E. (2014). Picea Schrenkiana Ring Width and Density at the Upper and Lower Tree Limits in the Tien Shan Mts (Kyrgyz Republic) as a Source of Paleoclimatic Information. Geogr. Environ. Sustain. 7 (1), 66–79. doi:10.24057/2071-9388-2014-7-1-66-79
Sommer, C., Malz, P., Seehaus, T. C., Lippl, S., Zemp, M., and Braun, M. H. (2020). Rapid Glacier Retreat and Downwasting throughout the European Alps in the Early 21st century. Nat. Commun. 11 (1), 3209. doi:10.1038/s41467-020-16818-0
Thomson, L., Brun, F., Braun, M., and Zemp, M. (2021). Editorial: Observational Assessments of Glacier Mass Changes at Regional and Global Level. Front. Earth Sci. 8, 736. doi:10.3389/feart.2020.641710
Turchaninova, A. S., Lazarev, A. V., Marchenko, E. S., Seliverstov, Y. G., Sokratov, S. A., Petrakov, D. A., et al. (2019). Methods of Snow Avalanche Nourishment Assessment (On the Example of Three Tian Shan Glaciers). Lei sneg 59 (4), 460–474. doi:10.15356/2076-6734-2019-4-438
Ushnurtsev, S. (1991). Mass Balance Fluctuations of the Sary-Tor Glacier in Inner Tien Shan and its Reconstruction for the Period 1930–1988. Data Glaciologial Stud. 71, 70–79. [in Russian].
Van Tricht, L., Huybrechts, P., Van Breedam, J., Fürst, J. J., Rybak, O., Satylkanov, R., et al. (2021). Measuring and Inferring the Ice Thickness Distribution of Four Glaciers in the Tien Shan, Kyrgyzstan. J. Glaciol. 67 (262), 269–286. doi:10.1017/jog.2020.104
Van Tricht, L., Huybrechts, P., Van Breedam, J., Vanhulle, A., Van Oost, K., and Zekollari, H. (2021). Estimating Surface Mass Balance Patterns from UAV Measurements on the Ablation Area of the Morteratsch-Pers Glacier Complex (Switzerland). Cryosphere 67, 4445–4464. doi:10.5194/tc-15-4445-2021
Vincent, C., Cusicanqui, D., Jourdain, B., Laarman, O., Six, D., Gilbert, A., et al. (2021). Geodetic point Surface Mass Balances: a New Approach to Determine point Surface Mass Balances on Glaciers from Remote Sensing Measurements. The Cryosphere 15, 1259–1276. doi:10.5194/tc-15-1259-2021
Voloshina, A. P. (2002). Meteorology of Mountain Glaciers. Data Glaciological Stud. 92, 3–138. [in Russian].
WGMS (2020), "Global Glacier Change Bulletin No. 3 (2016–2017) and Earlier Reports," in ISC(WDS)/ IUGG(IACS)/UNEP/UNESCO/WMO. Editors M. Zemp, I. Gartner-Roer, S. U. Nussbaumer, J. Bannwart, P. Rastner, F. Paulet al. (Zurich, Switzerland: World Glacier Monitoring Service), 274.
Yang, W., Yao, T., Guo, X., Zhu, M., Li, S., and Kattel, D. B. (2013). Mass Balance of a Maritime Glacier on the Southeast Tibetan Plateau and its Climatic Sensitivity. J. Geophys. Res. Atmos. 118, 9579–9594. doi:10.1002/jgrd.50760
Keywords: glaciers, glacier mass balance, mass balance modelling, Tien Shan, climate change, historical reconstruction, glaciological monitoring
Citation: Van Tricht L, Paice CM, Rybak O, Satylkanov R, Popovnin V, Solomina O and Huybrechts P (2021) Reconstruction of the Historical (1750–2020) Mass Balance of Bordu, Kara-Batkak and Sary-Tor Glaciers in the Inner Tien Shan, Kyrgyzstan. Front. Earth Sci. 9:734802. doi: 10.3389/feart.2021.734802
Received: 01 July 2021; Accepted: 14 October 2021;
Published: 25 November 2021.
Edited by:
Matthias Huss, ETH Zürich, SwitzerlandCopyright © 2021 Van Tricht, Paice, Rybak, Satylkanov, Popovnin, Solomina and Huybrechts. This is an open-access article distributed under the terms of the Creative Commons Attribution License (CC BY). The use, distribution or reproduction in other forums is permitted, provided the original author(s) and the copyright owner(s) are credited and that the original publication in this journal is cited, in accordance with accepted academic practice. No use, distribution or reproduction is permitted which does not comply with these terms.
*Correspondence: Lander Van Tricht, bGFuZGVyLnZhbi50cmljaHRAdnViLmJl
 Lander Van Tricht
 Chloë Marie Paice
 Oleg Rybak
 Rysbek Satylkanov4,5
 Olga Solomina
 Philippe Huybrechts


