 Caiming Shen
 Kam-biu Liu
 Lingyu Tang
 Jonathan T. Overpeck4
94% of researchers rate our articles as excellent or good
Learn more about the work of our research integrity team to safeguard the quality of each article we publish.
Find out more
ORIGINAL RESEARCH article
Front. Earth Sci., 23 August 2021
Sec. Quaternary Science, Geomorphology and Paleoenvironment
Volume 9 - 2021 | https://doi.org/10.3389/feart.2021.732441
This article is part of the Research TopicLate Quaternary Hydrological, Paleoenvironmental and Geomorphological Processes in the Tibetan Plateau and Its Adjacent AreasView all 21 articles
The basis for the interpretation of fossil-pollen assemblages in terms of vegetation and climate is the present-day relationship of vegetation and climate to pollen rain. Detailed modern pollen spectra from the Tibetan Plateau are described here to explore the relationship between modern pollen rain and vegetation. Two hundred and thirty four (234) pollen surface samples were collected from moss polsters, top soil, and lake surface sediments from forests, shrublands, shrub meadows, meadows, steppes, and deserts in the Tibetan Plateau. Pollen assemblages from each vegetation type are detailed described using pollen percentage data, and compared descriptively and numerically using cluster analysis. Pollen spectra from forests are characterized by high percentages of tree pollen types including Pinus, Abies, Picea, Quercus, and Betula. Pollen spectra from shrublands have highest amounts of shrub pollen. The dominants of shrublands, such as Rhododendron, Juniperus, Salix, and shrub Quercus, are well-represented in most of these pollen spectra. Pollen spectra from shrub meadows have less shrub pollen than those from shrublands, but more than those from meadows, steppes and deserts. The most frequent shrub pollen in this vegetation type is Rosaceae. Most of pollen spectra from shrub meadows are dominated by Cyperaceae pollen. Pollen spectra from meadows are characterized by the very high percentages of Cyperaceae pollen. The highest amounts of Cyperaceae pollen occur in pollen spectra from alpine-marshy meadows. Pollen spectra from Stipa steppes are characterized by the highest percentages of Poaceae pollen, and high Cyperaceae pollen percentages, whereas pollen spectra from Artemisia steppes have the highest percentages of Artemisia pollen. Pollen spectra from arid deserts are dominated by Chenopodiaceae. Main vegetation types can be distinguished by their modern pollen rain, i.e., modern pollen spectra do reflect the modern vegetation at local and regional scale in the Tibetan Plateau. This modern pollen database can thus be used to explore the pollen/vegetation and pollen/climate relationships by a variety of numerical methods.
The basis for the interpretation of fossil-pollen assemblages in terms of vegetation and climate is the present-day relationship of vegetation and climate to pollen rain (Webb and Bryson, 1972; Liu and Lam, 1985; Bartlein et al., 1986; Delcourt et al., 1987; Gajewski et al., 2002; Schofield et al., 2007; Birks et al., 2010; Seppä et al., 2010; Davis et al., 2013; Ge et al., 2017). In China, modern pollen studies are limited by extensive human impacts on the modern vegetation (Liu, 1988; Xu et al., 2016). Although some studies of surface pollen samples were conducted before this century, most of these earlier studies focused on relation of pollen rain to regional vegetation and climate in some mountainous regions such as Changbaishan and Xiaoxinanling Mountains in northeastern China (Zhou et al., 1983; Shen and Tang, 1992; Li et al., 2000), Zhongtiao Mountain in northern China (Yao, 1989), Shengnongjia Mountain in central China (Li, 1991), the West Kunlun Mountains and Haoniu Mountains in western China (Weng et al., 1989; Jarvis and Clay-Poole, 1992). In this century, Chinese and western palynologists have made great efforts in developing a modern pollen database and applying it into vegetation and climate reconstructions (e.g., Members of China Quaternary Pollen Database, 2001; Yu et al., 2001; Shen et al., 2006, 2008a, b; Zheng et al., 2008, 2014; Herzschuh et al., 2010; Lu et al., 2011; Xu et al., 2016; Chen et al., 2017; Liang et al., 2020).
The Tibetan Plateau (TP), the least anthropologically-disturbed region in China, provides an unusual opportunity to study the relationship between modern pollen rain and vegetation. In the TP, most of the earlier work on pollen surface samples was conducted separately and locally as part of paleoenvironmental studies (e.g., Li and Liu, 1988; Jarvis and Clay-Poole, 1992; Sun et al., 1993; Van Campo and Gasse, 1993; Xiao et al., 1996). In this century, modern pollen studies were extensively conducted in the TP (e.g., Yu et al., 2001; Shen et al., 2006; Herzschuh et al., 2010; Lu et al., 2011; Ma et al., 2017; Liang et al., 2020). These studies examined the spatial distribution of pollen taxa and analyzed the relationship between the modern pollen assemblages and regional vegetation and climate based on modern pollen data sets from moss polsters, top soil, and lake surface sediments. However, none of them gave a detailed description of modern pollen spectra and vegetation at sampling sites involving most of vegetation types in the TP.
This paper describes the modern pollen spectra of the TP as recorded in a network of 234 pollen surface samples. The samples were derived from a variety of vegetation types from monsoonal climate regions to arid and semi-arid regions, including forests, shrublands, shrub meadows, meadows, steppes, and deserts. The relationship between modern pollen rain and vegetation types is examined. This study provides basic information for the quantitative analysis of the relationships among modern pollen rain, vegetation, and climate as well as the quantitative reconstruction of paleovegetation and paleoclimate (Shen et al., 2006, 2008a, b; Lu et al., 2011; Liang et al., 2020).
Two hundred and thirty four (234) pollen surface samples were collected from moss polsters, top soil, and lake surface sediments in the TP in the summers of 1993–1995, 1999 and 2001 (Figure 1 and Supplementary Material). Pollen sites are located between 29 and 40°N and 90–104°E, and cover an elevation range from 1,100 m to 5,230 m (Figure 2). Samples were processed according to the standard procedure described by Faegri and Iversen (1975). The procedure involves treatment with cold 10% HCl, hot 10% KOH, hot 50% HF, and acetolysis solution, staining with safranin, dehydration with tertiary butyl alcohol, and mounting in silicone oil. Prior to chemical treatment, moss polsters and soils were stirred in distilled water and sieved to remove coarse detritus and sand. More than 400 pollen grains were counted for most samples except for some desert samples that contain few pollen grains.
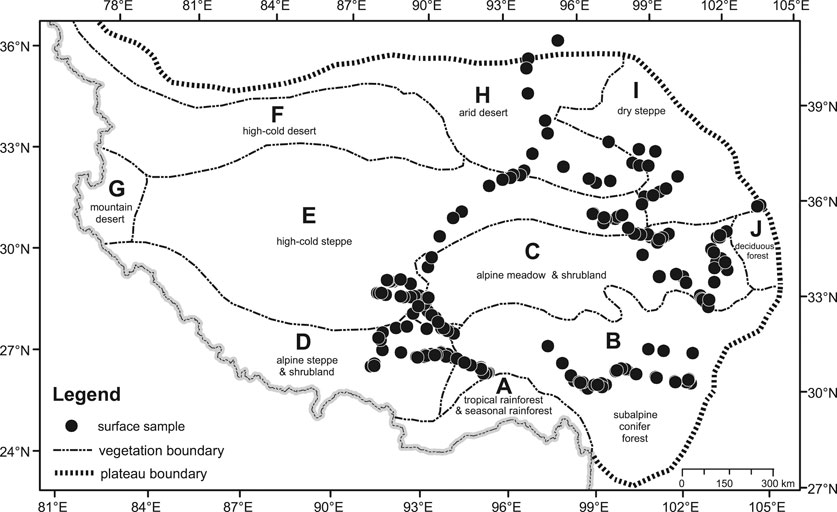
FIGURE 1. The vegetation of the TP and location of surface samples.
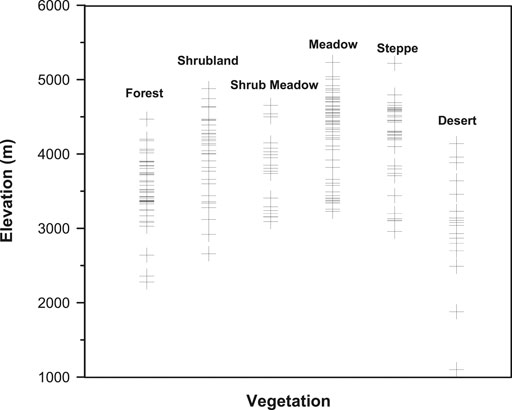
FIGURE 2. Elevation at which the surface sample sites are located.
Pollen percentages are calculated from a total pollen sum. ArcGIS and TILIA software are used for mapping, plotting of pollen diagrams, and statistical analysis of modern pollen spectra.
The TP, known as the “roof of the world”, is a vast highland with an area of nearly 2 × 10⁶ km2 situated at an average elevation of over 4,000 m above sea level. Its climate shows a marked southeast to northwest precipitation gradient due to the decreasing influence of the Southwest Asian monsoon. Following the steep altitudinal and latitudinal climatic gradient on the TP, the vegetation changes from forests to high-cold alpine meadows and shrublands, and to alpine steppes and desert. Based on a large-scale vegetation map of the whole plateau (Institute of Geography, 1990), ten major vegetation regions are recognized (Figure 1).
A. Tropical rainforest-seasonal rainforest: This vegetation type occurs on the south-facing slopes and river valleys of the East Himalayas. The climate is tropical and monsoonal with high annual precipitation (2000–3,000 mm) and a high mean annual temperature (>20°C). Tropical rainforest dominated by Dipterocarpus, Artocarpus, Canarium, Shorea, and Tetrameles occurs at elevations lower than 600 m. Seasonal rainforest consisting of Dysoxylum, Chukrasia, Terminalia, Lagerstroemia, and Altingia occurs at elevations of 600–1,000 m. Above 1,000 m are subtropical monsoonal or montane rain forests dominated by a variety of evergreen oaks (Cyclobalanopsis, Quercus), Lithocarpus, Castanopsis, mixed with subalpine conifers such as Picea, Abies, and Tsuga (Wu, 1980; Tibetan Investigation Group, 1988).
B. Subalpine conifer forest: It occurs in the southeastern part of the Plateau, which is deeply dissected by several NNW-SSE trending rivers. These river gorges punctuate the Himalayan barrier and permit the SW Indian Monsoon to penetrate deeply into the TP and the western interior parts of China. The annual precipitation ranges from 400 to 1,200 mm and is concentrated in the monsoon season between May and October (Wu, 1980). The mean annual temperature varies from 3°C to 12°C, with a coldest air temperature of −20.7°C and a warmest air temperature of 32.7°C. Coniferous trees are the dominants in this region, which are represented by five genera— Abies, Picea, Pinus, Tsuga, and Juniperus. The formation also contains an admixture of deciduous hardwood genera such as Alnus, Betula, and Populus; these are successional replacements of the coniferous forest after natural or anthropogenic disturbance. The conifer forest zone, dominated by Abies, Picea, and Juniperus, typically occurs between 3,000 and 4,000 m elevation. With an increase in elevation, the conifer forest zone changes to a shrub zone composed of Rhododendron shrubs together with rosaceous genera, and an alpine meadow zone. Evergreen needle-leaved and deciduous broad-leaved mixed forests, consisting of Pinus, Tsuga, Quercus, Acer, Betula, and Corylus, exists below the conifer forest zone. In addition, arid desert also occurs in hot and dry river valleys. It is mainly composed of Pertya, Cotoneaster, Androsace, Artemisia, Chenopodium, and Miscanthus (Editorial Broad of Sichuan’s Vegetation, 1980).
C. Alpine meadow and shrubland: These vegetation types occur on the relatively open and flat terrains in the eastern part of the Plateau at elevations between 3,500 and 5,000 m. This region is characterized by cold and wet climatic conditions, with a mean annual temperature of −4°C to 3°C, coldest month temperature of −17 to −7°C, and warmest month temperature of 5–13°C. The annual precipitation varies between 350 and 700 mm, which is mostly brought by the summer monsoon penetrating into this region through the river gorges. The shrubland consists of Dasiphora, Salix, Sibiraea, Rhododendron, Juniperus, Potentilla, and Caragana. Alpine meadow is dominated by Kobresia spp, together with Polygonum, Thalictrum, Anaphalis, Artemisia, and some species of Poaceae, Asteraceae, and Caryophyllaceae (Editorial Broad of Sichuan’s Vegetation, 1980).
D. Alpine steppe and shrubland: These vegetation types occur in southern Tibet under the rain shadow of the Himalayas, where the annual precipitation ranges from 230 to 450 mm. The temperature is relatively high compared with that in alpine meadow, with a mean annual temperature of 0°C to 8°C, coldest month temperature of –12°C to −2°C, and warmest month temperature of 10°C to 16°C. The river valleys and mountains below 4,000 m in elevation are covered by Sophora moorcroftiana shrub and Aristida triseta steppe. The mountains at elevations of 4,000–4,700 m are occupied by alpine steppe dominated by Stipa bungeana, S. capillacea, Artemisia wellbyi, A. stracheyii, and shrubland dominated by Caragana, Potentilla, and Juniperus. An alpine meadow zone above 4,700 m elevation is composed of Kobresia and Polygonum.
E. High-cold steppe: This vegetation type occupies a vast region at elevations of 4,400–5,400 m in the interior of the Plateau. The climate is cold and dry, with a mean annual temperature of −6°C to 0°C and an annual precipitation of 150–300 mm. Stipa purpurea, S. basiplumosa, Carex moorcroftii, and Artemisia wellbyi are dominants of the high-cold steppe. Frequent companion components include Stipa penicillata, S. glareosa, Carex montis-everestii, Festuca ovina, Poa spp., Artemisia minor, and Astraglus heydei. Usually there are some cushion plants (e.g., Arenaria musciformis, Androsace stapete, Thylacospermum rupifragum) and mesic herbs such as Kobresia pygmaea (Chang, 1981; Wang, 1988).
F. High-cold desert: High-cold desert occurs in the northwestern part of the TP, where the elevation is over 5,000 m. This region experiences the coldest and driest climate of the Plateau. The mean annual temperature is about −8 to −10°C. Mean monthly temperature is lower than 0°C for 9–10 months. The mean annual precipitation is only 20–50 mm (Chang, 1981). The dominants of this vegetation type are cushion minor semi-shrubs adapted to extremely cold and dry climate. The representative community is composed of Ceratoides compacta, with few companion species such as Ajania trilobata, Arenaria monticola, Carex moorcroftii, Hedinia tibetica, Oxytropis densa, Pegaeophyton scapiflorum, Stipa basiplumosa, and Thylacospemum caespitosum. The only woody plant in the region is Myricaria hedinii, which grows along rivers (Chang, 1981; Wang, 1988).
G. Mountain desert: This vegetation type occupies the mountains and valleys on the western edge of the Plateau between the northwestern Himalayas and the Karakoram ranges. The center of the summer thermal low of Tibet is located in this region, the driest and hottest region on the Plateau. The July mean temperature is 15°C. The annual precipitation is no more than 50–75 mm (Chang, 1981). The desert community consists of suffrutescent Ceratoides lateens, Ajania fruticulosa, and the endemic perennial Christolea crassiflora. Some feathergrasses (e.g., Stipa glareso, S. subsessiliflora, S. breviflora) and xeric shrubs (e.g., Ephedra gerardiana and Caragana versicolor) are present in the desert community where the climate becomes slightly more humid.
H. Arid desert: In the northern part of the Plateau lies the Qaidam Basin. Its general elevation is 2,600–3,000 m, ca. 2000 m lower than the surrounding mountains. The annual precipitation decreases from 200 mm in the east to 20 mm in the west. The annual mean temperature is 1°C to 5°C, with a coldest monthly temperature of −15°C to −10°C and a warmest monthly temperature of 15°C to 17.5°C. The arid desert is dominated by Chenopodiaceae, Artemisia, Ephedra, Tamarix (T. laxa, T. ramosissima), Nitraria (N. tangutorum, N. sibirica), Populus, Calligonum, Poaceae, Asteraceae, Fabaceae, Polygonaceae, and Cyperaceae (Wu, 1980).
I. Dry steppe: This vegetation type occurs in the northeastern part of the Plateau at elevations of 2000–5,000 m, where the annual precipitation ranges from 300 to 500 mm, and the mean annual temperature is −4°C to 4°C. In the south of this region, the vegetation is dry steppe, dominated by Stipa bugeana, S. breviflora, S. purpurea, Orinus kokonorica, Leymus secalinus, Artemisia scoparia, Achnatherum splendens, and Carex ivanova. The high mountains to the north support alpine meadows dominated by Kobresia. Picea and Juniperus forests occur between 2,400 and 4,100 m on the northern and wetter southeastern slopes of mountains in the northern and eastern margins of the region.
J. Warm temperate deciduous broadleaved forest: This vegetation type grows in the mountains on the eastern edge of the Plateau. The general elevation of the mountains is above 2,800 m. The climate is warm and wet, with cold winters and cool summers. The annual precipitation is 500–750 mm, of which 70–80% is concentrated in the months of May to September. The mean annual temperature at an elevation of 2,300 m is about 8°C. Below 2,500 m is the coniferous and deciduous broadleaved mixed forest zone, characterized by Quercus, Tilia, Acer, Pterocarya, Betula, Carpinus, Pinus, Tusga, Abies, and Picea. Between 2,500 and 3,800 m occurs a subalpine conifer forest zone, dominated by Abies, Picea, and Rhododendron. Above 3,800 m is an alpine meadow zone, consisting of Cyperaceae, Poaceae, and Asteraceae.
Although theoretically each modern pollen sample can be assigned to a major vegetation region based on its geographical location, this is difficult and unsound in practice because the vegetation boundaries are transitional and hard to recognize in the field. Moreover, azonal vegetation communities can and often occur locally within a major vegetation region; for example, isolated stands of forest can occur near the ecotone within the alpine meadow region, and shrub meadow or even hot valley deserts can occur within the subalpine conifer forest region. The regional vegetation pattern is further complicated by the altitudinal vegetation zonation. Due to the great variations in elevation, a wide variety of vegetation types can occur within a vegetation region. Therefore, in the field, each pollen sample was classified into a vegetation type (e.g., oak forest, Rhododendron shrub, marshy meadow) according to the local vegetation community from which it is derived, and the characteristic or common plant taxa that occur locally were recorded at each site (Supplementary Material). These local vegetation communities were then aggregated into six main vegetation groups — forest, shrubland, shrub meadow, meadow, steppe, and desert. Among the 234 pollen surface samples, 50 are derived from forest, 37 from shrubland, 20 from shrub meadow, 66 from meadow, 42 from steppe, and 19 from desert. Based on their palynological signatures, the pollen samples from each major vegetation type are classified into several sub-groups by means of cluster analysis (Grimm, 1987). Here we describe the main features of pollen spectra in each vegetation type.
The pollen sample sites are located in the subalpine conifer forest and warm temperate deciduous broadleaved forest regions. The pollen spectra are characterized by high percentages of tree pollen (Figure 3). As expected, the main tree pollen types are Pinus, Abies, Picea, Quercus, and Betula. Common herbaceous pollen types are Artemisia, Poaceae, Cyperaceae, Asteraceae, Thalictrum and Ranunculaceae. Pollen of shrubs such as Salix, Rhododendron, and Rosaceae are frequently present. Pollen spectra can be classified into eight groups based on the local vegetation communities from which the surface samples were collected.
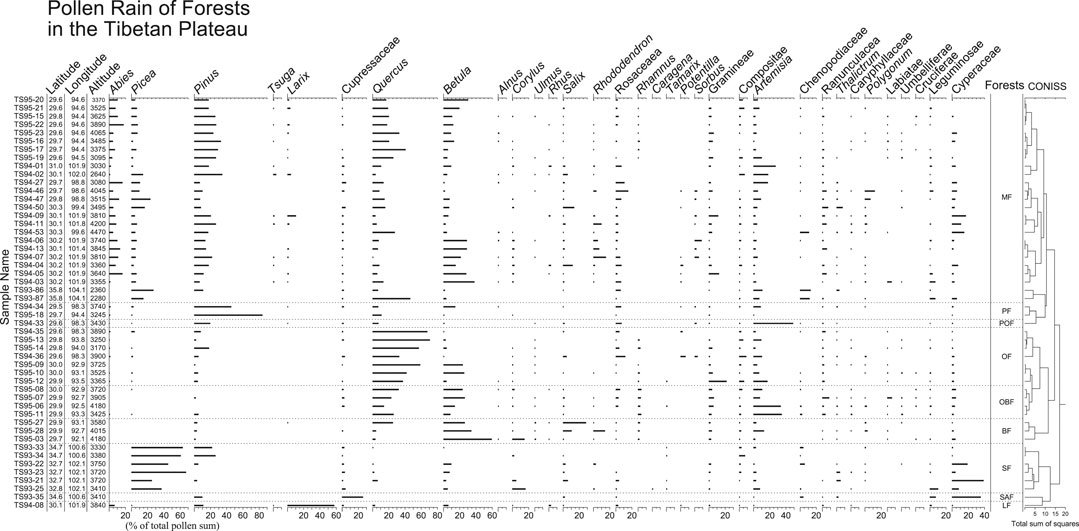
FIGURE 3. Pollen percentage diagram for surface samples from forests in the Tibetan Plateau. Forest types are: subalpine mixed forest (MF), pine forest (PF), pine and oak forest (POF), oak forest (OF), oak and birch forest (OBF), birch forest (BF), spruce forest (SF), juniper forest (JF), and larch forest (LF).
Pollen spectra from subalpine mixed forest (MF) are dominated by tree pollen, including Pinus, Picea, Abies, Quercus, and Betula. Other tree pollen such as Tsuga, Larix, Alnus, and Corylus are also present in most of the pollen samples. The highest percentages of Picea, Pinus, Quercus, and Betula occur in pollen spectra from spruce forest (SF), pine forest (PF), oak forest (OF), and birch forest (BF), respectively. One sample taken from larch forest (LF) has up to 60% Larix pollen, whereas one sample taken from Juniperus forest (JF) contains more than 25% Cupressaceae pollen. The pollen spectra from oak-birch forest (OBF) are mainly composed of tree pollen from Quercus and Betula, but herbaceous pollen like Artemisia can be abundant in some samples. In the pollen spectra from pine-oak forest (POF), Pinus and Quercus are common tree pollen, but the most frequent pollen is Artemisia.
Shrublands generally occur in forest regions above the treeline; few can be found in meadow regions. Pollen spectra (Figure 4) are characterized by high percentages of shrubs such as Rhododendron, Salix, Quercus and Cupressaceae (probably Juniperus). According to their local vegetation types observed in field, pollen spectra are classified into five groups.
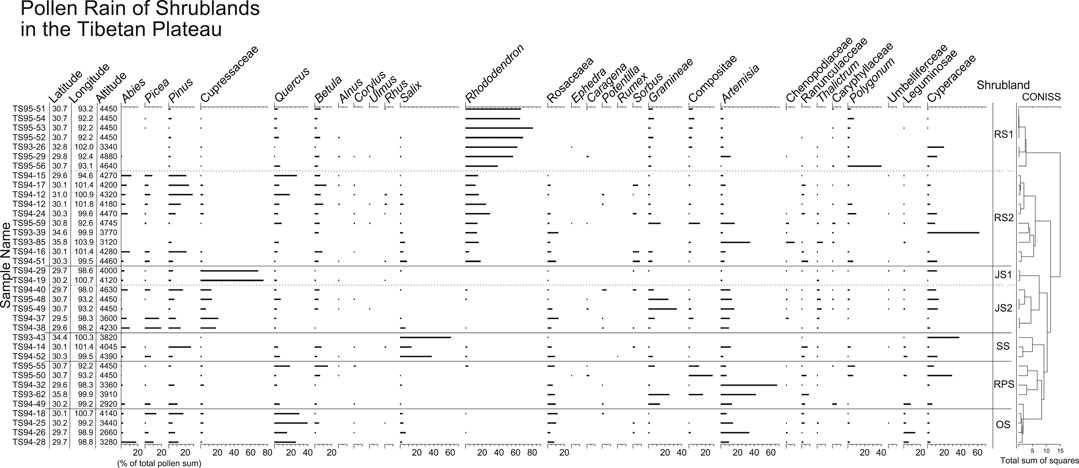
FIGURE 4. Pollen percentage diagram for surface samples from shrublands in the TP. Shrubland types include rhododendron shrub (RS), juniper shrub (JS), willow shrub (WS), rosaceous shrub (RPS) and alpine oak shrub (OS).
Two subgroups of pollen spectra from Rhododendron shrublands (RS) can be recognized based on pollen percentages. Pollen spectra of subgroup RS1 are dominated by Rhododendron pollen, accounting for more than 50% of total pollen sum. Common herbaceous pollen types include Poaceae, Asteraceae, Artemisia, Polygonum, and Cyperaceae. Percentages of tree pollen are low, and only Pinus, Quercus, and Betula pollen are frequently present. Pollen spectra from subgroup RS2 contain somewhat lower percentages of Rhododendron pollen, but tree pollen such as Abies, Picea, Pinus, Quercus, and Betula occur more prominently. Pollen spectra from juniper shrublands (JS) are characterized by high percentages of Cupressaceae pollen. Two pollen spectra (subgroup JS1) are completely dominated by Cupressaceae (>70%). Other pollen spectra (subgroup JS2) have less Cupressaceae pollen (10–30%), but more tree pollen such as Abies, Picea, and Pinus, and more herbaceous pollen from Poaceae and Artemisia. The samples from willow shrublands (WS) have the highest percentages of Salix pollen. Relatively low percentages of Rosaceae pollen and high percentages of herbaceous pollen (Artemisia, Poaceae, Asteraceae, and Cyperaceae) distinguish the pollen spectra of rosaceous shrublands (RPS) from the others. Pollen spectra from alpine dry oak shrublands (OS) are characterized by the highest Quercus pollen percentages among pollen spectra from shrublands, and relatively high percentages of Abies, Picea, Pinus, Rosaceae, and Artemisia.
Shrub meadows occur in the vegetation regions of alpine meadow and shrubland. The main components of shrubs are similar to those in shrublands, including Rhododendron, Salix, Juniperus, and Potentilla. Shrubs are scattered amid meadow herbs as accompanying components, thus they cannot be used as indicators to further distinguish meadows. Pollen spectra from shrub meadows can be classified into five distinct groups (Figure 5) based on the result of cluster analysis on pollen percentages.
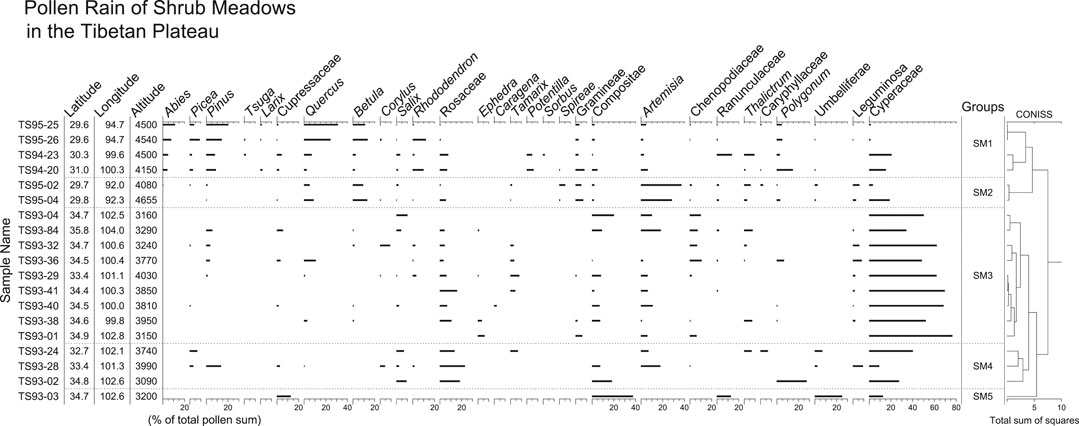
FIGURE 5. Pollen percentage diagram for surface samples from shrub meadows in the TP. Samples of groups SM1 and SM2 are from the southeast, and the others (SM3, SM4, and SM5) from the northeast.
Group SM1 is characterized by its abundance of arboreal pollen, and by moderate amounts of herbaceous pollen such as Artemisia, Cyperaceae, Ranunculaceae, Thalictrum, and Polygonum. The most frequent tree pollen is Quercus, followed by Pinus, Abies, Picea, Betula, and Larix. Common shrub pollen types are Rosaceae, Salix, Rhododendron, and Potentilla. Group SM2 has the highest amounts of Artemisia in shrub meadows, together with moderate amounts of Quercus, Betula, Poaceae, and Cyperaceae. Group SM3 is readily distinguished by its highest Cyperaceae pollen (more than 50% for most samples), low amounts of tree pollen, and some shrub pollen such as Rosaceae, Salix, and Tamarix. Group SM4 is well defined by the highest amounts of Rosaceae pollen (15–25%). The dominants of herbaceous pollen in this group are Cyperaceae, Polygonum, Artemisia, and Asteraceae. Group SM5 contains only one sample. This spectrum is dominated by Asteraceae pollen, together with Cupressaceae, Apiaceae, Cyperaceae, and Ranunculaceae pollen.
In the TP, alpine meadow communities occur not only in the alpine meadow and shrubland regions, but also in areas above treeline in the tropical rainforest-seasonal rainforest and subalpine conifer forest regions. Except in a few samples, pollen spectra are characterized by high percentage of Cyperaceae (more than 50%) and low percentages of arboreal pollen (Figure 6). Seven groups are recognized by cluster analysis of pollen percentages.
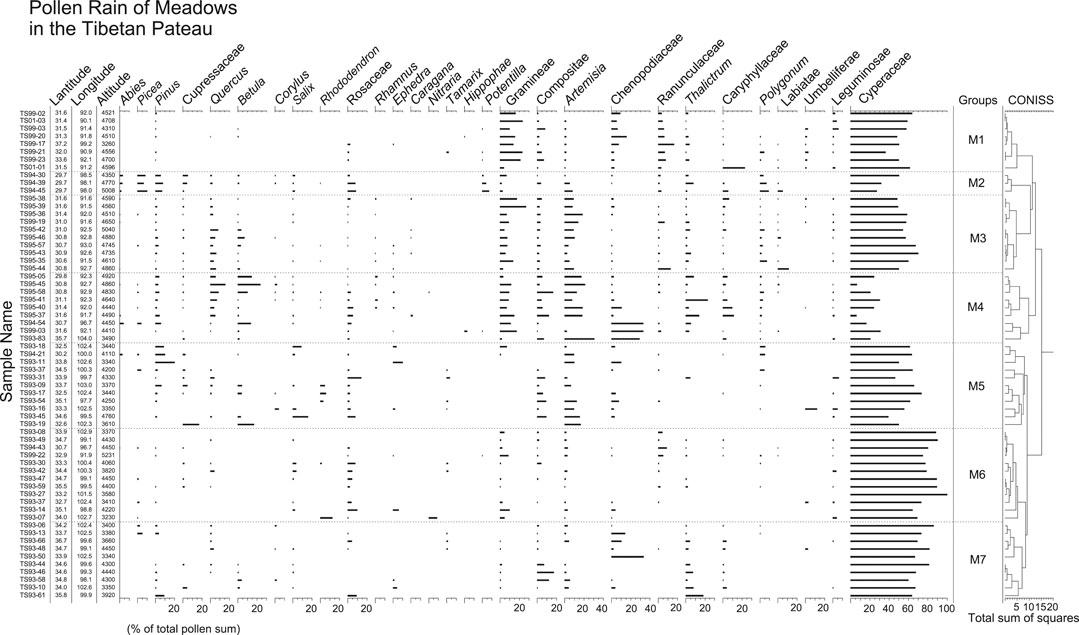
FIGURE 6. Pollen percentage diagram for surface samples from meadows in the TP. Samples of groups M1-3, M4, M5-7 are mainly from alpine meadows, steppe-meadows, and alpine marshy meadows, respectively.
Pollen spectra of group M1 are dominated by Cyperaceae pollen, together with Poaceae, Asteraceae, Chenopodiaceae, and Ranunculaceae. Very few arboreal pollen grains are found in pollen spectra of this group. In group M2, pollen percentages of Cyperaceae, Poaceae, Chenopodiaceae, and Ranunculaceae decrease markedly, whereas arboreal pollen such as Abies, Picea, Pinus, Rosaceae, and Potentilla increase. Cyperaceae dominates the pollen spectra of group M3, with its pollen percentages exceeding 60%. The pollen spectra of group M3 also contain more Artemisia, Quercus, Betula, and less Poaceae and Chenopodiaceae than those of group M1. The lowest percentages of Cyperaceae pollen among pollen spectra from meadows distinguish group M4. Some pollen spectra of group M4 also have the highest amounts of Chenopodiaceae, Artemisia, Thalictrum, Quercus, and Betula pollen. In group M5, 50–75% of the pollen sum are Cyperaceae pollen. Pinus, Artemisia, Rosaceae and Asteraceae pollen are present in modest amounts, whereas Poaceae, Ranunculaceae, Thalictrum, and Caryophyllaceae pollen are absent in the most samples. Pollen spectra of group M6 are characterized by the highest amounts of Cyperaceae pollen (70–100%) in the meadow samples. Comparing to group M6, pollen spectra of group M7 have slightly less Cyperaceae pollen, but more Chenopodiaceae, Asteraceae, and Thalictrum pollen.
Steppe is the most widely-distributed vegetation type in the TP. Three types of steppes, i.e., alpine steppe, high-cold steppe, and dry steppe, can be found in the southern, central and northeastern parts of the Plateau. Pollen spectra from different steppe types have completely different characteristics (Figure 7). The dominants are herbs, including Poaceae, Artemisia, Cyperaceae, Chenopodiaceae and Asteraceae. The samples can be classified into four groups by cluster analysis.
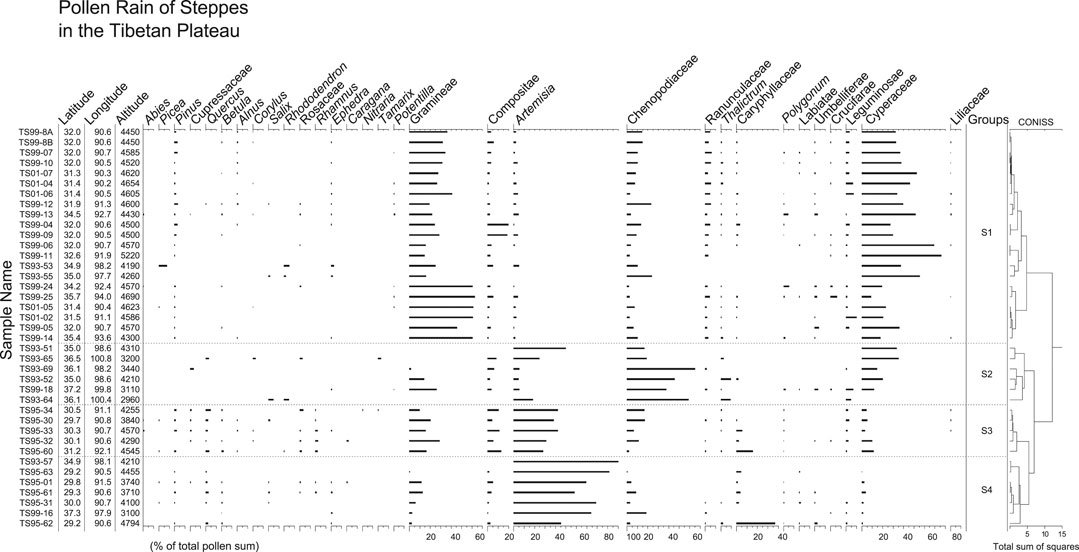
FIGURE 7. Pollen percentage diagram for surface samples form steppes in the TP. Samples of groups S1, S2, S3, and S4 are from Stipa steppe, dry steppe, Poaceae-Artemisia steppe, and Artemisia steppe, respectively.
Pollen spectra of group S1 are dominated by Cyperaceae and Poaceae pollen. Chenopodiaceae, Artemisia, Asteraceae and Fabaceae are present in modest amounts. In group S2, Chenopodiaceae becomes dominant instead of Poaceae, together with modest amounts of Cyperaceae, Artemisia, and Poaceae. Arboreal pollen is present occasionally in both groups S1 and S2. Group S3 is characterized by high pollen percentages of Artemisia (30–50%) and Poaceae (10–30%), and low percentages of arboreal pollen such as Pinus, Quercus, Betula, Cupressaceae, Rosaceae, and Rhamnus. Pollen spectra of group S4 are distinguished by the highest percentages of Artemisia with some Poaceae and Chenopodiaceae pollen.
Nineteen samples were taken from hot valley desert and arid desert communities. The hot valley deserts are an azonal vegetation type occurring in the subalpine conifer forest region in the southeastern part of the Plateau. The arid desert occurs in the Qaidam Basin and the southern margin of the Tarim Basin. Pollen spectra from deserts (Figure 8) are characterized by high pollen percentages of Chenopodiaceae and Artemisia. Common herbaceous pollen types include Cyperaceae, Poaceae, and Asteraceae. Ephedra and Nitraria are the main shrub pollen types. Little tree pollen is found in desert samples except those from hot valley deserts. The pollen samples can be divided into three groups by cluster analysis. Group D1 is distinguished by the highest Chenopodiaceae pollen percentages (>70%). Artemisia and Chenopodiaceae dominate the pollen spectra of group D2, together with some Ephedra and Poaceae. The samples of Group D3 were taken from the hot valley deserts. Their pollen spectra contain very little Chenopodiaceae but relatively high percentages of arboreal pollen, including Abies, Picea, Pinus, Cupressaceae, Quercus, Salix, and Rosaceae. The dominant of herbaceous pollen is Artemisia (27–50%). Poaceae, Asteraceae, Ranunculaceae, Fabaceae, and Cyperaceae are present in low or modest amounts.
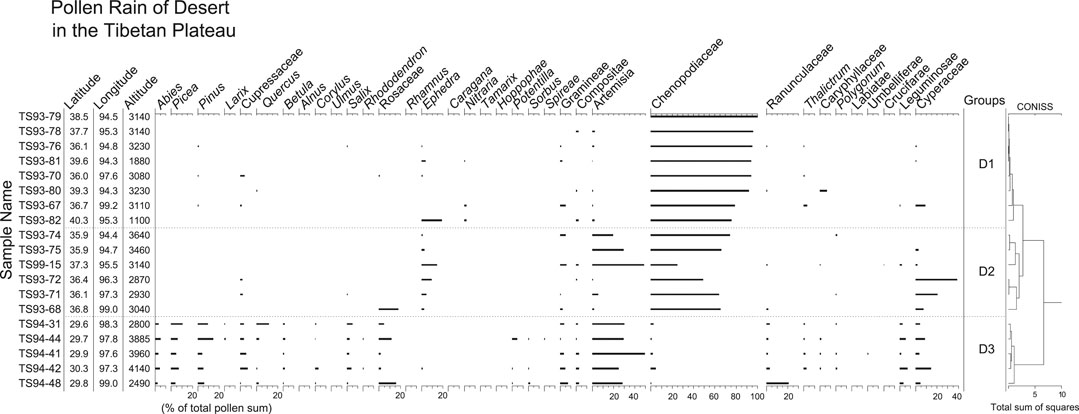
FIGURE 8. Pollen percentage diagram for surface samples from deserts in the TP. Samples of groups D1 and D2 are from arid desert, and samples of group D3 from hot valley desert.
Modern pollen spectra in the TP show a strong relationship with the local vegetation types at the sampling sites. These vegetation types, including forest, shrubland, shrub meadow, meadow, steppe and desert, can be characterized by their pollen spectra.
A summary pollen diagram of all 234 surface samples is plotted in Figure 9 according to the orders they appear in Figures 3–8. Forests are well defined by high amounts of tree pollen. Generally, tree pollen percentages from forests exceed 60%. Pollen spectra from forests not only reflect regional vegetation patterns by their overall composition, but also indicate local forest communities by the relative abundance of their characteristic taxa. Each group of pollen spectra defined by vegetation types corresponds well with the dominant trees in the forests (Figure 10). For example, high percentages of Pinus, Quercus, and Picea clearly indicate the occurrence of pine, oak and spruce forests, respectively. However, some pollen spectra (e.g., TS94-05) from mixed forests also show a complexity in composition, in which some pollen types (e.g., Betula) that occur at relatively high pollen percentages are derived from trees that are not found in their local forest communities. This complexity probably reflects a mosaic vegetation pattern largely controlled by slope aspect and elevation. In the southeast of the Plateau pure or mixed forests of pine, oak, birch, spruce, and fir can occur on adjacent slopes with different aspects within a short distance from each other, thus resulting in a mixed pollen assemblage representing different vegetation types.
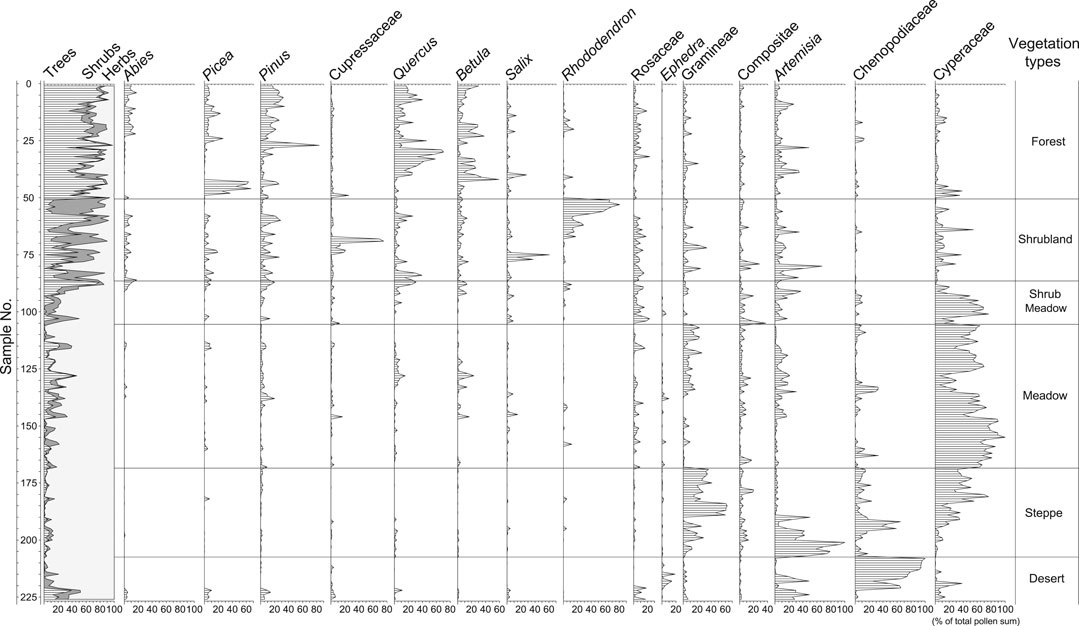
FIGURE 9. Summary pollen diagram of selected pollen types for surface samples in the TP.
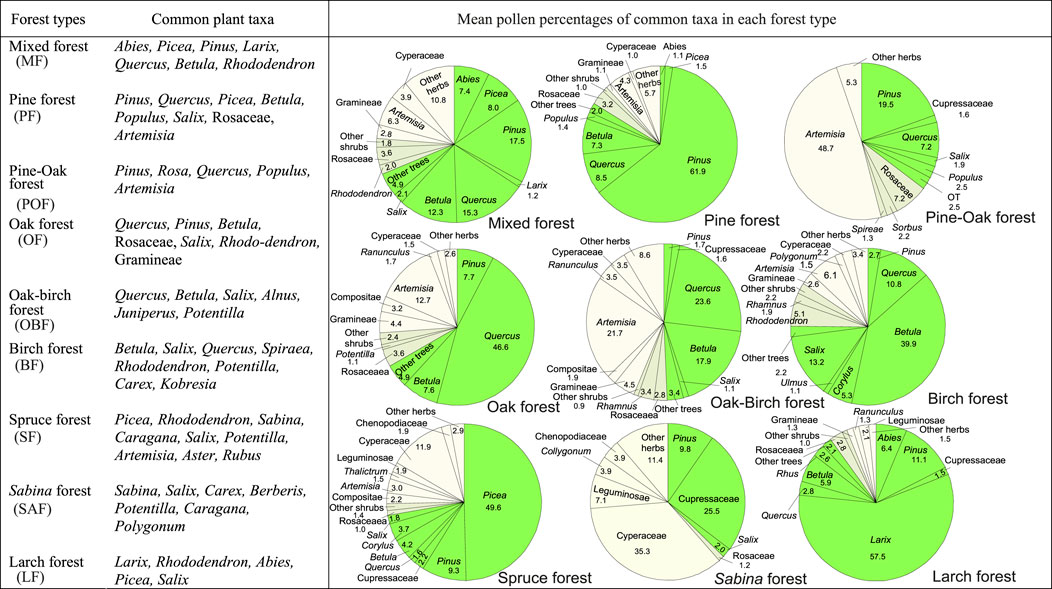
FIGURE 10. Forest types in the TP and their common plant taxa and representative pollen assemblages. Pie graphs in the right show the mean percentages of the common pollen taxa, calculated by averaging the pollen percentages of the corresponding taxa within each group. For forest type classification, see Figure 3.
The samples from shrublands have the highest amounts of shrub pollen (38% on average) among all the samples (Figure 9). The dominants of shrublands, such as rhododendron, juniper, willow, and shrub oak, are well-represented in most of these pollen spectra (Figure 11). However, some pollen spectra have high percentages of both tree pollen and shrub pollen. It should be pointed out that these shrubland samples are easily distinguished from forest samples according to the local vegetation types in the field (e.g., oak shrub and oak forest), however, it is difficult to distinguish them from pollen composition and percentage. They are generally classified into forest group in the numerical analysis of pollen data (Shen et al., 2008a).
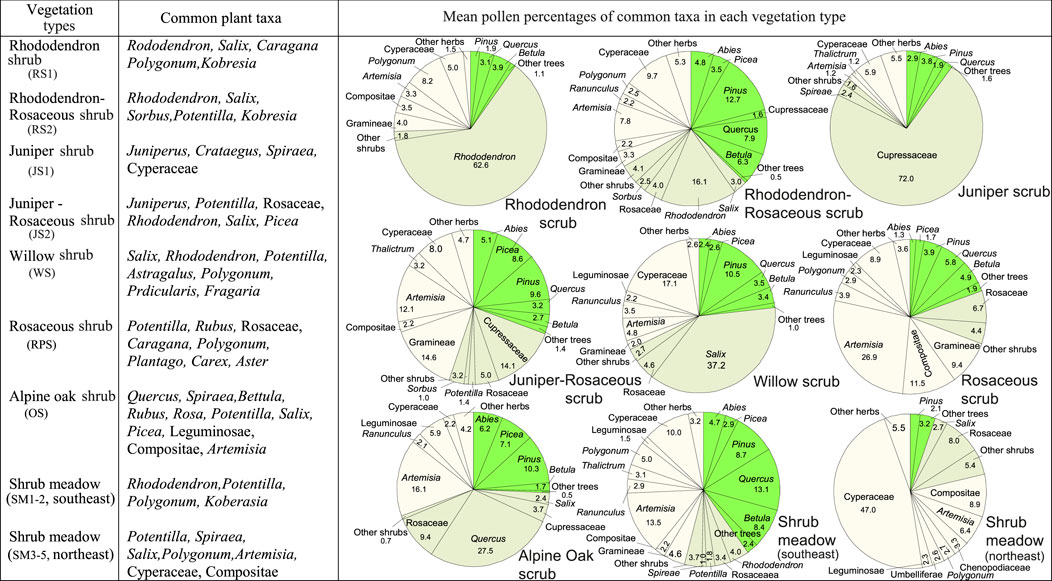
FIGURE 11. Shrubland and shrub meadow types in the TP and their common plant taxa and representative pollen assemblages. Pie graphs in the right show the mean percentages of the common pollen taxa, calculated by averaging the pollen percentages of the corresponding taxa within each group. For Shrubland and shrub meadow type classification, see Figures 4, 5.
Pollen spectra from shrub meadows have less shrub pollen than those from shrublands, but more than those from meadows, steppes, and deserts. The most frequent shrub pollen in this vegetation type is Rosaceae. Except in a few samples with high amounts of Asteraceae and Artemisia, most of the pollen spectra are dominated by Cyperaceae pollen. A major difference in the quantity of tree pollen exists between shrub meadows from the southeast (groups SM1-2) and the northeast (groups SM3, 4, 5) (Figure 11). Pollen spectra from the former region contain more tree pollen than those from the latter region, reflecting a difference in regional vegetation. In the southeast shrub meadows are common vegetation communities near or above treeline, whereas they occur at warmer or more sheltered sites within subalpine or alpine meadows in the northeast where forests are absent or scattered.
In the TP, meadows are dominated by Kobresia. As expected, pollen spectra from meadows are characterized by very high percentages of Cyperaceae. The highest amounts of Cyperaceae pollen occur in pollen spectra from alpine-marshy meadows (groups M6 and M7 in Figure 6) (Figure 12). Pollen spectra from the transitional region between meadows and steppes (referred to as steppe-meadow in Figure 12) have much less Cyperaceae pollen than those from alpine meadows (mainly in the south-central parts of the Plateau) and alpine-marshy meadows (mostly in the eastern Plateau). Besides Cyperaceae pollen, common pollen types in the meadows are Artemisia, Poaceae, Asteraceae, Caryophyllaceae, Polygonum, and Thalictrum, whose producer plants are frequently found in meadows.
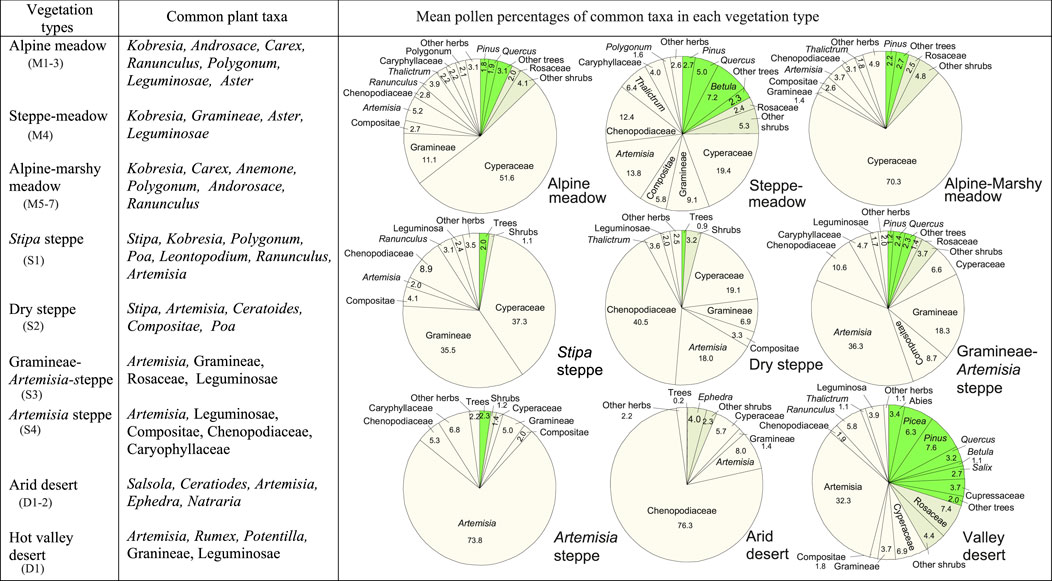
FIGURE 12. Meadow, steppe, and desert types in the TP and their common plant taxa and representative pollen assemblages. Pie graphs in the right show the mean percentages of the common pollen taxa, calculated by averaging the pollen percentages of the corresponding taxa within each group. For meadow, steppe, and desert type classification, see Figures 6–8.
Pollen spectra from Stipa steppes are characterized by the highest percentages of Poaceae pollen, and high Cyperaceae pollen percentages. The general trend is that, the closer the sampling sites are to the steppe/meadow ecotone, the higher the Cyperaceae pollen percentages. Pollen spectra from Artemisia steppes have the highest percentages of Artemisia pollen, whereas pollen spectra from dry steppes located close to the steppe/desert ecotone have relatively high percentages of Chenopodiaceae (Figure 12).
Pollen spectra from the arid desert are dominated by Chenopodiaceae, although Ephedra, Artemisia, Poaceae, and Cyperaceae are frequently present. On the other hand, pollen spectra from the hot valley deserts are distinguished by little or no Chenopodiaceae but relatively high frequencies of Artemisia and arboreal pollen. It is evident that the tree pollen grains are derived from the forests growing on more humid mountain slopes above the river valley.
As expected, tree pollen decreases as the vegetation changes from forests to non-forest vegetation types (Figure 9). However, tree pollen percentages are still higher than 20% for some samples from shrublands, shrub meadows, and even meadows, where no trees grow. Some pollen spectra from non-forest vegetation types above treeline in the West Himalayas and Nepal also have high percentages of tree pollen (Bera and Gupta, 1989; Yonebayashi and Minika, 1997). Many researchers have noted the phenomenon of upslope transportation of low-elevation pollen in mountainous region (Maher, 1963; Flenley, 1979; Markgraf, 1980; Solomon and Silkworth, 1986; Spear, 1989). Winds on the mountains are usually up-valley (anabatic) during the day and down-valley (katabatic) at night. Up-valley wind brings pollen uphill during the afternoon, and pollen is deposited in the afternoon or evening by rainfall (Flenley, 1979; Markgraf, 1980). This distortion of the pollen signal has made it difficult to recognize high elevation vegetation types on the basis of their pollen assemblages in many areas. However, a systematic study of both the local and regional pollen rain from mountainous regions can still permit the identification of vegetation patterns from their high-elevation pollen signatures (Minckley and Whitlock, 2000).
In the TP, pollen samples with relatively high tree pollen percentages from non-forest vegetation types were collected from the forest region. Generally, shrublands, shrub meadows, and meadows are located above the treeline, and conifer forests, oak forests and birch forests grow below them. These pollen spectra thus do indeed detect the vegetation patterns at the regional scale. On the other hand, the local pollen signatures such as high percentages of shrub pollen also reflect their vegetation zones at local level. Therefore, these pollen spectra can be used to identify the vegetation and climate patterns.
Abies, Picea, Pinus, Quercus, and Betula are dominant tree taxa in a variety of forests. It is difficult to discuss their pollen representation in detail without quantitative data on the abundance of their producers. However, based on our qualitative field observations on common plant taxa near the sampling sites (Supplementary Material), we can still make some inference about the pollen representation of these tree taxa. Pollen percentages of Abies never exceed 20% although Abies is very common in some sites. Previous studies have shown that Abies is under-represented in the pollen rain (Jarvis, 1993; Sugita, 1993). Other tree taxa, including Picea, Pinus, Quercus and Betula, are well-represented or even over-represented in the pollen rain. They usually occur at fairly high pollen percentages where their producers are present, and at low to moderate percentages even where their producers are absent. Comparing pollen spectra and local vegetation types, it can be found that Picea is well-represented, whereas Pinus, Quercus, and Betula are over-represented, especially in meadow and desert.
Most of the shrubs are under-represented in the pollen rain. Pollen grains of Rhododendron, Salix, and Juniperus are rarely found beyond their growing area, and rarely exceed 20%. However, high Cupressaceae pollen percentages occur in some samples (e.g., T94–19 and T94-29). This phenomenon is probably due to the sample materials and local vegetation types. These samples are moss polsters instead of top soil collected from Juniperus shrub and Sabina scrub, so pollen spectra are multi-year accumulations of pollen rain experiencing less corrosion after their deposition and high Cupressaceae pollen percentages are not unexpected in these pollen spectra. Rosaceae pollen is present in all sites where the vegetation is dominated by rosaceous shrubs, but its pollen percentages never exceed 25%. For Cyperaceae, Poaceae, Artemisia, and Chenopodiaceae, their pollen is abundantly produced and wind-transported. These herbaceous taxa seem well represented in the pollen rain.
Our modern pollen network consisting of 234 surface samples, which were taken in 1993–1995, 1999 and 2001 before the completion of the Qinghai-Tibet Railway, provides a precious modern pollen and vegetation dataset in the least anthropologically-disturbed TP of China. The results of our study show that modern pollen spectra do reflect the contemporary vegetation at local and regional scales. Therefore, we can use this modern pollen dataset as a basis for reconstructing past vegetational and climatic changes by means of a variety of numerical and mapping methods (Shen et al., 2006, 2008a, b; Lu et al., 2011; Liang et al., 2020; Sun et al., 2020; Chevalier et al., 2020). Detailed vegetational and climatic histories from the TP are vital for testing hypotheses concerning the relative importance between solar insulation changes and altered glacial boundary conditions in controlling the timing and changing strengths of the Southwest Asian monsoon and assessing paleoclimate simulations (Chen et al., 2020; Tang et al., 2021). Thus, this modern pollen database will continue to contribute into vegetational and climatic changes in the TP as well as global changes and biome mapping.
The raw data supporting the conclusion of this article will be made available by the authors, without undue reservation.
K-bL, JO, LT and CS designed the study and did fieldwork; CS did lab work, identified pollen and analyzed pollen data; CS and K-bL wrote the paper.
Special Project for Basic Research of Yunnan Province - Key Project (Grant No. 202101AS070006), the Yunnan Project for the Introduction of Advanced Talents (Grant No. 2013HA024), the National Natural Science Foundation of China (Grant Nos. 41372191, 42067061, 49371068 and 49871078), and the U.S. National Science Foundation (NSF grants ATM-9410491, ATM-0081941).
The authors declare that the research was conducted in the absence of any commercial or financial relationships that could be construed as a potential conflict of interest.
All claims expressed in this article are solely those of the authors and do not necessarily represent those of their affiliated organizations, or those of the publisher, the editors and the reviewers. Any product that may be evaluated in this article, or claim that may be made by its manufacturer, is not guaranteed or endorsed by the publisher.
This research was supported by grants from Special Project for Basic Research of Yunnan Province - Key Project (Grant Nos. 202101AS070006), the Yunnan Project for the Introduction of Advanced Talents (Grant Nos. 2013HA024), the National Natural Science Foundation of China (Grant Nos.. 41372191, 42067061, 49371068 and 49871078), and the U.S. National Science Foundation (NSF grants ATM-9410491, ATM-0081941).
The Supplementary Material for this article can be found online at: https://www.frontiersin.org/articles/10.3389/feart.2021.732441/full#supplementary-material
Bartlein, P. J., Prentice, I. C., and Webb, T. (1986). Climatic Response Surfaces from Pollen Data for Some Eastern North American Taxa. J. Biogeogr. 13, 35–57. doi:10.2307/2844848
Bera, S. K., and Gupta, H. P. (1989). Correlation between Pollen Spectra and Vegetation of Chhora Shigri Glacier in Himachal Pradesh, India. Palaeobot 38, 404–410.
Birks, H. J. B., Heiri, O., Seppä, H., and Bjune, A. E. (2010). Strengths and Weaknesses of Quantitative Climate Reconstructions Based on Late-Quaternary Biological Proxies. Open Ecol. J. 3, 68–110. doi:10.2174/1874213001003020068
Chang, D. H. S. (1981). The Vegetation Zonation of the Tibetan Plateau. Mountain Res. Dev. 1, 29–49. doi:10.2307/3672945
Chen, F., Zhang, J., Liu, J., Cao, X., Hou, J., Zhu, L., et al. (2020). Climate Change, Vegetation History, and Landscape Responses on the Tibetan Plateau during the Holocene: A Comprehensive Review. Quat. Sci. Rev. 243, 106444. doi:10.1016/j.quascirev.2020.106444
Chen, J. H., Lv, F. Y., Huang, X. Z., Birks, H. J. B., Telford, R. J., Zhang, S. R., et al. (2017). A Novel Procedure for Pollen-Based Quantitative Paleoclimate Reconstructions and its Application in China. Sci. Chin. Earth Sci. 60, 2059–2066. doi:10.1007/s11430-017-9095-1
Chevalier, M., Davis, B. A. S., Heiri, O., Seppä, H., Chase, B. M., Gajewski, K., et al. (2020). Pollen-based Climate Reconstruction Techniques for Late Quaternary Studies. Earth-Science Rev. 210, 103384. doi:10.1016/j.earscirev.2020.103384
Davis, B. A. S., Zanon, M., Collins, P., Mauri, A., Bakker, J., Barboni, D.., et al. (2013). The European Modern Pollen Database (EMPD) Project. Veg Hist. Archaeobot 22 (6), 521–530.
Delcourt, P. A., Decourt, H. R., and Davidson, J. L. (1987). Mapping and Calibration of Modern Pollen-Vegetation Relationships in the southeastern United States. Rev. Palaeobot Palynol 39, 1–45.
Editorial Broad of Sichuan's Vegetation (1980). The Vegetation of Sichuan. Chengdu: Sichuan People's Press. (in Chinese).
Edward Schofield, J., Edwards, K. J., and Andy McMullen, J. (2007). Modern Pollen?vegetation Relationships in Subarctic Southern Greenland and the Interpretation of Fossil Pollen Data from the Norse Landnam. J. Biogeogr. 34 (3), 473–488. doi:10.1111/j.1365-2699.2006.01607.x
Gajewski, K., Lezine, A-M., Vincens, A., Delestand, A., and Sawadab, M. (2002). The African Pollen DatabaseModern Climate-Vegetation-Pollen Relations in Africa and Adjacent Areas. Quat. Sci. Rev. 21 (14–15), 1611–1631. doi:10.1016/s0277-3791(01)00152-4
Ge, Y., Li, Y., Bunting, M. J., Li, B., Li, Z., and Wang, J. (2017). Relation between Modern Pollen Rain, Vegetation and Climate in Northern China: Implications for Quantitative Vegetation Reconstruction in a Steppe Environment. Sci. Total Environ. 586, 25–41. doi:10.1016/j.scitotenv.2017.02.027
Grimm, E. C. (1987). CONISS: A FORTRAN 77 Program for Stratigraphically Constrained Cluster Analysis by the Method of Incremental Sum of Squares. Comput. Geosciences 13, 13–35. doi:10.1016/0098-3004(87)90022-7
Herzschuh, U., Birks, H. J. B., Mischke, S., Zhang, C., and Böhner, J. (2010). A Modern Pollen-Climate Calibration Set Based on lake Sediments from the Tibetan Plateau and its Application to a Late Quaternary Pollen Record from the Qilian Mountains. J. Biogeogr. 37, 752–766. doi:10.1111/j.1365-2699.2009.02245.x
Institute of Geography (1990). Map of the Qinghai-Tibet Plateau. Beijing: Science Press. (in Chinese).
Jarvis, D. I., and Clay-Poole, S. T. (1992). A Comparison of Modern Pollen Rain and Vegetation in Southwestern Sichuan Province, China. Rev. Palaeobotany Palynology 75, 239–258. doi:10.1016/0034-6667(92)90018-c
Jarvis, D. I. (1993). Pollen Evidence of Changing Holocene Monsoon Climate in Sichuan Province, China. Quat. Res. 39, 325–337. doi:10.1006/qres.1993.1039
Li, W. Y. (1991). Relationships between Pollen and Plant of Abies Fargesii forest and its Succession in the Shennongjia Mountain. Acta Geogr. Sin 46, 186–194. (in Chinese).
Li, X., and Liu, J. (1988). Holocene Vegetational and Environmental Changes at Mt. Luoji, Sichuan. Acta Geogra Sin 43, 44–51. (in Chinese).
Li, Y., Zhang, X., Zhou, G., and Ni, J. (2000). Quantitative Relationship between Vegetation and Pollen for Several Common Taxa in North China. Chin. Sci. Bull. 45, 761–764. doi:10.1007/bf02898901
Liang, C., Zhao, Y., Qin, F., Zheng, Z., Xiao, X., Ma, C., et al. (2020). Pollen-based Holocene Quantitative Temperature Reconstruction on the Eastern Tibetan Plateau Using a Comprehensive Method Framework. Sci. China Earth Sci. 63, 1144–1160. doi:10.1007/s11430-019-9599-y
Liu, K.-b., and Lam, N. S.-N. (1985). Paleovegetational Reconstruction Based on Modern and Fossil Pollen Data: an Application of Discriminant Analysis. Ann. Assoc. Am. Geogr. 75, 115–130. doi:10.1111/j.1467-8306.1985.tb00062.x
Liu, K.-b. (1988). Quaternary History of the Temperate Forests of China. Quat. Sci. Rev. 7, 1–20. doi:10.1016/0277-3791(88)90089-3
Lu, H., Wu, N., Liu, K.-b., Zhu, L., Yang, X., Yao, T., et al. (2011). Modern Pollen Distributions in Qinghai-Tibetan Plateau and the Development of Transfer Functions for Reconstructing Holocene Environmental Changes. Quat. Sci. Rev. 30, 947–966. doi:10.1016/j.quascirev.2011.01.008
Ma, Q., Zhu, L., Lu, X., Wang, Y., Guo, Y., Wang, J., et al. (2017). Modern Pollen Assemblages from Surface lake Sediments and Their Environmental Implications on the Southwestern Tibetan Plateau. Boreas 46 (2), 242–253. doi:10.1111/bor.12201
Maher, L. J. (1963). Pollen Analyses of Surface Materials from the Southern San Juan Mountains, Colorado. Geol. Soc. America Bull. 74, 1485–1504. doi:10.1130/0016-7606(1963)74[1485:paosmf]2.0.co;2
Markgraf, V. (1980). Pollen Dispersal in a Mountain Area. Grana 19, 127–146. doi:10.1080/00173138009424995
Members of China Quaternary Pollen Database (2001). Simulation of China Biome Reconstruction Based on Pollen Data from Surface Sediment Samples. Acta Bot. Sin 43, 201–209. (in Chinese).
Minckley, T., and Whitlock, C. (2000). Spatial Variation of Modern Pollen in Oregon and Southern Washington, USA. Rev. Palaeobotany Palynology 112, 97–123. doi:10.1016/s0034-6667(00)00037-3
Seppä, H., Birks, H. J. B., Odland, A., Poska, A., and Veski, S. (2010). A Modern Pollen-Climate Calibration Set from Northern Europe: Developing and Testing a Tool for Palaeoclimatological Reconstructions. J. Biogeogr. 31 (2), 251–267. doi:10.1111/j.1365-2699.2004.00923.x
Shen, C., and Tang, L. (1992). Holocene Climate Based on Pollen Transfer Functions in Changbaishan Mountain and Xiaoxinanling Ranges. In: Climate and Environment during Holocene Megathermal in China (eds by Y Shi, and Z Kong), pp.34–39. Beijing: China Ocean Press (in Chinese)
Shen, C., Liu, K.-b., Morrill, C., Overpeck, J. T., Peng, J., and Tang, L. (2008b). Ecotone Shift and Major Droughts during the Mid-late Holocene in the Central Tibetan Plateau. Ecology 89 (4), 1079–1088. doi:10.1890/06-2016.1
Shen, C., Liu, K.-b., Tang, L., and Overpeck, J. T. (2008a). Numerical Analysis of Modern and Fossil Pollen Data from the Tibetan Plateau. Ann. Assoc. Am. Geogr. 98 (4), 755–772. doi:10.1080/00045600802232342
Shen, C., Liu, K.-b., Tang, L., and Overpeck, J. T. (2006). Quantitative Relationships between Modern Pollen Rain and Climate in the Tibetan Plateau. Rev. Palaeobotany Palynology 140, 61–77. doi:10.1016/j.revpalbo.2006.03.001
Solomon, A. M., and Silkworth, A. B. (1986). Spatial Patterns of Atmospheric Pollen Transport in a Montane Region,. Quat. Res. 25, 150–162. doi:10.1016/0033-5894(86)90053-0
Spear, R. W. (1989). Late‐Quaternary History of High‐Elevation Vegetation in the White Mountains of New Hampshire. Ecol. Monogr. 59, 125–151. doi:10.2307/2937283
Sugita, S. (1993). A Model of Pollen Source Area for an Entire Lake Surface. Quat. Res. 39, 239–244. doi:10.1006/qres.1993.1027
Sun, X., Du, N., Chen, Y., Gu, Z., Liu, J., and Yuan, B. (1993). Pollen Analyses of Lacustrine Sediment in Seling Co, Tibet. Acta Bot. Sin 35, 943–950. (in Chinese).
Sun, Y., Xu, Q., Zhang, S., Li, Y., Li, M., Li, Y., et al. (2020). A Novel Procedure for Quantitative Regional Paleoclimatic Reconstruction Using Surface Pollen Assemblages. Quat. Sci. Rev. 240, 106385. doi:10.1016/j.quascirev.2020.106385
Tang, L., Shen, C., Lu, H., Li, C., and Ma, Q. (2021). 青藏高原第四纪孢粉研究五十年. Sci. Sin.-Terrae. (in Chinese). doi:10.1360/SSTe-2020-0361
Tibetan Investigation Group (1988). Vegetation of Xizang (Tibet). Beijing: Science Press. (in Chinese).
Van Campo, E., and Gasse, F. (1993). Pollen- and Diatom-Inferred Climatic and Hydrological Changes in Sumxi Co Basin (Western Tibet) since 13,000 Yr B.P. Quat. Res. 39, 300–313. doi:10.1006/qres.1993.1037
Wang, J. T. (1988). The Steppes and Deserts of the Xizang Plateau (Tibet). Vegetatio 75, 135–142. doi:10.1007/bf00044634
Webb, T., and Bryson, R. A. (1972). Late- and Postglacial Climatic Change in the Northern Midwest, USA: Quantitative Estimates Derived from Fossil Pollen Spectra by Multivariate Statistical Analysis. Quat. Res. 2, 70–115. doi:10.1016/0033-5894(72)90005-1
Weng, C. Y., Sun, X., and Chen, Y. (1989). Numerical Characteristics of Pollen Assemblages of Surface Samples from the West Kunlun Mountains. Acta Bot. Sin 35, 69–79. (in Chinese).
Xiao, J., Wu, Y., and Zheng, M. (1996). A Preliminary Study on lake Quaternary flora in Chaby Lake, Xizang (Tibet). Acta Micropaleontol Sin 13, 305–400. (in Chinese).
Xu, Q., Zhang, S., Gaillard, M.-j., Li, M., Cao, X., Tian, F., et al. (2016). Studies of Modern Pollen Assemblages for Pollen Dispersal- Deposition- Preservation Process Understanding and for Pollen-Based Reconstructions of Past Vegetation, Climate, and Human Impact: a Review Based on Case Studies in China. Quat. Sci. Rev. 149, 151–166. doi:10.1016/j.quascirev.2016.07.017
Yao, Z. (1989). Surface Pollen Analysis in Zhongtiao Mountain, China. Acta Geogra Sin 44, 469–477. (in Chinese).
Yonebayashi, C., and Minaki, M. (1997). Late Quaternary Vegetation and Climatic History of Eastern Nepal. J. Biogeogr. 24, 837–843.
Yu, G., Tang, L., Yang, X., Ke, X., and Harrison, S. P. (2001). Modern Pollen Samples from alpine Vegetation on the Tibetan Plateau. Glob. Ecol Biogeogr 10, 503–519. doi:10.1046/j.1466-822x.2001.00258.x
Zheng, Z., Huang, K., Xu, Q., Lu, H., Cheddadi, R., Luo, Y., et al. (2008). Comparison of Climatic Threshold of Geographical Distribution between Dominant Plants and Surface Pollen in China. Sci. China Ser. D-earth Sci. 51 (8), 1107–1120. doi:10.1007/s11430-008-0080-x
Zheng, Z., Wei, J., Huang, K., Xu, Q., Lu, H., Tarasov, P., et al. (2014). East Asian Pollen Database: Modern Pollen Distribution and its Quantitative Relationship with Vegetation and Climate. J. Biogeogr. 41, 1819–1832. doi:10.1111/jbi.12361
Keywords: modern pollen rain, forest, shrubland, shrub meadow, meadow, steppe, desert, the Tibetan plateau
Citation: Shen C, Liu K-b, Tang L and Overpeck JT (2021) Modern Pollen Rain in the Tibetan Plateau. Front. Earth Sci. 9:732441. doi: 10.3389/feart.2021.732441
Received: 29 June 2021; Accepted: 11 August 2021;
Published: 23 August 2021.
Edited by:
Feng Cheng, University of Nevada, Reno, United StatesReviewed by:
Yunfa Miao, Northwest Institute of Eco-Environment and Resources (CAS), ChinaCopyright © 2021 Shen, Liu, Tang and Overpeck. This is an open-access article distributed under the terms of the Creative Commons Attribution License (CC BY). The use, distribution or reproduction in other forums is permitted, provided the original author(s) and the copyright owner(s) are credited and that the original publication in this journal is cited, in accordance with accepted academic practice. No use, distribution or reproduction is permitted which does not comply with these terms.
*Correspondence: Caiming Shen, Y21zaGVuQGhvdG1haWwuY29t
Disclaimer: All claims expressed in this article are solely those of the authors and do not necessarily represent those of their affiliated organizations, or those of the publisher, the editors and the reviewers. Any product that may be evaluated in this article or claim that may be made by its manufacturer is not guaranteed or endorsed by the publisher.
Research integrity at Frontiers
Learn more about the work of our research integrity team to safeguard the quality of each article we publish.