 Shanwei Liu1
 Qinting Sun
 Jianhua Wan
95% of researchers rate our articles as excellent or good
Learn more about the work of our research integrity team to safeguard the quality of each article we publish.
Find out more
ORIGINAL RESEARCH article
Front. Earth Sci. , 09 November 2021
Sec. Environmental Informatics and Remote Sensing
Volume 9 - 2021 | https://doi.org/10.3389/feart.2021.730777
This article is part of the Research Topic Application of Satellite Altimetry in Marine Geodesy and Geophysics View all 18 articles
The purpose of this paper is to analyze the influence of satellite altimetry data accuracy on the marine gravity anomaly accuracy. The data of 12 altimetry satellites in the research area (5°N–23°N, 105°E–118°E) were selected. These data were classified into three groups: A, B, and C, according to the track density, the accuracy of the altimetry satellites, and the differences of self-crossover. Group A contains CryoSat-2, group B includes Geosat, ERS-1, ERS-2, and Envisat, and group C comprises T/P, Jason-1/2/3, HY-2A, SARAL, and Sentinel-3A. In Experiment I, the 5′×5′ marine gravity anomalies were obtained based on the data of groups A, B, and C, respectively. Compared with the shipborne gravity data, the root mean square error (RMSE) of groups A, B, and C was 4.59 mGal, 4.61 mGal, and 4.51 mGal, respectively. The results show that high-precision satellite altimetry data can improve the calculation accuracy of gravity anomaly, and the single satellite CryoSat-2 enables achieving the same effect of multi-satellite joint processing. In Experiment II, the 2′×2′ marine gravity anomalies were acquired based on the data of groups A, A + B, and A + C, respectively. The root mean square error of the above three groups was, respectively, 4.29 mGal, 4.30 mGal, and 4.21 mGal, and the outcomes show that when the spatial resolution is satisfied, adding redundant low-precision altimetry data will add pressure to the calculation of marine gravity anomalies and will not improve the accuracy. An effective combination of multi-satellite data can improve the accuracy and spatial resolution of the marine gravity anomaly inversion.
Because the density distribution inside the actual Earth is very uneven, the actual observed gravity value always deviates from the theoretical normal gravity value, and the difference between the observed gravity field and the field of a reference model is called the gravity anomaly (Kaban et al., 2011). Altimeter satellites can periodically obtain high-resolution, all-weather, and long-term global ocean observation data except the polar region, which is of great significance to the study of gravity anomaly inversion in large-scale sea areas. Studies have shown that the error of satellite altimetry data is proportional to the inversion error of gravity anomaly (Li et al., 2015). Therefore, research on the accuracy of satellite altimetry data and the selection of suitable satellite altimetry data combination can improve the accuracy of inversion marine gravity anomaly.
Up to now, 18 altimetry satellites have been launched successively. Moreover, we have an uninterrupted satellite altimetry dataset for more than 30 years. It provides data support for the study of marine gravity anomaly inversion from multi-source satellite altimetry data fusion. After successful acquisition of satellite altimetry data such as T/P (Traon et al., 1994), Jason-1 (Dorandeu et al., 2004), Jason-2 (Ablain et al., 2010), SARAL (Prandi et al., 2015), and HY-2A (Peng et al., 2015), the launch agencies and researchers evaluated them systematically and studied the accuracy and stability of the altimetry system and so on. There are certain differences in period, spatial resolution, and altitude measurement precision among satellite altimetry data. After evaluating the new and old satellite altimetry systems, the rules of multi-source satellite altimetry data fusion can be determined for marine gravity anomaly inversion. As a whole, the accuracy of the satellite altimetry data is constantly improving. And with the increasing accuracy of satellite altimetry data, the spatial resolution and accuracy of gravity anomaly inversion can be improved by combining the newly launched satellite altimetry data.
Satellite altimetry data contain abundant high-frequency information, which provides strong support for marine gravity research. Joint multiple-source altimetry data can improve the accuracy and resolution of marine gravity anomaly inversion. At present, a host of scholars have done numerous work in the marine gravity field (Huang et al., 2001; Li et al., 2003; Sandwell et al., 2013; Sandwell et al., 2014; Liang et al., 2020; Nguyen et al., 2020; Wan et al., 2020; Wang et al., 2020). The accuracy of marine gravity anomaly inversion from satellite altimetry data has reached 4 mGal–10 mGal approximately. The main methods to retrieve marine gravity anomalies from satellite altimetry data include least-squares collocation, Stokes inverse algorithm, and inverse Vening Meinesz formula method.
The least-squares collocation method is the first method to invert marine gravity anomalies using satellite altimetry data. Hofmann-Wellenhof introduced this method in physical geodesy (Hofmann-Wellenhof, 2005) in detail, and then Sandwell (Sandwell, 1984) and Hwang (Hwang, 1989; Hwang et al., 1995) further studied and improved this method and used the improved method to invert marine gravity anomalies. This method has favorable calculation stability, especially in offshore areas. In addition, this method can fuse multiple-source gravity data to improve the accuracy of marine gravity anomaly inversion (Wang et al., 2005). However, this method has a large amount of calculation, which is only suitable for calculating marine gravity anomalies in small regions and is not suitable for the calculation of large-scale marine gravity anomalies. The Stokes inverse algorithm is evolved from the Stokes formula. Xu and others used this method to invert the 30′ × 30′ marine gravity anomaly in offshore China (Xu et al., 1999) with an accuracy of 3.5 mGal. This method can eliminate the influence of sea surface topography, but with less robustness. The vertical deviation method is also known as the inverse Vening Meinesz formula method, and the marine gravity anomaly can be calculated by using the inverse Vening Meinesz formula with the vertical deviation as the initial value. This method is currently the main method to retrieve marine gravity anomalies with multi-source altimetry satellite data. A multitude of team scholars use this method to retrieve marine gravity anomalies, such as Sandwell (1992), Knudsen (1991), and Andersen (1998), and others invert global marine gravity anomalies by using Geosat/GM and ERS-1 altimetry data with this method. Li and others used this method to invert marine gravity anomalies in the offshore China and its adjacent areas (Wang et al., 2001).
The vertical deviation method for inversion of marine gravity anomalies is currently the most widely used method with the most effective inversion. However, in the process of joint inversion of multi-source satellite altimetry data, the method does not consider the influence of uneven accuracy of multi-source satellite altimetry data on joint inversion and does not consider whether the joint multi-source satellite altimetry data meet the data volume requirements of the inversion resolution. In this paper, we evaluate the accuracy of each satellite’s altimetry data, selectively combine the altimetry satellite data, and analyze the influence of various combinations of different satellite altimetry data on the inversion of marine gravity anomaly. The most suitable combination of satellite altimetry data is also selected by evaluating the accuracy with shipborne gravity data. Finally, the 1′ × 1′ marine gravity anomaly is obtained by combining the multi-source satellite altimetry data inversion.
While inverting the marine gravity anomaly with multi-source satellite altimetry data, fine processing on every satellite’s altimetry data can reduce the influence of data error and improve the accuracy of the marine gravity anomaly inversion, including data screening and editing, collinear adjustment, and cross point adjustment.
Geosat, ERS-1, T/P, ERS-2, Jason-1, Envisat, Jason-2, CryoSat-2, HY-2A, SARAL, Jason-3, and Sentinel-3A satellite altimetry data were selected for joint processing in this paper, including Exact Repeat Mission (ERM) and Geodetic Mission (GM) data. T/P, Envisat, Jason-1, Jason-2, Jason-3, and SARAL satellite data can be viewed and downloaded from the AVISO website (https://www.aviso.altimetry.fr/). Geosat satellite data can be viewed and downloaded from the NOAA website (https://data.noaa.gov/dataset/dataset/data-records-derived-from-geosat-geodetic-mission-gm-and-exact-repeat-mission-erm-data-fro-19891). ERS-1, ERS-2, CryoSat-2, and Sentinel-3A satellite data can be viewed and downloaded from the ESA website (https://www.esa.int/). HY-2A satellite data can be viewed and downloaded from the NSOAS website (https://osdds.nsoas.org.cn/MarineDynamic). The details are listed in Table 1 and Table 2.
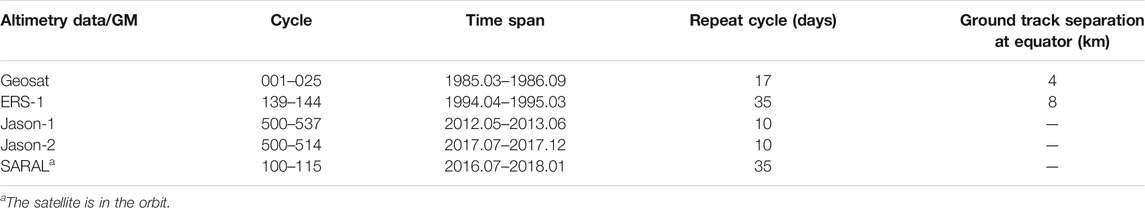
TABLE 1. Information of the satellite altimetry GM data.
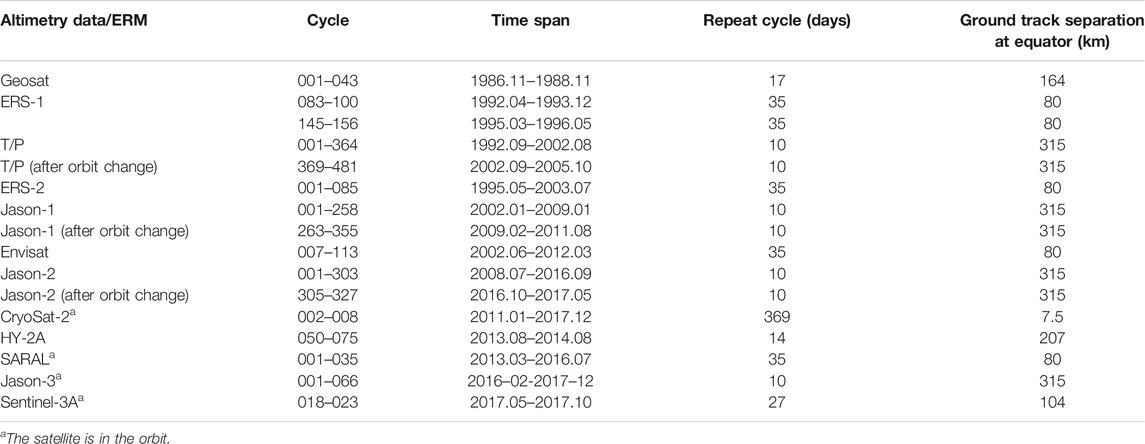
TABLE 2. Information of the satellite altimetry ERM data.
The shipborne gravity data collected in this paper are derived from a special project for comprehensive survey and evaluation of China’s offshore ocean and are acquired by different departments in multiple time periods of measurement, distributed in different regions. The data are finely processed to obtain shipborne gravity data anomalies with a spatial resolution of about 30′ (Huang, 1990; Huang, 1993; Li et al., 2002; Liu et al., 2012; Ke et al., 2015). In this paper, shipborne gravity data from the South China Sea with low spatial resolution are used, and their distribution is shown in Figure 1. We take the shipborne gravity data as the real value, match the satellite gravity anomaly with the location where the shipborne data points are located, and evaluate the accuracy of the experimental results by comparing the inverse marine gravity anomaly with the shipborne gravity data.
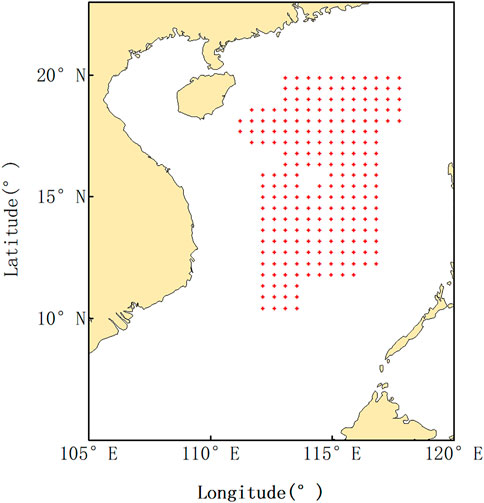
FIGURE 1. Distribution map of shipborne gravity data. The red mark is the location of the ship gravity anomaly.
The data accuracy of China offshore and its vicinity was analyzed, which provides the basis for the joint rules of multiple-source satellite altimetry data. First, in order to ensure the data quality of the study area, the land, sea ice, rainfall, and other invalid or polluted observation points were deleted. Data were edited by using marking and threshold screening criteria in the altimetry satellite data handbook (Blanc et al., 1996; National Oceanic and Atmospheric Administration (NOAA), 1997; Gilbert et al., 2014; Bronner et al., 2016; Dumont et al., 2017; Picot et al., 2018; Soussi et al., 2018; Mertz et al., 2019; National Satellite Ocean Application Service (NSOAS), 2019; European Space Agency (ESA), 2019; Bignalet-Cazalet et al., 2021).
According to the characteristics of the repeated orbits of altimetry satellites, the ERM data of each altimetry satellite were collinearly processed, respectively (Jiang et al., 2002). The observed values on the same pass number of different cycles were adjusted to the reference orbit, so as to weaken the influence of sea surface time variation and random noise (Braun et al., 2004). The differences of self-crossover before and after collinear adjustment are described in Table 3.
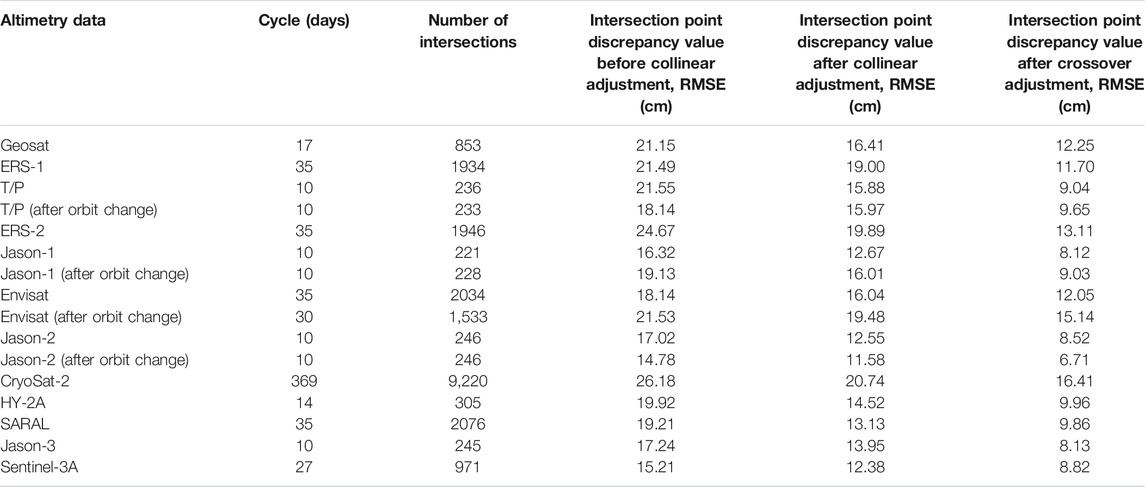
TABLE 3. Statistical results before and after collinear and crossover adjustment.
The ERM data after collinear adjustment still contain system deviation, radial orbit error, and so on. In order to eliminate these errors as much as possible, crossover adjustment (Zhang, 2015) for the satellite altimetry data after collinear adjustment was carried out, and the differences before and after crossover adjustment are shown in Table 3.
It is shown that the differences of self-crossover were reduced with different degrees after collinear adjustment, and that of SARAL was reduced by 6.08 cm at most. The RMSE of CryoSat-2 after collinear adjustment was reduced less because the cycle of CryoSat-2 is 1 year and the time-varying effect of sea surface is large. The RMSEs were reduced with different degrees after crossover adjustment. Among them, those of T/P, Jason-1/2/3, HY-2A, SARAL, and Sentinel-3A were reduced to less than 10 cm; those of Geosat, ERS-1, ERS-2, and Envisat were all above 10 cm, with slightly poor accuracy; and CryoSat-2 had the largest RMSE, which is limited by its long cycle of 365 days besides its own accuracy error.
GM data have non-repeat orbits. GM data underwent crossover adjustment without collinear adjustment.
After crossover adjustment, satellite data are processed separately according to the grouping. Ellipsoid and orbit frame unification is carried out for the satellite data in the same group (Din et al., 2019), and all data are calibrated to the TP reference. Then, preprocessing satellite altimetry data were obtained through crossover adjustment between each satellite’s data.
In this paper, the Hwang method (Hwang et al., 1998; Hwang et al., 2002) was used to invert the vertical deviation, and then marine gravity anomaly was obtained by using the inverse Vening Meinesz formula (Hwang et al., 1996; Hwang, 1998).
The remove–restore method (Sansò et al., 2013) was used to reflect the high-frequency information in the satellite altimetry data and the long-wave advantages of the gravity field model, which improved the inversion accuracy. The remove–restore technique consists of two steps. The first step is to remove the model interpolation geoid height from the geoid height, and then the residual geoid height is obtained. The second step is to restore the effect of the model gravity field and the inner circle marine gravity field to the residual marine gravity field. The final grid marine gravity anomaly (as shown in Figure 2) is composed of three parts: the EGM2008 gravity field model gravity anomaly (U.S. National Geospatial-Intelligence Agency EGM Development Team, 2010), the residual marine gravity anomaly, and the inner circle marine gravity anomaly. The steps to calculate the grid point gravity anomaly are as follows:
1) The geoid height at the measurement point is obtained by subtracting the DOT2008A sea surface topography model (U.S. National Geospatial-Intelligence Agency EGM Development Team, 2010) from the preprocessing satellite altimetry data.
2) The residual geoid height is obtained by subtracting the EGM2008 model interpolation geoid height from the geoid height.
3) The residual vertical deviation along the track and the residual vertical deviation grid data is obtained by using the Hwang method.
4) The residual marine gravity anomaly is obtained by using the inverse Vening Meinesz formula, with an integral radius of 30′.
5) The inner circle marine gravity anomaly is obtained by using the Vening Meinesz formula.
6) The final grid marine gravity anomaly is obtained by adding the EGM2008 model marine gravity anomaly, residual marine gravity anomaly, and inner circle marine gravity anomaly.
7) The accuracy of grid marine gravity anomaly is evaluated by using shipborne gravity data as the real value. The grid marine gravity anomaly was interpolated to the shipborne data points by taking the shipborne data points as the center and 12′ as the radius of the circle. The interpolation method is the inverse distance weight (Hartmann et al., 2018). Finally, the interpolated gravity data are compared with the shipborne gravity data.
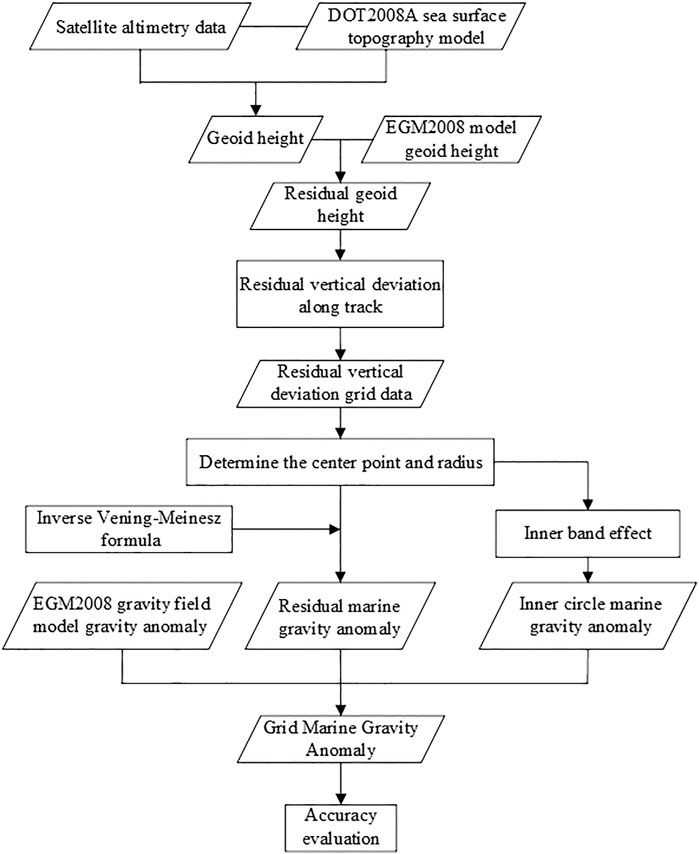
FIGURE 2. Flowchart of gravity anomaly inversion.
The experimental groups in this paper are shown in Table 4. All satellite altimetry data are divided into three groups according to the altimetry satellite orbit density, accuracy, and self-crossing point discrepancy. Group A contains the new CryoSat-2 single satellite data, group B includes Geosat, ERS-1, ERS-2, and Envisat with lower accuracy, and group C contains T/P, Jason-1/2/3, HY-2A, SARAL, and Sentinel-3A with higher accuracy. The CryoSat-2 single satellite is added to low-precision group B to form the A + B group and to high-precision group C to form the A + C group. Firstly, 5′ × 5′ marine gravity anomaly data were set up by using groups A, B, and C, respectively, and the accuracy results of marine gravity anomaly inversion corresponding to each group were analyzed. Then, 2′ × 2′ marine gravity anomaly data were established by using the A, A + B, and A + C groups to test the impact of the addition of new satellites on the inversion accuracy.
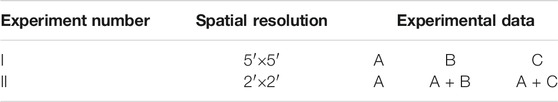
TABLE 4. Experimental design and grouping.
According to the distribution range of shipborne gravity data, the gravity anomaly inversion study area of the experiment is set as 5°N–23°N, 105°E–118°E. The ground tracks corresponding to the satellite altimetry data of groups A, B, and C are shown in Figure 3.
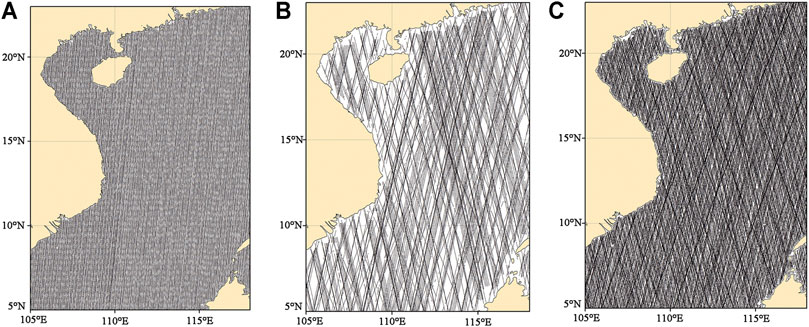
FIGURE 3. Ground tracks corresponding to the satellite altimetry data of groups A (A), B (B), and C (C).
The experiments were carried out according to the marine gravity anomaly inversion method with 30′ as the integral radius, and the 5′ × 5′ and 2′ × 2′ marine gravity anomalies in the study area were calculated, respectively, by using the preprocessed data of each group. Figure 4 shows the 5′ × 5′ marine gravity anomaly results calculated from the three groups A, B, and C in Experiment I and the 2′ × 2′ marine gravity anomaly results calculated from the three groups A, A + B, and A + C in Experiment II.
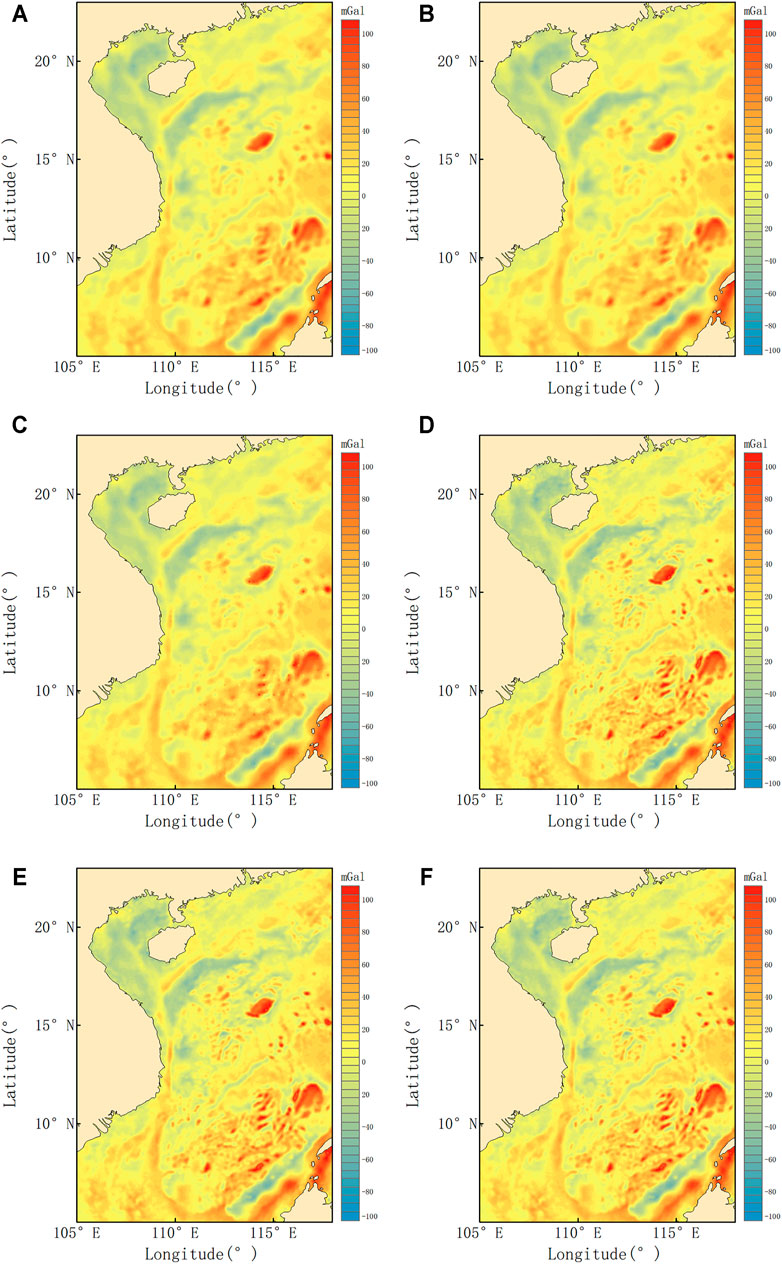
FIGURE 4. Map of the marine gravity anomaly in the study area: 5′×5′ marine gravity anomaly results calculated by the three groups A (A), B (B), and C (C) in Experiment I and 2′×2′ marine gravity anomaly results calculated by the three groups A (D), A + B (E), and A + C (F) in Experiment II.
It can be seen from Figure 4 that the inversion of the 5′ × 5′ and 2′ × 2′ marine gravity anomalies can clearly reflect the distribution of large gravity anomalies in the ocean, and the 2′ × 2′ marine gravity anomaly has more details than 5′ × 5′. Comparing the inverted six kinds of marine gravity anomaly results with the shipborne gravity data, the accuracy evaluation results are shown in Table 5, and the scatter plot compared with shipborne gravity data is shown in Figure 5.
1) Accuracy evaluation of 5′ × 5′ marine gravity anomaly
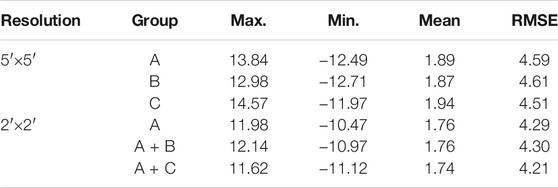
TABLE 5. 5′×5′ and 2′×2′ satellite gravity inversion results compared with shipborne gravity anomaly data (unit: mGal).
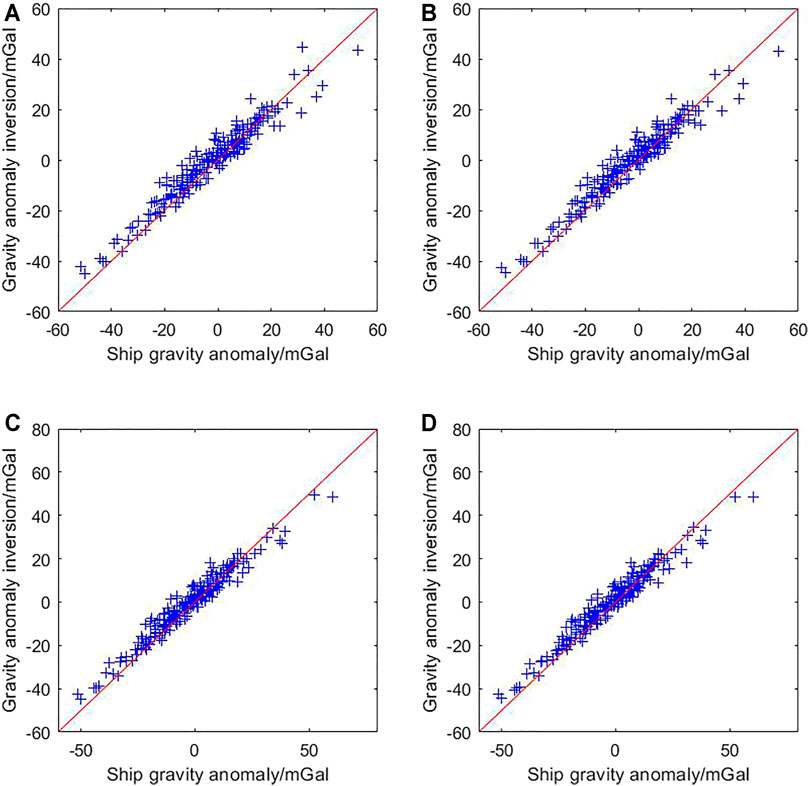
FIGURE 5. Scatter plot image compared with shipborne gravity anomaly data. Comparison of the gravity anomaly data obtained by the B (A), C (B), A + B (C), and A + C (D) satellite altimetry data inversion with the shipborne gravity anomaly data. The red line is the y = x straight line. The blue mark is the value corresponding to the gravity anomaly inversion data and the shipborne gravity anomaly data.
The RMSE of group A, B, and C satellite altimetry data is 4.59 mGal, 4.61 mGal, and 4.51 mGal, respectively. The overall maintenance is around 4 mGal, and the effect is favorable. A single satellite group A inversion result is close to that of high-precision satellite group C. The CryoSat-2 single altimetry satellite can achieve the effect of multi-source satellite joint, and its accuracy is slightly higher than that of low-precision altimetry satellite joint inversion. Figure 5A shows a scatter plot of the comparison between the group B data and the shipborne gravity data, and Figure 5B shows the scatter plot of the comparison between the group C data and the shipborne gravity data, both of which are distributed on both sides of a straight line y = x. But the overall deviation of group B is larger than that of group C. The results show that high-precision altimetry data can improve the inversion accuracy of gravity anomalies.
2) Accuracy evaluation of 2′×2′ marine gravity anomaly
The RMSE of group A, B, and C satellite altimetry data is 4.29 mGal, 4.30 mGal, and 4.21 mGal, respectively. Compared with the result of 5′ × 5′ marine gravity anomaly, the RMSE has a certain reduction. Figures 5C,D show scatter plots of the comparison between group A + B and A + C data and shipborne gravity data, respectively. The overall deviation degree is better than that in Figures 5A,B. The results show that the inversion results of CryoSat-2 alone are higher than the joint inversion results of the low-precision satellite group and lower than the joint inversion results of the high-precision satellite group. On the basis of CryoSat-2 data, two groups of data B and C were added, respectively, and the calculation accuracy of gravity anomaly has been reduced and improved, respectively. It is shown that the calculation accuracy of gravity anomalies can be reduced by adding redundant data with lower accuracy when the spatial resolution is satisfied, and the effective combination of multi-source satellite altimetry data can improve the accuracy of marine gravity anomaly calculations and spatial resolution.
By comparing the results of 5′ × 5′ and 2′ × 2′ gravity anomalies by using the altimetry data of group A satellites, the accuracy of gravity anomaly calculation has increased by 0.30 mGal after the spatial resolution is improved. Combined with the orbit density of CryoSat-2 data, it is shown that the CryoSat-2 single satellite can satisfy the calculation requirements of 2′ × 2′ gravity anomaly.
All the mean values are above 1 mGal. Indeed, the marine gravity anomaly inversion is slightly higher than the shipborne gravity data. The accuracy of the marine gravity anomalies obtained by combining the satellites of groups A, B, and C is higher than that of the marine gravity anomalies calculated by each group individually. The highest accuracy of the marine gravity anomaly is obtained by combining CryoSat-2 with group C, which has higher accuracy, in the process of calculating the marine gravity anomaly with high spatial resolution. It indicates that the combination of multi-source satellite data can effectively improve the accuracy of gravity anomaly calculation, and the single satellite CryoSat-2 enables achieving the same effect of multi-satellite joint processing.
According to the above analysis, the highest accuracy of marine gravity anomaly is obtained by using CryoSat-2 combined with the higher accuracy group C. The accuracy of TP series satellites in group C is higher, but the T/P, Jason-1, Jason-2, and Jason-3 satellite data have the same ground track. Therefore, TP and Jason-1 data with a relatively old time in group C are not used in this paper.
In this paper, we used CryoSat-2, SARAL/ERM, SARAL/GM, Jason-2/ERM, Jason-2/GM, Jason-3, Sentinel-3A, and HY-2A satellite altimetry data to invert the gravity anomalies. These data are evenly distributed without blind areas and meet the 1′×1′ gravity anomaly inversion accuracy. The obtained 1′×1′ marine gravity anomalies are shown in Figure 6.

FIGURE 6. Map of the 1′×1′ marine gravity anomaly in the study area.
It can be seen from Figure 6 that the 1′×1′ marine gravity anomaly can better reflect the details of gravity distribution. The internationally recognized global gravity anomaly models are the EGM2008 model and Sandwell V25.1 model, but these two models are less applicable to regional gravity anomalies. The gravity data obtained by shipboard measurements are more responsive to local gravity anomalies. Therefore, the results of the EGM2008 model gravity anomaly, the Sandwell V25.1 gravity anomaly, and the inversion data of this paper are compared with the shipborne gravity anomaly data, respectively, and the comparison results are shown in Table 6.
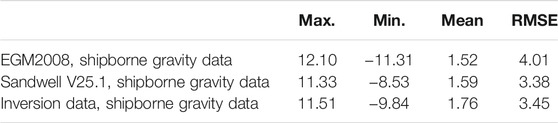
TABLE 6. Models and inversion data statistical results compared with shipborne gravity anomaly data (unit: mGal).
From the results, it can be seen that the overall root mean square error of the 1′×1′ gravity anomaly inversion using the remove–restore method in combination with the EGM2008 gravity field model is 3.45 mGal, which is better than the EGM2008 gravity field model comparison value of 4.01 mGal. It is comparable to the Sandwell V25.1 comparison value of 3.38 mGal.
In this paper, 12 altimetry satellites, such as CryoSat-2, Geosat, ERS-1, ERS-2, Envisat, T/P, Jason-1/2/3, HY-2A, SARAL, and Sentinel-3A, are selected to carry out gravity anomaly calculation experiments in groups. The results show the following:
1) High-precision altimetry data can improve the calculation accuracy of gravity anomalies. CryoSat-2 has a better measurement accuracy and higher orbit density. So, a single altimetry satellite can achieve the effect of multi-source altimetry satellite fusion.
2) When the spatial resolution meets the requirements, the accuracy of marine gravity anomaly has no significant impact by adding redundant low-precision altimetry data, but it will increase the calculation pressure.
Publicly available datasets were analyzed in this study. These data can be found here: AVISO website (https://www.aviso.altimetry.fr/), ESA (European Space Agency) (https://earth.esa.int/), National Oceanic and Atmospheric Administration (NOAA; https://www.nesdis.noaa.gov/), and NSOAS (National Satellite Ocean Application Service) (http://www.nsoas.org.cn/eng/).
SL and JW conceptualized and designed the study. SL was involved in data quality control. QS and YL were responsible for data collection and scientific analysis. QS, YJ, and JJ wrote the manuscript. All authors contributed to the article and approved the submitted version.
This research was supported by the Fundamental Research Funds for the Central Universities (17CX02071), the NSFC (61571009), and the Key R&D Program of Shandong Province (2018GHY115046).
The authors declare that the research was conducted in the absence of any commercial or financial relationships that could be construed as a potential conflict of interest.
All claims expressed in this article are solely those of the authors and do not necessarily represent those of their affiliated organizations, or those of the publisher, the editors, and the reviewers. Any product that may be evaluated in this article, or claim that may be made by its manufacturer, is not guaranteed or endorsed by the publisher.
The authors would like to thank the editors and would also like to thank the AVISO website of the French Space Center (CNES) (https://www.aviso.altimetry.fr/), ESA (European Space Agency) (https://earth.esa.int/), National Oceanic and Atmospheric Administration (NOAA) https://www.nesdis.noaa.gov/), and NSOAS (National Satellite Ocean Application Service) (http://www.nsoas.org.cn/eng/) for providing the satellite altimetry data.
Ablain, M., Philipps, S., Picot, N., and Bronner, E. (2010). Jason-2 Global Statistical Assessment and Cross-Calibration with Jason-1. Mar. Geodesy 33, 162–185. doi:10.1080/01490419.2010.487805
Andersen, O. B., and Knudsen, P. (1998). Global Marine Gravity Field from the ERS-1 and Geosat Geodetic Mission Altimetry. J. Geophys. Res. 103, 8129–8137. doi:10.1029/97JC02198
Bignalet-Cazalet, F., Couhert, A., Queruel, N., Urien, S., Carrere, L., Tran, N., et al. (2021). SARAL/AltiKa Products Handbook. SALP-MU-M-OP-15984-CN, Issue: 3.1. Available online at: https://www.aviso.altimetry.fr/fileadmin/documents/data/tools/SARAL_Altika_products_handbook.pdf. (Accessed August 10, 2021).
Blanc, F., Borra, M., Boudou, P., D'Alessio, S., Gaspar, P., Greenwood, N., et al. (1996). Aviso User Handbook: Merged Topex/Poseidon Products. AVI-NT-02-101-CN, Issue 3.1. Available online at: https://www.aviso.altimetry.fr/fileadmin/documents/data/tools/hdbk_tp_gdrm.pdf. (Accessed August 10, 2021).
Braun, A., Yi, Y., and Shum, C. K. (2004). Altimeter Collinear Analysis. Satellite Altimetry and Gravimetry: Theory and Applications. Lecture Notes. Available at: https://geodesy.geology.ohio-state.edu/course/gs873.2013/lectures/alt_collinear_analysis.pdf. (Accessed August 10, 2021).
Bronner, E., Picot, N., Desjonqueres, J. D., Desal, S., Hausman, L., Carrere, L., et al. (2016). Jason-1 Products Handbook. SAL-MU-M5-OP-13184-CN, Issue 3.1. Available online at: https://www.aviso.altimetry.fr/fileadmin/documents/data/tools/hdbk_j1_gdr.pdf. (Accessed August 10, 2021).
Din, A. H. M., Zulkifli, N. A., Hamden, M. H., and Aris, W. A. W. (2019). Sea Level Trend over Malaysian Seas from Multi-Mission Satellite Altimetry and Vertical Land Motion Corrected Tidal Data. Adv. Space Res. 63 (11), 3452–3472. doi:10.1016/j.asr.2019.02.022
Dorandeu, J., Ablain, M., FAUGèRE, Y., Mertz, F., Soussi, B., and Vincent, P. (2004). Jason-1 Global Statistical Evaluation and Performance Assessment: Calibration and Cross-Calibration Results. Mar. Geodesy 27, 345–372. doi:10.1080/01490410490889094
Dumont, J. P., Rosmorduc, V., Carrere, L., Picot, N., Bronner, E., Couhert, A., et al. (2017). OSTM/Jason-2 Products Handbook. SALP-MU-M-OP-15815-CN, Issue: 1.11. Available online at: https://www.aviso.altimetry.fr/fileadmin/documents/data/tools/hdbk_j2.pdf. (Accessed August 10, 2021).
European Space Agency (ESA) (2019). Sentinel-3 Altimetry Technical Guide. Available online at: https://sentinel.esa.int/web/sentinel/technical-guides/sentinel-3-altimetry/. (Accessed August 10, 2021).
Gilbert, L., Baker, S., Dolding, C., Vernier, A., Brockley, D., Martinez, B., et al. (2014). Reaper Product Handbook for ERS Altimetry Reprocessed Products. REA-UG-PHB-7003, Issue 3.1. Available online at: https://earth.esa.int/eogateway/documents/20142/37627/Reaper-Product-Handbook-3.1.pdf/bfc28740-c732-ab17-40d3-309ab65c3743.
Hartmann, K., Krois, J., and Waske, B. (2018). E-learning Project SOGA: Statistics and Geospatial Data Analysis. Freie Universitaet Berlin: Department of Earth Sciences. Available online at: https://www.geo.fu-berlin.de/en/v/soga/Geodata-analysis/geostatistics/Inverse-Distance-Weighting/index.html.
Huang, M. (1990). Examination, Adjustment and Precision Estimation of Half-Systematic Error in Marine Gravity Surveying. Mar. Sci. Bull. 9, 81–86. CNKI: SUN: HUTB.0.1990-04-012.
Huang, M. (1993). Marine Gravity Survey Line Network Adjustment. Acta Geod. Cartogr. Sin. 22, 103–110. CNKI:SUN:CHXB.0.1993-02-003. doi:10.1108/eb005954
Huang, M., Zhai, G., and Guan, Z. (2001). On the Recovery of Gravity Anomalies from Altimeter Data. Acta Geod. Cartogr. Sin. 30, 179–184. doi:10.3321/j.issn:1001-1595.2001.02.014
Hwang, C. (1989). High Precision Gravity Anomaly and Sea Surface Height Estimation from Geos-3/Seasat Altimeter Data, Report No. 399. Columbus: Dept. of Geodetic Science and Surveying, The Ohio State University.
Hwang, C., Hsu, H.-Y., and Jang, R.-J. (2002). Global Mean Sea Surface and Marine Gravity Anomaly from Multi-Satellite Altimetry: Applications of Deflection-Geoid and Inverse Vening Meinesz Formulae. J. Geodesy 76 (8), 407–418. doi:10.1007/s00190-002-0265-6
Hwang, C. (1998). Inverse Vening Meinesz Formula and Deflection-Geoid Formula: Applications to the Predictions of Gravity and Geoid over the South China Sea. J. Geodesy 72, 304–312. doi:10.1007/s001900050169
Hwang, C., Kao, E.-C., and Parsons, B. (1998). Global Derivation of Marine Gravity Anomalies from Seasat, Geosat, ERS-1 and TOPEX/POSEIDON Altimeter Data. Geophys. J. Int. 134 (2), 449–459. doi:10.1111/j.1365-246X.1998.tb07139.x
Hwang, C., and Parsons, B. (1996). An Optimal Procedure for Deriving Marine Gravity from Multi-Satellite Altimetry. Geophys. J. R. Astron. Soc. 125, 705–718. doi:10.1111/j.1365-246X.1996.tb06018.x
Hwang, C., and Parsons, B. (1995). Gravity Anomalies Derived from Seasat, Geosat, ERS-1 and TOPEX/POSEIDON Altimetry and Ship Gravity: A Case Study over the Reykjanes Ridge. Geophys. J. Int. 122, 551–568. doi:10.1111/j.1365-246X.1995.tb07013.x
Jiang, W., Li, J., and Wang, Z. (2002). Determination of Global Mean Sea Surface WHU2000 Using Multi-Satellite Altimetric Data. Chin. Sci Bull 47 (19), 1664–1668. doi:10.1360/02tb9365
Kaban, M. K. (2011). “Gravity Anomalies, Interpretation,” in Encyclopedia of Solid Earth Geophysics. Encyclopedia of Earth Sciences Series. Editor H. K Gupta (Dordrecht: Springer), 456–461. doi:10.1007/978-90-481-8702-7_88
Ke, P., Zhang, C., Guo, C., Wang, B., and Yang, L. (2015). Research on the System Error Correction for Shipborne Gravimetric Data of Different Region in China Offshore. Geomatics Inf. Sci. Wuhan Univ. 40, 417–421. doi:10.13203/j.whugis20130299
Knudsen, P. (1991). Simultaneous Estimation of the Gravity Field and Sea Surface Topography from Satellite Altimeter Data by Least-Squares Collocation. Geophys. J. Int. 104, 307–317. doi:10.1111/j.1365-246X.1991.tb02513.x
Le Traon, P. Y., Stum, J., Dorandeu, J., Gaspar, P., and Vincent, P. (1994). Global Statistical Analysis of TOPEX and POSEIDON Data. J. Geophys. Res. 99, 24619–24631. doi:10.1029/94JC01110
Li, J., Ning, J., Chen, J., and Chao, D. (2003). Geoid Determination in China Sea Areas. Acta Geod. Cartogr. Sin. 32, 1001–1595. doi:10.3321/j.issn:1001-1595.2003.02.004
Li, M., Liu, Y., Huang, M., and Zhai, G. (2002). Three Models for Determination of Survey Line Systematic Errors in Marine Survey Net. J. Inst. Surv. Mapp. 19, 157–161. CNKI: SUN: JFJC.0.2002-03-000.
Li, Y., and Zhang, R. (2015). Inference of Altimeter Accuracy on Along-Track Gravity Anomaly Recovery. Acta Geod. Cartogr. Sin. 44, 363–369. doi:10.11947/j.AGCS.2015.20140022
Liang, W., Li, J., Xu, X., Zhang, S., and Zhao, Y. (2020). A High-Resolution Earth's Gravity Field Model SGG-UGM-2 from GOCE, GRACE, Satellite Altimetry, and EGM2008. Engineering 6, 860–878. doi:10.1016/j.eng.2020.05.008
Liu, Y., Li, M., and Huang, M. (2012). The Rank-Defect Adjustment Model for Survey Line Systematic Errors in Marine Survey Net. Geomatics Inf. Sci. Wuhan Univ. 26, 533–538. doi:10.3321/j.issn:1671-8860.2001.06.013
Mertz, F., Bouffard, J., and Féménias, P. (2019). Baseline-C CryoSat Ocean Processor Ocean Product Handbook. Issue: 4.1. Available online at: https://earth.esa.int/documents/10174/125272/CryoSat-Baseline-C-Ocean-Product-Handbook. (Accessed August 10, 2021).
National Oceanic and Atmospheric Administration (NOAA) (1997). The Geosat Altimeter JGM-3 GDRS on CD-ROM. Available online at: https://www.nodc.noaa.gov/archive/arc0024/0053056/2.2/about/userhandbook.pdf. (Accessed August 10, 2021).
National Satellite Ocean Application Service (NSOAS) (2019). HY-2B Satellite Altimeter Data Product Handbook. Available online at: https://osdds-ftp.nsoas.org.cn/main.html?download&weblink=a573def5960804423de16d7c37eabac1&lang=schinese. (Accessed August 10, 2021).
Nguyen, V.-S., Pham, V.-T., Van Nguyen, L., Andersen, O. B., Forsberg, R., and Tien Bui, D. (2020). Marine Gravity Anomaly Mapping for the Gulf of Tonkin Area (Vietnam) Using Cryosat-2 and Saral/AltiKa Satellite Altimetry Data. Adv. Space Res. 66, 505–519. doi:10.1016/j.asr.2020.04.051
Peng, H., Lin, M., Mu, B., and Wu, Z. (2015). Global Statistical Evaluation and Performance Analysis of HY-2A Satelite Radar Altimeter Data. Acta Oceanol. Sin. 37, 54–66. doi:10.3969/j.issn,0253-4193201507.006
Picot, N., Marechal, C., Couhert, A., Desai, S., Scharroo, R., and Egido, A. (2018). Jason-3 Products Handbook. SALP-MU-M-OP-16118-CN, Issue: 1.5. Available online at: https://www.aviso.altimetry.fr/fileadmin/documents/data/tools/hdbk_j3.pdf.
Prandi, P., Philipps, S., Pignot, V., and Picot, N. (2015). SARAL/AltiKa Global Statistical Assessment and Cross-Calibration with Jason-2. Mar. Geodesy 38, 297–312. doi:10.1080/01490419.2014.995840
Sandwell, D., Garcia, E., Soofi, K., Wessel, P., Chandler, M., and Smith, W. H. F. (2013). Toward 1-mGal Accuracy in Global Marine Gravity from CryoSat-2, ENVISAT, and Jason-1. The Leading Edge 32, 892–899. doi:10.1190/tle32080892.1
Sandwell, D. T. (1992). Antarctic Marine Gravity Field from High-Density Satellite Altimetry. Geophys. J. Int. 109, 437–448. doi:10.1111/j.1365-246X.1992.tb00106.x
Sandwell, D. T., Müller, R. D., Smith, W. H. F., Garcia, E., and Francis, R. (2014). New Global marine Gravity Model from CryoSat-2 and Jason-1 Reveals Buried Tectonic Structure. Science 346, 65–67. doi:10.1126/science.1258213
Sandwell, D. T. (1984). Thermomechanical Evolution of Oceanic Fracture Zones. J. Geophys. Res. 89, 11401–11413. doi:10.1029/JB089iB13p11401
Sansò, F., and Sideris, M. G. (2013). “Observables of Physical Geodesy and Their Analytical Representation,” in Geoid Determination. Lecture Notes in Earth System Sciences. Editors F. Sansò, and M. Sideris (Berlin, Heidelberg: Springer), 110, 73–110. doi:10.1007/978-3-540-74700-0_2
Soussi, B., Urien, S., Picard, B., Muir, A., Roca, M., and Garcia, P. (2018). ENVISAT Altimetry Level 2 Product Handbook. V2.0.CLS-ESLF-18-0003, Issue 2.0Available online at: https://earth.esa.int/eogateway/documents/20142/37627/PH_light_2rev0_ESA.pdf/711e748d-2db7-d131-1060-3deace1973b3.(Accessed August 10, 2021).
U.S. National Geospatial-Intelligence Agency EGM Development Team (2010). EGM2008 - Files & Products for Oceanographic Applications. Available at: https://earth-info.nga.mil/. (Accessed August 10, 2021).
Wan, X., Jin, S., Liu, B., Tian, S., Kong, W., and Annan, R. F. (2020). Effects of Interferometric Radar Altimeter Errors on Marine Gravity Field Inversion. Sensors 20, 2465. doi:10.3390/s20092465
Wang, H., and Wang, G. (2001). Inversion of Gravity Anomalies from along Track Vertical Deflections with Satellite Altimeter Data and its Applications. Acta Geod. Cartogr. Sin. 30, 21–26. doi:10.3321/j.issn:1001-1595.2001.01.005
Wang, H., Wang, Y., Lu, Y., and Zan, J. (2005). Inversion of Marine Gravity Anomalies by Combinating Multi Altimeter Data and Shipborne Gravimetric Data. Crustal Deform. Earthquake 25, 81–85. doi:10.16251/j.cnki.1009-2307.2016.06.004-en
Wang, Z., Chao, N., and Chao, D. (2020). Using Satellite Altimetry Leveling to Assess the marine Geoid. Geodesy and Geodynamics 11, 106–111. doi:10.1016/j.geog.2019.11.003
Keywords: marine gravity anomaly, shipborne gravity data, accuracy evaluation, CryoSat-2, South China Sea and its adjacent regions
Citation: Liu S, Li Y, Sun Q, Wan J, Jiao Y and Jiang J (2021) Evaluation of Marine Gravity Anomaly Calculation Accuracy by Multi-Source Satellite Altimetry Data. Front. Earth Sci. 9:730777. doi: 10.3389/feart.2021.730777
Received: 25 June 2021; Accepted: 04 October 2021;
Published: 09 November 2021.
Edited by:
Cheinway Hwang, National Chiao Tung University, TaiwanReviewed by:
Luis Gomez, University of Las Palmas de Gran Canaria, SpainCopyright © 2021 Liu, Li, Sun, Wan, Jiao and Jiang. This is an open-access article distributed under the terms of the Creative Commons Attribution License (CC BY). The use, distribution or reproduction in other forums is permitted, provided the original author(s) and the copyright owner(s) are credited and that the original publication in this journal is cited, in accordance with accepted academic practice. No use, distribution or reproduction is permitted which does not comply with these terms.
*Correspondence: Jianhua Wan, d2poNjYzMTBAMTYzLmNvbQ==; Qinting Sun, cWludGluZ3N1bjIwMjAwOTEwQDE2My5jb20=
Disclaimer: All claims expressed in this article are solely those of the authors and do not necessarily represent those of their affiliated organizations, or those of the publisher, the editors and the reviewers. Any product that may be evaluated in this article or claim that may be made by its manufacturer is not guaranteed or endorsed by the publisher.
Research integrity at Frontiers
Learn more about the work of our research integrity team to safeguard the quality of each article we publish.