 Natalie S. Barkdull1
 Gregory T. Carling1*
 Diego P. Fernandez2Stephen T. Nelson1Barry R. Bickmore1David G. Tingey1Hannah N. Checketts1Brian N. Packer1Colin A. Hale1
- 1Department of Geological Sciences, Brigham Young University, Provo, UT, United States
- 2Department of Geology and Geophysics, University of Utah, Salt Lake City, UT, United States
Glaciers alter the geochemistry of sensitive alpine streams by exposing freshly weathered bedrock and releasing atmospherically deposited trace metals from melting ice. Changes in the timing and quantity of glacial melt also affect discharge and temperature of alpine streams. To investigate the effects of glacier meltwater on the geochemistry and hydrology of proglacial streams in the western US, we sampled supraglacial meltwaters and proglacial streams in the Dinwoody Creek watershed in the Wind River Range, Wyoming during a one-week period in 2015. The upper watershed contains Gannett Glacier ( ∼ 5 km2) and Dinwoody Glacier ( ∼ 4 km2) at elevations between 3,300–4,000 m asl. Samples were collected during late summer (27 August–4 September) when the contributions of glacier meltwater were highest. Supraglacial meltwater was enriched in a suite of trace metals (Cd, Co, Cu, Hg, Mn, Pb, Zn) relative to proglacial streams, suggesting an atmospheric source of metals to the glaciers. Concentrations of major ions and the remaining 30+ analyzed trace elements were enriched in proglacial streams relative to supraglacial meltwater, reflecting weathering of granite and gneiss bedrock. To evaluate the diurnal effects of glacier meltwater inputs, we deployed loggers to monitor water levels, temperature, and specific conductance at 15 min intervals over a one-week period and collected hourly water samples from Dinwoody Creek for a 24 h period. The influx of glacial meltwater during the daytime diluted major ion and rare earth element concentrations and caused increased concentrations for a subset of trace metals. Stable water isotopes (δD and δ18O) in Dinwoody Creek were more depleted during peak flow relative to baseflow due to contributions from isotopically depleted meltwater. The combination of multiple hydrologic tracers (solute concentrations, high frequency logger data, water isotopes) shows strong potential to improve estimates of glacier meltwater contributions to proglacial streams. Changes in water chemistry and discharge need to be monitored as glaciers recede across the Wind River Range and other midlatitude mountain ranges for mitigating negative impacts on alpine ecosystems and downstream water resources.
Introduction
Alpine glaciers are an important source of water to mountain streams, particularly for late-season baseflow in arid regions (Kaser et al., 2010). Alpine glaciers worldwide are shrinking in response to climate change (Lemke et al., 2007). Glaciers in the conterminous United States experienced between 24–66% loss in area over the past century (McCabe and Fountain, 2013) and some studies predict that many glaciers in the Intermountain West will shrink and disappear by 2,100 (Marston et al., 1991; Hall and Fagre, 2003; Vanlooy et al., 2014). Glacier retreat in the western US is driven by rising temperatures over the past century, causing more snowmelt to fall as rain and spring runoff to occur earlier in the year (Stewart et al., 2004; Dettinger, 2005; Hall et al., 2015). The rain-snow transition is projected to increase in elevation across the western US under a warming climate, with snow-dominated mountains changing to a mix of rain and snow during winter and spring months (Klos et al., 2014). Changes in the timing and distribution of snowmelt may have devastating consequences for arid regions of the western US, where up to 75% of freshwater supplies are derived from snowmelt (Dettinger, 2005). For some streams in the western US, glacier meltwater supplies up to 50% of streamflow in late summer, which a critical period of the growing season (Bell et al., 2011; Cable et al., 2011; DeVisser and Fountain, 2015; Vandeberg and VanLooy, 2016; VanLooy and Vandeberg, 2019).
Melting glaciers impact the water quality of sensitive alpine streams through direct release of accumulated solutes or by exposing freshly weathered bedrock. Glaciers may release harmful trace metals stored in the ice and alter the geochemistry of alpine streams. Trace elements are deposited to glacier surfaces through wet and dry deposition in precipitation, atmospheric dust, or other aerosols (Schwikowski and Eichler, 2010). Over centuries, trace metals accumulate in layers of glacier ice and archive the geochemistry of past precipitation and atmospheric deposition (Schuster et al., 2002; Barbante et al., 2004). Since the industrial revolution (post-1840), the rate of atmospheric heavy metal deposition in glacier ice worldwide has increased in response to anthropogenic activities like mining, smelting and burning coal (Boutron et al., 1994; Schuster et al., 2002; Barbante et al., 2004; Schwikowski and Eichler, 2010). In the western US, studies of glacial ice cores show that windblown dust is also a significant source of trace elements to glaciers (Aarons et al., 2016). As glaciers melt, centuries of accumulated metals and nutrients enter sensitive glacial rivers and high elevation lakes (Mast et al., 2010; Reynolds et al., 2010; Huang et al., 2012; Spaulding et al., 2015). For example, glacier meltwater in the Teton Range, WY contributed elevated concentrations of six heavy metals (Hg, Mn, Cd, Zn, Co, and Pb) to proglacial streams (Carling et al., 2017). Retreating glaciers also expose reactive freshly weathered bedrock and glacial till which may contribute elevated trace element concentrations to proglacial streams (Tranter, 2003; Fortner et al., 2011).
Glaciated alpine streams exhibit distinctive patterns in discharge, temperature and solute concentrations based on the relative contributions of snowmelt, glacial meltwater and groundwater. In temperate regions, peak glacier ice melt occurs during mid-to late-summer following retreat of the seasonal snowpack (Milner et al., 2010). During mid- to late-summer, supraglacial, englacial and subglacial drainages develop on the glacier surface, interior and bottom, respectively (Fountain and Walder, 1998). Supraglacial meltwaters entrain solutes from atmospheric dust and debris on the glacier before quickly flowing into proglacial streams or the glacier interior (Tranter, 2003). Meltwater traveling through englacial/subglacial passages interacts with reactive freshly-weathered rock that contributes suspended sediments and dissolved ions (Brown et al., 1996; Tranter et al., 2002). During late-summer, glacier meltwater creates strong diurnal discharge variations in proglacial streams, characterized by an influx of “quick” dilute supraglacial meltwater followed by less-dilute discharge from subglacial drainages and shallow groundwater (Brown, 2002; Swift et al., 2005; Milner et al., 2010). Glacial meltwater contributions are highest during late summer near the toe of the glacier and decrease downstream as streams mix with groundwater (Malard et al., 1999; Brown et al., 2006). Seasonal and diurnal changes in temperature, suspended sediments and solute concentrations control the biodiversity of glaciated streams (Brown et al., 2003; Milner et al., 2009; Fortner et al., 2013).
The purpose of our study is to examine how glaciers affect the hydrogeochemistry of proglacial streams during late summer in a temperate alpine watershed. Specific objectives are to: 1) evaluate trace element contributions to proglacial streams from atmospheric deposition and bedrock weathering; 2) characterize the effects of glacier meltwater on stream temperature, solute chemistry and water levels; and 3) compare geochemistry and water level patterns in proglacial streams to a non-glacial stream. Our study will be useful for predicting changes to water chemistry and discharge in alpine streams as glaciers recede across the Intermountain West and other midlatitude mountain ranges.
The Wind River Range (Figure 1) was selected for this study because it is the most glaciated area of the American Rocky Mountains and forms the headwaters for three major river systems in the Western United States: the Green-Colorado Rivers, the Wind-Missouri Rivers, and the Snake-Columbia Rivers (Marston et al., 1991). Other studies have quantified glacier ice loss in the Wind River Range (Marston et al., 1991; Cheesbrough et al., 2009; Thompson et al., 2011; Hall et al., 2012; McCabe and Fountain, 2013; VanLooy et al., 2013; Maloof et al., 2014; DeVisser and Fountain, 2015; Hall et al., 2015; Vanlooy et al., 2017), contributions of glacier melt to stream discharge (Cheesbrough et al., 2009; Cable et al., 2011; VanLooy and Vandeberg, 2019) and recent increases in atmospheric deposition of Hg and other metals in ice cores (Schuster et al., 2002; Aarons et al., 2016). However, the effects of melting glacier ice on stream chemistry in the Wind River Range have not been studied extensively. Of the 63 glaciers in the Wind River Range, we chose Gannett and Dinwoody Glaciers because of their accessibility from hiking trails, size and lack of significant proglacial lakes. Dinwoody Glacier ( ∼ 4 km2) has an average slope of 15% with a maximum length of 2,619 m and extends from 4,080–3,330 m asl. Dinwoody Glacier feeds Dinwoody Creek, which is a tributary of the Wind River. Gannett Glacier ( ∼ 5 km2) extends from 4,084–3,370 m asl with an average slope of 29% and a maximum length of 2,735 m (Cheesbrough et al., 2009). Gannett Glacier feeds Gannett Creek, which flows into Dinwoody Creek. The bedrock geology beneath Dinwoody and Gannett Glaciers is composed of migmatitic gneiss and weakly metamorphosed granite, with an age of approximately 2.7 Ga (Ronald Frost et al., 2000). The bedrock geology of the watershed has been mapped at a 1:500,000 scale showing an Early Archean gneiss complex and Late Archean granitic rocks (Love and Christiansen, 1985). Aeolian dust deposition of up to 3.34 g/m2 contributes exogenous nutrient and other element loading the alpine zone (Brahney et al., 2014).
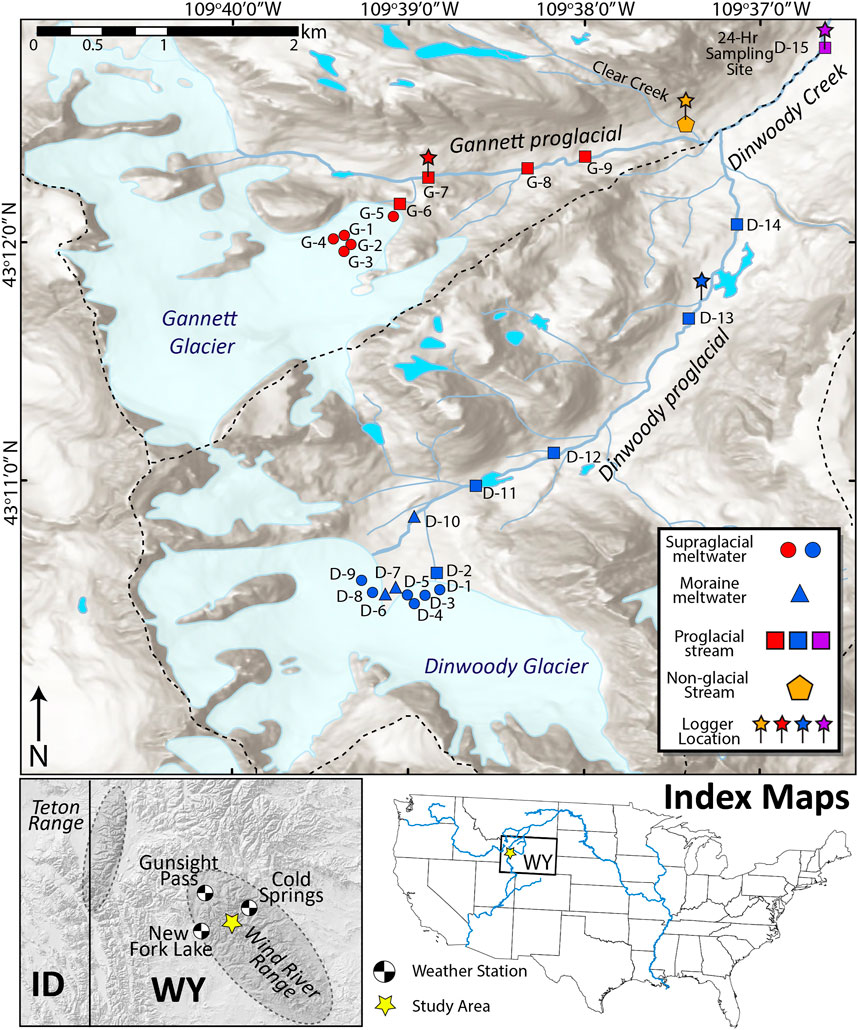
FIGURE 1. Map of the upper Dinwoody Creek watershed in the Wind River Range, Wyoming, United States. Sample sites are shown with different symbols for supraglacial meltwater, moraine meltwater, proglacial stream and non-glacial streams. Conductivity/temperature and water level loggers were installed at sites indicated by pins. Gannett glacier has an average slope of 29% and a maximum length of 2,735 m. Dinwoody glacier is less steep (15%) with a maximum length of 2,619 m. Both glaciers form the headwaters of Dinwoody Creek, which feeds the Wind River. Weather stations used to gather climate data shown in black/white circles. The Gannett and upper Dinwoody watersheds are outlined with a dashed line.
Materials and Methods
Water Sample Collection
To investigate differences in trace element chemistry and isotopic variations between supraglacial meltwater and proglacial streams, we collected water samples between 27 August and 4 September 2015 across longitudinal transects of Gannett Glacier/Gannett Creek and Dinwoody Glacier/Dinwoody Creek (Figure 1). Samples were collected in late season when most of the seasonal snowpack covering the glacial ice had melted and the contributions from glacial meltwater to proglacial streams were largest. Snowpack depth measurements from nearby snow telemetry (SNOTEL) sites at Cold Springs, New Fork Lake and Gunsight Pass (Figures 1, 2) indicated that snow cover melted from lower elevations (2,540 m) by early May and higher elevations (2,990 m) by early June. Precipitation accumulation for the 2015 water year (Oct 2014–Sep 2015) across the study area was slightly lower than the 30 years normal, ranging from 93% (New Fork Lake) to 96% (Gunsight Pass). The maximum snow water equivalent was slightly lower than the 30 years normal, ranging from 90% (Gunsight Pass) to 96% (Cold Springs). Snowmelt also began ∼ 2 weeks earlier than normal at each of the three SNOTEL sites. Average monthly temperatures at Gunsight Pass in July and August (11–12.5°C) were 0.5–1.5°C lower than the 30 years average. Weather conditions during the period of study were rain-free during sample collection days, but light rain was recorded on 27 August from 14:00 to 16:00 local time and heavy rain was recorded on 30 August from 1:30–3:30.
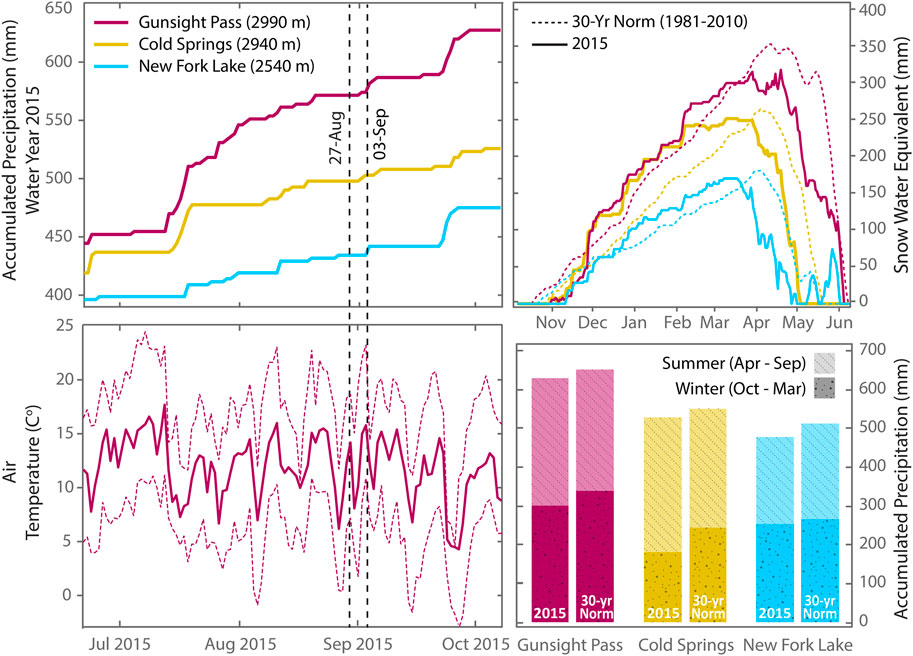
FIGURE 2. Accumulated precipitation, air temperature and snow water equivalent data for the Wind River Range during summer 2015 with historic 30 years normals (1981–2010) provided for comparison. Sampling dates are marked by vertical dashed lines. Precipitation data from nearest SNOTEL stations–Gunsight Pass, Cold Springs, New Fork Lake–located 30 km NW, 20 km NE, and 25 km SW from the study area, respectively (Figure 1). The highest SNOTEL site (Gunsight Pass) is ∼ 350 m lower than the toe of Gannett and Dinwoody Glaciers (3,350 m ASL). Air temperature data are from the Gunsight Pass location. Average daily temperature is marked with a solid line and daily maximum and minimum temperatures are marked with dashed lines. (Data retrieved from the NRCS National Water and Climate Center at https://www.wcc.nrcs.usda.gov/index.html on May 14, 2019).
We collected samples of supraglacial meltwater (streams flowing over the surface of the glacial ice), moraine meltwater (streams flowing through terminal moraines below the glaciers) and proglacial streams (Figure 1). The Dinwoody Glacier transect (sampled August 28, 2015) had 14 sample sites labeled D-1 through D-14, including six supraglacial meltwater samples on Dinwoody Glacier, three moraine meltwater samples and five proglacial samples of Dinwoody Creek (Figure 1). The Gannett Glacier transect (sampled 30 August 2015) had nine sample sites labeled G-1 through G-9, including five supraglacial meltwater samples on Gannett Glacier and four proglacial samples of Gannett Creek. An additional proglacial sample was taken downstream of the confluence between Gannett Creek and Dinwoody Creek (site D-15). Clear Creek (site CC), a non-glacial stream in the watershed was also sampled above the confluence with Gannett Creek to compare water chemistry between glacial and non-glacial streams.
Water samples were collected in an acid-washed (10% HCl) 1 L LDPE bottle and transported to our basecamp (near site D-15) for filtering the same day. We followed EPA “clean hands, dirty hands” methods during all steps of sampling and filtering to avoid contamination (USEPA, 1996). Samples were poured and filtered in clean chamber bags inside a tent using clean disposable vacuum filters (<0.45 µm PES membrane). Water was filtered for Hg (250 ml FLPE acidified to 1% v/v HCl), cations/trace metals (60 ml acid-washed LDPE acidified to 2.4% v/v HNO3), and anions (30 ml LDPE). For water isotopes (δD and δ18O), unfiltered water was poured into a 30 ml amber bottle with a Polyseal cap and wrapped in Parafilm. The remaining 250 ml unfiltered water was stored in a vacuum filter base (and capped) for turbidity measurements in the lab. As a quality control check, one field blank was collected each day by pouring 1 L of Milli-Q water into a 1 L LDPE sample bottle and treating it as a sample through filtration, transport and storage. Field parameters (specific conductance, pH, temperature and dissolved oxygen) were measured at each site using a YSI Quatro multiparameter probe that was calibrated prior to each sampling day. We used a 100 μS/cm conductivity standard to calibrate for low conductivity waters.
To evaluate diurnal variations from glacial meltwater inputs, samples were collected over a 24 h period beginning at 10:00 local time on 2 September 2015 at site D-15 on Dinwoody Creek below the confluence of Gannett Creek (Figure 1). Water isotope (δD and δ18O) samples were collected directly from the stream every hour. Complete water sampling (Hg, cations/trace metals, anions, DOC) was conducted on even hours. The YSI probe was placed in the river at the sample site for 48 h (1 September–3 September) to collect field parameters at 15 min intervals. Two field blanks were collected during 24 h sampling period by pouring and filtering Milli-Q water from a clean 1 L LDPE bottle in a similar manner as field samples.
Temperature, Specific Conductance, and Water Depth Measurements by Data Loggers
To evaluate temporal changes in water chemistry and water levels, we used data loggers to measure water temperature, specific conductance (SpC) and water depth at 15 min intervals at four locations in the watershed. The loggers were placed in upper Dinwoody Creek, Gannett Creek, Clear Creek (a non-glacial stream) and lower Dinwoody Creek at site D-14 (Figure 1). Each logger site contained a HOBO U20 water level logger and a HOBO U24 low-range conductivity logger. The loggers were protected by a PVC housing with 0.5 cm holes to allow water flow. Loggers were placed in the stream channel and secured to large rocks. A HOBO U20 pressure transducer was also placed at basecamp to collect barometric pressure and air temperature measurements over the period of study.
Water level and SpC logger data were post-processed using HOBO software. Absolute pressure measurements were converted to water depth using the HOBOware “Barometric Compensation Assistant”. Fluid density was calculated for fresh water according to water temperature. Changes in barometric pressure were corrected using measurements from the HOBO U20 logger at basecamp. Absolute conductivity measurements were converted to SpC at 25°C using the “low range” data and temperature compensation method for freshwater lakes and streams options in the HOBOware conductivity assistant. Each conductivity logger was calibrated to a starting value taken by YSI handheld which adjusts all readings by a fixed value from the calibration point.
Laboratory Analyses
Trace element and major cation concentrations were measured on filtered samples using an Agilent 7500cc quadrupole inductively coupled plasma mass spectrometer (ICP-MS) with a collision cell, a double-pass spray chamber with perfluoroalkoxy (PFA) nebulizer (0.1 ml/min), a quartz torch and platinum cones. Concentrations were measured for the following 43 elements: Ag, Al, As, B, Ba, Be, Ca, Cd, Ce, Co, Cr, Cs, Cu, Dy, Eu, Fe, Gd, Ho, K, La, Li, Lu, Mg, Mn, Mo, Na, Nd, Ni, Pb, Rb, Sb, Se, Sm, Sr, Tb, Th, Ti, Tl, U, V, Y, Yb, and Zn. A calibration solution containing all the elements reported was prepared gravimetrically using 1,000 mg/L single-element standards (Inorganic Ventures, Inc.). This solution was used to prepare a calibration curve with six points plus a blank. Al, Ca, Cr, Fe, K, Mn, Na, Sc, and V were determined using a 4 ml He/min in the collision cell; As and Se were determined using 4 ml He/min plus 2.5 ml H2/min; and the other 34 elements were determined using Ar as the carrier gas. Detection limit (DL) was determined as three times the standard deviation of all blanks analyzed throughout each run. A U.S. Geological Survey (USGS) standard reference sample (T-205) and National Institute of Standards and Technology (NIST) standard reference material (SRM 1643e) were analyzed multiple times in each run together with the samples as a continuing calibration verification, with results accurate within ± 10% for most elements in each sample run.
Total and methyl Hg concentrations were measured on filtered samples using a Brooks Rand cold vapor atomic fluorescence spectrometer (CVAFS). Total Hg (THg) was measured after BrCl oxidation following Environmental Protection Agency (EPA) Method 1631e (USEPA, 2002). As a quality control, matrix spikes were made at least every 10 samples with recoveries between 74–94%. Methyl Hg (MeHg) was measured after direct ethylation (Mansfield and Black, 2015). As a quality control, a 1 ng/L matrix spike was made for every sample with recoveries typically between 101–122%. Method blanks were analyzed at the beginning of each run to calculate the DL, which typically fell below 0.2 ng/L for THg and 0.02 ng/L for MeHg.
Additional measurements were made for stable water isotopes, major anions, and turbidity. Water isotopes (δ18O and δD) were measured on unfiltered samples using a Los Gatos Research Liquid Water Isotope Analyzer (LWIA-24 days). Measurements were made relative to Vienna Standard Mean Ocean Water (VSMOW) with an analytical precision of ±0.4‰ for δ18O and ± 1‰ for δD. Major anions (F−, Cl−, NO3−, and SO42−) were analyzed on filtered aliquots using a Dionex ICS-90 Ion Chromatograph (IC). Turbidity was measured on unfiltered samples using a Micro TPW Turbidimeter. Samples were inverted three times to resuspend the sediment prior to turbidity measurements.
Data Quality Control
The dataset was checked for quality control by analyzing field blanks, removing elements with detection limit issues, and removing outliers. All field blanks showed low background concentrations for major ions and trace elements, with measurements < DL in almost samples (Supplementary Table S1). Some elements were detected in field blanks including Mg, Al, Ca, Cr, Mn, Fe, Mo, Sb, La, and Ce but concentrations were negligible relative to concentrations in field samples. Other elements (Ag, Be, B, Cs, and F) had concentrations < DL in the field blanks and most samples and were removed from statistical analysis. For other elements, any values < DL were set as ½ DL. Two samples taken during 24 h sampling event (0:00 and 08:00) showed minor contamination for a subset of elements, with concentrations 2–3 standard deviations higher than the average of all 24 h samples. In these samples, outlier values of Pb, Ni, Zn, and other elements were removed from analysis.
Bicarbonate (HCO3−) concentrations were calculated by setting the major ion charge balance because concentrations were too low (<10 mg/L) to be measured in the field. Charge balances incorporated major cation (K+, Na+, Ca2+, Mg2+) and major anion (Cl−, NO3−, SO42−) concentrations. Calculated HCO3− concentrations ranged from 0.1–10.1 mg/L (mean: 2.0 mg/L) (Supplementary Table S2).
Statistical Analysis
Data Normalization
To compare water level dynamics across the glacial and nonglacial sites, data from the HOBO water level loggers were normalized between 0 (lowest depth) and 1 (highest depth) representing the “relative water level” of each stream. We were unable to calculate discharge at the sites from the water level measurements without developing rating curves. Instead, we use relative depths to compare temporal changes in water levels across stream sampling sites. Normalized depth (DN) was calculated using Eq. 1 where Dmin and Dmax are the maximum and minimum water depth recorded on the logger over the period of study.
We explored the diel variability in trace elements concentrations at Dinwoody Creek over a 24 h period by normalizing element concentrations at time t (Ct) to initial concentrations (Ci) at 10:00 using Eq. 2.
We compared the enrichment/depletion of trace elements and major ions in proglacial streams relative to a non-glacial stream by creating a spider diagram of element enrichment patterns. Median element concentrations from each sample type (Cmed) were normalized to element concentrations in Clear Creek (CCC) using Eq. 3. Spider diagrams were arranged in order of most enriched to least enriched in Dinwoody supraglacial meltwater relative to non-glacial Clear Creek. This element order was used to highlight geochemical differences between supraglacial meltwater and proglacial streams relative to non-glacial streams. Many elements from Gannett supraglacial meltwaters were <DL and were removed from the spider diagram.
Nonmetric Multidimensional Scaling Analysis
We used nonmetric multidimensional scaling (NMS) to explore water chemistry relationships between supraglacial meltwater, moraine meltwater and proglacial stream samples from the Gannett and Dinwoody catchments. NMS is an ordination technique that simplifies data dimensionality to highlight similarities and differences between groups of samples. NMS is similar to principal components analysis (PCA) but makes fewer assumptions (e.g., does not assume linear relationships between variables) and is suited to a wide variety of ecological datasets (McCune and Mefford, 1999). We used NMS to summarize water chemistry including SpC, pH, turbidity, major cations (Na+, K+, Mg2+, Ca2+), major anions (Cl−, NO3−, SO42−) and 37 trace elements (Al, As, Ba, Cd, Ce, Co, Cr, Cu, Dy, Eu, Fe, Gd, Ho, La, Li, Lu, MeHg, Mn, Mo, Nd, Ni, Pb, Rb, Se, Sm, Sr, Tb, Th, THg, Ti, Tl, U, V, Y, Yb, Zn). Raw data used in the NMS ordination are provided in the Supplementary Table S3).
The software PC-ORD (McCune and Mefford, 1999) was used for NMS ordination. Data were log generalized prior to performing the NMS analysis with Eq.5 where xmin is the minimum concentration of each element. Euclidean distance was used to locate the samples in ordination space. The analyses were run 250 times and compare to randomized data in a Monte Carlo test run with 250 iterations. The model results are provided as a 2-D graph with samples from each site contained by closed polygons.
Results
Distinct Water Isotope Values in Supraglacial and Proglacial Samples
Stable water isotopes (δD and δ18O) showed differences between supraglacial meltwater from Dinwoody and Gannett Glaciers and proglacial streams (Figure 3). Samples from Gannett Glacier were isotopically depleted relative to Dinwoody Glacier. Supraglacial meltwater and proglacial stream samples from Gannett Glacier plotted along a linear trend slightly below the local meteoric water line (LMWL) (Benjamin et al., 2005). In contrast, samples from Dinwoody Glacier plotted in a cluster straddling the LMWL. Most supraglacial samples plotted below the LMWL while proglacial moraine samples plotted on or slightly above the LMWL. Proglacial samples plotted furthest above the LMWL. Differences from the LMWL may reflect changes to water from precipitation through melting and sublimation. Further, the LMWL was developed for a much larger area (Idaho, Montana and Wyoming) and may not accurately represent the Wind River Range.
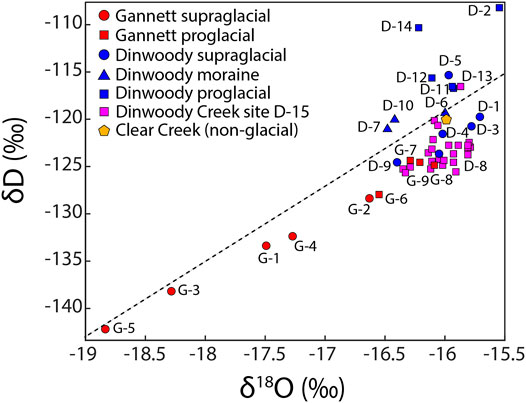
FIGURE 3. Stable isotopes of H (δD) and O (δ18O) for water samples collected from supraglacial meltwaters (circle), moraine meltwaters (triangle) and proglacial streams (square) of Gannett and Dinwoody Glaciers and non-glacial Clear Creek during late August and early September 2015. Isotopic values are reported relative to Vienna Standard Mean Ocean Water (VSMOW). The dashed line is the local meteoric water line (LMWL) for western Wyoming (δD = 7.95 δ18O + 8.09) (Benjamin et al., 2005).
Different Trace Element Concentrations in Supraglacial and Proglacial Samples
Element concentrations showed two opposing trends: higher in proglacial streams relative to supraglacial meltwater or higher in supraglacial meltwater relative to proglacial streams (Figures 4, 5). Major ions (Ca2+, Mg2+, Na+, K+, Cl−, NO3−, SO42−) showed increasing concentrations from supraglacial meltwater samples to downstream proglacial stream samples (Figure 4). Concentrations of nearly all trace elements (Ba, Ce, Cr, Dy, Eu, Gd, Ho, La, Li, Lu, Mo, Nd, Ni, Rb, Sb, Se, Sm, Sr, Tb, Ti, U, V, Y, and Yb) were also higher in proglacial streams relative to supraglacial meltwater. For example, Ca concentrations were 6–12 times higher in proglacial streams relative to supraglacial meltwater increasing from <0.2 mg/L on Dinwoody Glacier to 1.3 mg/L in the proglacial stream.
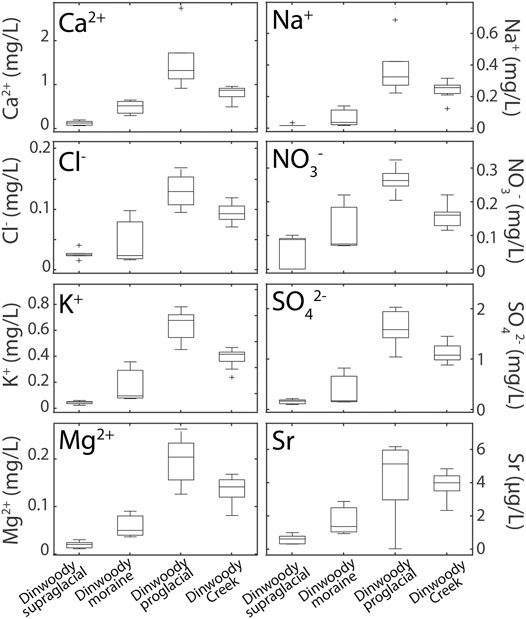
FIGURE 4. Box plots of selected element concentrations in Dinwoody supraglacial (n = 6), Dinwoody moraine (n = 3), Dinwoody proglacial (n = 5) and Dinwoody Creek (n = 13) samples collected between late August and early September 2015. The selected elements showed increasing concentrations from supraglacial meltwater to proglacial streams and are representative of the trend seen in almost all major ions and trace elements. Outliers indicated by + .
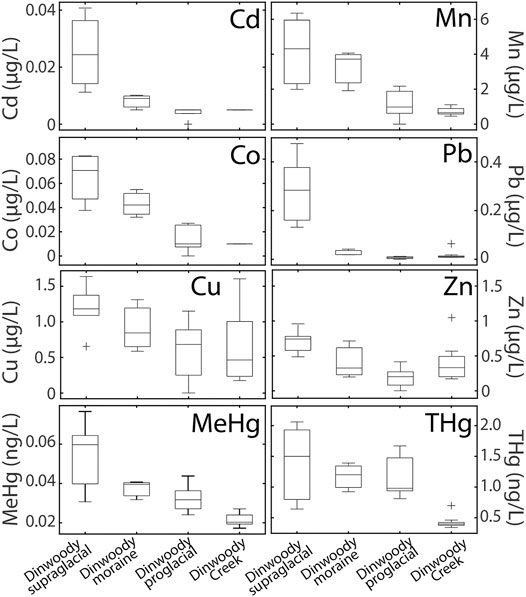
FIGURE 5. Box plots of selected element concentrations in Dinwoody supraglacial (n = 6), Dinwoody moraine (n = 3), Dinwoody proglacial (n = 5) and Dinwoody Creek (n = 13) samples collected between late August and early September 2015. The selected elements showed decreasing concentrations from supraglacial meltwater to proglacial streams. Outliers indicated by + .
Concentrations of Cd, Co, Cu, MeHg, Mn, Pb, THg, and Zn were higher in supraglacial meltwater relative to proglacial streams (Figure 5). Pb concentrations decreased by 90% from >0.2 μg/L in supraglacial meltwater to 0.02 μg/L in proglacial streams. Cd, Co, and Mn concentrations decreased approximately 70% from supraglacial meltwater to proglacial streams while Zn, THg, and MeHg concentrations decreased by 40% and Cu concentrations decreased by 25%.
Solute concentrations of most major ions and trace metals were higher in supraglacial meltwater from Dinwoody Glacier relative to Gannett Glacier. For example, average U and Rb concentrations in supraglacial meltwater from Dinwoody Glacier were almost 10 times higher than those of Gannett Glacier (U = 0.0595 and 0.0067 μg/L and Rb = 0.2617 and 0.0262 μg/L, respectively) (Supplementary Table S1). Downstream of the confluence of Gannett and Dinwoody Creeks, solute concentrations showed intermediate values, reflecting a mixture of lower concentrations in Gannett Creek and higher concentrations in Dinwoody Creek. For example, the mean concentration of Cl− was 0.12 mg/L in Dinwoody Creek, 0.05 mg/L in Gannett Creek, and 0.09 mg/L below the confluence.
Multivariate Statistics Show Distinct Geochemical Groupings by Sample Type
The NMS ordination results showed that the supraglacial meltwater, moraine meltwater and proglacial streams from Dinwoody and Gannett Glaciers are geochemically distinct (Figure 6). The NMS model that best described the dataset was a two-dimensional solution that explained 98.5% of the total variance with a final stress of 5.19, where solutions with stress values less than 10 are typically considered stable and reliable (McCune and Mefford, 1999). In the NMS model, axis 1 explains 93.5% of the variability in the data set and axis two explains an additional 5.0%. Axis 1 scores are primarily controlled by the concentrations of ten trace elements (Pb, Cd, Co, Mn, Zn, MeHg, THg, and Cu), which contributed negatively, and five major ions (Ca2+ Mg2+, K+, SO42−, Na+), which contributed positively. Thus, samples with higher concentrations of the selected trace elements plot on the left side of axis 1 while samples with higher concentrations of major ions plot on the right side of axis 1.
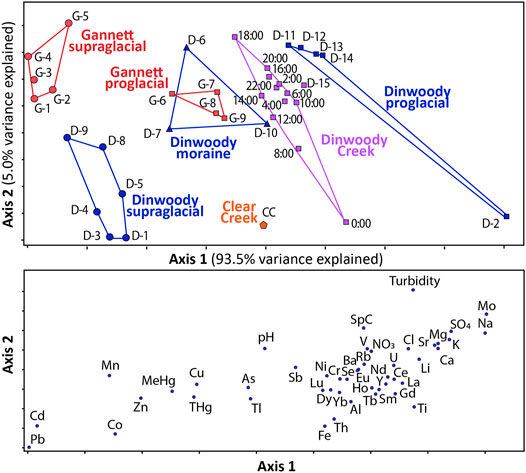
FIGURE 6. Nonmetric dimensional scaling (NMS) results for supraglacial meltwater, moraine meltwater, and proglacial streams collected from Gannett and Dinwoody watersheds between late August and early September 2015. The lower panel shows the measurements controlling axis 1 and axis 2 (e.g., samples with high Cd and Pb concentrations plot toward the left side of axis 1 and samples with high turbidity plot toward the top of axis 2). Axis 1 explains 93.5% of the variance in the data set while axis 2 explains an additional 5.0%. The NMS axes are not labeled with numbers because they are relative values, not absolute numerical values. Raw data for each sample are provided in the (Supplementary Table S3).
In the NMS plot, samples are grouped with polygons showing distinct geochemical signatures (Figure 6). The seven groupings are: Gannett supraglacial meltwater, Gannett proglacial streams, Dinwoody supraglacial meltwater, Dinwoody moraine meltwater, Dinwoody proglacial streams, Dinwoody Creek (below the confluence of Dinwoody and Gannett proglacial streams) and Clear Creek (a non-glacial stream). The NMS plot shows changes in water chemistry from supraglacial meltwaters, which are characterized by relatively higher concentrations of trace metals (Pb, Cd, Co, Mn, Zn, MeHg, THg, and Cu), to proglacial streams, which contain relatively higher concentrations of major ions (Ca2+, Mg2+, K+, SO42−, Na+), REEs, and turbidity. Samples below the confluence of Dinwoody and Gannett proglacial streams plot in between the Dinwoody and Gannett polygons.
Differences in Trace Element Geochemistry of Proglacial Streams and Non-glacial Streams
Spider diagrams of the median composition of each water type (Dinwoody supraglacial, Dinwoody moraine, Dinwoody proglacial, Gannett supraglacial, Gannett proglacial) show element enrichment/depletion patterns of glacier-influenced streams relative to non-glacial Clear Creek (Figure 7). Elements to the left side of the x-axis (Mn, Pb, Th, Co, Cd, Tl, MeHg, Ni, and Fe) are enriched in supraglacial meltwater from Dinwoody Glacier. Elements to the right side of the x-axis (REEs + Y, major elements, V, Sr, Mo) are depleted in Dinwoody supraglacial meltwaters. Elements in the middle of the x-axis (Cu, Zn, Al, Rb, As, Ba, Cr, Ti, NO3, U, Sb, and Se) have similar concentrations between Dinwoody supraglacial meltwaters and Clear Creek. Supraglacial meltwaters from Gannett Glacier had lower concentrations of most elements relative to Dinwoody Glacier. Supraglacial meltwater from both glaciers had low concentrations of major elements and REEs + Y and high concentrations of Mn, Pb, Co., and Cd relative to non-glacial Clear Creek. For example, Mn and Pb concentrations in supraglacial meltwaters were 10–30 times higher than the non-glacial stream, while Co and Cd concentrations were moderately enriched relative to the non-glacial stream (2–10 times higher).
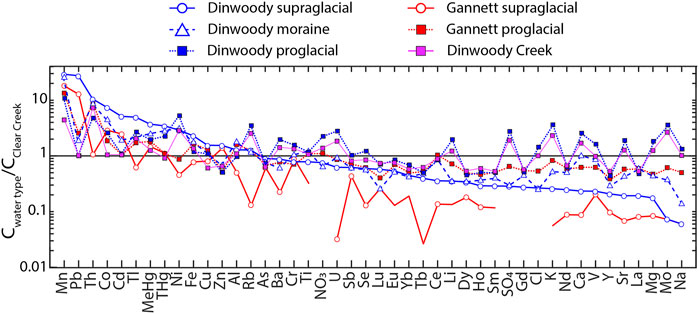
FIGURE 7. Spider diagram of median element concentrations in each sample water type (Dinwoody supraglacial, Dinwoody moraine, Dinwoody proglacial, Gannett supraglacial, Gannett proglacial and Dinwoody Creek) normalized to the composition of non-glacial Clear Creek. Elements are ordered according to the relative enrichment/depletion in Dinwoody supraglacial samples.
Variations in Proglacial Stream Chemistry Over a 24-h Period
Stable water isotopes of H (δD) and O (δ18O) in Dinwoody Creek were variable over a 24 h period (Figure 8). Isotope values were lowest during the afternoon, corresponding to the period of highest water depth in the stream. The lowest δD and δ18O values occurred between 17:00 and 18:00 local time, approximately 2–3 h after peak water depth. As water levels in Dinwoody Creek decreased approaching sunset, δD and δ18O values increased. During the period of declining water levels between 00:00 and 06:00, isotopic compositions increased but were variable.
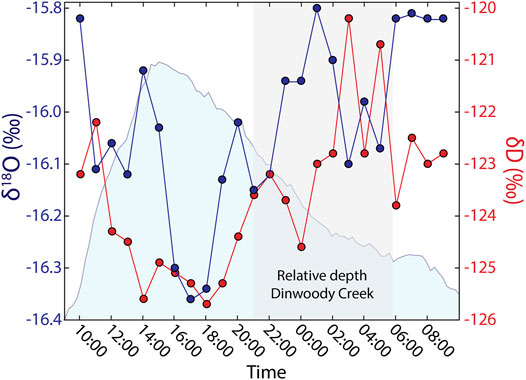
FIGURE 8. Stable isotopes of H (δD) and O (δ18O) in water samples collected hourly over a 24 h period in Dinwoody Creek starting at 10:00 on 2 September 2015. Relative water depth of Dinwoody Creek (scaled between 0 and 1) shown in shaded blue. Shaded gray area represents nighttime hours between 20:40 and 5:45. Isotopic values are reported relative to Vienna Standard Mean Ocean Water (VSMOW).
Solute concentrations in Dinwoody Creek varied over a 24 h period (Figure 9). Most elements followed the behavior of major ions (Ca2+, Mg2+, Na+, K+, Cl−, NO3−, SO42−) (Figure 9A) or REEs + Y (La, Ce, Nd, Sm, Eu, Gd, Tb, Dy, Ho, Yb, Lu, Y) (Figure 9B). Elements that behaved like major ions (U, Ba, Sb, Mo, Sr, Rb, Se, Ni, Li) showed significant (p < 0.05) negative correlation to water depth (r2 = −0.85), temperature (r2 = −0.74) and turbidity (r2 = −0.65) and positive correlation to SpC (r2 = 0.88), pH (r2 = 0.82) and DO (r2 = 0.75). Elements that behaved like REEs (Th, Y) also showed significant (p < 0.05) correlations to water depth (r2 = −0.29), turbidity (r2 = −0.033), and pH (r2 = 0.25) but lacked significant correlation to water temperature, DO, or SpC. Concentrations of both groups of elements decreased from baseflow at 10:00 local time to a daily minimum at 18:00. However, the variability in REE concentrations was greater than variability in major ion concentrations and merited a distinct sub-group. After sunset (indicated by shaded gray area), concentrations of many REEs decreased slightly, while major ion concentrations (except Cl−) increased as the stream returned to low-flow conditions. A third subset of elements showed either increasing or no trends over the 24 h period (Al, As, Cr, Cu, Fe, Mn, Pb, THg, MeHg, V, and Zn) (Figure 9C). Concentrations of Mn and MeHg, two of the elements enriched in supraglacial meltwater (Figure 5), increased in response to daily runoff and turbidity (Supplementary Table S1).
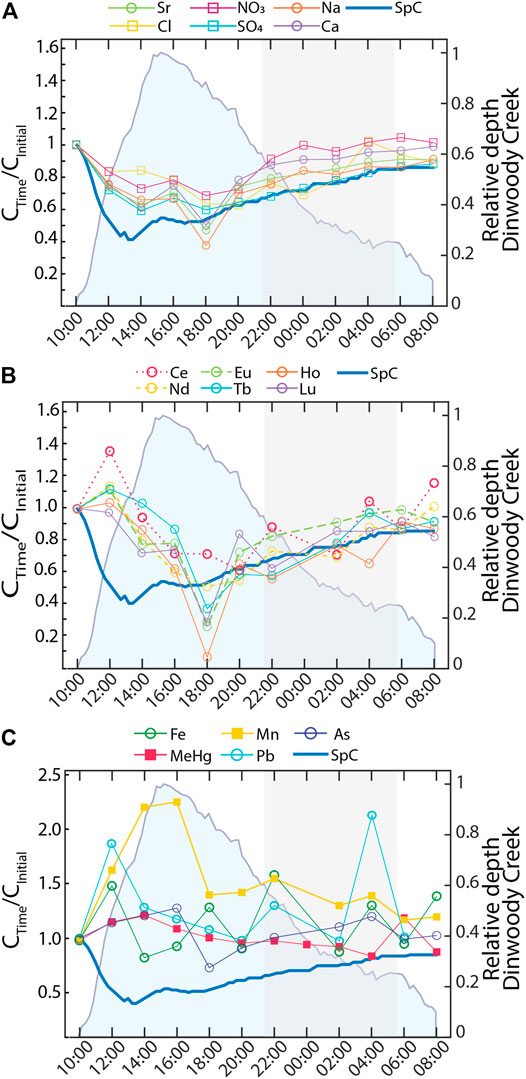
FIGURE 9. Element concentrations (normalized to initial concentration at 10:00) in samples collected at Dinwoody Creek every 2 h starting at 10:00 on 2 September 2015. Shaded blue area represents the relative water depth of Dinwoody Creek (scaled between 0 and 1). Shaded gray area indicates nighttime from 20:40 through 5:45. Element concentrations fell into one of three groups: (A) Major ions and U, Ba, Sb, Mo, Sr, Rb, Se, Ni, and Li that tracked with SpC; (B) Rare earth elements (REEs), Y, Th, and Tl that were positively correlated with SpC but with low concentrations at 18:00; and (C) metals or metalloids that showed no significant trend.
Water temperature increased with water depth in Dinwoody Creek while DO, pH and SpC decreased over the 24 h period (Supplementary Table S4). Water temperature varied between 3.5–7°C with a mean value of 4.9°C. Minimum temperature occurred during early morning baseflow (8:00 local time) and reached daily maximum 2–3 h before peak flow (15:00). The highest DO values (9.8 mg/L) occurred during early morning baseflow when water temperatures were lowest (8:00). Water pH was slightly acidic during peak flow (5.5) and higher (6.1) during early morning baseflow with a mean value of 5.8. SpC levels in Dinwoody Creek were highest during early morning baseflow (13 μS/cm) and lowest during peak flow (7 μS/cm) with a mean value of 10.4.
Timing and Magnitude of Daily Water Level Fluctuation in Glacial and Non-glacial Streams
Time-series plots of relative depth, water temperature and SpC measurements showed differences in timing and magnitude of changes between glaciated and non-glaciated streams (Figure 10). Stream water levels in glaciated and non-glaciated streams were lowest in the morning and peaked in late afternoon. On average, water levels at the Gannett proglacial site (0.5 km below the toe of Dinwoody Glacier) peaked 1.5 h before the Dinwoody proglacial site (3.5 km below the toe of Dinwoody Glacier) and >2 h before Dinwoody Creek (3.5 km from Gannett Glacier and 6 km from Dinwoody Glacier). Water depth in glaciated streams increased quickly on the rising limb of the hydrograph and was less steep on the falling limb. In contrast, the hydrograph for Clear Creek (a non-glacial stream) was more symmetrical around the peak, with only small changes in water level (range of 6.9 cm at Clear Creek compared with 20.1 cm at the Gannett proglacial site, 26.5 cm at the Dinwoody proglacial site and 13.0 cm at the Dinwoody Creek site). Minimum water temperature across all streams occurred just after sunrise and peaked in early- to late-afternoon. Water temperature variability was highest at the Dinwoody proglacial site (1.5–9.5°C) and lowest in at the Gannett proglacial site (1.1–5.1°C). Water temperatures were highest in nonglacial Clear Creek (3.6–11.2°C). The proglacial streams showed strong diurnal variations in SpC that were absent in the non-glaciated stream. Maximum SpC occurred during early morning low flow conditions in glaciated streams but showed no relation to water depth in Clear Creek.
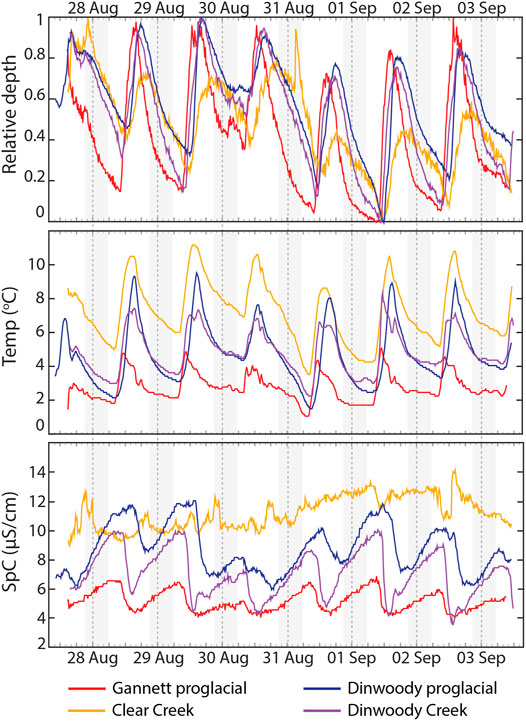
FIGURE 10. Relative depth, temperature and SpC data recorded by water level and conductivity/temperature loggers at Gannett proglacial, Clear Creek, Dinwoody proglacial and Dinwoody Creek sites between 27 August 2015 and 3 September 2015 (Figure 1). Relative depth of each stream scaled between 0 (minimum depth) and 1 (maximum depth). The absolute change in depth was 20.1 cm for Gannett proglacial, 6.9 cm for Clear Creek, 26.5 cm for Dinwoody proglacial and 13.0 cm for Dinwoody Creek. Dashed lines mark the start of each day. Shaded gray areas indicate the nighttime period ( ∼ 20:40–5:45).
Discussion
Trace Element Contributions From Atmospheric Deposition and Bedrock Weathering
Three groups of elements emerged by comparing supraglacial meltwaters to proglacial streams: 1) elements that were enriched in supraglacial meltwater (Cd, Co., Cu, MeHg, Mn, Pb, THg and Zn); 2) elements that were enriched in proglacial streams (Ca, Na, Mg, K, SO4, NO3, Li, Ti, V, Cr, Ni, Se, Rb, Sr, Y, Mo, Sb, Ba, REEs, U); and 3) elements with similar concentrations in supraglacial meltwater and proglacial streams (Al, As, Tl, and Lu). Notably, the three groups of elements are visible in averaged boxplots of data (Figures 4, 5), multivariate statistical analysis (Figure 6) and spider diagrams of element enrichment/depletion (Figure 7). Supraglacial meltwater was distinct between Gannett and Dinwoody Glaciers because Gannett water was likely diluted by snowmelt higher on the glacier. Gannett Glacier contains more ice at a higher elevation than Dinwoody Glacier (Figure 1), resulting in a greater fraction of snowmelt later in the season. Gannett supraglacial samples were more depleted in δD and δ18O (Figure 3) and had lower concentrations of all major and trace elements (Figure 7) relative to Dinwoody supraglacial samples. Snowmelt typically has lower δD and δ18O ratios relative to glacial meltwater (Cable et al., 2011; Carling et al., 2017).
Elements in group 1 that were enriched in supraglacial meltwaters likely originated from distal anthropogenic sources. Supraglacial meltwaters integrate the signal from melting ice as the streams primarily interact with glacial ice and atmospheric dust and debris accumulated on the glacier surface with limited water-rock interaction (Tranter, 2003). Therefore, the group 1 trace metals (Cd, Co, Cu, Mn, Pb, THg, and Zn) were likely deposited on glacial ice with aerosols, dust, or snowfall as demonstrated by ice cores collected from the Upper Fremont Glacier located ∼ 5 km south of Dinwoody Glacier (Schuster et al., 2008; Aarons et al., 2016). In the ice core studies, Hg input increased up to 20-fold over preindustrial values, with anthropogenic sources contributing 70% of Hg during the last 100 years (Schuster et al., 2002). The ice core record suggests increasing dust from anthropogenic activities affecting the Wind River Range, with elevated concentrations of As, Cd, Cr, Cu, Pb, and Zn relative to average continental crust (Aarons et al., 2016). Elevated MeHg concentrations in supraglacial meltwater may reflect biological processing of atmospheric Hg2+ in the glacial or subglacial environment (Hawkings et al., 2021). Many of the elements in group 1 are among the least mobile in erosion and transport (Pb, Co, and Zn), so it is unlikely that they are weathered from bedrock (Gaillardet et al., 2003). Further, concentrations of group 1 elements decreased downstream of the glacier toe, suggesting that their contributions from weathered granite and gneiss bedrock are minimal compared with those from atmospheric deposition. The metal concentrations in supraglacial meltwater were below water quality standards for protection of aquatic life, but in sensitive alpine streams these differences may significantly affect microbial communities and have implications for the ecological status of the watershed as glaciers recede (Tolotti et al., 2020).
Heavy metal deposition from atmospheric dust across the Intermountain West may be widespread as supraglacial meltwaters ∼ 150 km to the northwest in the Teton Range were similarly enriched in Cd, Co, Mn, Hg, Pb, and Zn relative to proglacial streams (Carling et al., 2017). Wind-blown dust, aerosols, and ash are significant sources of nutrients and trace metals to sensitive alpine watersheds in the Intermountain West (Carling et al., 2012; Aarons et al., 2016). Over the past 5,000 years, human activities have increased dust production in the region, shifting dust deposition from long-range to local sources (Aarons et al., 2016). The main regional dust source to the Wind River Range is the Green River Basin (Dahms and Rawlins, 1996). Although concentrations of major cations (Ca2+, K+, and Mg2+) are typically similar between atmospheric dust and continental crust, many trace elements and heavy metals are enriched in dust. For example, Pb, Cr, Co, Ni, Cu, and Mn were enriched in 1.2–4.8 times in atmospheric dust deposition to Colorado mountains relative to upper continental crust (Lawrence and Neff, 2009). Other trace metals like Hg undergo long-range atmospheric transport and are preferentially deposited at high elevations/latitudes (Schuster et al., 2002; Schuster et al., 2018).
Elements in group 2, with relatively higher concentrations in proglacial streams, are mainly derived from weathering reactions with the gneiss and granite bedrock or their weathering products. Many group 2 elements are soluble alkaline and alkaline earth elements (Li, Na, Mg, K, Ca, Rb, Sr, Ba) or anions (Cl−, NO3−, SO42−). These elements are found in local amphibolite and felsic gneiss and quartz monzonite rocks (Frost et al., 2006) and could be preferentially leached out of freshly weathered glacial flour as it comes in contact with proglacial streams (Gaillardet et al., 2003; Tranter, 2003). Similarly, a study at nearby Bull Lake Creek in the Wind River Range showed that specific conductance increased in proglacial streams with distance from headwater glaciers due to chemical weathering of geologic materials contributing dissolved ions in the water (VanLooy and Vandeberg, 2019). Meltwater fluxes through groundwater flow paths would further inherit the chemistry of weathered minerals in the bedrock. Although we did not sample groundwater directly, the proglacial streams likely included a substantial fraction of groundwater or subglacially-routed meltwater as suggested by enriched water isotope signatures relative to supraglacial meltwater (Figure 3) and enriched values during nighttime baseflow (Figure 8).
Causes and Effects of Diel Cycling in Proglacial Streams
Daily meltwater fluxes from glaciers control the concentrations of major ions and trace elements in proglacial streams by dilution and by contributing an increased suspended sediment load. Daily changes in solar radiation, photosynthesis, and microbial respiration often create diel (24 h) cycles in water parameters with warm temperatures and elevated pH and DO during the daytime hours (Nimick et al., 2011). However, biologically-driven diel cycles may not occur in proglacial streams because the cold, turbid and nutrient-depleted waters are a poor habitat for many organisms. For example, at Dinwoody Creek DO concentrations and pH decreased during the day and increased at night in contrast to typical biogeochemical cycles (Supplementary Table S4). The influx of daily meltwater caused diel cycling in Dinwoody Creek. From 12:00–18:00 local time on 2 September 2015, glacier meltwater diluted solute concentrations by 30–70% (Figure 9A), decreased pH from 6 to 5.5 (Supplementary Table S4), and depleted the isotopic composition of Dinwoody Creek relative to low flow conditions (Figure 8).
Major ions, REEs and metals/metalloids defined three different diel responses to increasing water levels. Major ions (including Ca2+, Na+, Cl−, SO42−, and NO3−), specific trace elements (including Sr), and SpC were diluted during the day with increasing water levels (Figure 9A). Similarly, REEs were diluted during the daytime but with a more complex relationship to water depth and SpC (Figure 9B). This suggests that different mechanisms control diel cycling of major ions and REEs, which may also be impacted by colloid fluxes during runoff from turbid meltwater, with maximum turbidity at 16:00 local time (Supplementary Table S1), corresponding with maximum Mn concentrations (Figure 9C). A subset of metals and metalloids were also likely affected by colloid inputs during the daytime, with either no relationship or a positive relationship to water levels (Figure 9C). Notably, Mn was enriched 30x in supraglacial meltwater relative to the nonglacial stream (Figure 7) and showed the largest increase in concentration during the daytime meltwater flux. Thus, Mn may serve as a tracer for supraglacial meltwater inputs to Dinwoody Creek or other proglacial streams with low Mn concentrations in nonglacial inputs. The colloidal material contributing to turbidity may contain Mn-oxides that scavenge other metals and contribute to high Mn concentrations.
Differences in the Timing and Magnitude of Water Level Change in Glacial-Versus Non-glacial Streams
Temperature, SpC and water depth measurements from loggers deployed across the study area captured the hydrologic responses to daily glacier melt. The three glacial loggers (Gannett proglacial, Dinwoody proglacial and Dinwoody Creek) showed strong diurnal variations in relative water depth, water temperature and SpC in response to glacier melt while the non-glacial logger (Clear Creek) only showed diurnal variation in temperature (Figure 10). The high temporal resolution of the loggers (15 min intervals) helped capture rapid changes in SpC and temperature on the rising limb of the hydrograph as “quick-melt” (characterized by limited water rock interaction from meltwaters that flow over glacier ice and bare rock) entered glacial streams and increased water levels from baseflow to peak flow in just a few hours. The falling limb of the hydrograph changed more slowly than the rising limb as “delayed melt” (characterized by increased solute concentrations and water-rock interaction in sub-glacial drainages and moraines) slowly reached the stream (Brown, 2002). Differences in solute concentrations between quick melt and delayed melt were small (SpC across the study area was <15 μS/cm) but the loggers were still able to capture a sharp decrease in SpC as meltwater diluted solute concentrations in the glacial streams (Figure 10).
Implications for Monitoring Glaciated Alpine Watersheds
Geochemical, isotopic and high-frequency logger data could be used to calibrate better hydrologic models in glaciated watersheds, particularly in remote areas with limited data or watersheds where concentrations of chemical/isotopic tracers overlap between water sources (Frenierre and Mark, 2014). The combination of logger data with multiple tracers (trace elements, δD, δ18O, Cl−, SpC, temperature) may be used to differentiate between glacial meltwater, snowmelt and groundwater (Abbott et al., 2016). Trace element concentrations clearly distinguished supraglacial and proglacial waters (Figure 6) and inputs from atmospheric deposition or weathering of catchment bedrock. Water isotopes (δD and δ18O) were a good indicator of water source (Figure 3) but limited in spatial and temporal resolution because the isotopic composition of source waters changed spatially from one glacier to another and could change temporally over seasons and years (Klaus and McDonnell, 2013). For example, we found that many of our samples did not plot within the proposed endmembers of a detailed multi-year study of isotopic mixing in Dinwoody Creek (Cable et al., 2011), possibly reflecting long-term variability in precipitation sources. Solutes (SpC and Cl−) as end-member tracers were also of limited usefulness because concentrations in each water source were low (<0.2 mg/L Cl− and <15 μS/cm) (Figures 4, 10). However, unlike water isotope samples (which must be collected and analyzed in a laboratory), Cl− and SpC can be measured in-situ with probes and provided better temporal resolution to quantify solute concentrations of changing water sources (Figure 10). High-frequency water depth and SpC data could also improve precipitation estimates in remote areas without weather stations. Water temperature was not a useful tracer because it was highly responsive to solar radiation (Figure 10). However water temperature could be used to predict the presence and behavior of aquatic organisms in different reaches of glacial streams (Füreder et al., 2001; Johnstone and Rahel, 2003). As glaciers disappear across the Wind River Range and other midlatitude mountain ranges, the changes in water chemistry and discharge need to be monitored for better predictions on the impact to alpine ecosystems and downstream water resources.
Conclusion
Glacial meltwater affects solute concentrations and streamflow patterns in alpine streams with unknown consequences for water resources and ecosystems as glaciers disappear across midlatitude mountains. To investigate the chemistry of proglacial streams, we sampled on and below the Dinwoody and Gannett Glaciers in the Wind River Range, Wyoming. Supraglacial meltwater, which interacts with glacier ice and debris on the glacier surface, was enriched in atmospherically deposited trace elements (Cd, Co, Cu, MeHg, Mn, Pb, THg, and Zn) relative to proglacial streams. Proglacial streams, which interact with highly reactive glacial flour at the base of the glacier, were enriched in major ions, REEs, and most other elements relative to supraglacial meltwater. These results suggest that glaciers in the Wind River Range are reservoirs of atmospheric heavy metals that are released as glaciers rapidly melt and that interactions with freshly exposed weathered bedrock controls water chemistry in proglacial streams. Glacier meltwater caused diel changes in water chemistry and water levels during late season baseflow. Dilution controlled diel cycling of major elements and many trace elements. Diel cycling of trace metals was likely affected by colloid concentrations in turbid meltwater. Specifically, Mn concentrations increased with water level during daytime hours due to increased meltwater inputs, suggesting that Mn may serve as a tracer for meltwater inputs to Dinwoody Creek.
High frequency water depth, temperature and conductivity loggers may provide useful data to improve hydrologic models of proglacial streams. Glacial melt diluted solute concentrations relative to baseflow conditions. Changes were smallest near the toe of the glacier and increased in magnitude and timing farther from the glacier. Non-glacial streams had higher water temperatures and more consistent solute concentrations than glacial streams. This suggests that glacial retreat may lead to increased water temperatures, lower stream flow, and more consistent solute concentrations during late summer baseflow after the seasonal snowpack is melted. These changes may affect microbial diversity in proglacial streams. Our study has implications for calibrating models with geochemical, isotopic and logger data to improve hydrograph separation techniques in glaciated watersheds. In particular, we show how trace element concentrations may be useful for determining water inputs from glaciers or groundwater. Although watersheds have different geology, topography, climate and other characteristics, our methods are broadly applicable across remote watersheds. Water chemistry and discharge need to be monitored in proglacial streams as glaciers recede across midlatitude mountain ranges to serve as sentinel sites for mitigating potential negative consequences to alpine ecosystems and downstream water resources.
Data Availability Statement
The original contributions presented in the study are included in the article/Supplementary Material, further inquiries can be directed to the corresponding author.
Author Contributions
NB and GC contributed to the conception and design of the study; DF, SN, BB, and DT supervised students and generated data for the study; HC, BP, and CH participated in fieldwork and generated data for the study; NB wrote the first draft of the manuscript; GC wrote the submitted version of the manuscript. All authors contributed to manuscript revision and read and approved the submitted version.
Funding
This study was funded by a mentoring environment grant from Brigham Young University.
Conflict of Interest
The author declares that the research was conducted in the absence of any commercial or financial relationships that could be construed as a potential conflict of interest.
Publisher’s Note
All claims expressed in this article are solely those of the authors and do not necessarily represent those of their affiliated organizations, or those of the publisher, the editors and the reviewers. Any product that may be evaluated in this article, orclaim that may be made by its manufacturer, is not guaranteed or endorsed by the publisher.
Acknowledgments
Kimberly Sowards and Brandon Rogers helped with field work.
Supplementary Material
The Supplementary Material for this article can be found online at: https://www.frontiersin.org/articles/10.3389/feart.2021.727575/full#supplementary-material
References
Aarons, S. M., Aciego, S. M., Gabrielli, P., Delmonte, B., Koornneef, J. M., Uglietti, C., et al. (2016). Ice Core Record of Dust Sources in the Western United States over the Last 300 Years. Chem. Geology. 442, 160–173. doi:10.1016/j.chemgeo.2016.09.006
Abbott, B. W., Baranov, V., Mendoza-Lera, C., Nikolakopoulou, M., Harjung, A., Kolbe, T., et al. (2016). Using Multi-Tracer Inference to Move beyond Single-Catchment Ecohydrology. Earth-Science Rev. 160, 19–42. doi:10.1016/j.earscirev.2016.06.014
Barbante, C., Schwikowski, M., Döring, T., Gäggeler, H. W., Schotterer, U., Tobler, L., et al. (2004). Historical Record of European Emissions of Heavy Metals to the Atmosphere since the 1650s from Alpine Snow/ice Cores Drilled Near Monte Rosa. Environ. Sci. Technol. 38, 4085–4090. doi:10.1021/es049759r
Bell, J., Tootle, G., Pochop, L., Kerr, G., and Sivanpillai, R. (2011). Glacier Impacts on Summer Streamflow in the Wind River Range, Wyoming. J. Hydrologic Eng. 17, 521–527. doi:10.1061/(ASCE)HE.1943-5584.0000469
Benjamin, L., Knobel, L. L., Hall, L., Cecil, L., and Green, J. R. (2005). Development of a Local Meteoric Water Line for southeastern Idaho, Western Wyoming, and South-central Montana. U.S. Geological Survey Scientific Investigations Report 2004-5126. doi:10.3133/sir20045126
Boutron, C. F., Candelone, J.-P., and Hong, S. (1994). Past and Recent Changes in the Large-Scale Tropospheric Cycles of lead and Other Heavy Metals as Documented in Antarctic and Greenland Snow and Ice: a Review. Geochimica et Cosmochimica Acta 58, 3217–3225. doi:10.1016/0016-7037(94)90049-3
Brahney, J., Ballantyne, A. P., Kociolek, P., Spaulding, S., Otu, M., Porwoll, T., et al. (2014). Dust Mediated Transfer of Phosphorus to alpine lake Ecosystems of the Wind River Range, Wyoming, USA. Biogeochemistry 120, 259–278. doi:10.1007/s10533-014-9994-x
Brown, G. H. (2002). Glacier Meltwater Hydrochemistry. Appl. Geochem. 17, 855–883. doi:10.1016/s0883-2927(01)00123-8
Brown, G. H., Tranter, M., and Sharp, M. J. (1996). Experimental Investigations of the Weathering of Suspended Sediment by alpine Glacial Meltwater. Hydrol. Process. 10, 579–597. doi:10.1002/(sici)1099-1085(199604)10:4<579:aid-hyp393>3.0.co;2-d
Brown, L. E., Hannah, D. M., Milner, A. M., Soulsby, C., Hodson, A. J., and Brewer, M. J. (2006). Water Source Dynamics in a Glacierized alpine River basin (Taillon‐Gabiétous, French Pyrénées). Water Resour. Res. 42, W08404. doi:10.1029/2005wr004268
Brown, L. E., Hannah, D. M., and Milner, A. M. (2003). Alpine Stream Habitat Classification: an Alternative Approach Incorporating the Role of Dynamic Water Source Contributions. Arctic, Antarctic, Alpine Res. 35, 313–322. doi:10.1657/1523-0430(2003)035[0313:ashcaa]2.0.co;2
Cable, J., Ogle, K., and Williams, D. (2011). Contribution of Glacier Meltwater to Streamflow in the Wind River Range, Wyoming, Inferred via a Bayesian Mixing Model Applied to Isotopic Measurements. Hydrol. Process. 25, 2228–2236. doi:10.1002/hyp.7982
Carling, G. T., Fernandez, D. P., and Johnson, W. P. (2012). Dust-mediated Loading of Trace and Major Elements to Wasatch Mountain Snowpack. Sci. Total Environ. 432, 65–77. doi:10.1016/j.scitotenv.2012.05.077
Carling, G. T., Rupper, S. B., Fernandez, D. P., Tingey, D. G., and Harrison, C. B. (2017). Effect of Atmospheric Deposition and Weathering on Trace Element Concentrations in Glacial Meltwater at Grand Teton National Park, Wyoming, U.S.A. Arctic, antarctic, alpine Res. 49, 427–440. doi:10.1657/aaar0016.071
Cheesbrough, K., Edmunds, J., Tootle, G., Kerr, G., and Pochop, L. (2009). Estimated Wind River Range (Wyoming, USA) Glacier Melt Water Contributions to Agriculture. Remote Sensing 1, 818–828. doi:10.3390/rs1040818
Dahms, D. E., and Rawlins, C. L. (1996). A Two-Year Record of Eolian Sedimentation in the Wind River Range, Wyoming, U.S.A. Arctic Alpine Res. 28, 210–216. doi:10.2307/1551762
Dettinger, M. (2005). Changes in Streamflow Timing in the Western United States in Recent Decadesfrom the National Streamflow Information Program Fact Sheet 2005-3018. Geological Survey US. doi:10.3133/fs20053018
Devisser, M. H., and Fountain, A. G. (2015). A century of Glacier Change in the Wind River Range, WY. Geomorphology 232, 103–116. doi:10.1016/j.geomorph.2014.10.017
Fortner, S. K., Lyons, W. B., and Munk, L. (2013). Diel Stream Geochemistry, Taylor Valley, Antarctica. Hydrol. Process. 27, 394–404. doi:10.1002/hyp.9255
Fortner, S. K., Mark, B. G., Mckenzie, J. M., Bury, J., Trierweiler, A., Baraer, M., et al. (2011). Elevated Stream Trace and Minor Element Concentrations in the Foreland of Receding Tropical Glaciers. Appl. Geochem. 26, 1792–1801. doi:10.1016/j.apgeochem.2011.06.003
Fountain, A. G., and Walder, J. S. (1998). Water Flow through Temperate Glaciers. Rev. Geophys. 36, 299–328. doi:10.1029/97rg03579
Frenierre, J. L., and Mark, B. G. (2014). A Review of Methods for Estimating the Contribution of Glacial Meltwater to Total Watershed Discharge. Prog. Phys. Geogr. Earth Environ. 38, 173–200. doi:10.1177/0309133313516161
Frost, B. R., Frost, C. D., Cornia, M., Chamberlain, K. R., and Kirkwood, R. (2006). The Teton - Wind River Domain: a 2.68-2.67 Ga Active Margin in the Western Wyoming Province. Can. J. Earth Sci. 43, 1489–1510. doi:10.1139/e06-102
Füreder, L., Schütz, C., Wallinger, M., and Burger, R. (2001). Physico-chemistry and Aquatic Insects of a Glacier-Fed and a spring-fed alpine Stream. Freshw. Biol. 46, 1673–1690. doi:10.1046/j.1365-2427.2001.00862.x
Gaillardet, J., Viers, J., and Dupré, B. (2003). Trace Elements in River Waters. Treatise Geochem. 5, 605. doi:10.1016/b0-08-043751-6/05165-3
Hall, D. K., Crawford, C. J., Digirolamo, N. E., Riggs, G. A., and Foster, J. L. (2015). Detection of Earlier Snowmelt in the Wind River Range, Wyoming, Using Landsat Imagery, 1972-2013. Remote Sensing Environ. 162, 45–54. doi:10.1016/j.rse.2015.01.032
Hall, D. K., Foster, J. L., Digirolamo, N. E., and Riggs, G. A. (2012). Snow Cover, Snowmelt Timing and Stream Power in the Wind River Range, Wyoming. Geomorphology 137, 87–93. doi:10.1016/j.geomorph.2010.11.011
Hall, M. H. P., and Fagre, D. B. (2003). Modeled Climate-Induced Glacier Change in Glacier National Park, 1850-2100. BioScience 53, 131–140. doi:10.1641/0006-3568(2003)053[0131:mcigci]2.0.co;2
Hawkings, J. R., Linhoff, B. S., Wadham, J. L., Stibal, M., Lamborg, C. H., Carling, G. T., et al. (2021). Large Subglacial Source of Mercury from the Southwestern Margin of the Greenland Ice Sheet. Nat. Geosci. 14, 496–502. doi:10.1038/s41561-021-00753-w
Huang, J., Kang, S., Zhang, Q., Jenkins, M. G., Guo, J., Zhang, G., et al. (2012). Spatial Distribution and Magnification Processes of Mercury in Snow from High-Elevation Glaciers in the Tibetan Plateau. Atmos. Environ. 46, 140–146. doi:10.1016/j.atmosenv.2011.10.008
Johnstone, H. C., and Rahel, F. J. (2003). Assessing Temperature Tolerance of Bonneville Cutthroat trout Based on Constant and Cycling thermal Regimes. Trans. Am. Fish. Soc. 132, 92–99. doi:10.1577/1548-8659(2003)132<0092:attobc>2.0.co;2
Kaser, G., Grosshauser, M., and Marzeion, B. (2010). Contribution Potential of Glaciers to Water Availability in Different Climate Regimes. Proc. Natl. Acad. Sci. 107, 20223–20227. doi:10.1073/pnas.1008162107
Klaus, J., and Mcdonnell, J. J. (2013). Hydrograph Separation Using Stable Isotopes: Review and Evaluation. J. Hydrol. 505, 47–64. doi:10.1016/j.jhydrol.2013.09.006
Klos, P. Z., Link, T. E., and Abatzoglou, J. T. (2014). Extent of the Rain-Snow Transition Zone in the Western U.S. Under Historic and Projected Climate. Geophys. Res. Lett. 41, 4560–4568. doi:10.1002/2014gl060500
Lawrence, C. R., and Neff, J. C. (2009). The Contemporary Physical and Chemical Flux of Aeolian Dust: A Synthesis of Direct Measurements of Dust Deposition. Chem. Geology. 267, 46–63. doi:10.1016/j.chemgeo.2009.02.005
Lemke, P., Ren, J., Alley, R. B., Allison, I., Carrasco, J., Flato, G., et al. (2007). “Observations: Changes in Snow, Ice and Frozen Ground,” in Climate Change 2007: The Physical Science Basis. Contribution of Working Group I to the Fourth Assessment Report of the Intergovernmental Panel on Climate Change. Editors S. Solomon, D. Qin, M. Manning, Z. Chen, M. Marquis, K. B. Averyt, M. Tignor, and H. L. Miller (Cambridge, United Kingdom and New York, NY: Cambridge University Press), Chap. 4.
Love, J. D., and Christiansen, A. C. (1985). Geologic Map of Wyoming: U.S. Geological Survey, 3 Sheets. scale 1:500,000. doi:10.3133/70046739
Malard, F., Tockner, K., and Ward, J. V. (1999). Shifting Dominance of Subcatchment Water Sources and Flow Paths in a Glacial Floodplain, Val Roseg, Switzerland. Arctic, Antarctic, Alpine Res. 31, 135–150. doi:10.1080/15230430.1999.12003291
Maloof, A., Piburn, J., Tootle, G., and Kerr, G. (2014). Recent Alpine Glacier Variability: Wind River Range, Wyoming, USA. Geosciences 4, 191–201. doi:10.3390/geosciences4030191
Mansfield, C. R., and Black, F. J. (2015). Quantification of Monomethylmercury in Natural Waters by Direct Ethylation: Interference Characterization and Method Optimization. Limnology and Oceanography: Methods 13, 81–91. doi:10.1002/lom3.10009
Marston, R. A., Pochop, L. O., Kerr, G. L., Varuska, M. L., and Veryzer, D. J. (1991). Recent Glacier Changes in the Wind River Range, Wyoming. Phys. Geogr. 12, 115–123. doi:10.1080/02723646.1991.10642421
Mast, M. A., Manthorne, D. J., and Roth, D. A. (2010). Historical Deposition of Mercury and Selected Trace Elements to High-Elevation National Parks in the Western U.S. Inferred from lake-sediment Cores. Atmos. Environ. 44, 2577–2586. doi:10.1016/j.atmosenv.2010.04.024
Mccabe, G. J., and Fountain, A. G. (2013). Glacier Variability in the Conterminous United States during the Twentieth century. Climatic change 116, 565–577. doi:10.1007/s10584-012-0502-9
Mccune, B., and Mefford, M. (1999). PC-ORD: Multivariate Analysis of Ecological Data. Version 4 for Windows;[User's Guide]. Gleneden Beach, OR: MjM software design.
Milner, A. M., Brittain, J. E., Brown, L. E., and Hannah, D. M. (2010). “Water Sources and Habitat of Alpine Streams,” in Alpine Waters. Editors U. Bundi. Berlin Heidelberg, Germany: Springer, 175–191. doi:10.1007/978-3-540-88275-6_9
Milner, A. M., Brown, L. E., and Hannah, D. M. (2009). Hydroecological Response of River Systems to Shrinking Glaciers. Hydrol. Process. 23, 62–77. doi:10.1002/hyp.7197
Nimick, D. A., Gammons, C. H., and Parker, S. R. (2011). Diel Biogeochemical Processes and Their Effect on the Aqueous Chemistry of Streams: A Review. Chem. Geology. 283, 3–17. doi:10.1016/j.chemgeo.2010.08.017
Reynolds, R. L., Mordecai, J. S., Rosenbaum, J. G., Ketterer, M. E., Walsh, M. K., and Moser, K. A. (2010). Compositional Changes in Sediments of Subalpine Lakes, Uinta Mountains (Utah): Evidence for the Effects of Human Activity on Atmospheric Dust Inputs. J. Paleolimnol 44, 161–175. doi:10.1007/s10933-009-9394-8
Ronald Frost, B., Frost, C. D., Hulsebosch, T. P., and Swapp, S. M. (2000). Origin of the Charnockites of the Louis lake Batholith, Wind River Range, Wyoming. J. Petrology 41, 1759–1776. doi:10.1093/petrology/41.12.1759
Schuster, P. F., Krabbenhoft, D. P., Naftz, D. L., Cecil, L. D., Olson, M. L., Dewild, J. F., et al. (2002). Atmospheric Mercury Deposition during the Last 270 years: A Glacial Ice Core Record of Natural and Anthropogenic Sources. Environ. Sci. Technol. 36, 2303–2310. doi:10.1021/es0157503
Schuster, P. F., Schaefer, K. M., Aiken, G. R., Antweiler, R. C., Dewild, J. F., Gryziec, J. D., et al. (2018). Permafrost Stores a Globally Significant Amount of Mercury. Geophys. Res. Lett. 45, 1463–1471. doi:10.1002/2017gl075571
Schuster, P., Shanley, J., Marvin-Dipasquale, M., Reddy, M., Aiken, G., Roth, D., et al. (2008). Mercury and Organic Carbon Dynamics during Runoff Episodes from a Northeastern USA Watershed. Water Air Soil Pollut. 187, 89–108. doi:10.1007/s11270-007-9500-3
Schwikowski, M., and Eichler, A. (2010). “Alpine Glaciers as Archives of Atmospheric Deposition,” in Alpine Waters. Editors U. Bundi. Berlin Heidelberg, Germany: Springer, 141–150. doi:10.1007/978-3-540-88275-6_7
Spaulding, S. A., Otu, M. K., Wolfe, A. P., and Baron, J. S. (2015). Paleolimnological Records of Nitrogen Deposition in Shallow, High-Elevation Lakes of Grand Teton National Park, Wyoming, U.S.A. Arctic, antarctic, alpine Res. 47, 703–717. doi:10.1657/aaar0015-008
Stewart, I. T., Cayan, D. R., and Dettinger, M. D. (2004). Changes in Snowmelt Runoff Timing in Western North America under a `Business as Usual' Climate Change Scenario. Climatic Change 62, 217–232. doi:10.1023/b:clim.0000013702.22656.e8
Swift, D. A., Nienow, P. W., Hoey, T. B., and Mair, D. W. F. (2005). Seasonal Evolution of Runoff from Haut Glacier d'Arolla, Switzerland and Implications for Glacial Geomorphic Processes. J. Hydrol. 309, 133–148. doi:10.1016/j.jhydrol.2004.11.016
Thompson, D., Tootle, G., Kerr, G., Sivanpillai, R., and Pochop, L. (2011). Glacier Variability in the Wind River Range, Wyoming. J. Hydrol. Eng. 16, 798–805. doi:10.1061/(asce)he.1943-5584.0000384
Tolotti, M., Cerasino, L., Donati, C., Pindo, M., Rogora, M., Seppi, R., et al. (2020). Alpine Headwaters Emerging from Glaciers and Rock Glaciers Host Different Bacterial Communities: Ecological Implications for the Future. Sci. Total Environ. 717, 137101. doi:10.1016/j.scitotenv.2020.137101
Tranter, M. (2003). Geochemical Weathering in Glacial and Proglacial Environments. Treatise Geochem. 5, 605. doi:10.1016/b0-08-043751-6/05078-7
Tranter, M., Sharp, M. J., Lamb, H. R., Brown, G. H., Hubbard, B. P., and Willis, I. C. (2002). Geochemical Weathering at the Bed of Haut Glacier d'Arolla, Switzerland?a New Model. Hydrol. Process. 16, 959–993. doi:10.1002/hyp.309
Usepa (2002). Method 1631, Revision E: Mercury in Water by Oxidation, Purge and Trap, and Cold Vapor Atomic Fluorescence Spectrometry. Washington, D.C. U.S: Environmental Protection Agency.
Usepa (1996). Method 1669: Sampling Ambient Water for Trace Metals at EPA Water Quality Criteria Levels. Washington, D.C.: U.S: Environmental Protection Agency., 33.
Vandeberg, G. S., and Vanlooy, J. A. (2016). Continental Glacier Meltwater Contributions to Late Summer Stream Flow and Water Quality in the Northern Wind River Range, Wyoming, USA. Environ. Earth Sci. 75, 389. doi:10.1007/s12665-016-5295-0
Vanlooy, J. A., and Vandeberg, G. S. (2019). Late Summer Glacial Meltwater Contributions to Bull Lake Creek Stream Flow and Water Quality. Wyoming, USA: Wind River RangePhysical Geography, 1–20. doi:10.1080/02723646.2019.1565215
Vanlooy, J. A., Forster, R. R., Barta, D., and Turrin, J. (2013). Spatially Variable Surface Elevation Changes and Estimated Melt Water Contribution of Continental Glacier in the Wind River Range, Wyoming, USA: 1966-2011. Geocarto Int. 28, 98–113. doi:10.1080/10106049.2012.665500
Vanlooy, J. A., Miège, C., Vandeberg, G. S., and Forster, R. R. (2014). Ice Volume Estimation Inferred from Ice Thickness and Surface Measurements for Continental Glacier, Wind River Range, Wyoming, USA. J. Glaciol. 60, 478–488. doi:10.3189/2014jog13j162
Keywords: glacial meltwater, geochemistry, diel cycle, trace metals, supraglacial meltwater, proglacial streams, atmospheric deposition
Citation: Barkdull NS, Carling GT, Fernandez DP, Nelson ST, Bickmore BR, Tingey DG, Checketts HN, Packer BN and Hale CA (2021) Glaciers Control the Hydrogeochemistry of Proglacial Streams During Late Summer in the Wind River Range, Wyoming, United States. Front. Earth Sci. 9:727575. doi: 10.3389/feart.2021.727575
Received: 18 June 2021; Accepted: 06 October 2021;
Published: 20 October 2021.
Edited by:
Raul A. Loayza-Muro, Universidad Peruana Cayetano Heredia, PeruReviewed by:
Thomas Condom, Institut de Recherche Pour le Développement (IRD), FranceShawn Marshall, University of Calgary, Canada
Copyright © 2021 Barkdull, Carling, Fernandez, Nelson, Bickmore, Tingey, Checketts, Packer and Hale. This is an open-access article distributed under the terms of the Creative Commons Attribution License (CC BY). The use, distribution or reproduction in other forums is permitted, provided the original author(s) and the copyright owner(s) are credited and that the original publication in this journal is cited, in accordance with accepted academic practice. No use, distribution or reproduction is permitted which does not comply with these terms.
*Correspondence: Gregory T. Carling, Z3JlZy5jYXJsaW5nQGJ5dS5lZHU=