 Ignacio Castro-Melgar
 Janire Prudencio
 Andrea Cannata
 Edoardo Del Pezzo
 Jesús M. Ibáñez
95% of researchers rate our articles as excellent or good
Learn more about the work of our research integrity team to safeguard the quality of each article we publish.
Find out more
ORIGINAL RESEARCH article
Front. Earth Sci. , 23 September 2021
Sec. Volcanology
Volume 9 - 2021 | https://doi.org/10.3389/feart.2021.725402
This article is part of the Research Topic Multidisciplinary Investigations for Determining the Structure and Dynamics of Active Volcanic Systems View all 9 articles
We present the first two-dimensional (2-D) spatial distribution of seismic scattering and intrinsic attenuation beneath the Aeolian Islands arc. The Aeolian Islands archipelago represents one of the best examples of a small dimension volcanic island arc characterised by the alternation of different structural domains. Using the seismic wave diffusion model as the basis for the analysis, and using data from an active seismic experiment (TOMO-ETNA), we analysed more than 76,700 seismic paths marked by epicentre-seismic station pairs. Based on frequencies of 4–24 Hz, we identified high regional attenuation, comparable with other volcanic areas of the world. We used two different seismogram lengths, reflecting two different sampling depths, which allowed us to observe two different attenuative behaviours. As in most volcanic regions, scattering attenuation predominates over intrinsic attenuation, but some characteristics are area-specific. Volcanic structures present the highest contribution to scattering, especially in the low frequency range. This behaviour is interpreted to reflect the small size of the islands and the potentially relatively small size of individual magmatic feeding systems. In addition, strong scattering observed in one zone is associated with the northernmost part of the so-called Aeolian-Tindari-Letojanni fault system. In contrast, away from the volcanic islands, intrinsic attenuation dominates over scattering attenuation. We interpret this shift in attenuative behaviour as reflecting the large volume of sedimentary material deposited on the seabed. Owing to their poorly consolidated nature, sediments facilitate intrinsic attenuation via energy dissipation, but in general present high structural homogeneity that is reflected by low levels of scattering. Our results show that this region is not underlain by a large volcanic structural complex such as that beneath nearby Mt. Etna volcano. Instead, we observe dimensionally smaller and isolated subsurface volcanic structures. The identification of such features facilitates improved geological interpretation; we can now separate consolidated marine structures from independent subsurface volcanic elements. The results of this study provide a model for new research in similar regions around the world.
Volcanologists seek to understand the nature and structure of the Earth by inferring the physical properties of volcanic structures, determining degrees of homogeneity or heterogeneity, and trying to understand the dynamic nature volcanic eruptions. Volcanic regions offer an attractive paradigm for the scientific community; observations of volcanic regions reflect the external manifestations of numerous internal dynamic processes (e.g., energy and chemical exchanges, rheological transformations, and the evolution of physical properties) at different depths and under different physical conditions. However, models of subsurface features are based on indirect observations. Imaging volcanic structures remains a challenge for the seismological community, even when similar structures have been identified for multiple volcanoes using different methods (e.g., velocity and attenuation from active and passive seismic sources; Zandomeneghi et al., 2008; Zandomeneghi et al., 2009; Rawlinson et al., 2010; García-Yeguas et al., 2012; García-Yeguas et al., 2014; De Siena et al., 2014; Koulakov and Shapiro, 2015; Prudencio et al., 2015a; Prudencio et al., 2015b; De Siena et al., 2017; Prudencio and Manga, 2020; Gabrielli et al., 2020). In particular, high contrast heterogeneities and the identification of structural changes related to magma transport are challenging for these methods (e.g., Castro-Melgar et al., 2021; Giampiccolo et al., 2021). The quality of tomographic images depends strongly on the spatial distribution of both sources and receivers. At the same time, volcanoes present complex morphologies that may not be reflected in the distribution of seismic stations, and the deployment of dense temporary seismic networks can greatly improve the resolution of tomographic images (e.g., Ibáñez et al., 2016a; Ibáñez et al., 2016b; Zulfakriza et al., 2020). However, for island archipelagos, installation sites are limited by islands’ spatial distributions. The Aeolian Islands volcanic arc represents a particularly complex case.
The Aeolian volcanic province consists of seven main islands and a number of additional seamounts forming a volcanic arc (Lucchi et al., 2013). The islands have represented a fundamental reference for volcanology, with Stromboli and Vulcano giving their names to so-called “Strombolian” and “Vulcanian” eruptions. The latter is also the source of the term “volcano.” The region has been a focus of volcanological research, and is of great interest to the general public, partly owing to the paroxysmal activity of Stromboli. For example, during the summer 2019, two powerful paroxysms (July 3 and August 28) produced bombs, lapilli fallout, and small pyroclastic density currents (e.g., Giudicepietro et al., 2020; Giordano and De Astis, 2021; Viccaro et al., 2021) that caused widespread fires and damage across the island, including injuries and one fatality. This eruption, for which there were no apparent observable precursors, challenged the often-accepted paradigm that volcanoes always act in the same way. Subsequently, on May 19, 2021 a new explosive eruption of Stromboli generated another non-typical pyroclastic flow. Stromboli is not the only active volcano in the Aeolian Archipelago; Vulcano, the southernmost island, produced many eruptions in historical times, the most recent of which occurred from 1888 to 1890 (Selva et al., 2020 and references therein). Although permanent residents of the Aeolian Islands are not numerous, the population dramatically increases during the summer season, leading to a sharp increase in the associated volcanic risk (Rosi et al., 2013; Selva et al., 2020; Giordano and De Astis., 2021). Hence, it is crucial to properly assess volcanic hazards in the Aeolian volcanic province and their evolution over time, including the monitoring of activity (e.g., seismic, ground deformation, geochemical) and investigations of magmatic dynamics, plumbing system structures, and regional crustal structures, all of which play a fundamental role.
Various techniques have been proposed for modelling subsurface dynamics, including Deep Learning and Machine Learning (e.g., Titos et al., 2018; Bueno et al., 2019; Bueno et al., 2021; Martínez et al., 2021), satellite remote sensing (e.g., Ganci et al., 2020), among others (e.g., Saccorotti and Lokmer, 2021). However, tomographic analysis based on seismic velocity and attenuation remains one of the best tools because it can provide direct links between changes in wave-field properties and the physical conditions of the medium (Castro-Melgar et al., 2021). Obtaining tomographic images of the Aeolian Islands is complex, especially owing to the geographical dispersion and small sizes of the islands. For example, Lipari covers an area of 37 km2, Vulcano is just 21 km2, and Stromboli is just 13 km2. These factors preclude a high density of seismic stations, while the installation and maintenance of long-term ocean bottom seismic stations remains difficult. Active seismic experiments of small regions have been performed at Deception Island (Zandomeneghi et al., 2009) and Montserrat (Shalev et al., 2010; Voight et al., 2014). However, the resolution of a similar experiment carried out for the island of Stromboli (Castellano et al., 2008) was limited (Prudencio et al., 2015c; Patanè et al., 2017). The velocity structure of the region has been considered in a number of studies (e.g., Chiarabba et al., 2008; Díaz-Moreno et al., 2018), including those with a focus on Stromboli (e.g., Chouet et al., 1998; Petrosino et al., 1999; La Rocca et al., 2000; Petrosino et al., 2002; Linde et al., 2014). Recently, Del Pezzo et al. (2019) obtained an average value of intrinsic and scattering attenuation, giving the first approximation of the average attenuation behaviour of the region since the work of Del Pezzo et al. (1983). These results show that on average this region has much stronger scattering attenuation behaviour than that around Mt. Etna volcano, suggesting a high degree of heterogeneity. In this study, we used data generated by the TOMO-ETNA experiment to produce a two-dimensional (2-D) attenuation model of the Aeolian Islands region, with a focus on separating intrinsic and scattering attenuation effects. The Aeolian Islands archipelago represents one of the best examples of a small dimension volcanic island arc characterised by the alternation of different structural domains. The identification of such features, which can be detected by lateral small scale attenuation contrasts, facilitates improved geological interpretation, allowing us to separate consolidated marine structures from independent volcanic units. In this paper, we show that kernel-based, separated intrinsic- and scattering-attenuation imaging allows the detection of local lateral contrasts in attenuation; we believe that our findings will open up new research avenues for similar regions around the world. Finally, we directly compare the attenuation features of this region with the nearest volcanic complex, Mt. Etna, about which a number of recent studies have been published (Ibáñez et al., 2020; Castro-Melgar et al., 2021; Giampiccolo et al., 2021).
The Aeolian volcanic arc is located at the convergent boundary between the African and Eurasian plates (e.g., Ventura, 2013) and has been the focus of geological, geodynamic, and seismic studies. Here, we present a short summary of some of the most relevant results. Several lines of evidence suggest how these volcanoes belong to a subduction-dominated area. The geochemical characteristics of the volcanic rocks, the occurrence of deep earthquakes (down to ∼600 km), and the presence of basins of oceanic nature in the Southern Tyrrhenian Sea (such as the Magnaghi, Vavilov and Marsili basins) all suggest subduction related to the rollback of the Ionian slab below the Calabrian Arc (e.g., Gvirtzman and Nur, 2001; Chiarabba et al., 2008; Ventura, 2013). See Figure 1 of De Astis et al. (2003) and Figure 2.1 of Ventura (2013) for additional details.
The Aeolian volcanic province consists of seven main islands and several seamounts forming a half-ring structure around the Marsili Basin (Lucchi et al., 2013). Among the main islands, Stromboli, Vulcano, Lipari, and Panarea are considered active. On the basis of structural and volcanological features, the Aeolian Islands and associated seamounts can be divided into three main sectors (see Figure 1 of De Astis et al., 2003): 1) the western sector, including some seamounts and the Alicudi and Filicudi Islands; 2) the central sector, with the islands of Salina, Lipari, and Vulcano; and 3) the eastern sector, including Panarea, Stromboli, and some seamounts.
Structurally, the Aeolian archipelago is dominated by three main fault systems (see Figures 2, 4 of De Astis et al., 2003): 1) the “Sisifo-Alicudi” fault system, a WNW–ESE striking system characterising the volcanoes of the western sector; 2) the “Aeolian–Tindari–Letojanni” fault system, a NNW–SSE striking system influencing the volcanoes in the central sector; and 3) a NNE–SSW to NE–SW fault system affecting Stromboli and Panarea. Concerning the seismicity of the Aeolian area, intermediate and deep hypocentres (focal depth >30 km) concentrate along the Ionian slab (e.g., Selvaggi and Chiarabba, 1995). In addition, earthquakes are located in the crust at focal depths of 5–7 km b.s.l., as well as at the crust-mantle transition (15–20 km b.s.l.). The epicentral distribution of the seismicity partially reflects the spatial distribution of the aforementioned main structural features (e.g., De Luca et al., 1997; De Astis et al., 2003). Indeed, two main epicentral alignments can be noted, those striking WNW–ESE, corresponding to the “Sisifo–Alicudi” fault system, and NNW–SSE, overlapping the “Aeolian–Tindari–Letojanni” fault system.
In terms of crustal structure, tomography, deep seismic sounding, and gravity data suggest a decrease of crust thickness in the Marsili Basin, as well as along the Salina–Lipari–Vulcano NNW–SSE-striking alignment (e.g., De Luca et al., 1997; Ventura et al., 1999; Pepe et al., 2000; Ventura, 2013). In particular, in the Marsili Basin the Moho is at ∼10 km depth (e.g., Pontevivo and Panza, 2006).
sTOMO-ETNA was an active seismic experiment designed to improve understanding of the structure beneath Mt. Etna (Ibáñez et al., 2016a; Ibáñez et al., 2016b). The experiment involved the use of a large number of human and material resources (including seismic stations, and oceanographic, hydrographic, and logistical support vessels from Italy, Spain, and Greece). For this reason, it was decided to maximize the efficiency of the work by extending the shot locations from Ionian Sea to the Tyrrhenian Sea to include the Aeolian Islands (Coltelli et al., 2016).
The experiment, divided into several phases (between June and December 2014), generated active seismic signals using different capacities and powers of the air-guns. Those with the highest capacity (shots carried out in July 2014) were performed using compressors with 5,500 cubic inches of capacity. The aim was to generate two types of signal, one for producing images based on the refraction of seismic waves (using the maximum energy), and the other (based on lower power air-gun shots) to obtain images of marine structures using multi-channel techniques based on seismic reflection. Only shots generated with the maximum energy presented sufficient quality (based on the signal-to-noise ratio) to be used in tomographic structural models (both velocity and attenuation). Castro-Melgar et al. (2021) found that the most energetic shots had an equivalent duration magnitude of up to 1.4, based on the magnitude scale of Havskov et al. (2003) for volcanic regions. To this limitation we add a high content of background noise, which is typical of seismic signals in populated areas or on small islands (due to oceanic noise); as such, not all of the signals generated in the experiment were useful for this study. For our attenuation model, we only used signals generated in the Tyrrhenian Sea. From the set of all available seismic stations, we selected 37, guaranteeing at least one seismic station on each of the islands plus a number located on the island of Sicily (Figure 1). Seismic stations deployed on the island of Sicily (13 stations) belong to the portable seismic network provided by the Geophysical Instrument Pool Potsdam (GIPP), Germany. They are DATA-CUBE3 recorders and triaxial PE-6/B 4.5 Hz or Mark L-4C-3D seismometers. Seismic stations in the Aeolian Islands (24 stations) belong to the INGV (Istituto Nazionale di Geofisica e Vulcanologia) permanent network operated by the Osservatorio Etneo (the INGV Etna Observatory). Seismic stations of this network are broadband three-component Nanometrics Trillium seismometers (see Ibáñez et al., 2016a; Ibáñez et al., 2016b, for additional details). This distribution is not ideal for high-definition analysis, but was the best available. Of all the air-gun shots made in the Tyrrhenian Sea, we initially selected 3,450 (Figure 1). The available shot-station pairs provided an initial number of 127,650 waveforms.
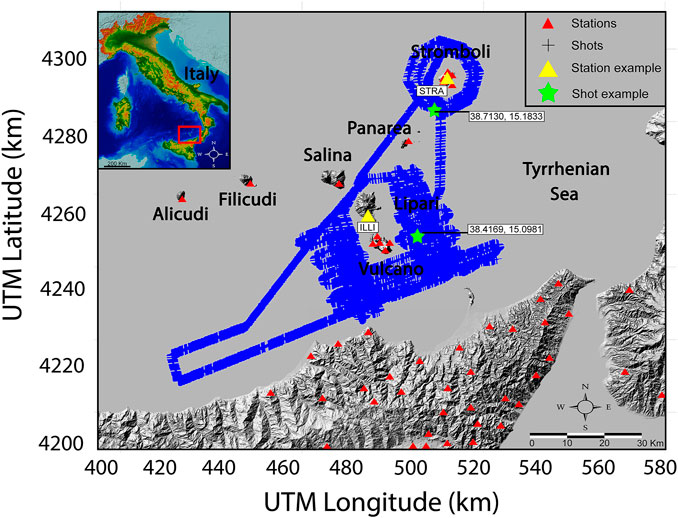
FIGURE 1. Map of the study region. Red triangles represent the locations of seismic stations used in this study. Blue crosses are the locations of air-gun shots generated during the TOMO-ETNA experiment. The highlighted stations (yellow triangles) and shots (green stars) are the stations and shots used as examples in Figures 2, 3. The Digital Elevation Model (DEM) used for this figure was obtained using the database of Tarquini et al. (2007).
The TOMO-ETNA database has previously been used to determine the attenuation structure of the Mt. Etna volcano region. For these studies, two methodologies have been used: 1) the separation of the intrinsic attenuation (Qi−1) and scattering (Qs−1) contributions through the diffusion model (Wu, 1985) and its 2-D spatial representation (Ibáñez et al., 2020); and 2) a 3-D attenuation tomographic study (Castro-Melgar et al., 2021) using the coda normalization method (Aki, 1980). Therefore, we tested the resolution of both of these methods in this study. The coda normalization method was ruled out owing to the poor resolution of the results (based on checkerboard and isolated anomaly tests). However, since the theoretical basis for the representation of the separation of Qi−1 and Qs−1 assigns attenuation values to a broader spatial region (e.g., Del Pezzo et al., 2018; Del Pezzo and Ibáñez, 2020), the checkerboard test indicated that a significant part of the region to be studied could be interpreted in a reliable way using this approach.
The diffusion method to obtain Qi−1 and Qs−1 and its spatial representation are explained in detail by numerus authors (e.g., Wegler and Luhr, 2001; Del Pezzo, 2008) and have been widely used (e.g., Prudencio et al., 2013a for Tenerife Island; Prudencio et al., 2013b for Deception Island; Prudencio et al., 2015c for Stromboli volcano; Prudencio et al., 2017a for Asama volcano; Prudencio et al., 2017b for Usu volcano; Prudencio et al., 2018 for Long Valley). This method is based in the assumption that the seismogram energy envelope can be modelled by the so-called radiative transfer equation (also called the transport model; Sato et al., 2012). Wegler and Luhr (2001) demonstrated that when the propagation medium can be assumed as extremely heterogeneous, as in volcanic structures or the shallowest part of the crust, then the diffusion approximation of the transport model is valid. In this approximation, the seismogram energy envelope is developed as a function of lapse time and source–receiver distance in terms of intrinsic and scattering attenuation coefficients. In this approach the seismic energy density as a function of time and source–station distance is linearised with respect to the two attenuation parameters, making it possible to separate the contributions of scattering and intrinsic attenuation effects through simple linear inversion (Prudencio et al., 2013a). Here, we simply highlight that by using the diffusivity (d) and coefficient for intrinsic attenuation (b) to estimate the intrinsic and scattering attenuation Q factors (Qi and Qs, respectively) as follows:
where f is the frequency and v is the velocity of S waves. In addition, the total attenuation value (Qt−1) is represented as:
As described in the next section, the determination of the coefficients b and d is carried out by fitting the energy of the entire seismogram, after the arrival of the P-wave, according to the equations representing the diffusion model.
The data analysis process was systematically structured to ensure the highest quality of data. This process is summarised in the following steps.
Each seismogram associated with a shot-station pair was studied according to its signal-to-noise spectral relationship for the selected frequency bands. To determine if a signal was able be analysed, or in which frequency bands the attenuation parameters could be studied, the signal-to-noise ratio should be higher than 2. This study was performed automatically. Each signal used was previously used by Díaz Moreno et al. (2018) for a study of the velocity tomography model. Therefore, each signal already had a determined arrival time of the P wave. In this way, to determine the noise signal level, a 5 s pre-event window was selected 10 s before the arrival of the P wave. Similarly, from the arrival of the P phase, another 5 s window was taken. Finally, for the coda at the end of each window of the coda (20 or 30 s) another window of 5 s was recalculated. In this way all signals with P/noise and coda/noise ratios lower than 2 were discarded. Figure 2 shows an example of a signal used in this study in all frequency bands, and another example where the signal was used only for the band between 2 and 12 Hz. According to the theoretical active source model described in Coltelli et al. (2016), all the seismic signals could be analysed in the band between 4 and 20 Hz.
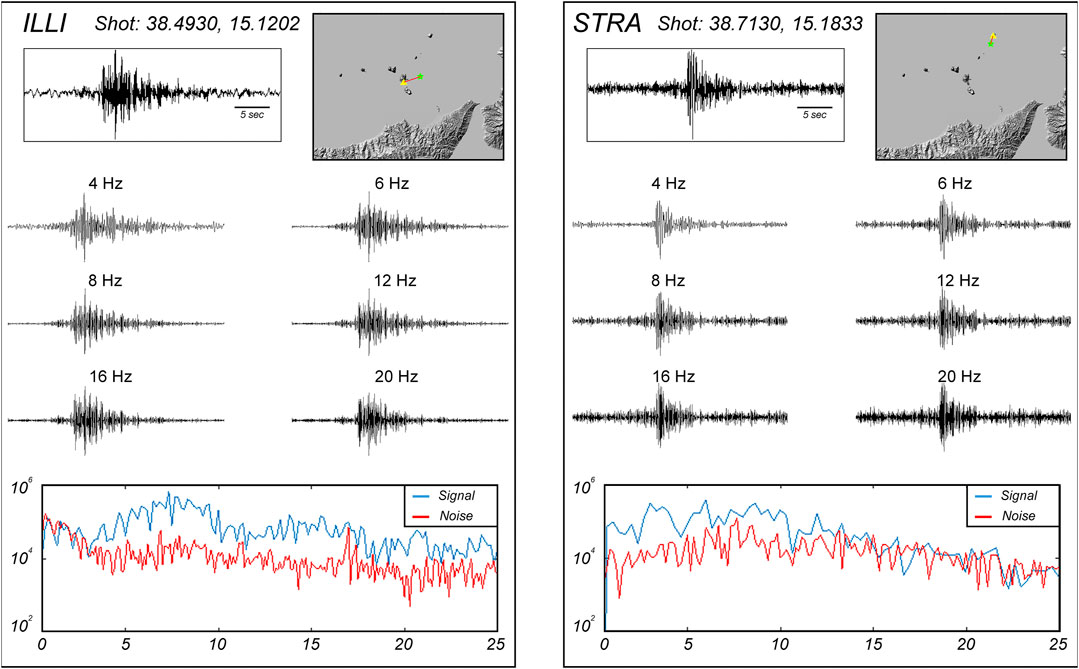
FIGURE 2. Example seismograms recorded on Lipari and Stromboli islands. Signals were filtered in six selected frequency bands. The bottom plots show the spectra of the signal and pre-event noise, which reflect the quality of the signals. Seismic stations and shots are identified in Figure 1. The shot recorded at station ILLI is that depicted in Figure 3.
To determine the different frequency bands for analysis, we followed the procedure described in Ibáñez et al. (2020). In the procedure described above, the quality of the signal was studied without filtering the signal. It is possible that this ratio is not optimal for the analysis of all frequencies. Therefore, we first analysed the spectra of a selected sample of seismograms to identify the frequency range in which the signal-to-noise ratio was suitable for further analysis. These frequency bands were determined according to previous studies and the theoretical spectra of the active source model (Coltelli et al., 2016). On the basis of this additional check we selected six frequency bands centred on 4, 6, 8, 12, 16, and 20 Hz. We filtered the active source seismograms using an eight-pole Butterworth bandpass filter with a bandwidth of fc ± 0.6 fc.
Based on the signal-to-noise ratio, two analysis time windows with fixed lapse-times at 20 and 30 s were selected. The selected lapse times are associated with the duration of the signal but are also in agreement with the diffusion approximation, which means that longer lapse times will not follow the model. The start time of this window, tmin, corresponds to the P wave picking time determined by Díaz-Moreno et al., 2018 using an automatic signal processing algorithm described in García et al. (2016). To determine the end time of this window, we distinguished between window duration and lapse time. Lapse time is the time interval between the moment in which the active seismic signal was generated and the time in which the signal arrived at the seismic station. Given the fixed lapse times used here, we have different window analysis durations. For short epicentral distances, the window length is larger than for large epicentral distances. This is because at short distances the arrival of the P wave is fixed earlier than for longer distances. To determine the lapse time and hence the window length, we assumed an average Vp velocity of 5.3 km/s, which corresponds to the average velocity of the first 4–5 km as determined by Díaz-Moreno et al. (2018); we fixed a Vp/Vs ratio of 1.73. According to the studies cited above, we assumed that our envelope was formed by P to S-converted waves. Following this estimation of start and end times of the window analysis, it was possible to extract the signal windows to be fitted within each selected frequency band.
We used the Hilbert transform to obtain the signal envelope of the energy of every extracted and filtered window. As described by Del Pezzo et al. (2016), there are no substantial differences in the attenuation values according to the seismic components; in this study we used the vertical component Z. We used a moving window of 0.7 s and 50% overlap to create the envelope to be fitted.
The air-gun shots used for the present study were generated on the surface of the sea. This type of signal produces secondary waves that travel directly from the source to the station through the water volume (so-called water-waves); these have similar characteristics to the well-known T-waves (Carmona et al., 2015). This type of signal and how it could negatively affect in the determination of Qi−1 and Qs−1 were discussed in detail by Ibáñez et al. (2020). These waves must be extracted or removed from the envelope of the energy before proceeding with the estimation of the coefficients of attenuation. According to Eq. 8 of Ibáñez et al. (2020) it is possible to estimate the theoretical arrival of these waves. Once this time was calculated for every shot-station pair it was removed from the envelope of the signal for an interval between 0.5 s before and 2.5 s after the theoretically estimated first onset of water waves. As it is indicated in Figure 3 of Ibáñez et al. (2020) this procedure increases the quality of the fitting procedure.
After obtaining the envelope—that is, the energy according to Eq. 2 of Prudencio et al. (2013a)—we multiplied each value by t p/2, where p is the theoretical geometrical spreading value, assumed to be 3 for S-waves (as applied in our previous studies), and then took the logarithm on the energy envelope. The whole envelope was fitted to Eq. 3 using the mean square fitting as done previously (e.g., Prudencio et al., 2013a). To define the quality of the results for each fit we obtained individual correlation coefficient; all results with correlation coefficients of <0.7 were removed. Using Eqs 5, 6 of Prudencio et al. (2013a), b and d were derived for every single shot-station pair. Using Eqs 1–3 of the present manuscript, we derived single values for the scattering (Qs), intrinsic (Qi), and total (Qt) quality factors. Figure 3 shows the best fit obtained for an example seismogram recorded on the island of Lipari.
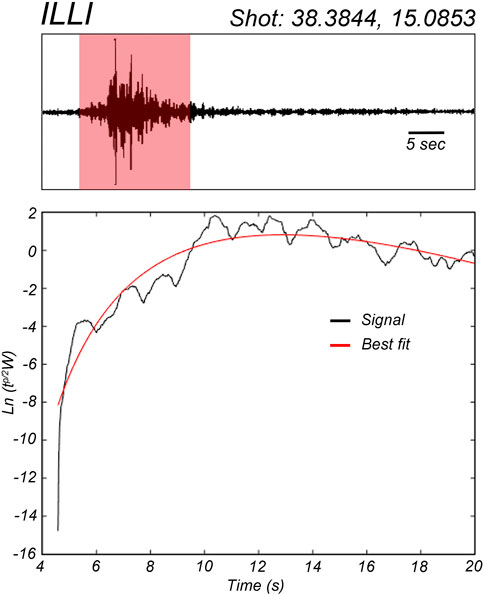
FIGURE 3. Comparison of best fits between the data and model for an example seismogram recorded on the island of Lipari (see Figure 2).
Figure 4 shows all of the densities of the ray paths used in the present work. As shown, the edges of the area, which includes the island of Stromboli, have less coverage than the centre region (on and below the islands of Lipari and Vulcano). However, even in the areas with the poorest coverage, more than 100 rays cross each of the cells in which the area under study is divided.
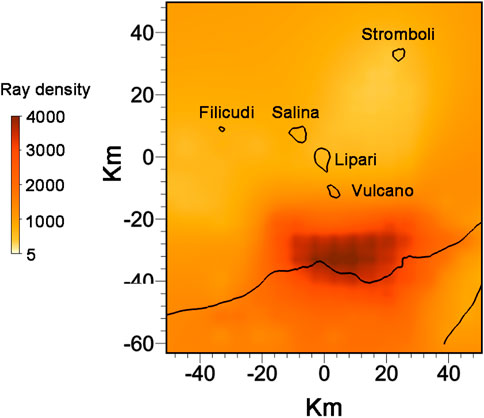
FIGURE 4. Representation of the set of ray paths used in the present work. Blue triangles represent the positions of seismic stations. Red crosses are the locations of the air-gun shots generated during the TOMO-ETNA experiment.
To plot the spatial distribution of attenuation parameters, we followed the approach of Del Pezzo et al. (2016), as also described in Del Pezzo and Ibáñez (2020). Ibáñez et al. (2020) provide a detailed description of this procedure for data associated with Mt. Etna volcano. In brief, a back-projection method is used to plot spatial variations of Qi and Qs using a space-weighting function. We numerically estimated the energy envelope using the Monte Carlo approach of Yoshimoto (2000), who assumed that energy particles propagate according to Fermat’s rule and change direction on meeting randomly distributed scatterers; this distribution depends on the attenuation parameters. At the receivers, the sum of their energies defines the energy envelope; as such, the weighting function can be estimated. We obtained an intrinsic attenuation weighting function from the path density, and a scattering attenuation weighting function from the collision density. For each source-station pair, the Qi and Qs distributions were obtained by applying the weighting function described in Del Pezzo et al. (2016). We divided the area into cells, and for each cell we assigned corresponding Qi and Qs values. The final spatial distribution corresponds to total, intrinsic, and scattering values obtained by averaging all values assigned to every cell. This method is dependent on the experimental configuration, and is not affected by data quality (Prudencio et al., 2017a,; Prudencio et al., 2017b).
Following Ibáñez et al. (2020), we performed a series of tests to determine the quality of the spatial representation of the Qi, Qs, and Qt values. In contrast to the ordinary checkerboard-like 2-D test, as described in Prudencio et al. (2013a) and Prudencio et al. (2013b), we used a spatial representation of the uncertainty associated with the estimates of Q values in each pixel, as described in detail in Del Pezzo and Ibáñez (2020). This method was the most suitable for the present case, in which we did not perform an inversion of parameters as in most seismic tomography studies, but a projection mapping of the estimated parameters in the space through the weighting functions. To complete the uncertainty representation, we also present the density of the spatial ray path coverage (Figure 4), where a higher density of rays indicates better represented areas. In Figure 5 we show the pattern of “‘Resolution” quantity (see Del Pezzo and Ibáñez, 2020) and the standard deviation associated with the single Q values in each pixel.
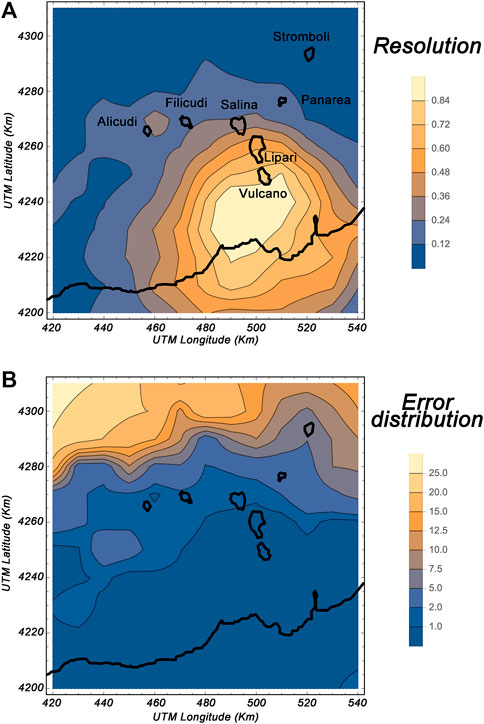
FIGURE 5. Resolution tests to provide a quality check of the validity of the obtained images. Resolution tests showing the spatial distribution of (A) calculated standard deviation σ and (B) estimated errors. The results for the Aeolian Islands study region confirm that the data are reliable and can be used for interpretation.
The area with the best ray coverage (Figure 4) presents the best accuracy in our results, and is associated with a region covering the southernmost islands, the portion of the Tyrrhenian Sea between them, and northern Sicily. The entire archipelago of the Aeolian Islands is well resolved; the area located to the northwest of the selected region has the poorest reliability, although the errors do not exceed 25%. As seen in successive figures, the spatial distribution of the attenuation anomaly implies variation of up to 120%; as such, although the values themselves may not be exact, interpretations based on deviations from the mean will be reliable. Therefore, we conclude that the region selected for study is well represented by our seismic attenuation maps.
We excluded topographic effects, depth dependence, and energy leakage (Sanborn and Cormier, 2018), which can introduce bias; for example, topography generates surface wave scattering. While Prudencio et al. (2017a) found these effects are minor for the approach taken in this study (and even lower when attenuation is mapped as perturbation), Del Pezzo et al. (2018) showed that for shallow active sources, 3-D images strongly resemble 2-D images, minimising the utility of this approach.
Since our approach provides single Qt, Qs, and Qi values for each shot-station pair, lapse time, and frequency band, it is possible to obtain average values for the region. It should be noted that in the study of seismic attenuation there is an indistinguishable, but sometimes confusing, use of the terms Q and Q−1. Here, seismic attenuation refers directly to the term Q−1, since the attenuation is directly proportional to Q−1. The parameter Q represents the so-called quality factor; that is, it is the ratio of total energy to energy loss, which is inversely proportional to attenuation. When we refer to numerical seismic attenuation values, it is common to speak in terms of Q values, since Q takes positive values greater than 1. In general, highly attenuating structures are reflected by low Q values and vice versa. We obtained the average values for Qi−1, Qs−1, Qt−1, Qi, Qs, and Qt for lapse times of 20 and 30 s (Tables 1,2, respectively).
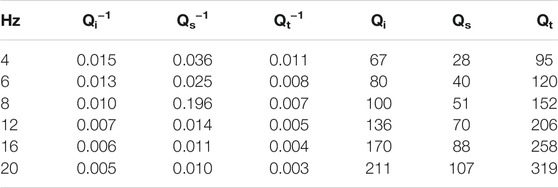
TABLE 1. Average values of Qi−1, Qs−1, Qt−1, Qi, Qs, and Qt for a lapse time of 20 s for the Aeolian Islands.
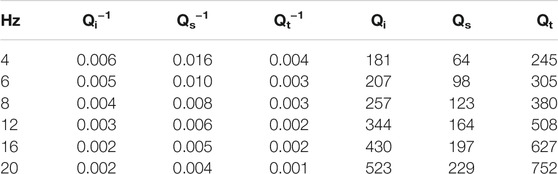
TABLE 2. Average values of Qi−1, Qs−1, Qt−1, Qi, Qs, and Qt for a lapse time of 30 s for the Aeolian Islands.
We found that scattering dominates over intrinsic attenuation for all frequencies. As such, seismograms reflect geological heterogeneities at shallow depth. Using local and regional earthquakes with a source-receiver distance of 5–70 km, Del Pezzo et al. (2019) analysed intrinsic and scattering attenuation for a region that included our study area using the Multiple Lapse Time Window Analysis (MLTWA) method (Hoshiba, 1991; Akinci et al., 1995). They also found that scattering dominates over intrinsic absorption in the Aeolian Islands region. However, while we observed this for all frequency bands, they found that at higher frequencies intrinsic attenuation was stronger than scattering. These differences reflect differences in the depths of seismic sources. In this study, seismograms were generated at the surface (air-gun shots) and provide data pertinent to the uppermost crust (i.e., the first few kilometres). In Del Pezzo et al. (2019), earthquakes were deeper (∼10 km) and could be recorded at distances of up to 100 km, and thus provided data to resolve deeper structures. These differences confirm that the Q factor increases with depth (Ibáñez et al., 1990; Badi et al., 2009).
Figure 6 compares Qi and Qs values obtained for different volcanic areas in studies performed by our research group. We compared results using similar time lapses; the shortest (15 s) was used for Deception and Stromboli islands and the largest (30 s) was used for the Long Valley case. For the remaining areas, a 20 s lapse time was used. We observe that Qs is always significantly lower than Qi, implying that scattering attenuation is stronger that intrinsic attenuation for all compared areas. Unsurprisingly, results derived using the MLTWA method (using earthquakes of different depths; Del Pezzo et al., 2019) show much higher Q (i.e., lower seismic attenuation) values (for both scattering and intrinsic attenuation). However, when comparing only those values obtained using the same method and data type, we generally observe the following results:
1) Qs values for the Aeolian Islands exceed those of other volcanic regions. We suggest that this difference reflects subsurface structural characteristics. Although the region is obviously volcanic, the results are also influenced by the attenuation of oceanic crust, which has lower apparent scattering.
2) In terms of intrinsic attenuation, for a small lapse time (20 s), Qi for the Aeolian Islands region is among the lowest of the studied regions (i.e., it exhibits greater intrinsic attenuation). However, for a longer lapse time (30 s), the intrinsic attenuation is the lowest (i.e., the highest Qi). These differences reflect a number of different factors. For a small lapse time, the areas sampled by seismic waves are very shallow and the contribution to attenuation includes volcanic structures and marine sediments. These sediments make a lower contribution to the scattering effect, but have a greater impact on intrinsic attenuation. For longer lapse times, seismic waves sample to greater depths, and thus there is a contribution from oceanic crust, which is less attenuating than any volcanic structure.
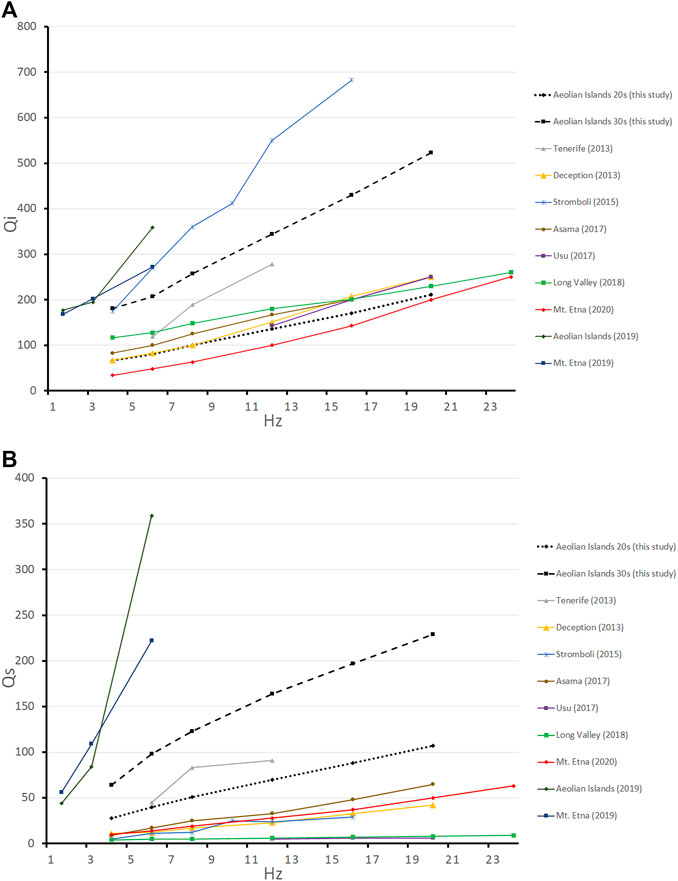
FIGURE 6. Seismic attenuation for different volcanic regions. Comparisons of (A) Qi and (B) Qs for different regions using similar methodologies. The different results were obtained from the following references: Tenerife (2013) from Prudencio et al. (2013a); Deception (2013) from Prudencio et al. (2013b); Stromboli (2015) from Prudencio et al. (2015c); Asama (2017) from Prudencio et al. (2017a); Usu (2017) from Prudencio et al. (2017b); Long Valley (2018) from Prudencio et al. (2018); Mt. Etna (2019) and Aeolian Islands (2019) from Del Pezzo et al. (2019); Mt. Etna (2020) from Ibáñez et al. (2020).
These results justify the need to obtain maps of the spatial distributions of both scattering and intrinsic attenuation in order to determine how volcanic structures affect these values.
Spatial representation of attenuation was performed by plotting the distribution of Q−1 values (directly proportional to the attenuation) rather than by plotting the absolute values. The Q−1 values were calculated as the difference in percentage from the average value, with a maximum of up to ±120%. We use a rainbow colour scale, where the average value of the seismic attenuation is represented in green, areas of low attenuation are represented by cold colours (tending towards blue), and areas of high attenuation are represented by warm colours (tending towards red). With the exception of some peripheral areas, the study region is well-resolved.
As previously mentioned, the mean attenuation by scattering dominates over the intrinsic attenuation. We investigated whether this trend is general for the entire region under study or if there are structural elements for which the opposite occurs. Figure 7 shows anomaly maps for intrinsic, scattering, and total attenuation (represented by Q−1) for the 4 Hz frequency of the two lapse times analysed (20 and 30 s, as shown in Figures 7A,B, respectively). In these maps we have used the same colour scale for all values, for QT, QS, and Qi. On this scale, the lowest Q values are represented in red and the highest in blue. In this way, areas with the greatest attenuation are dominated by red hues, and those with the lowest attenuation by blue hues.
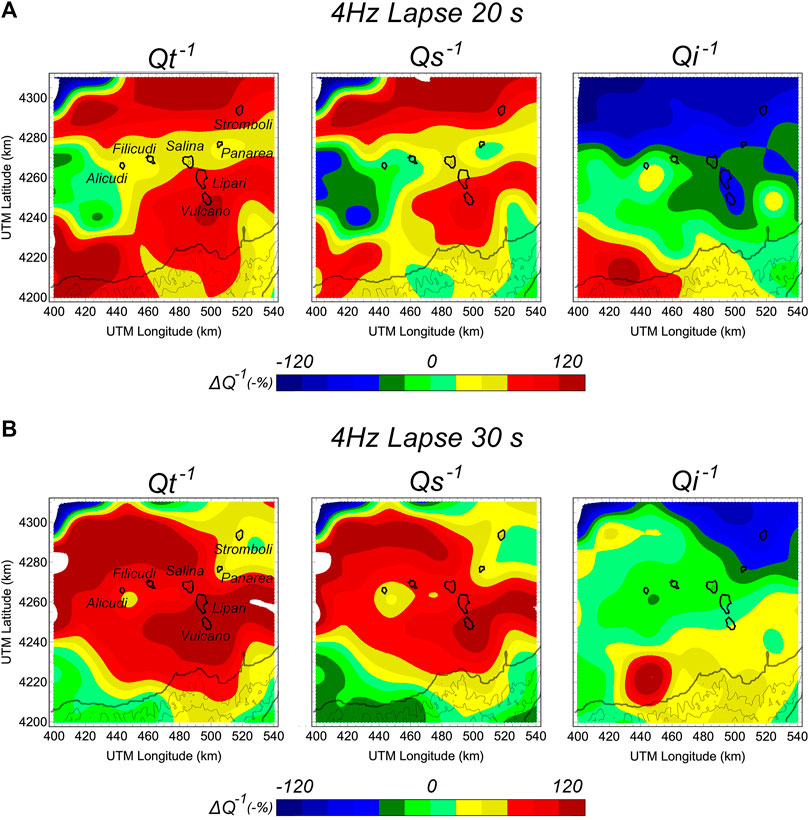
FIGURE 7. Attenuation anomaly maps of intrinsic, scattering, and total attenuation (represented by Q−1) for a frequency of 4 Hz. Maps are given for two lapse times: (A) 20 s and (B) 30 s.
In general, scattering attenuation dominates over intrinsic attenuation throughout the region. To better illustrate this observation, Figure 8 shows the QS/Qi ratios for the 20 s time lapse and the frequencies of 4, 6, 8, and 12 Hz. As observed for the entire region, this ratio is less than 1, which confirms that attenuation by scattering clearly dominates over intrinsic attenuation. We must emphasize that around the islands of Stromboli, Lipari, and Vulcano, this scattering effect is an order of magnitude greater than that of areas located further to the west, where marine deposits predominate and where there is a certain similarity between the two attenuation mechanisms.

FIGURE 8. Maps of Qs/Qi ratios for frequencies of 4, 6, 8, and 12 Hz with a lapse time of 20 s.
We made maps of the spatial distributions of intrinsic (Figure 9) and scattering attenuation (Figure 10), from which we identified a set of attenuation anomalies. We interpret as anomalies those zones that differ significantly from the mean value of the region (represented by green hues). From the intrinsic attenuation maps, we identified at least seven regions (labelled as I1 to I7) and from the scattering maps another four anomalous areas (labelled as S1 to S4).
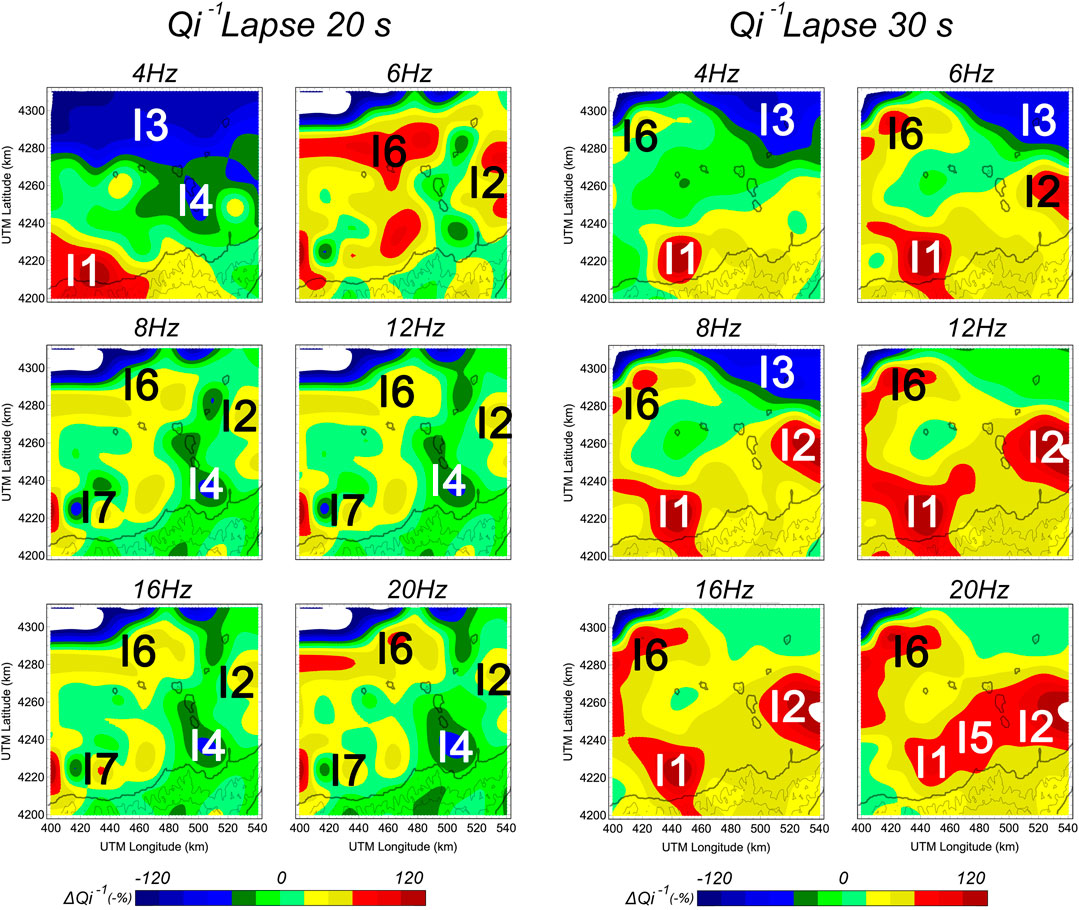
FIGURE 9. Maps of intrinsic attenuation (represented by Qi−1) for all analysed frequency bands. Maps are given for two lapse times: (A) 20 s and (B) 30 s.
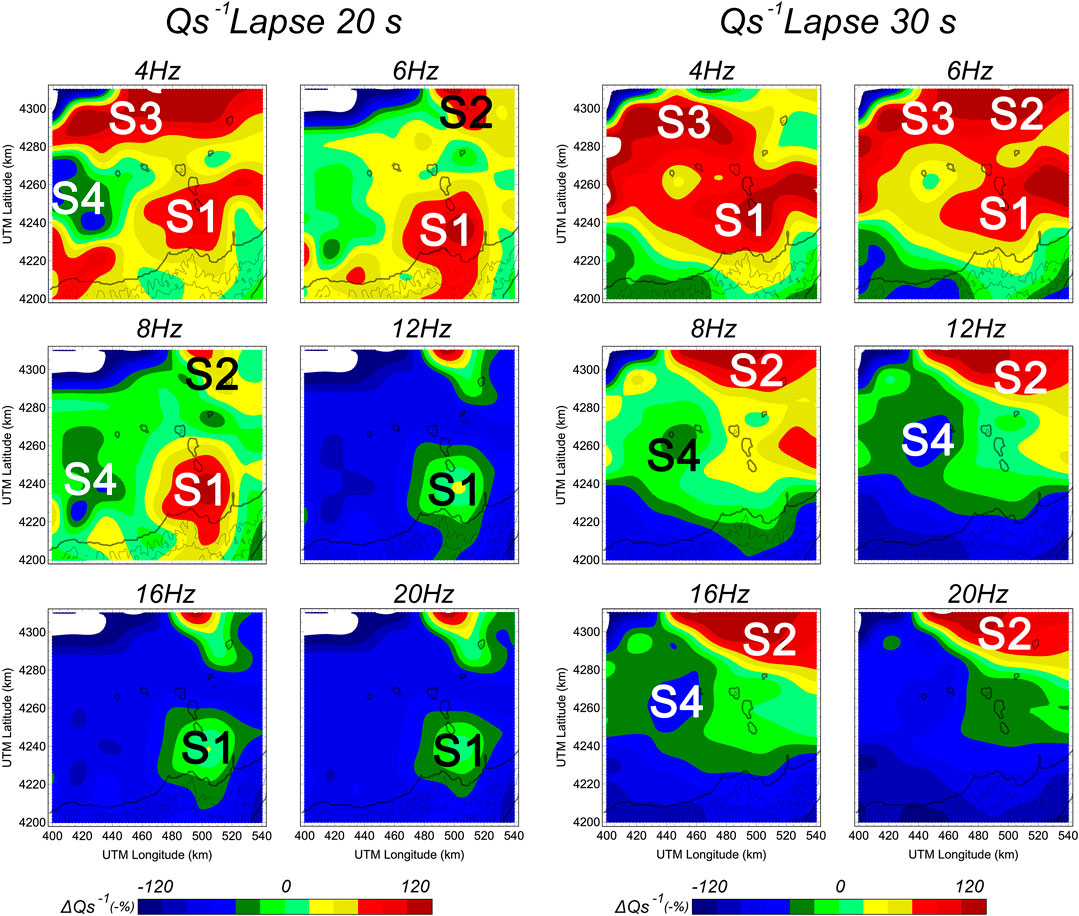
FIGURE 10. Maps of scattering attenuation (represented by Qs−1) for all analysed frequency bands. Maps are given for two lapse times: (A) 20 s and (B) 30 s.
Table 3 shows the average size of the main identified attenuation anomalies, both for intrinsic and scattering attenuation. This sizes vary between a minimum area of ∼400 km2 to some of more than 2,400 km2. As the total size of the studied region is 16,800 km2, these represent proportionally small-scale attenuation anomalies.
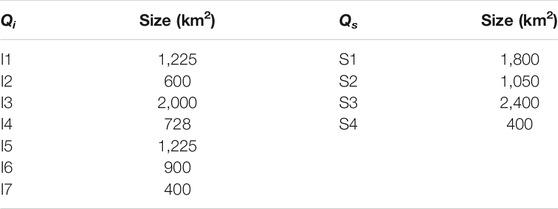
TABLE 3. Average sizes of identified anomalies in the Aeolian Islands region (total area = 16,800 km2).
At this time we do not have an explanation for all of these regions; however, for the others we are able to offer some interpretation.
In reference to the spatial distribution of the intrinsic attenuation (Figure 9), we offer the following observations:
(1) From Tables 1,2, there is not a strong dependency on frequency. In areas of high intrinsic attenuation, the dependence on frequency is even lower.
(2) Two regions, I1 and I2, show relatively elevated intrinsic attenuation. Neither appears to be directly associated with volcanic phenomena, but rather with attenuating effects of the oceanic crust. However, for the lapse time of 30 s and at higher frequencies, I1 and I2 tend to unify and may be associated with volcanic structures of the islands of Vulcano and Lipari.
As discussed, this high intrinsic attenuation likely reflects sedimentary deposits on the seabed, which in this region are enhanced by the additional presence of volcanoclastic deposits (e.g., Romagnoli et al., 2013). According to De Ritis et al. (2010), these areas are also characterised by negative density and magnetization contrasts owing to the thick sedimentary cover.
In reference to the spatial distribution of the scattering attenuation (Figure 10), we make the following observations:
(1) Attenuation by scattering is more dependent on frequency than intrinsic attenuation. In this way, an evident shift from high attenuation anomalies at low frequencies to low attenuation anomalies at high frequencies is observed.
(2) We identified two areas, S1 and S2, associated with volcanic structural elements, where attenuation by scattering is much more intense than in the rest of the region.
It is possible to explain these two observations based on the volcanic nature of the region; that is, on the presence of volcanic islands, where the dependence on frequency is obvious. As discussed, the islands are small in size, and scattering depends on the relationship between the dimensions of the heterogeneity and the wavelength of the incident wave. The fact that scattering attenuation tends to disappear at high frequencies (i.e., at shorter wavelengths) shows that it is the volcanic structures of the islands as a whole that most influence this type of seismic attenuation. For this reason, scattering attenuation is more relevant than intrinsic attenuation. Finally, the two regions marked as S1 and S2 are generally associated with volcanic structures and if these results are compared to the velocity tomography of Díaz-Moreno et al. (2018) there is a high concordance between high seismic attenuation by scattering and low velocity of propagation. In other words, structures of magmatic origin produce greater scattering of seismic waves. It is interesting to highlight that these two areas of high attenuation by scattering were also identified in a pioneering study of attenuation carried out by Del Pezzo et al. (1979).
On the other hand, at the time lapse of 20 s (Figure 10) there is a small region located to the west (marked as S4) where there is a low scattering effect and medium or low intrinsic attenuation. As this region is outside of the volcanic zones and is only observable for a 20 s time lapse (i.e., for the most superficial areas) we interpret this as attenuation due to the presence of marine sediments in the oceanic crust. This area belongs to the Cefalù Basin, a structural depression filled by a sedimentary cover formed by Tortonian to recent deposits (Pepe et al., 2004). The thickness of the Cefalù Basin cover is variable and can reach 1.5–2.0 km (Pepe et al., 2004; Milia et al., 2018), and gives rise to negative gravimetric and magnetic anomalies (De Ritis et al., 2010). According to Milia et al. (2018), the sedimentary cover of the Cefalù basin is made of deep-water turbidite deposits.
In summary, our results show that this area is not a large volcanic structural complex such as that of nearby Mt. Etna volcano, but rather it contains multiple dimensionally smaller volcanic structures.
It is also worth noting that the S1 feature spatially coincides with the northernmost part of the so-called Aeolian–Tindari–Letojanni fault system (e.g., Ghisetti, 1979; Lanzafame and Bousquet, 1997; Palano et al., 2012; Barreca et al., 2014). This system extends from the central sector of the Aeolian Archipelago to the Ionian coast and is characterised by right-lateral kinematics (Alparone et al., 1998; Ventura et al., 1999; De Astis et al., 2003; Ventura, 2013). Moreover, the unusual NNW–SSE orientation of the islands composing the central sector of the Aeolian archipelago (Salina, Lipari, and Vulcano), in contrast to the general geometry of the arc, is considered to be the expression of such a major regional tectonic structure, whose interpretation is still open to debate (Barreca et al., 2014 and references therein). It is not surprising that a rock volume affected by a fault system is characterised by high seismic attenuation by scattering. Based on a 3-D distribution of scatterers in central California, Nishigami (2000) found that the scatterer distribution was roughly correlated with the surface trace of the San Andreas fault system. High attenuation and high-scattering anomalies were also reported by De Siena et al. (2014) for fractured volumes of the Mt. St. Helens Seismic Zone.
In the present work we have demonstrated that kernel-based, separated intrinsic- and scattering-attenuation imaging allows the detection of local lateral contrasts in attenuation even for small lateral contrasts. This technique offers new opportunities study complex regions, including volcanic regions dominated by small islands or several isolated volcanic complexes, in order to better constrain their structures and improve understanding of their dynamics.
We have presented the first seismic attenuation maps for the volcanic archipelago of the Aeolian Islands. The special geographic distribution of the region, along with the limited data and seismic station coverage, limits the resolution of our images; however, we have been able to separate the contributions of intrinsic and scattering seismic attenuation and to represent them spatially. The mean attenuation values reflect that, as expected, the region is highly attenuating. In general, its physical behaviour from the point of view of attenuation processes is similar to that of other volcanic regions previously studied. As it has been observed, scattering phenomena are more important than dissipative phenomena when they are attenuating the elastic energy of seismic waves. This region contains small volcanic islands, and we observed that scattering is strongly associated with the volcanic complexes represented by the islands. For this reason, for high frequencies, where the morphology of the islands is less constrained, there is a strong change in the attenuative behaviour (i.e., the scattering process is less relevant). It is well known that scattering phenomena are associated with the size of the heterogeneities. When incident wavelengths are similar to these heterogeneities, the scattering phenomena of seismic waves are more intense. In our case, as we increased the frequency of the waves, their wavelengths decreased, and the island structures producing scattering became less efficient. For this reason, we observed that there is a greater contribution of scattering at low frequencies compared with high frequencies. A particularly interesting observation is the influence of marine sediments on seismic attenuation. In areas where the influence of volcanic structures is less significant, intrinsic attenuation is more relevant than scattering attenuation. Although this observation is common to many studies, we have observed this change in behaviour over a relatively small region and over short distances. Our results show that this area is not a large volcanic structural complex such as that of nearby Mt. Etna volcano, but rather it contains multiple dimensionally smaller and isolated volcanic structures with no apparent physical connection, at least in the subsurface portion (Ruch et al., 2016 postulate that Lipari and Vulcano belong to the same magmatic system). This confirms that the model used for the determination and separation of attenuation types is a very powerful tool for structural characterization based on the physical properties of the Earth’s crust. For seismic attenuation studies of small-dimension volcanic arcs, like the Aeolian Island, the detection of lateral small-scale attenuation contrasts improves geological interpretation, allowing us to separate consolidated marine structures from independent volcanic bodies. We believe that our findings will open up new research avenues for similar regions around the world.
Publicly available datasets were analyzed in this study. This data can be found here: https://geofon.gfz-potsdam.de/doi/network/1T/2014.
IC-M: Data analysis. This work forms a part of his PhD research. JP: Experimental planning and data analysis, and manuscript preparation. PhD co-advisor. AC: Revision of the manuscript and interpretation of the results. EP: Data analysis and quality checking of the results. JI: Coordinator of the research team, experimental planning, and manuscript preparation. PhD co-advisor.
This work was partially supported by the FEMALE project of the Spanish Government (Grant No. PID2019-106260GB-I00).
The authors declare that the research was conducted in the absence of any commercial or financial relationships that could be construed as a potential conflict of interest.
All claims expressed in this article are solely those of the authors and do not necessarily represent those of their affiliated organizations, or those of the publisher, the editors and the reviewers. Any product that may be evaluated in this article, or claim that may be made by its manufacturer, is not guaranteed or endorsed by the publisher.
We appreciate the time and effort dedicated to providing feedback and we are grateful for the insightful comments on and valuable improvements to our paper of the Associate Editor Dr. Gottsmann and two reviewers. English language editing was performed by Tornillo Scientific, United Kingdom.
Aki, K. (1980). Scattering and Attenuation of Shear Waves in the Lithosphere. J. Geophys. Res. 85 (B11), 6496–6504. doi:10.1029/jb085ib11p06496
Akinci, A., Pezzo, E., and Ibáñez, J. M. (1995). Separation of Scattering and Intrinsic Attenuation in Southern Spain and Western Anatolia (Turkey). Geophys. J. Int. 121 (2), 337–353. doi:10.1111/j.1365-246x.1995.tb05715.x
Alparone, S., Cardaci, C., Privitera, E., and Spampinato, S. (1998). Stress Tensor Computation at the Aeolian Islands Based on Earthquake Fault-Plane Solutions. Proc. Earthq. Fault Plane Solution, 92–95. Database. Derived Parameter. Geodyn. Inf.
Badi, G., Del Pezzo, E., Ibanez, J. M., Bianco, F., Sabbione, N., and Araujo, M. (2009). Depth Dependent Seismic Scattering Attenuation in the Nuevo Cuyo Region (Southern central Andes). Geophys. Res. Lett. 36 (24), 1–5. doi:10.1029/2009gl041081
Barreca, G., Bruno, V., Cultrera, F., Mattia, M., Monaco, C., and Scarfì, L. (2014). New Insights in the Geodynamics of the Lipari-Vulcano Area (Aeolian Archipelago, Southern Italy) from Geological, Geodetic and Seismological Data. J. Geodynamics 82, 150–167. doi:10.1016/j.jog.2014.07.003
Bueno, A., Benitez, C., De Angelis, S., Moreno, A. D., and Ibanez, J. M. (2019). Volcano-seismic Transfer Learning and Uncertainty Quantification with Bayesian Neural Networks. IEEE Trans. Geosci. Remote Sens 58 (2), 892–902. doi:10.1109/tgrs.2019.2941494
Bueno, A., Benítez, C., Zuccarello, L., De Angelis, S., and Ibáñez, J. M. (2021). End to End Bayesian Monitoring of Seismo Volcanic Dynamics. IEEE Trans. Geosci. Remote Sens. doi:10.1109/TGRS.2021.3076012
Carmona, E., Almendros, J., Alguacil, G., Soto, J. I., Luzón, F., and Ibáñez, J. M. (2015). Identification of T-Waves in the Alboran Sea. Pure Appl. Geophys. 172 (11), 3179–3188. doi:10.1007/s00024-014-1018-1
Castellano, M., Augusti, V., De Cesare, W., Favali, P., Frugoni, F., Montuori, C., et al. (2008). Seismic Tomography experiment at Italy's Stromboli Volcano. Eos Trans. AGU 89 (30), 269–270. doi:10.1029/2008eo300001
Castro-Melgar, I., Prudencio, J., Del Pezzo, E., Giampoccolo, E., and Ibáñez, J. M. (2021). Shallow Magma Storage beneath Mt. Etna: Evidences from New Attenuation Tomography and Existing Velocity Models. J. Geophy. Res. 126 (7), 1–18. doi:10.1029/2021JB022094
Chiarabba, C., De Gori, P., and Speranza, F. (2008). The Southern Tyrrhenian Subduction Zone: Deep Geometry, Magmatism and Plio-Pleistocene Evolution. Earth Planet. Sci. Lett. 268 (3–4), 408–423. doi:10.1016/j.epsl.2008.01.036
Chouet, B., De Luca, G., Milana, G., Dawson, P., Martini, M., and Scarpa, R. (1998). Shallow Velocity Structure of Stromboli Volcano, Italy, Derived from Small-Aperture Array Measurements of Strombolian Tremor. Bull. Seismol. Soc. Am. 88 (3), 653–666.
Coltelli, M., Cavallaro, D., Firetto Carlino, M., Cocchi, L., Muccini, F., D'Aessandro, A., et al. (2016). The marine Activities Performed within the TOMO-ETNA experiment. Ann. Geophys. 59 (4), 1–23. doi:10.4401/ag-7081
De Astis, G., Ventura, G., and Vilardo, G. (2003). Geodynamic Significance of the Aeolian Volcanism (Southern Tyrrhenian Sea, Italy) in Light of Structural, Seismological, and Geochemical Data. Tectonics 22 (4), 1–17. doi:10.1029/2003tc001506
De Luca, G., Filippi, L., Caccamo, D., Neri, G., and Scarpa, R. (1997). Crustal Structure and Seismicity of Southern Tyrrhenian basin. Phys. Earth Planet. Int 103 (1–2), 117–133. doi:10.1016/s0031-9201(97)00026-5
De Ritis, R., Ventura, G., Chiappini, M., Carluccio, R., and Von Frese, R. (2010). Regional Magnetic and Gravity Anomaly Correlations of the Southern Tyrrhenian Sea. Phys. Earth Planet. Int 181 (1–2), 27–41. doi:10.1016/j.pepi.2010.04.003
De Siena, L., Chiodini, G., Vilardo, G., Del Pezzo, E., Castellano, M., Colombelli, S., et al. (2017). Source and Dynamics of a Volcanic Caldera Unrest: Campi Flegrei, 1983-84. Sci. Rep. 7 (1), 8099–8113. doi:10.1038/s41598-017-08192-7
De Siena, L., Thomas, C., Waite, G. P., Moran, S. C., and Klemme, S. (2014). Attenuation and Scattering Tomography of the Deep Plumbing System of Mount St. Helens. J. Geophys. Res. Solid Earth 119 (11), 8223–8238. doi:10.1002/2014jb011372
Del Pezzo, E., De La Torre, A., Bianco, F., Ibáñez, J., Gabrielli, S., and De Siena, L. (2018). Numerically Calculated 3D Space-Weighting Functions to Image Crustal Volcanic Structures Using Diffuse Coda Waves. Geosciences 8 (5), 175. doi:10.3390/geosciences8050175
Del Pezzo, E., Ferulano, F., Giarrusso, A., and Martini, M. (1983). Seismic Coda Q and Scaling Law of the Source Spectra at the Aeolian Islands, Southern Italy. Bull. Seismol. Soc. Am. 73 (1), 97–108. doi:10.1785/bssa0730010097
Del Pezzo, E., Giampiccolo, E., Tuvè, T., Di Grazia, G., Gresta, S., and Ibàñez, J. M. (2019). Study of the Regional Pattern of Intrinsic and Scattering Seismic Attenuation in Eastern Sicily (Italy) from Local Earthquakes. Geophys. J. Int. 218 (2), 1456–1468. doi:10.1093/gji/ggz208
Del Pezzo, E., and Ibáñez, J. M. (2020). Seismic Coda-Waves Imaging Based on Sensitivity Kernels Calculated Using an Heuristic Approach. Geosciences 10 (8), 304. doi:10.3390/geosciences10080304
Del Pezzo, E., Ibáñez, J., Prudencio, J., Bianco, F., and De Siena, L. (2016). Absorption and Scattering 2-D Volcano Images from Numerically Calculated Space-Weighting Functions. Geophys. J. Int. 206 (2), 742–756. doi:10.1093/gji/ggw171
Del Pezzo, E., Luongo, G., and Scarpa, R. (1979). Seismic Wave Transmission in Southern Tyrrhenian Sea. Boll. Geofis. Teor. Appl. 21 (81), 53–66.
Díaz-Moreno, A., Barberi, G., Cocina, O., Koulakov, I., Scarfì, L., Zuccarello, L., et al. (2018). New Insights on Mt. Etna's Crust and Relationship with the Regional Tectonic Framework from Joint Active and Passive P-Wave Seismic Tomography. Surv. Geophys. 39 (1), 57–97. doi:10.1007/s10712-017-9425-3
Gabrielli, S., De Siena, L., Napolitano, F., and Del Pezzo, E. (2020). Understanding Seismic Path Biases and Magmatic Activity at Mount St Helens Volcano before its 2004 Eruption. Geophys. J. Int. 222 (1), 169–188. doi:10.1093/gji/ggaa154
Ganci, G., Cappello, A., Bilotta, G., and Del Negro, C. (2020). How the Variety of Satellite Remote Sensing Data over Volcanoes Can Assist hazard Monitoring Efforts: The 2011 Eruption of Nabro Volcano. Remote Sensing Environ. 236, 111426. doi:10.1016/j.rse.2019.111426
García, L., Álvarez, I., Benítez, C., Titos, M., Bueno, Á., Mota, S., et al. (2016). Advances on the Automatic Estimation of the P-Wave Onset Time. Ann. Geophys. 59 (4), 0434. doi:10.4401/ag-7087
García-Yeguas, A., Ibáñez, J. M., Koulakov, I., Jakovlev, A., Romero-Ruiz, M. C., and Prudencio, J. (2014). Seismic Tomography Model Reveals Mantle Magma Sources of Recent Volcanic Activity at El Hierro Island (Canary Islands, Spain). Geophys. J. Int. 199 (3), 1739–1750. doi:10.1093/gji/ggu339
García-Yeguas, A., Koulakov, I., Ibáñez, J. M., and Rietbrock, A. (2012). High Resolution 3D P Wave Velocity Structure beneath Tenerife Island (Canary Islands, Spain) Based on Tomographic Inversion of Active-Source Data. J. Geophys. Res. Solid Earth 117 (B9), 1–20. doi:10.1029/2011jb008970
Ghisetti, F. (1979). Relazioni tra strutture e fasi trascorrenti e distensive lungo i sistemi Messina-Fiumefreddo, Tindari-Letojanni e Alia-Malvagna (Sicilia nordorientale): uno studio microtettonico. Geol. Romana 18, 23–58.
Giampiccolo, E., Del Pezzo, E., Tuvé, T., Grazia, Di., and Ibáñez, G. J. M. (2021). 3-D Q-Coda Attenuation Structure at Mt. Etna (Italy). Geophys. J. Int. 227 (1), 544–558. doi:10.1093/gji/ggab235
Giordano, G., and De Astis, G. (2021). The Summer 2019 Basaltic Vulcanian Eruptions (Paroxysms) of Stromboli. Bull. Volcanol 83 (1), 1–27. doi:10.1007/s00445-020-01423-2
Giudicepietro, F., López, C., Macedonio, G., Alparone, S., Bianco, F., Calvari, S., et al. (2020). Geophysical Precursors of the July-August 2019 Paroxysmal Eruptive Phase and Their Implications for Stromboli Volcano (Italy) Monitoring. Sci. Rep. 10 (1), 10296–10316. doi:10.1038/s41598-020-67220-1
Gvirtzman, Z., and Nur, A. (2001). Residual Topography, Lithospheric Structure and Sunken Slabs in the central Mediterranean. Earth Planet. Sci. Lett. 187 (1–2), 117–130. doi:10.1016/s0012-821x(01)00272-2
Havskov, J., Peña, J. A., Ibáñez, J. M., Ottemöller, L., and Martı́nez-Arévalo, C. (2003). Magnitude Scales for Very Local Earthquakes. Application for Deception Island Volcano (Antarctica). J. Volcanol. Geotherm. Res. 128 (1–3), 115–133. doi:10.1016/s0377-0273(03)00250-6
Hoshiba, M. (1991). Simulation of Multiple-Scattered Coda Wave Excitation Based on the Energy Conservation Law, Phys. Earth Planet. Int. 67 (1–2), 123–136. doi:10.1016/0031-9201(91)90066-q
Ibáñez, J. M., Castro-Melgar, I., Cocina, O., Zuccarello, L., Branca, S., Del Pezzo, E., et al. (2020). First 2-D Intrinsic and Scattering Attenuation Images of Mt Etna Volcano and Surrounding Region from Active Seismic Data. Geophys. J. Int. 220 (1), 267–277. doi:10.1093/gji/ggz450
Ibáñez, J. M., Del Pezzo, E., De Miguel, F., Herraiz, M., Alguacil, G., and Morales, J. (1990). Depth-dependent Seismic Attenuation in the Granada Zone (Southern Spain). Bull. Seismol. Soc. Am. 80 (5), 1232–1244.
Ibáñez, J. M., Díaz-Moreno, A., Prudencio, J., Patené, D., Zuccarello, L., Cocina, O., et al. (2016b). TOMO-ETNA experiment at Etna Volcano: Activities on Land. Ann. Geophys. 59 (4), 1–23. doi:10.4401/ag-7080
Ibáñez, J. M., Lühr, B., and Dahm, T. (2014). TOMO-ETNA. GFZ Data Services. Other/Seismic Network. doi:10.14470/6G7569676919
Ibáñez, J. M., Prudencio, J., Díaz-Moreno, A., Patanè, D., Puglisi, G., Lühr, B. G., et al. (2016a). The TOMO-ETNA experiment: an Imaging Active Campaign at Mt. Etna Volcano. Context, Main Objectives, Working-Plans and Involved Research Projects. Ann. Geophys. 59 (4), 0426. doi:10.4401/ag-7079
Koulakov, I., and Shapiro, N. (2015). “Seismic Tomography of Volcanoes,” in Encyclopedia of Earthquake Engineering. Editors M. Beer, I.A. Kougioumtzoglou, E. Patelli, and S.K. Au (Heidelberg: Springer-Verlag Berlin), 51–1. doi:10.1007/978-3-642-36197-5
La Rocca, M., Petrosino, S., Saccorotti, G., Simini, M., Ibanez, J. M., Almendros, J., et al. (2000). Location of the Source and Shallow Velocity Model Deduced from the Explosion Quakes Recorded by Two Seismic Antennas at Stromboli Volcano. Phys. Chem. Earth A. Solid Earth Geod 25 (9–11), 731–735. doi:10.1016/s1464-1895(00)00113-7
Lanzafame, G., and Bousquet, J. C. (1997). The Maltese Escarpment and its Extension from Mt. Etna to Aeolian Islands (Sicily): Importance and Evolution of a Lithosphere Discontinuity. Acta Vulcanol 9, 113–120.
Linde, N., Baron, L., Ricci, T., Finizola, A., Revil, A., Muccini, F., et al. (2014). 3-D Density Structure and Geological Evolution of Stromboli Volcano (Aeolian Islands, Italy) Inferred from Land-Based and Sea-Surface Gravity Data. J. Volcanology Geothermal Res. 273, 58–69. doi:10.1016/j.jvolgeores.2014.01.006
Lucchi, F., Peccerillo, A., Keller, J., Tranne, C. A., and Rossi, P. L. (2013). The Aeolian Islands Volcanoes. London: Geological Society of London.:
Martínez, V. L., Titos, M., Benítez, C., Badi, G., Casas, J. A., Craig, V. H. O., et al. (2021). Advanced Signal Recognition Methods Applied to Seismo-Volcanic Events from Planchon Peteroa Volcanic Complex: Deep Neural Network Classifier. J. South Am. Earth Sci. 107, 103115. doi:10.1016/j.jsames.2020.103115
Milia, A., Iannace, P., Tesauro, M., and Torrente, M. M. (2018). Marsili and Cefalù Basins: The Evolution of a Rift System in the Southern Tyrrhenian Sea (Central Mediterranean). Glob. Planet. Change 171, 225–237. doi:10.1016/j.gloplacha.2017.12.003
Nishigami, K. y. (2000). Deep Crustal Heterogeneity along and Around the San Andreas Fault System in central California and its Relation to the Segmentation. J. Geophys. Res. 105 (B4), 7983–7998. doi:10.1029/1999jb900381
Palano, M., Ferranti, L., Monaco, C., Mattia, M., Aloisi, M., Bruno, V., et al. (2012). GPS Velocity and Strain fields in Sicily and Southern Calabria, Italy: Updated Geodetic Constraints on Tectonic Block Interaction in the central Mediterranean. J. Geophys. Res. Solid Earth 117 (B7). doi:10.1029/2012jb009254
Patanè, D., Barberi, G., De Gori, P., Cocina, O., Zuccarello, L., Garcia-Yeguas, A., et al. (2017). The Shallow Magma Chamber of Stromboli Volcano (Italy). Geophys. Res. Lett. 44 (13), 6589–6596. doi:10.1002/2017gl073008
Pepe, F., Bertotti, G., Cella, F., and Marsella, E. (2000). Rifted Margin Formation in the South Tyrrhenian Sea: A High-Resolution Seismic Profile across the north Sicily Passive continental Margin. Tectonics 19 (2), 241–257. doi:10.1029/1999tc900067
Pepe, F., Bertotti, G., and Cloetingh, S. (2004). Tectono-stratigraphic Modelling of the North Sicily continental Margin (Southern Tyrrhenian Sea). Tectonophysics 384 (1–4), 257–273. doi:10.1016/j.tecto.2004.04.002
Petrosino, S., Cusano, P., Saccorotti, G., and Del Pezzo, E. (2002). Seismic Attenuation and Shallow Velocity Structures at Stromboli Volcano, Italy. Bull. Seismological Soc. America 92 (3), 1102–1116. doi:10.1785/0120010147
Petrosino, S., La Rocca, M., and Del Pezzo, E. (1999). Shallow Velocity Model of the Northern Flank of Stromboli Volcano, Deduced by High Frequency Surface Wave Dispersion. J. Seismol 3 (1), 83–94. doi:10.1023/a:1009716203083
Pezzo, E. D. (2008). “Chapter 13 Seismic Wave Scattering in Volcanoes. “Seismic Wave Scattering in Volcanoes”,” in Earth Heterogeneity and Scattering Effects on Seismic Waves. Editor R. Dmowska (Elsevier), 50, 353–371. doi:10.1016/S0065-2687(08)00013-7
Pontevivo, A., and Panza, G. F. (2006). The Lithosphere-Asthenosphere System in the Calabrian Arc and Surrounding Seas - Southern Italy. Pure Appl. Geophys. 163 (8), 1617–1659. doi:10.1007/s00024-006-0093-3
Prudencio, J., Aoki, Y., Takeo, M., Ibáñez, J. M., Del Pezzo, E., and Song, W. (2017a). Separation of Scattering and Intrinsic Attenuation at Asama Volcano (Japan): Evidence of High Volcanic Structural Contrasts. J. Volcanology Geothermal Res. 333-334, 96–103. doi:10.1016/j.jvolgeores.2017.01.014
Prudencio, J., De Siena, L., Ibáñez, J. M., Del Pezzo, E., García-Yeguas, A., and Díaz-Moreno, A. (2015a). The 3D Attenuation Structure of Deception Island (Antarctica). Surv. Geophys. 36 (3), 371–390. doi:10.1007/s10712-015-9322-6
Prudencio, J., Del Pezzo, E., García-Yeguas, A., and Ibáñez, J. M. (2013a). Spatial Distribution of Intrinsic and Scattering Seismic Attenuation in Active Volcanic Islands - I: Model and the Case of Tenerife Island. Geophys. J. Int. 195 (3), 1942–1956. doi:10.1093/gji/ggt361
Prudencio, J., Del Pezzo, E., Ibáñez, J. M., Giampiccolo, E., and Patané, D. (2015c). Two‐dimensional Seismic Attenuation Images of Stromboli Island Using Active Data. Geophys. Res. Lett. 42 (6), 1717–1724. doi:10.1002/2015gl063293
Prudencio, J., Ibáñez, J. M., Del Pezzo, E., Martí, J., García-Yeguas, A., and De Siena, L. (2015b). 3D Attenuation Tomography of the Volcanic Island of Tenerife (Canary Islands). Surv. Geophys. 36 (5), 693–716. doi:10.1007/s10712-015-9333-3
Prudencio, J., Ibáñez, J. M., García-Yeguas, A., Del Pezzo, E., and Posadas, A. M. (2013b). Spatial Distribution of Intrinsic and Scattering Seismic Attenuation in Active Volcanic Islands - II: Deception Island Images. Geophys. J. Int. 195 (3), 1957–1969. doi:10.1093/gji/ggt360
Prudencio, J., and Manga, M. (2020). 3-D Seismic Attenuation Structure of Long Valley Caldera: Looking for Melt Bodies in the Shallow Crust. Geophys. J. Int. 220 (3), 1677–1686. doi:10.1093/gji/ggz543
Prudencio, J., Manga, M., and Taira, T. (2018). Subsurface Structure of Long Valley Caldera Imaged with Seismic Scattering and Intrinsic Attenuation. J. Geophys. Res. Solid Earth 123 (7), 5987–5999. doi:10.1029/2017jb014986
Prudencio, J., Taira, T., Aoki, Y., Aoyama, H., and Onizawa, S. (2017b). Intrinsic and Scattering Attenuation Images of Usu Volcano, Japan. Bull. Volcanol 79 (4), 29. doi:10.1007/s00445-017-1117-9
Rawlinson, N., Pozgay, S., and Fishwick, S. (2010). Seismic Tomography: a Window into Deep Earth. Phys. Earth Planet. Int 178 (3–4), 101–135. doi:10.1016/j.pepi.2009.10.002
Romagnoli, C., Casalbore, D., Bortoluzzi, G., Bosman, A., Chiocci, F. L., D’Oriano, F., et al. (2013). Chapter 4 Bathy-Morphological Setting of the Aeolian Islands. Geol. Soc. Lond. Mem. 37 (1), 27–36. doi:10.1144/m37.4
Rosi, M., Pistolesi, M., Bertagnini, A., Landi, P., Pompilio, M., and Di Roberto, A. (2013). Chapter 14 Stromboli Volcano, Aeolian Islands (Italy): Present Eruptive Activity and Hazards. Geol. Soc. Lond. Mem. 37 (1), 473–490. doi:10.1144/m37.14
Ruch, J., Vezzoli, L., De Rosa, R., Di Lorenzo, R., and Acocella, V. (2016). Magmatic Control along a Strike-Slip Volcanic Arc: The central Aeolian Arc (Italy). Tectonics 35 (2), 407–424. doi:10.1002/2015tc004060
Saccorotti, G., and Lokmer, I. (2021). A Review of Seismic Methods for Monitoring and Understanding Active Volcanoes. Forecast. Plan. Volcanic Hazard. Risks Disaster, 25–73. doi:10.1016/b978-0-12-818082-2.00002-0
Sanborn, C. J., and Cormier, V. F. (2018). Modelling the Blockage of Lg Waves from Three-Dimensional Variations in Crustal Structure. Geophys. J. Int. 214 (20), 1426–1440. doi:10.1093/gji/ggy206
Sato, H., Fehler, M., and Maeda, T. (2012). Seismic Wave Propagation and Scattering in Heterogeneous Earth. 2nd edn. Springer.
Selva, J., Bonadonna, C., Branca, S., De Astis, G., Gambino, S., Paonita, A., et al. (2020). Multiple Hazards and Paths to Eruptions: A Review of the Volcanic System of Volcano. Aeolian Islands, Italy: Earth Sci. Rev, 103186.
Selvaggi, G., and Chiarabba, C. (1995). Seismicity and P-Wave Velocity Image of the Southern Tyrrhenian Subduction Zone. Geophys. J. Int. 121 (3), 818–826. doi:10.1111/j.1365-246x.1995.tb06441.x
Shalev, E., Kenedi, C. L., Malin, P., Voight, V., Miller, V., Hidayat, D., et al. (2010). Three-dimensional Seismic Velocity Tomography of Montserrat from the SEA-CALIPSO Offshore/onshore experiment. Geophys. Res. Lett. 37 (19), 1–6. doi:10.1029/2010gl042498
Tarquini, S., Isola, I., Favalli, M., and Battistini, A. (2007). TINITALY, a Digital Elevation Model of Italy with a 10 M-Cell Size. Version 1.0. Rome: Istituto Nazionale di Geofisica e Vulcanologia (INGV). Data set. doi:10.13127/TINITALY/1.0
Titos, M., Bueno, A., García, L., Benítez, M. C., and Ibañez, J. (2018). Detection and Classification of Continuous Volcano-Seismic Signals with Recurrent Neural Networks. IEEE Trans. Geosci. Remote Sens 57 (4), 1936–1948. doi:10.1109/tgrs.2018.2870202
Ventura, G. (2013). Chapter 2 Kinematics of the Aeolian Volcanism (Southern Tyrrhenian Sea) from Geophysical and Geological Data. Geol. Soc. Lond. Mem. 37 (1), 3–11. doi:10.1144/m37.2
Ventura, G., Vilardo, G., Milano, G., and Pino, N. A. (1999). Relationships Among Crustal Structure, Volcanism and Strike–Slip Tectonics in the Lipari–Vulcano Volcanic Complex (Aeolian Islands, Southern Tyrrhenian Sea, Italy). Phys. Earth Planet. Int 116 (1–4), 31–52. doi:10.1016/s0031-9201(99)00117-x
Viccaro, M., Cannata, A., Cannavò, F., De Rosa, R., Giuffrida, M., Nicotra, E., et al. (2021). Shallow Conduit Dynamics Fuel the Unexpected Paroxysms of Stromboli Volcano during the Summer 2019. Sci. Rep. 11 (1), 266–315. doi:10.1038/s41598-020-79558-7
Voight, B., Sparks, R. S. J., Shalev, E., Minshull, T., Paulatto, M., Annen, C., et al. (2014). Chapter 15 the SEA-CALIPSO Volcano Imaging experiment at Montserrat: Plans, Campaigns at Sea and on Land, Scientific Results, and Lessons Learned. Geol. Soc. Lond. Mem. 39 (1), 253–289. doi:10.1144/m39.15
Wegler, U., and Lühr, B.-G. (2001). Scattering Behaviour at Merapi Volcano (Java) Revealed from an Active Seismic experiment. Geophys. J. Int. 145 (3), 579–592. doi:10.1046/j.1365-246x.2001.01390.x
Wu, R. (1985). Multiple Scattering and Energy Transfer of Seismic Waves—Separation of Scattering Effect from Intrinsic Attenuation — I. Theoretical Modelling. Geophys. J. R. Astr. Sci. 82 (1), 57–80. doi:10.1111/j.1365-246X.1985.tb05128.x
Yoshimoto, K. (2000). Monte Carlo Simulation of Seismogram Envelopes in Scattering media. J. Geophys. Res. 105 (B3), 6153–6161. doi:10.1029/1999jb900437
Zandomeneghi, D., Almendros, J., Ibáñez, J. M., and Saccorotti, G. (2008). Seismic Tomography of Central São Miguel, Azores. Phys. Earth Planet. Int 167 (1–2), 8–18. doi:10.1016/j.pepi.2008.02.005
Zandomeneghi, D., Barclay, A., Almendros, J., Ibañez, J. M., Wilcock, W. S., and Ben-Zvi, T. (2009). Crustal Structure of Deception Island Volcano from P Wave Seismic Tomography: Tectonic and Volcanic Implications. J. Geophys. Res. Solid Earth 114 (B6), 1–16. doi:10.1029/2008jb006119
Keywords: seismic attenuation, seismic active experiment, Aeolian islands, scattering, intrinsic attenuation scattering and intrinsic attenuation at Aeolian islands
Citation: Castro-Melgar I, Prudencio J, Cannata A, Del Pezzo E and Ibáñez JM (2021) Small-Scale Volcanic Structures of the Aeolian Volcanic Arc Revealed by Seismic Attenuation. Front. Earth Sci. 9:725402. doi: 10.3389/feart.2021.725402
Received: 15 June 2021; Accepted: 09 September 2021;
Published: 23 September 2021.
Edited by:
Jo Gottsmann, University of Bristol, United KingdomReviewed by:
Patrick J. Smith, Dublin Institute for Advanced Studies (DIAS), IrelandCopyright © 2021 Castro-Melgar, Prudencio, Cannata, Del Pezzo and Ibáñez. This is an open-access article distributed under the terms of the Creative Commons Attribution License (CC BY). The use, distribution or reproduction in other forums is permitted, provided the original author(s) and the copyright owner(s) are credited and that the original publication in this journal is cited, in accordance with accepted academic practice. No use, distribution or reproduction is permitted which does not comply with these terms.
*Correspondence: Jesús M. Ibáñez, amliYW5lekB1Z3IuZXM=
Disclaimer: All claims expressed in this article are solely those of the authors and do not necessarily represent those of their affiliated organizations, or those of the publisher, the editors and the reviewers. Any product that may be evaluated in this article or claim that may be made by its manufacturer is not guaranteed or endorsed by the publisher.
Research integrity at Frontiers
Learn more about the work of our research integrity team to safeguard the quality of each article we publish.