 Jana Krause1
 Mark J. Hopwood1,2*
 Juan Höfer3,4
 Stephan Krisch1
 Eric P. Achterberg1
 Emilio Alarcón4,5
 Dustin Carroll6
 Humberto E. González4,7
 Thomas Juul-Pedersen8
 Te Liu1
 Pablo Lodeiro9
 Lorenz Meire8,10Minik T. Rosing11
- 1Marine Biogeochemistry, GEOMAR Helmholtz Centre for Ocean Research Kiel, Kiel, Germany
- 2Department of Ocean Science and Engineering, Southern University of Science and Technology, Shenzhen, China
- 3Escuela de Ciencias del Mar, Pontificia Universidad Católica de Valparaíso, Valparaíso, Chile
- 4Centro FONDAP de Investigación en Dinámica de Ecosistemas Marinos de Altas Latitudes (IDEAL), Valdivia, Chile
- 5Centro de Investigación en Ecosistemas de la Patagonia (CIEP), Coyhaique, Chile
- 6Moss Landing Marine Laboratories, San José State University, Moss Landing, CA, United States
- 7Instituto de Ciencias Marinas y Limnológicas, Universidad Austral de Chile, Valdivia, Chile
- 8Greenland Climate Research Centre, Greenland Institute of Natural Resources, Nuuk, Greenland
- 9Department of Chemistry, University of Lleida – AGROTECNIO-CERCA Centre, Lleida, Spain
- 10Department of Estuarine and Delta Systems, Royal Netherlands Institute for Sea Research, Yerseke, Netherlands
- 11Globe Institute, University of Copenhagen, Copenhagen, Denmark
Around the Greenlandic and Antarctic coastlines, sediment plumes associated with glaciers are significant sources of lithogenic material to the ocean. These plumes contain elevated concentrations of a range of trace metals, especially in particle bound phases, but it is not clear how these particles affect dissolved (<0.2 µm) metal distributions in the ocean. Here we show, using transects in 8 glacier fjords, trends in the distribution of dissolved iron, cobalt, nickel and copper (dFe, dCo, dNi, dCu). Following rapid dFe loss close to glacier outflows, dFe concentrations in particular showed strong similarities between different fjords. Similar dFe concentrations were also observed between seasons/years when Nuup Kangerlua (SW Greenland) was revisited in spring, mid- and late-summer. Dissolved Cu, dCo and dNi concentrations were more variable and showed different gradients with salinity depending on the fjord, season and year. The lack of consistent trends for dCu and dNi largely reflects less pronounced differences contrasting the concentration of inflowing shelf waters with fresher glacially-modified waters. Particles also made only small contributions to total dissolvable Cu (dCu constituted 83 ± 28% of total dissolvable Cu) and Ni (dNi constituted 86 ± 28% of total dissolvable Ni) within glacier plumes. For comparison, dFe was a lower fraction of total dissolvable Fe; 3.5 ± 4.8%. High concentrations of total dissolvable Fe in some inner-fjord environments, up to 77 µM in Ameralik (SW Greenland), may drive enhanced removal of scavenged type elements, such as Co. Further variability may have been driven by local bedrock mineralogy, which could explain high concentrations of dNi (25–29 nM) and dCo (6–7 nM) in one coastal region of west Greenland (Kangaatsiaq). Our results suggest that dissolved trace element distributions in glacier fjords are influenced by a range of factors including: freshwater concentrations, local geology, drawdown by scavenging and primary production, saline inflow, and sediment dynamics. Considering the lack of apparent seasonality in dFe concentrations, we suggest that fluxes of some trace elements may scale proportionately to fjord overturning rather than directly to freshwater discharge flux.
Introduction
Trace metals such as iron (Fe), cobalt (Co), nickel (Ni), and copper (Cu) are essential micronutrients for phytoplankton (Twining and Baines, 2013). Their chemical speciation and availability in aquatic systems may affect primary production and ecosystem functioning (Coale, 1991; Downs et al., 2008; Tagliabue et al., 2017). The low solubility of inorganic Fe species in sea water (Liu and Millero, 2002), combined with the high cellular demand for Fe as an essential component of photosystems I and II, and nitrogenase enzymes (Raven et al., 1999; Whittaker et al., 2011), means that primary production across a significant part of the ocean is (co)limited by Fe availability (Martin and Fitzwater, 1988; Martin et al., 1990). Whilst Fe-limitation of marine primary production is widely observed, dissolved Co concentrations are also deficient with respect to phytoplankton requirements across much of the surface ocean (Moore et al., 2013). Varying degrees of (co-)limitation of marine primary production by Co have been experimentally demonstrated (Saito et al., 2005; Browning et al., 2017). Furthermore, the stoichiometry of micronutrient availability may have effects on microbial community composition, carbon export and N2-fixation even under conditions where dissolved metal concentrations are replete with respect to mean microbial cellular quotas (Moore et al., 2009; Twining and Baines, 2013; Browning et al., 2019).
Around the coastal periphery of the Arctic and Antarctic, glaciers, icebergs and freshwater runoff are significant sources of lithogenic material into the ocean (Azetsu-Scott and Syvitski, 1999; Shaw et al., 2011; Overeem et al., 2017). Whilst runoff has generally low concentrations of macronutrients (Meire et al., 2016a), it contains relatively high concentrations of particulate and some dissolved trace metals (Statham et al., 2008; Annett et al., 2017; Hawkings et al., 2020). The associated metals can enter the ocean either in suspension, solution, or via atmospheric deposition of glacier-derived aerosols (Cowan and Powell, 1990; Prospero et al., 2012; Raiswell and Canfield, 2012). Due to interest in Fe-fertilization that arises around parts of the Antarctic coastline (Alderkamp et al., 2012; Gerringa et al., 2012), the total supply of particulate Fe from such glacier associated sources is moderately well constrained (Raiswell and Canfield, 2012). Yet phytoplankton primarily take up Fe from the dissolved phase (Shaked and Lis, 2012; Lis et al., 2015). The factors that control exchange of Fe, and other trace elements, between glacier-derived particulate and dissolved phases (Lippiatt et al., 2010; Thuroczy et al., 2012; Ardiningsih et al., 2020) and how such exchanges are moderated by physical and chemical processes around the ice sheet peripheries, are less well understood (Sherrell et al., 2015; Annett et al., 2017; St-Laurent et al., 2017). These coastal dynamics may contribute to regional differences in dissolved trace metal availability in the marine environment (Marsay et al., 2017; Dinniman et al., 2020; Duprat et al., 2020).
Glacier fjords, which represent the interface between the cryosphere and ocean around much of Greenland and the Antarctic Peninsula, represent key transition zones where water mass transformations, biological activity, benthic processes, and intense sedimentation impact the lateral and vertical exchange of nutrients (Wehrmann et al., 2013; Cape et al., 2018; Pan et al., 2020). Beyond scarce data for Fe and manganese (e.g., Annett et al., 2015; Crusius et al., 2017; Monien et al., 2017; Sherrell et al., 2018; Kanna et al., 2020), and some trace metal observations in freshwater proglacial and subglacial environments (Aciego et al., 2015; Hodson et al., 2017; Hawkings et al., 2020), there is very limited knowledge of what controls the distribution of dissolved trace metals downstream of the plumes emerging along glaciated coastlines (Dierssen et al., 2002; Markussen et al., 2016; Kanna et al., 2020). Understanding the biogeochemical transformations of trace metals across these interfaces is important for constraining the effects of time-dependent freshwater discharge in marine environments (Cauvy-Fraunié and Dangles, 2019; Holmes et al., 2019; Meredith et al., 2019). This is particularly the case for non-conservative trace elements, such as Fe, where the strong gradients in temperature, salinity, and turbidity in glacier fjords can substantially moderate dissolved fluxes (Schroth et al., 2014; Zhang et al., 2015; Kanna et al., 2020).
The multiple spatially overlapping sources/sinks of trace elements in dynamic glacier fjord systems make it challenging to determine the importance of different processes that impact trace metal availability. Here we conduct a process study to investigate trace metal dynamics across the salinity gradient in a series of glacier fjords. In addition to contrasting the behaviour of select trace elements (Fe, Co, Ni and Cu) in multiple fjords close to the peak of the annual meltwater season. We also include repeat sections of Nuup Kangerlua and Ameralik (SW Greenland) in order to gain insight into seasonal variability. We contrast the distribution of the macronutrients nitrate, phosphate, and silicic acid; with the micronutrients dissolved Fe, Co, Cu, and Ni.
Methods
Trace Metal Sampling
Along-fjord transects were conducted in both Antarctica and Greenland (Table 1; Figure 1). Fjord transects in W Greenland and spring cruises in SW Greenland on RV Sanna used a towfish system to provide an underway trace metal clean water supply. A custom made towfish device was mounted on a winch at ∼1 m depth ∼2 m away from the ship when underway. Water was pumped continuously through tubing which was pre-cleaned with 0.1 M HCl (reagent grade), with the suction provided by a Teflon diaphragm pump (Dellmeco, Germany, DM15). This continuous seawater supply was sampled inside a laminar flow hood. On RV Polarstern during GEOTRACES cruise PS100/GN05 in Fram Strait, near-surface samples (<10 m depth) were collected from Go-Flo samplers (Ocean Test Equipment) mounted on an epoxy-coated, trace metal clean rosette (Seabird, see Krisch et al., 2021). In other fjords, sampling from small rigid inflatable vessels was conducted from surface waters using acid cleaned 1 L high-density polyethylene bottles deployed upwind of the boat, which were rinsed once and then filled and sub-sampled.
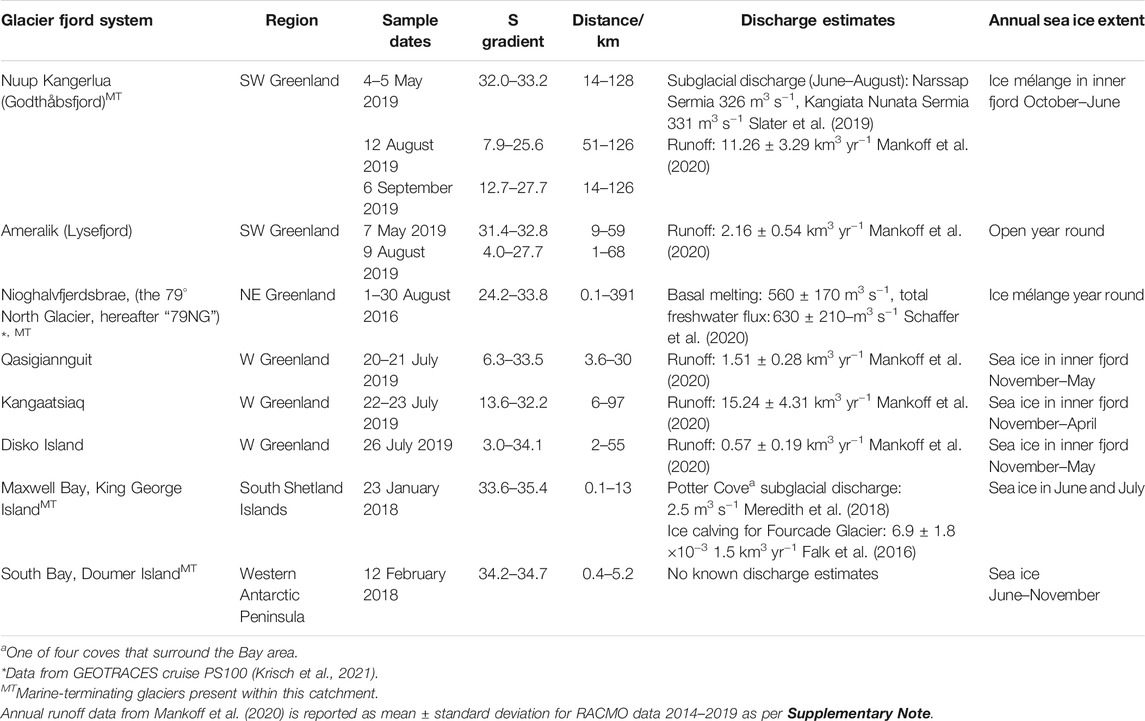
TABLE 1. Sample collection details for glacier fjord transects. Salinity (S) gradient refers to surface (<10 m depth) waters. The section length is shown as the approximate range of distances from the main glacier terminus/outflow along sampled transects.
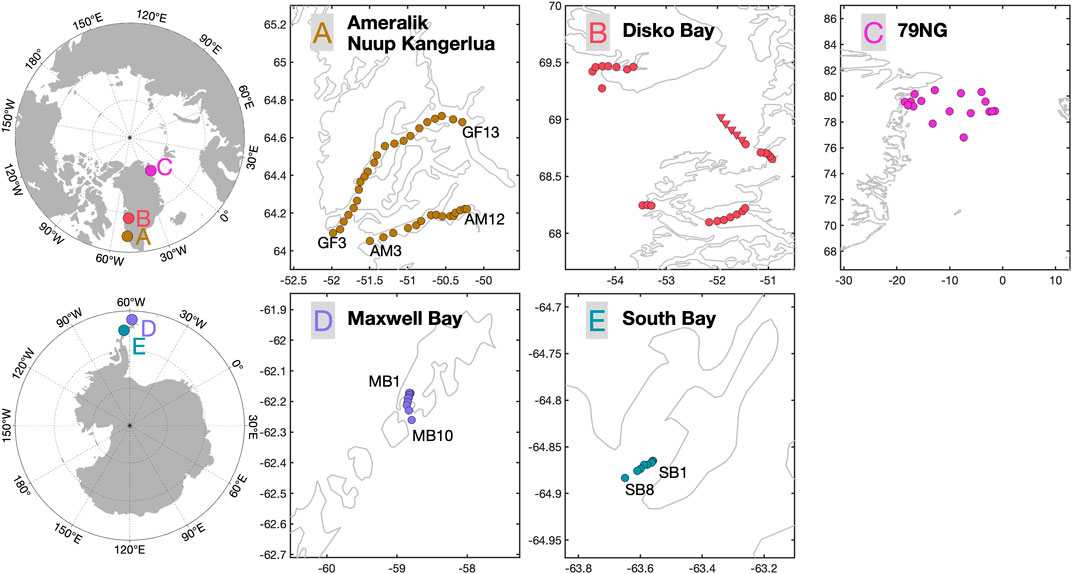
FIGURE 1. Field locations and sample collection points. For consistency with prior and future work, the sample location labels in Nuup Kangerlua (also known as Godthåbsfjord), Ameralik, Maxwell Bay and South Bay (GFx, AMx, MBx and SBx respectively) refer to standard locations regularly visited by the ongoing long-term Greenland Ecosystem Monitoring (GEM, 2021) and Centro de Investigación Dinámica de Ecosistemas Marinos de Altas Latitudes (IDEAL) projects. In addition to the fjord stations (red circles) sampled in three Disko Bay fjords [(B), clockwise from NW: Disko Island, Qasigiannguit, and Kangaatsiaq], a series of mid-Bay samples were also collected [(B), red triangles]. Nioghalvfjerdsbrae [(C), the 79° North Glacier], is referred to throughout as “79NG”.
Trace Element Analysis
Trace metal clean low-density polyethylene (LDPE, Nalgene) bottles were prepared via a three-stage washing procedure (1 day in Mucasol detergent, 1 week in reagent grade 1.2 M HCl, and 1 week in reagent grade 1.2 M HNO3) and then stored empty and double bagged in LDPE bags until use. Total dissolvable (Td) trace metal samples were collected without filtration in trace metal clean 125 ml LDPE bottles. Dissolved trace element samples, defined operationally as is convention at <0.2 µm, were syringe filtered (Millipore, 0.2 µm, polyvinyl difluoride), or filtered inline from the towfish system (AcroPak, 0.8/0.2 µm, polyethersulfone), into trace metal clean 125 ml LDPE bottles. Syringe filters were precleaned with 1 M laboratory grade HCl then de-ionized water. All samples were then acidified to pH 1.9 by the addition of concentrated HCl (180 μl, UpA grade, Romil) within 1 day of sample collection and stored for >6 months prior to analysis.
Total dissolvable samples were then filtered to remove any suspended particles (Millipore, 0.2 µm, polyvinyl difluoride), diluted using 1 M distilled HNO3 (SpA grade, Romil, distilled using a sub-boiling PFA distillation system, DST-1000, Savillex) and subsequently analyzed by high resolution inductively coupled plasma-mass spectrometry (ICP-MS, ELEMENT XR, ThermoFisherScientific) with calibration by standard addition. Dissolved samples were preconcentrated offline using a seaFAST pre-concentration system and then analysed via ICP-MS exactly as per Rapp et al. (2017) with calibration via standard addition for Co, and isotope dilution for Fe, Ni, and Cu. Measured concentrations are reported throughout as nmol L−1. To verify the accuracy of trace element measurements reference materials were analysed alongside samples (Supplementary Table S1). Coastal concentrations for other sections of the Greenland shelf were obtained from cruises GEOVIDE (stations 53, 56,60, 61 and 63; Tonnard et al., 2020), D354 (profiles 10–14; Achterberg et al., 2018; Achterberg et al., 2020) and PS100 (east of 15°W, as per Figure 1, Krisch et al., 2021) with sample handling, analysis and quality control following GEOTRACES protocols (Cutter and Bruland, 2012).
Macronutrients
Dissolved macronutrient concentrations [nitrate + nitrite, NOx; phosphate, PO4; and silicic acid, Si(OH)4] were syringe filtered (Millipore, 0.2 µm, polyvinyl difluoride) and stored refrigerated in the dark until analysis. Samples from transects that could not be analysed within 2 days were frozen (-20°C). Macronutrient concentrations were measured via a Quaatro 39 System (SEAL) segmented flow analyser with a XY2 Autosampler (Hansen and Koroleff, 1999). Detection limits, defined as three standard deviations of blank (deionized water) measurements, varied between batches yet were consistently <0.10 µM PO4, <0.10 µM NOx and <0.25 µM Si(OH)4 with precision (defined as one standard deviation of triplicate samples) of 2.0% PO4, 3.1% NOx and 0.5% Si(OH)4.
Physical Data
Where possible, sampling was coordinated to occur alongside CTD (conductivity, temperature, and depth) profiles, with salinity, temperature, and other parameters at 1 m depth reported alongside trace metal data. When/where CTD profiles were not taken in close coordination with surface sampling, a handheld LF 325 conductivity meter (WTW) was used to record in situ temperature and salinity.
Subglacial Discharge Plume Evaluation
The effect of subglacial discharge on fjord-scale macronutrient dynamics has been characterised in multiple glacier fjords (Meire et al., 2016a; Cape et al., 2018; Kanna et al., 2018). We investigate to what extent a similar mixing process could impact observed surface trace metal distributions. Data were compiled describing metal distributions on the Greenland shelf and in freshwater to produce a mean shelf profile and freshwater concentration (Supplementary Tables S2, S3). Shelf data was grouped into 50 m vertical bins. Bin-averaged profiles were then interpolated onto a 1 m vertical resolution grid to set the plume model initial condition. Direct sampling of zero salinity subglacial discharge near large marine-terminating glacier fronts is practically impossible and so some assumptions must be made. We initially assume that freshwater dissolved trace metal concentrations measured in proglacial environments at the few reported sites around Greenland are comparable to those expected in discharge released from large marine-terminating glaciers. Depth profiles from 3 cruises (GEOVIDE in south Greenland, D354 in east Greenland, and PS100 in north-east Greenland, Sarthou et al., 2018; Achterberg et al., 2020; Krisch et al., 2020) and freshwater concentrations from 4 broad regions (Supplementary Table S2) were available for dFe, dNi, and dCu (Statham et al., 2008; Bhatia et al., 2013; Aciego et al., 2015; Hawkings et al., 2020). For dCo insufficient data coverage means that uncertainties cannot be evaluated.
A steady-state plume model is used to characterize subglacial discharge plumes rising along a melting, vertical glacier terminus. The governing equations are defined by plume theory (Morton et al., 1956; Jenkins, 2011; Carroll et al., 2015) and previously demonstrated to approximately represent the mixing of macronutrients downstream of large Greenlandic outflows (Cape et al., 2018; Oliver et al., 2020). The model formulation represents a half-conical plume forced by a point source of subglacial discharge (Eqs 1–3). Initial plume temperature and salinity are set to the pressure-salinity-dependent melting point and 0, respectively; all model parameters are as described previously (Cowton et al., 2015; Carroll et al., 2016). To simulate the flux of meltwater into the subglacial discharge plume from glacier terminus melt, a three-equation model is solved Holland and Jenkins (1999) describing conservation of heat and salt at the ocean-ice boundary, combined with a liquidus constraint at the interface:
b is the plume radius and α is the entrainment constant (set to 0.1). Subscripts of s represent concentrations in seawater and subscripts of m represent concentrations in submarine glacier terminus melt. As there is presently insufficient data to distinguish concentrations of dissolved trace metals in runoff and submarine ice melt, we assume approximate equivalence between these concentrations, although recognise that the later may be lower due to a lesser extent of bedrock interaction (e.g., silicic acid concentrations in runoff may be ∼10 times higher than in melted ice samples, Meire et al., 2016a). This does not materially affect the calculated fluxes for the scenarios, as submarine melt contributes <1% to concentrations in the plume for all cases herein.
Statistical Analysis of Transects
In order to compare and contrast metal distributions in different geographical contexts, an additional distance factor was computed for each sampled location. A lateral distance to the most terrestrially influenced point within each studied region was determined from satellite imagery. The coordinates for 0 km represent either the centre-point of the most relevant terminus/glacier fed river at the coastline or, where no such single feature is evident, the innermost point in the fjord. The relationships among dissolved metal concentrations, macronutrients, salinity and lateral distance were analysed by means of a Redundancy Analysis (RDA). RDA is a constrained ordination procedure which consists of a multiresponse, multiple linear regression followed by a principal component analysis (see Borcard et al., 2011). The RDA function (package vegan) within R version 4.0.2 was used to perform the RDA (R Core Team, 2012; Oksanen et al., 2020), while site scores were calculated as the weighted sum of species. RDA overall significance and the significance of RDA axes was assessed by a permutation test (10,000 iterations) using the anova.cca function (vegan package) to avoid the problems caused by non-normal distributions (Borcard et al., 2011).
As 2014 dFe data from Nuup Kangerlua is also available (Hopwood et al., 2016), seasonal and interannual changes in dFe within this fjord were studied using General Additive Models (GAMs) (Hastie and Tibshirani, 2014). GAMs are able to portray smooth changes in the effects of their predictors, which is advantageous for representing non-linear effects such as the typical behaviour of dFe across salinity gradients (Boyle et al., 1977). GAMs were generated using the gam function from the mgcv package (Wood, 2011). Non-linear effects of the predictors were minimized by reducing the generalized cross-validation score and thus the complexity of the smoothing. A series of GAMs was generated within R in order to assess if dFe distribution was better predicted by the salinity gradient, lateral distance or a combination of both variables. Simultaneously, a possible seasonal or interannual effect was tested by generating GAMs including a temporal factor. Using the Akaike Information Criterion (AIC) to select the best fitting and most parsimonious model (i.e., Model Selection) we were able to discern which variable was driving dFe patterns and whether or not a temporal variation affected these patterns (Supplementary Table S5).
Results
Overview of Conditions Between Glacier Fjords
We present 131 datapoints (Supplementary Data) with combined micro- and macronutrient concentrations from 5 geographic regions (Figure 1). The transects conducted herein were designed to target areas receiving the most intense glacier discharge. Transects were conducted in a variety of catchments with contrasting glacier and fjord dynamics, such as the presence of land-terminating or marine-terminating glaciers, submarine sills, and sea ice seasonality (Table 1). Nuup Kangerlua hosts both land- and marine-terminating glaciers. Ameralik, and the three Disko Bay systems receive runoff from only land-terminating glaciers. Nioghalvfjerdsfjorden hosts only a marine-terminating glacier with a large floating ice tongue. Maxwell Bay and South Bay both sit adjacent to small ice caps with numerous small outflows. In addition to the contrasting positions of glacier fronts with respect to sea level, the fractional importance of different freshwater sources varies between sites. Nioghalvfjerdsbrae is unusual compared to the other systems herein in that a majority of freshwater is derived from basal ice melt from a floating ice tongue (Schaffer et al., 2020). For Nuup Kangerlua, in addition to runoff, a substantial fraction of ice calved into the fjord, ∼70%, melts along the fjord, mainly in the inner-fjord (Bendtsen et al., 2015; Mortensen et al., 2020). Furthermore, all the west Greenlandic sites studied herein additionally receive runoff from non-glacial sources.
The salinity gradients observed reflect different discharge rates and residence times of freshwater within these regions (Table 1). Greenlandic fjords, which are generally far longer and receive much higher discharge than their Antarctic counterparts (Straneo and Cenedese, 2015; Mankoff et al., 2020), have much more pronounced salinity gradients which occur over larger spatial scales (Table 1). Whilst estimates for annual runoff, ice calving, and subglacial discharge rate are only available for some catchments (the larger Greenlandic case studies), it is evident from the limited available data that the two Antarctic sites are subject to very low freshwater inputs by comparison. Temporally, it should also be noted that the higher latitude systems experience sea ice cover for a large fraction of the year and thus summertime transects occurred in closer proximity to sea ice breakup than at lower latitude sites (Table 1).
Micronutrient Distributions
Trace metals showed varying relationships with salinity when data from all catchments (n = 131 datapoints) were considered collectively (Figure 2). The distribution of dCo and dNi across all sites would be relatively linear were it not for a cluster of high concentration data points at salinities 15–20, all of which are from Kangaatsiaq [see Unique Features in the Disko Bay Region (Qasigiannguit, Kangaatsiaq and Disko Fjord)]. The distribution of dCu showed a distinct arch suggesting that its distribution cannot be explained only by mixing between fresh and saline endmembers. Dissolved Fe shows a sharp decline in dFe concentration at low salinities, which is observed across most, if not all, estuarine gradients (Boyle et al., 1977) and is well described in other glaciated regions (Schroth et al., 2014; Zhang et al., 2015; Kanna et al., 2020), followed by more linear behaviour at higher salinities (Figure 2).
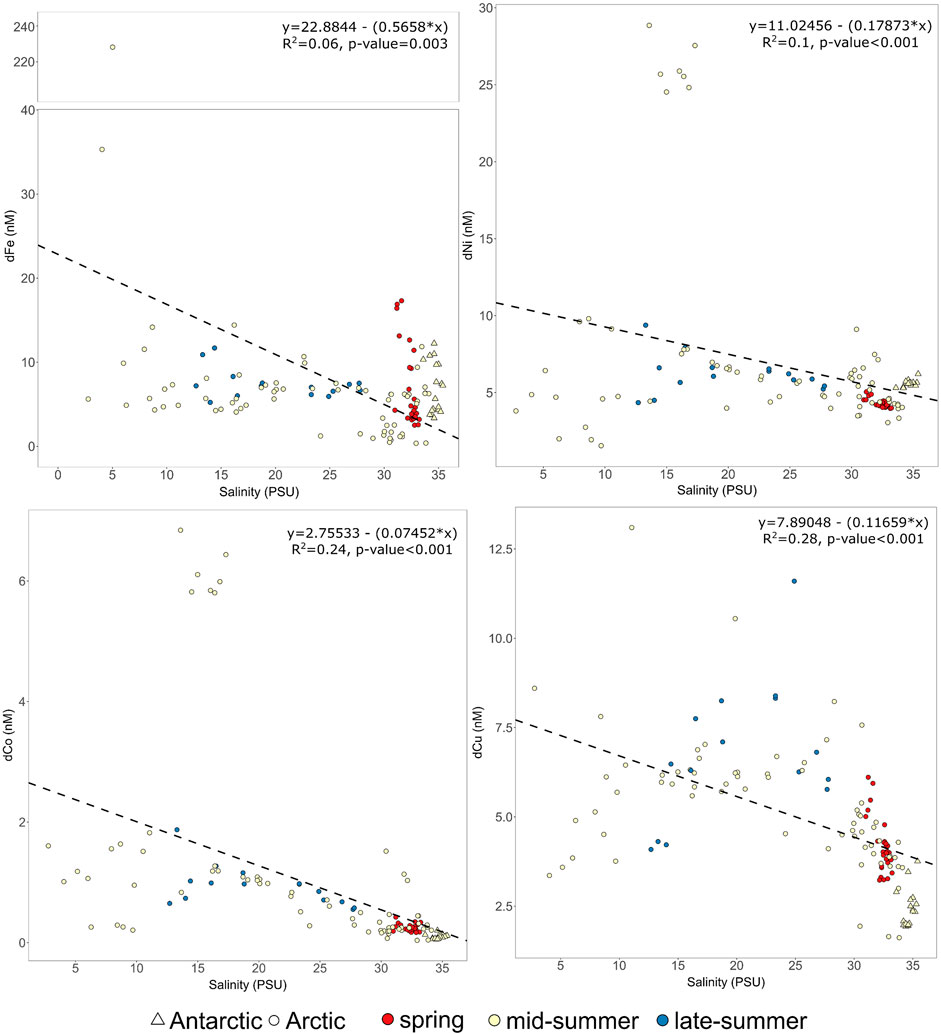
FIGURE 2. The distribution of dCo, dCu, dNi and dFe (all nM) across the salinity gradient in all catchments. All Arctic (circles) and Antarctic (triangles) data is plotted with color denoting the seasonal timing (red, spring; yellow, mid-summer; blue, late-summer). The linear regressions refer to all data and were not improved (i.e., lower p value) by using only summertime data. Note the break in the dFe y-axis.
Across a selection of sites, a subset of unfiltered acidified samples were retained to determine total dissolvable metal concentrations (Supplementary Data). This is a reproducible measure of the labile (acid soluble) fraction of metals present in any suspended particles (Edwards et al., 2006). As higher concentration samples were run following dilution, rather than by preconcentration, this often precludes the accurate analysis of metals with lower concentrations (herein the majority of Co data points), so only TdFe, TdNi, and TdCu data is presented. There are marked differences in the relative size of the total dissolvable and dissolved metal pools for these elements. Over the whole dataset, dFe constituted 3.5 ± 4.8% of TdFe, dNi 86 ± 28% of TdNi, and dCu 83 ± 28% of TdCu (n = 73).
Whilst it is clear that the dissolved and total dissolvable Ni and Cu inventories are very similar, i.e. the total dissolvable concentrations largely consisted of dissolved metal, the relationship between dFe and TdFe is unclear. Correlation between the two measurements is poor (linear regression R2 0.17, p < 0.01). The ratio of dFe:TdFe herein and lack of a close correlation is similar to findings elsewhere in other glaciated regions and suggests de-coupling between the controls on dFe and TdFe concentration (Lippiatt et al., 2010; Schroth et al., 2014; Kanna et al., 2020).
Discussion
Cross-Site (Micro)Nutrient Distributions
Macronutrient distributions are fundamentally different in Antarctic and Atlantic/Arctic regions due to the pronounced High-Nitrate, Low-Chlorophyll (HNLC) status of the Southern Ocean. Pronounced upwelling of nutrient rich deep waters combined with extensive Fe-limitation of primary production across the Southern Ocean facilitates higher concentrations of phosphate, nitrate and silicic acid in surface waters than are observed anywhere in the northern hemisphere (Martin et al., 1990; Moore et al., 2013). These significant differences between the northern Arctic/Atlantic and southern Antarctic field locations herein are apparent in a Redundancy Analysis when comparing nutrient distributions across all sites (Figure 3). Maxwell Bay (King George Island) and South Bay (western Antarctic Peninsula) cluster together when considering all trace metal distributions and the main physical factors, salinity and lateral distance, that are expected to influence the concentrations close to glacial outflows. The RDA explains 23% of the variance for all macronutrients and trace metals across all sites using two explanatory variables (Figure 3).
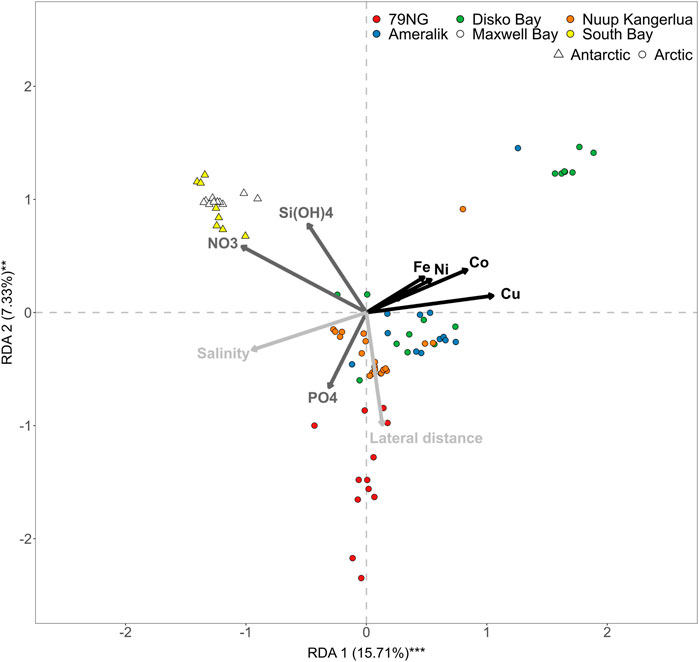
FIGURE 3. Redundancy analysis for all trace metals and macronutrients across all sites in summer considering lateral distance and salinity as key explanatory variables. Note the distinct clustering of Southern Ocean sites (Maxwell Bay and South Bay) compared to all Greenlandic (Arctic) sites. The angles between arrows show positive (0°), negative (180°) or no relationships (90°) among the variables. Only summertime data are plotted.
The weak fit for all summertime data collectively is partially due to the variable salinity-trace metal trends among catchments; clear delineation between HNLC and Arctic/Atlantic conditions with respect to macronutrient concentrations; and also to the predominance of vertical processes (i.e., mixing and remineralization), rather than lateral processes, in controlling macronutrient distributions (e.g., Cape et al., 2018; Kanna et al., 2018). High concentrations of the trace elements Fe, Ni, Co and Cu, when considered across all catchments, are associated with lower salinity (Figures 2, 3); whereas high concentrations of macronutrients are generally associated with higher salinity (Figure 3). Lateral distance from the main glacier outflows was a less important explanatory variable, particularly for dCu, but did exert some influence on the distribution of dFe, dNi, dCo and macronutrients. It should be noted however that this distance is more arbitrary and less quantitative than salinity because its significance and correlation with other key parameters (including salinity) certainly varies between sites.
General trends in trace metal distributions can also be compared to macronutrients. In the Arctic, large glacier fjords are typically characterised by the inflow of saline, macronutrient rich waters at depth, followed by the outflow of glacially modified fresher waters near the surface (Straneo and Cenedese, 2015). Around Antarctica, shelf macronutrient concentrations are much higher. Whilst the same mixing processes, driven by katabatic winds and subglacial discharge plumes, still influence macronutrient distributions in these regions (Cape et al., 2019), they are simply less evident in relative terms because of the higher macronutrient concentrations throughout the water column. The contribution of runoff to macronutrient concentrations in coastal seawater therefore depends on the geographical location, depth and timing of discharge release. Runoff more consistently affects the ratio of macronutrients compared to absolute concentrations because silicic acid is almost invariably enriched in runoff relative to nitrate and phosphate (Meire et al., 2016a), and thus Si* (Eq. 5, Sarmiento et al., 2004) may be a more useful tracer of runoff than macronutrient concentrations.
Si* is consistently positive in all low salinity (<20) glacially-modified waters (Figure 4), which are present only in Arctic locations. As expected from the high ratio of silicate:nitrate in runoff (Meire et al., 2016a), Si* shows a reasonably good linear fit (R2 0.67, p value <0.001) with salinity. The two Antarctic sites have notably higher Si* values due to the much higher concentrations of silicic acid relative to NO3 in the Southern Ocean. For the Arctic, the highest concentrations of some dissolved trace metals are generally associated with these low salinity, high Si* values (Figure 4), although there are notable variations. For dCo and dNi this may partially be driven by an unusually strong regional enrichment found in Kangaatsiaq (West Greenland) where we were only able to sample at mid-salinity. Yet dCu is also less clearly related to Si*, implying that any glacially-associated sources from these elements are too minor to be evident, or that Si* and trace metal sources are spatially de-coupled. Sedimentary exchange, melting icebergs, and discharge from land- or marine-glaciers are all likely to exert differing degrees of influence on the distribution of all elements considered herein (Wehrmann et al., 2013; Hawkings et al., 2020; Krisch et al., 2021).
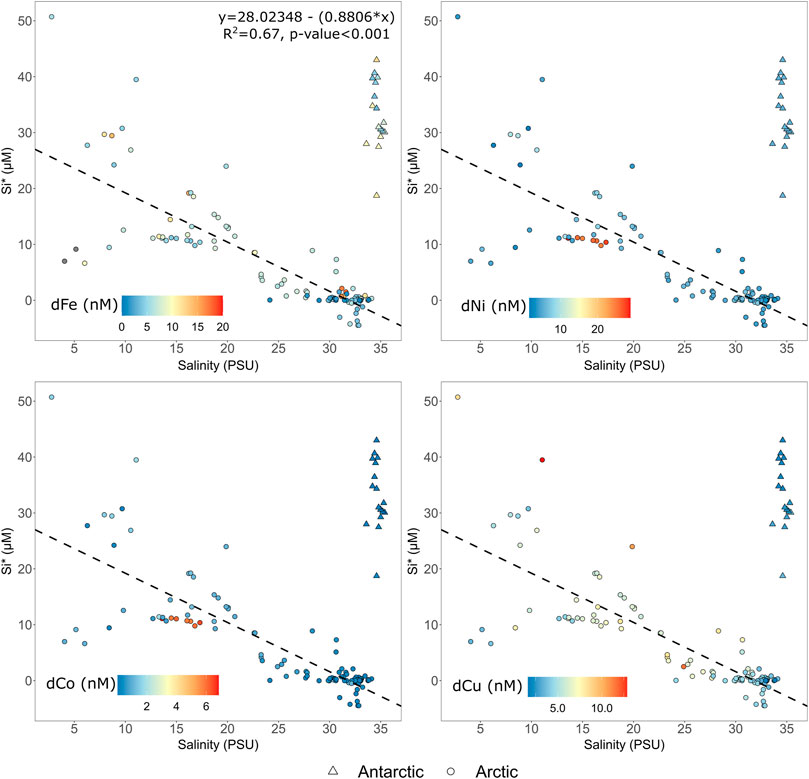
FIGURE 4. Si* compared to dCo, dCu, dNi and dFe distributions (all nM) in all catchments. All data is plotted. The linear regression for Si* refers to Arctic (circles) data only. Antarctic (triangles) field locations exhibit a different gradient due to the HNLC status of the Southern Ocean.
The poor relationship between dCu and Si* (Figure 4) is particularly interesting, because a major driver of non-conservative dCu behavior in some estuaries is the weathering of silicates (Windom et al., 1991). Dissolved Cu distribution between estuaries globally is highly variable. In some estuaries almost perfect conservative behavior is apparent, whereas elsewhere absorption of dCu onto particle surfaces at low salinities, or the release of dCu from particles at high salinities, is invoked to explain non-conservative dCu distributions (Boyle et al., 1982; Windom et al., 1983; Waeles et al., 2005). In Disko Fjord and Kangaatsiaq dCu and Si* correlated closely (linear regression R2 0.59 and 0.78, respectively), indicating that silicate weathering was potentially a major driver of dCu distribution. Yet in other fjords there was no apparent correlation, or the distribution was inverted. In addition to the potential for high turbidity in inner-fjord environments to scavenge dCu, a further confounding factor for the Greenlandic case studies herein is that the dCu concentration in unmodified saline waters is quite high relative to the low salinity enrichment (e.g., mean dCu concentration at 100 m depth for Greenland shelf stations averaging PS100, GEOVIDE and D354 data is 1.84 ± 0.78 nM at salinity 34.1 ± 0.75, n = 14). The dCu distribution observed (Figure 2) is therefore consistent with trends observed in lower latitude estuaries and suggests a combination of dCu absorption and release, possibly with a contribution from silicate weathering in some catchments, leads to a varying extent of non-conservative behavior for dCu in glacier fjords.
A further implication of the Si* trend observed for Arctic sites (Figure 4), is that the field surveys herein are likely capturing a large part of the regional scale over which glacial outflow directly influences macronutrient stoichiometry of outflowing near-surface waters. Si* is slightly negative in the relatively high macronutrient saline inflowing waters, which have been characterised previously at two of the sites discussed herein (−3.5 ± 1.8 µM for Nuup Kangerlua, Meire et al., 2017; and −5.0 ± 0.3 µM for 79NG, Krisch et al., 2021). This is similar to shelf surface waters elsewhere around Greenland (e.g. −2.2 ± 1.4 µM, D354, Achterberg et al., 2020; −0.78 ± 3.8 GEOVIDE, Sarthou et al., 2018). Si* however increases markedly to high values of up to +50 µM at low salinities, and is then steadily reduced down to ∼0 due to drawdown associated with diatom productivity and mixing processes at intermediate salinities. In Nuup Kangerlua, the best studied field location herein with respect to annual trends in microplankton growth (Juul-Pedersen et al., 2015), diatoms account for a mean of 85% of microplankton abundances from July to October (Krawczyk et al., 2015). As Si* returns to values close to zero by salinities of ∼30, which generally corresponds to stations in outer fjord areas around Greenland, it can be approximated that macronutrient stoichiometry is restored to ratios that resemble the shelf within these large fjord systems.
Insight Into Seasonality
In Nuup Kangerlua and the neighbouring Ameralik, transects were conducted over multiple seasons. Nuup Kangerlua is among the best studied glacier fjords in Greenland. A long-term Greenland Ecosystem Monitoring station (GF3, Figure 1) in the mouth of Nuup Kangerlua (Juul-Pedersen et al., 2015), modelled liquid discharge data products (Mankoff et al., 2020) and prior surveys of the fjord (Mortensen et al., 2011; Mortensen et al., 2014; Meire et al., 2017) provide a contextual framework to discuss the seasonal timing of results obtained herein (Figure 5). In addition to precipitation and non-glacier runoff, Nuup Kangerlua receives discharge from several land-terminating systems, and three marine terminating glaciers: Narsap Sermia, Akugdlerssûp Sermia and Kangiata Nunâta Sermia (Mortensen et al., 2011; Juul-Pedersen et al., 2015). Primary production at GF3 peaks twice annually, with high primary productivity observed in April–May (the spring bloom) and July–August (the summer bloom). Accordingly, minima in nitrate concentrations at GF3 are typically observed in July and silicic acid minima in July/September (Figure 5, Juul-Pedersen et al., 2015).
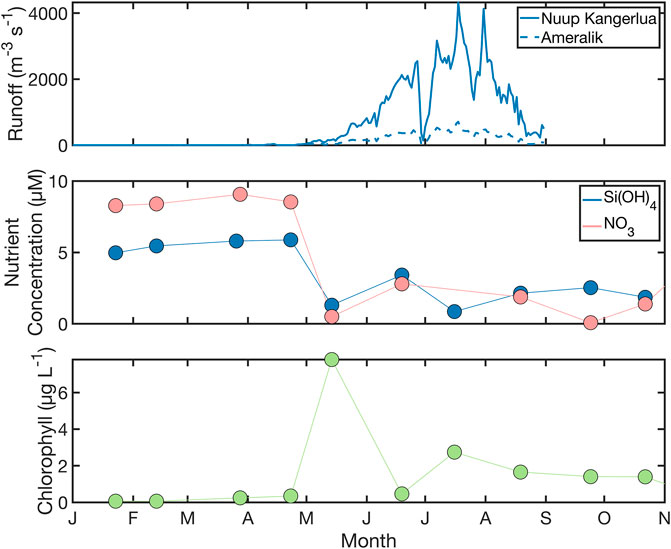
FIGURE 5. The seasonal development of runoff (modelled); and nitrate, silicic acid and chlorophyll a concentrations (measured) for station GF3 in the mouth of Nuup Kangerlua. GF3 data is reported monthly by The Greenland Ecosystem Monitoring (GEM, 2021) Database, (https://data.g-e-m.dk/, last accessed August 2021). Modelled daily liquid discharge from Mankoff et al. (2020) refers to 2019 (see Supplementary Note). Nutrient concentrations refer to 10 m, chlorophyll concentrations are a 0–20 m mean.
Consistent with the general seasonal trends in prior work, a boreal spring transect of Nuup Kangerlua was characterised by high salinity (32.0–33.2) surface waters with a slight gradient towards fresher conditions moving into the inner-fjord. Fjord ice blocked further passage towards the major glaciers beyond ∼GF13. The freshwater entering Nuup Kangerlua in spring is largely runoff, a fraction of which is snowmelt which typically occurs from late April onwards, and glacial ice melt (Mortensen et al., 2013). Subglacial discharge from the largest marine-terminating glacier, Kangiata Nunâta Sermia, is not significant over-winter and does not become a major feature until August. June–July is characterized by the onset of significant runoff but limited subglacial discharge (Mortensen et al., 2013). In August (2019), a low salinity (7.9–25.6) plume was observed along the fjord surface which remained in September (12.7–27.7). Annual salinity minima obtained from a mooring in the main fjord close to GF10 (Figure 1) were previously found to occur in September at both 63 and 147 m depth (Mortensen et al., 2014). Modelled runoff data from 2019 (Mankoff et al., 2020) suggests liquid glacier runoff into Nuup Kangerlua first reached 10 m3 s−1 on Julian day 92, 100 m3 s−1 on day 124 and peaked at 4,325 m3 s−1 on day 199.
For all transects, icebergs were encountered along Nuup Kangerlua with the highly-variable distribution depending on, among other factors, local wind conditions. Turbidity was notably elevated close to the outflow of Lake Tasersuaq (close to station GF11, Figure 1) in all cruises, but more so in August and September. It should be noted that turbidity is visibly enhanced in this mid-fjord region throughout the year driven by tidal mixing (see, for example, http://ocean.dmi.dk/arctic/nuuk.uk.php, last accessed May 2021). The May transect conducted herein (Table 1) can therefore be described as occurring close to the peak of the spring bloom, with the fjord subject to runoff and glacial ice melt but not yet significant subglacial discharge. The August transect occurred during a time period which is also characterized by high productivity in the inner- and outer-fjord (Juul-Pedersen et al., 2015; Meire et al., 2017), shortly after the timing of peak annual liquid discharge into the fjord (Mankoff et al., 2020). Finally, the September transect occurred when primary production is generally lower (Juul-Pedersen et al., 2015; Meire et al., 2017), glacier runoff into the fjord has dropped significantly from its annual peak, but whilst the freshwater content of the fjord’s upper water column is still high and maybe close to its annual maxima (Mortensen et al., 2014).
Ameralik is located south of Nuup Kangerlua, with the entrance to the two systems connected via an archipelago-like coastal area (close to station GF3, Figure 1), although the oceanographic circulation in this region is presently uncharacterised. In contrast to Nuup Kangerlua, Ameralik receives freshwater from only land-terminating systems and is thus not locally impacted by icebergs. A land-terminating glacier outflow close to station AM12 (Figure 1) transports a large quantity of sediment into the fjord which creates a strong along-fjord gradient in turbidity. The seasonal evolution of surface salinity here was similar to Nuup Kangerlua with salinities as low as 4.0 (range 4.0–27.7) measured in the shallow inner-fjord in August (2019), and a narrower salinity gradient (31.4–32.8) in May. Wintertime oceanographic measurements from Ameralik are not available, but modelled runoff data suggests a similar runoff distribution curve to Nuup Kangerlua, with 10 m3 s−1 first reached on Julian day 101 and peak runoff occurring at 710 m3 s−1 on day 199 (Mankoff et al., 2020).
The distribution of nutrients is easier to interpret in Ameralik because the major sources of turbidity and freshwater are co-located in the inner-most fjord. In May, surface macronutrient concentrations were drawn down to low levels in Ameralik (<0.5 µM NO3, <0.2 µM PO4, <2.2 µM silicic acid). This is consistent with the spring bloom having already occurred, which is expected based on chlorophyll a at GF3 (Juul-Pedersen et al., 2015). In August, residual surface NO3 concentrations (up to 1.5 µM) were present at most stations along with an excess of silicic acid with respect to the Redfield Ratio (up to 13 µM, or 12 µM Si*). Concentrations of most dissolved trace metals in spring showed a limited range with all elements showing a gradient towards increased concentrations in the inner-fjord. In August, the same increase in concentration towards the inner fjord was only evident for dCo and dFe; with dCu showing the opposite trend. August dFe concentrations were high (228 nM) in the inner-fjord accompanied by extremely high concentrations of TdFe (peaking at 77 µM).
The Ameralik catchment is known to have a high sediment load of 2–3 g L−1, above the only available estimate for a pan-Greenlandic average, ∼1 g L−1 (Overeem et al., 2017). The absence of lakes between the glacier and coastal outflow precludes the extensive settling of glacier-derived particles and may be a contributing factor to high turbidity in Ameralik (Bullard, 2013). The extremely high TdFe concentrations may therefore reflect the high sediment load, the low salinity (6 or less at the innermost three sampling locations), and the proximity of these sample locations to the glacier outflow (<6 km). Most other inner-fjord samples discussed herein were collected at higher salinities and/or located several kilometres further from the main freshwater outflow than it was possible to sample in Ameralik (Table 1).
In Nuup Kangerlua the spatial trends were more dynamic. The innermost sampled region (close to station GF13) is downstream of the large marine-terminating glaciers in the inner-fjord and close to the terminus of Narsap Sermia. Additional runoff, with high turbidity visible at the surface, occurs close to Narsap Sermia and also further down fjord (close to station GF11) where tidal mixing also contributes to high turbidity throughout the year. In 2014, dFe concentrations were shown to peak at intermediate salinities when considering an along-fjord transect up to GF13 due to the turbid runoff close to GF11 (Hopwood et al., 2016). The highest dFe concentrations in the fjord are reported for shallow, turbid areas close to this outflow where salinities are <15 in summer (Figure 6). This clearly demonstrates the potential for multiple processes and outflows to affect fjord-scale (micro)nutrient distributions.
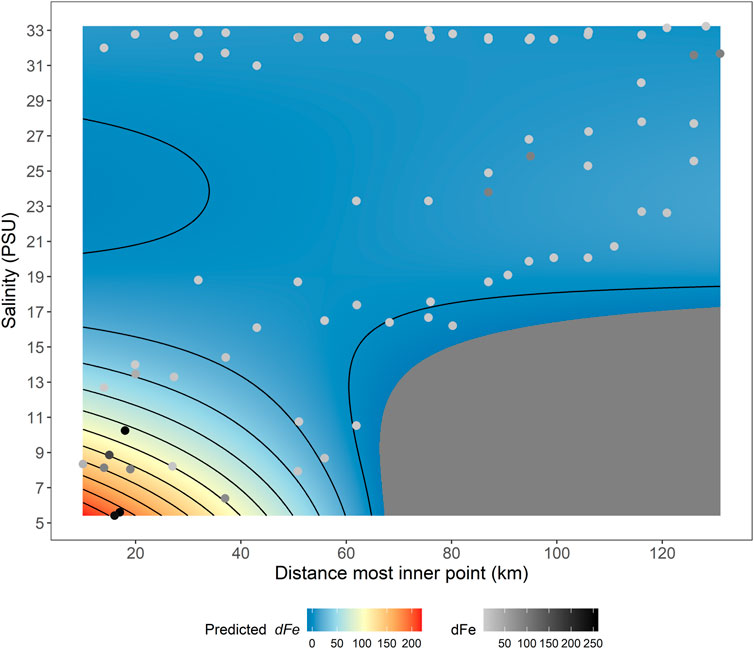
FIGURE 6. A GAM fitted to the concentration of dFe in Nuup Kangerlua during May 2014, August 2014, May 2019, August 2019 and September 2019. Individual points represent the data used to generate the model. The GAM model fitting process (assessed by AIC and R2) is shown in Supplementary Table S5.
In May 2019, macronutrient distributions along Nuup Kangerlua were highest in the inner-fjord (up to 9.5 µM NO3) likely reflecting a combination of a later bloom onset close to the retreating fast ice margin, and the role of down-fjord winds in re-supplying macronutrients to surface waters (Meire et al., 2016b). Due to an inevitable time lag of a few days between macronutrients being entrained into surface waters and any associated increasing phytoplankton growth, a down-fjord gradient in near-surface macronutrient concentrations can be maintained. There was also a slight increase in macronutrient concentrations at the outermost stations in the fjord mouth (up to 3 µM NO3) which are shallow compared to the inner-fjord, likely resulting from increased vertical mixing and weaker stratification (Mortensen et al., 2011). Dissolved trace metal concentrations in May 2019 were relatively constant along Nuup Kangerlua with no elements showing pronounced gradients along the fjord. Some heterogeneity may have resulted from the varying distance to the coastline (the transect was generally mid-fjord, but this was not precisely controlled when sampling underway due to the necessity of avoiding icebergs). In August 2019 dCo, and dNi showed a decline moving along the fjord into more saline waters. Maxima in all other elements were evident mid-transect, possibly reflecting either outflow of trace metals from runoff near GF11, or more intense removal of these elements in the inner-fjord. Concentrations of dFe and dCu were generally more variable than other elements. In September 2019, the distributions of most elements were very similar to those observed in August 2019 when considering the same stations (some additional inner-fjord stations were sampled in September).
Nuup Kangerlua is, to our knowledge, the only glacier fjord where dFe data is available in multiple seasons and years. Given that more dFe data is available than for other elements (from 2014 to 2019) and dFe behavior is better studied in this geographical context, we use dFe to construct a GAM model to explore seasonal/interannual change. When data from 2019 is compared to data from 2014 (Hopwood et al., 2016), the lateral trends and concentrations are quite consistent (Figure 6). When dFe concentrations are considered either with respect to salinity, or with respect to distance from the Narsap Sermia terminus, some general trends are evident. Dissolved Fe concentrations were most variable at low salinities and in the innermost 50 km of the fjord (Figures 2, 6). Elsewhere along the fjord, dFe concentrations were reasonably stable and similar throughout the year (mean 6.5 ± 2.8 nM for all stations further away from the glaciers than GF10 across all 5 transects). Considering the 2014 and 2019 May, August, and September data collectively, the interaction between salinity and lateral distance appears to be the key factor explaining dFe distribution. A GAM using only salinity and lateral distance produced a good fit (R2 0.72) to the entire dataset (Figure 6). This highlights the relative constancy of dFe in all seasons (May, August, and September; or boreal spring, mid and late-summer) in the outer-fjord, contrasting with the inner-fjord where strong gradients in dFe arise with respect to both salinity and distance (Figure 6). Including a temporal or seasonal factor did not improve the best-fitting GAM portraying dFe behaviour in Nuup Kangerlua (Figure 6). Any effects of seasonality, other than changing salinity and changes proportional to this, therefore appear to make limited differences to dFe concentrations.
In contrast to dFe, summertime TdFe declined steadily along Nuup Kangerlua in all transects, from peak concentrations of 1.3–14.8 µM in the inner fjord to 100–300 nM in the fjord mouth. This is similar to observations elsewhere of rapid TdFe loss with distance from glacial outflows compared to dFe (Kanna et al., 2020) and consistent with either sedimentation and/or a gradual shift towards reduced particle lability with sedimentation likely accounting for most of the decline (Krisch et al., 2021). Whilst fewer transects are available for Ameralik (only May and August 2019), similar conclusions can be drawn. For the fjord outside the intense turbidity plume (stations up to AM9), May dFe concentrations were 6.6 ± 3.8 nM, and August concentrations were similarly 6.8 ± 0.1 nM.
Seasonal variations are informative concerning how to inerpret trace metal concentrations with respect to fluxes. Using a linear regression of data only for Greenland, combined with an estimate of the total volume of freshwater discharged around the island (which includes melting of calved ice and tundra runoff in addition to Greenland Ice Sheet runoff, in sum ∼1,200 km3 yr−1, Bamber et al., 2018) produces estimated fluxes of 29 Mmol yr−1 dFe, 3.2 Mmol yr−1 dCo, 14 Mmol yr−1 dNi and 8.9 Mmol yr−1 dCu. This is inclusive of any non-conservative processes evident in outflowing surface waters on this spatial scale (Figure 2). Specifically for runoff from the Greenland Ice Sheet, which is only one component of the freshwater input into fjords, fluxes of 1.3 Gmol yr−1 dFe, 0.86 Mmol yr−1 dCo, 7.0 Mmol yr−1 dNi and 5.9 Mmol yr−1 dCu have been scaled from one catchment in west Greenland (using a volume of 560 km3 yr−1, Hawkings et al., 2020). For dCo, dNi and dCu these values are reasonably similar considering the volume differences, and the inclusion of non-conservative processes and a broader geographic sampling context herein. However, the dFe flux estimate is markedly lower, only 2% of that estimated from freshwater concentrations (Hawkings et al., 2020). This appears similar to results in Kongsfjorden (Svalbard) where 2% of dFe from glacier runoff remained after non-conservative loss processes across the salinity gradient (Zhang et al., 2015) and demonstrates the significance of the flux gate used when constraining dFe transfer across salinity gradients. The lower flux determined herein is more comparable to the lowest values estimated by various methods elsewhere around Greenland (e.g., 39 Mmol yr−1 dFe, Stevenson et al., 2017) although it should be noted again that most flux estimates refer specifically to glacier runoff and not to the total freshwater volume entering the ocean around Greenland.
All of these estimates however assume that trace element fluxes can be scaled to freshwater discharge. For elements such as dFe, which seems to show strong evidence of buffering throughout the year, i.e., very similar concentrations of dFe in outer-fjord waters in spring, mid- and late-summer, the rate at which saline waters are overturned through the fjord system may be a stronger influence than seasonal freshwater discharge on the lateral flux of these elements out of the fjord. Fjord overturning is poorly constrained on a pan-Greelandic scale, but mooring observations in NE Greenland previously allowed the lateral flux of dFe from Nioghalvfjerdsbrae to be constrained as 0.67–0.97 Mmol yr−1 (Krisch et al., 2021). This was roughly tenfold larger than the flux that could be deduced from a linear regression, as above. Without accurate data concerning the over-turning rate of other glacier fjords alongside corresponding trace metal data, it is challenging to further refine fluxes, but it is worth noting that outflow of trace metal enriched fjord waters is not necessarily confined to summer, nor to the meltwater season, and thus on annual timescales lateral fluxes may not scale directly with freshwater discharge volumes.
Insight Into Elemental Behavior From Dissolved Ratios
The rapid loss of dFe across any salinity gradient is expected (Boyle et al., 1977), so how does this change the relative availability of dFe to other trace elements? Co is a scavenged-type element (James, 2005) and so metrics such as Co*Fe (Eq. 6) are potentially a useful method for investigating depletion/enrichment relative to other elements. Using a cellular ratio of 0.025 mol mol−1 for Co:Fe (as per Moore et al., 2013), Co*Fe for three Greenlandic shelf regions was close to zero: 0.13 ± 0.06 nM (PS100) 0.25 ± 0.17 nM (D354), and 0.49 ± 0.32 nM (GEOVIDE). For measured freshwater concentrations, Co*Fe is consistently negative ranging from −36 to −0.17 using the limited available values from Kobbefjord (SW Greenland, located between Nuup Kangerlua and Ameralik), Kangerlussuaq (W Greenland, Hawkings et al., 2020) and Doumer Island (Antarctica). Yet most fjord regions studied have more positive values than the shelf, indicating a larger excess of dCo with respect to mean cellular Fe:Co ratios, especially in Kangaatsiaq where unusually high dCo (and dNi) concentrations were observed. It therefore appears that more rapid scavenging of dFe than dCo results in a transition from negative Co*Fe in freshwater to positive Co*Fe in these fjord systems. This is followed by a steadier decline in both dCo and dFe in shelf waters which is consistent with the sustained phytoplankton blooms present in summer in some fjords systems (Juul-Pedersen et al., 2015; Meire et al., 2017).
Shifts in the relative dissolved abundances of all elements considered herein become evident if all data is binned by salinity. Moving from low salinity waters to higher salinity waters on the shelf, the fractional importance of dFe and dCo declines, whereas dNi and dCu are relatively more abundant (Figure 7). This broadly reflects the expected scavenging of dCo and dFe in fjord environments and, particularly for dFe, across the salinity gradient (Schroth et al., 2014; Zhang et al., 2015; Kanna et al., 2020). The release of dCu from particles in mid-salinity (15–30) fjord waters (Figure 2) may also slightly affect relative abundances. Additionally, biological uptake of most dissolved trace metals is expected to be higher than dCu and dNi relative to available inventories in the North Atlantic (Achterberg et al., 2020). A further confounding influence, especially given the location of most shelf measurements in east Greenland, is that the Transpolar Drift appears to drive elevated trace metal signatures in the East Greenland Current (Krisch et al., 2021). Comparing the zero salinity intercepts for Greenland data herein (24 nM dFe, 11 nM dNi, 2.7 nM dCo and 7.4 nM dCu) with mean concentrations in the Transpolar Drift (2 nM dFe, 7 nM dNi, 150 pM dCo and 5 nM dCu, Gerringa et al., 2021) suggests that trace metal concentrations along the east Greenland shelf may be more influenced by trace metal fluxes exiting the Arctic than they are by local freshwater discharge from Greenland. The high dNi and dCu concentrations over the shelf may thus simply reflect a signal exported southwards (Gerringa et al., 2021). It remains to be quantified how far this Transpolar Drift signal is propagated.
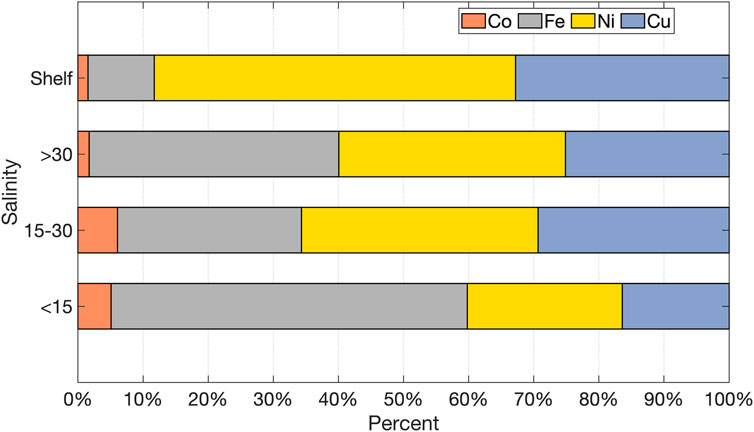
FIGURE 7. Relative abundances of dCo, dFe, dNi, and dCu as a percent of the sum of all 4 element’s concentration. Data from glacier fjords and coastal regions is binned by salinity. “Shelf” data refers to 3 areas of the Greenland shelf surveyed by PS100 (east of 15°W), GEOVIDE, and D354. Note “shelf” is not an exclusive category.
Unique Features in the Disko Bay Region (Qasigiannguit, Kangaatsiaq and Disko Fjord)
Three transects along fjords in the Disko Bay region were conducted in early boreal summer (July 2019). Sea ice cover across Disko Bay lasted until June. This is typically followed by a period of relatively high pelagic primary production (Nielsen and Hansen, 1995). All fjords had a strong salinity gradient (Table 1). The Kangaatsiaq section exhibited the highest surface NO3 concentrations (up to 2.8 µM in the inner-fjord) suggesting incomplete NO3 drawdown due to light limitation or perhaps increased mixing compared to the other two fjords attributable to mid-fjord rapids. Along Qasigiannguit and Disko Fjord, NO3 concentrations were lower (<1.6 µM and <0.3 µM, respectively) and closer to the low surface concentrations expected following the spring bloom across Disko Bay. Relatively high surface silicic acid concentrations were evident in all fjords, generally increasing at low salinity (up to 32 µM in Qasigiannguit, 14 µM in Kangaatsiaq, and 51 µM in Disko Fjord, respectively).
Trace metal distributions differed slightly between the three fjords. In all cases, dFe showed slightly increasing concentrations with salinity. dCu and dCo conversely showed a trend towards higher concentrations at lower salinity in Disko Fjord and Kangaatsiaq with no clear trend in Qasigiannguit (although this may to some extent reflect the low number of data points in Qasigiannguit). Dissolved Ni diverged between the 3 systems showing relatively constant concentrations along Disko Fjord (4.1 ± 0.3 nM), a decline with salinity along Kangaatsiaq, and an increase with salinity along Qasigiannguit. The slight increase of dFe in higher salinity waters is a stark contrast to the non-conservative removal observed at lower salinities in other catchments. A potential explanation is reduced scavenging. Close to glacier outflows, intense particle plumes provide a large surface area onto which dFe, and other susceptible elements, can be scavenged. There is thus competition between particle surfaces and dissolved organic material to bind dFe, which may lead to under-saturation of organic Fe-binding ligands even though there is a large pool of labile particulate Fe vastly in excess of low nanomolar ligand concentrations (Ardiningsih et al., 2020). The nature of organic material and the associated metal-binding ligands likely also changes on this spatial scale (Ardiningsih et al., 2020) contrasting turbid inner-fjord environments with generally low primary production, with more productive outer-fjord environments where summer-time phytoplankton blooms provide a source of new organic carbon (Juul-Pedersen et al., 2015; Meire et al., 2017). Without detailed measurements of dFe speciation, we cannot comment further on the mechanism under-pinning this trend, but it is interesting to postulate how dFe speciation may change across these salinity gradients. Inorganic colloidal Fe is typically the major form of dFe in glaciated freshwater environments (Raiswell and Canfield, 2012; Hawkings et al., 2020), whereas the limited available work in glaciated coastal regions suggests a transition to dominance of organically complexed Fe species occurs across the salinity gradient (Ardiningsih et al., 2020; Krisch et al., 2021) likely due to aggregation of colloidal Fe (Zhang et al., 2015). Limited changes in dFe concentration could therefore be masking strong shifts in Fe speciation.
When dissolved metal concentrations from all catchments are considered collectively, Kangaatsiaq shows a very strong anomaly in both dCo and dNi in the inner-fjord. Concentrations of 25–29 nM dNi and 6–7 nM dCo are high both in the context of other measurements herein, and more generally compared to other coastal/shelf (Supplementary Table S3) and freshwater concentrations around Greenland (Supplementary Table S2). Analytical issues with these samples seem unlikely; they were analysed twice with the same results, the 5 locations with elevated concentrations are clustered together geographically, and other more-contamination prone elements (e.g., dFe) were not atypical for any of the samples. This may therefore reflect a local dNi and dCo source within this catchment. This seems plausible given that outcrops of Ni- and Co-rich minerals are known to occur across W Greenland (Boersma and Foley, 2014) and that the sampling region is notable for being inside the Nordre Strømfjord shear zone (Sørensen et al., 2006), potentially explaining striking differences between this and other W Greenland catchments. As these high trace metal anomalies were located at mid-salinities (no lower salinity samples were obtained in these catchments) they perturb the Si* and salinity vs. metal trends when all Arctic catchments are considered collectively (Figures 2, 4).
Weak Dissolved Gradients in the Antarctic Catchments (Maxwell Bay and South Bay)
The glaciers in Maxwell Bay and South Bay are notably smaller than their Greenlandic counterparts, and their low salinity plumes (Table 1) in austral summer similarly occur over much smaller spatial scales which cluster distinctly on a RDA for all sites (Figure 3). Si* is also a poorer tracer of glacial activity, due to the much higher concentrations of silicic acid in the Southern Ocean (Figure 4). Maxwell Bay receives calved ice from nearby Nelson Island and several glaciers connected to the King George Island Ice Cap, including Collins Glacier and Bellingshausen Dome in the north-eastern part of the Bay and Marion Cove in the eastern part. A limited number of small icebergs (typically ∼10 m diameter or less above the water line) are usually visible in the Bay and slight gradients in salinity (range 35.4–33.6, January 2018) are evident moving towards the glacier termini. South Bay is a small bay on Doumer Island (Palmer Archipelago, western Antarctic Peninsula) largely covered by an ice cap, with small subglacial discharge outflows and some ice calving around the fjord periphery. A very small degree of local freshening was observed in fjord transects in austral summer (salinity range 34.2–34.7, February 2018). Both bays can be highly productive in summer with the timing and magnitude of phytoplankton blooms highly dependent on local conditions including irradiance, turbidity, freshwater inputs and wind dynamics (Schloss et al., 2002; Kim et al., 2018; Höfer et al., 2019).
No strong trends were evident in any elements considering either distance from the inner-most Bay area or salinity. Freshwater concentrations from small, short (<50 m from the edge of the ice cap to the coastline) proglacial streams which were safely accessible around Doumer Island’s periphery (130 nM dFe, 0.16 nM dCo, 2.64 nM dCu) confirm that most metals were present at concentrations above those expected for coastal seawater of the Antarctic Peninsula (Ardelan et al., 2010; Sherrell et al., 2018). Conversely, for macronutrients (0.02 PO4 µM, 0.14 NO3 µM, 1.2 µM silicic acid) and dNi (0.30 nM), the low concentration in freshwater precludes a local source and suggests dilution of ambient marine concentrations (Supplementary Table S4) as previously reported (Henley et al., 2017; Höfer et al., 2019). For other elements, the absence of a clear salinity trend may reflect a combination of the limited range in salinity and the fact that multiple processes and sources are affecting trace metal dynamics in these coastal areas (Annett et al., 2015; Annett et al., 2017; Sherrell et al., 2018). Any local freshwater supply is likely simply too small to be clearly distinguishable from sedimentary sources, upwelling sources, and other freshwater outflows into the same region (Monien et al., 2014; Pan et al., 2020). Similar coastal dFe concentrations are reported for the nearest comparable datasets; Andvord Bay in December 2015 (range 1.3–6.1 nM for depths <15 m) and April 2016 (4.6–8.2 nM for depths <15 m) (Forsch et al., 2021), and Ryder Bay for December–March 2010 (3.5–9.4 nM at 15 m depth) (Annett et al., 2015).
Whilst a strong inverse correlation between dFe, or other freshwater sourced micronutrients, and salinity is generally expected in any coastal area with freshwater outflow, a further confounding influence around the Antarctic Peninsula is that meltwater drives stratification which facilitates phytoplankton bloom development and thus micronutrient drawdown which may weaken the expected correlation (Höfer et al., 2019; Pan et al., 2020; Forsch et al., 2021). The opposite is generally thought to be the case in many Arctic catchments where meltwater further stratifies systems which are already nitrate-limited leading to reduced nitrate availability in the photic zone and thus reduced primary production (Holding et al., 2019; Randelhoff et al., 2020). Furthermore, as is evidenced by the trend in dFe concentrations across the much more pronounced salinity gradients around Greenland, sharp dFe losses appear to be mainly confined to low salinity waters followed by a buffering of more constant dFe concentrations at higher salinities (Figure 2), so correlations are likely to be much weaker in regions where only low meltwater fractions are evident (e.g., the Antarctic Peninsula). Extrapolation between Antarctic and Greenlandic systems is not straightforward because the geographic and biogeochemical context of Antarctic fjords is very different due to lower freshwater discharge rates, lower turbidity, higher macronutrient:micronutrient ratios and different patterns of primary production in Antarctica (Vernet et al., 2008; Hopwood et al., 2020; Forsch et al., 2021). Nevertheless, the physical/biogeochemical factors responsible for buffering of dFe concentrations in fjords (i.e., the interaction between turbidity, ligand concentration and properties) warrant further investigation in a global context in order to better constrain how a changing cryosphere (Meredith et al., 2019) will affect biogeochemical cycling in the ocean (Thuroczy et al., 2012; Ardiningsih et al., 2020; Ardiningsih et al., 2021).
Entrainment of Micronutrients as a Driver of Lateral Fluxes
Close to glacier termini, vertical mixing associated with entrainment within subglacial discharge plumes, or wind-driven upwelling, affect macronutrient distributions on the same spatial scale as low salinity plumes and act as the main source of nitrate and phosphate to surface waters (Cape et al., 2018; Hopwood et al., 2018). Whilst RDA suggests that higher dFe, dCo, dNi and dCu concentrations are associated with low salinity (Figure 3), this analysis concerns concentrations determined only in one dimension-a lateral transect of near-surface waters downstream from the glacier. Whenever any process akin to upwelling produces a vertical nutrient flux roughly comparable to freshwater fluxes, this will perturb the observed surface salinity-nutrient distribution and potentially lead to erroneous conclusions when observed concentration gradients are interpreted only in the context of a freshwater flux. Deep turbulent entrainment (Carroll et al., 2015) and upwelling in an inner-fjord environment (Meire et al., 2016a; Meire et al., 2016b) could produce lateral near-surface spatial trends in nutrients that resemble those expected to arise from freshwater runoff (St- Laurent et al., 2017; Dinniman et al., 2020). Where runoff co-occurs with these alternative mechanisms, it is therefore challenging to assess the relative importance of runoff as a nutrient source from only nutrient distributions.
The relative importance of freshwater as a direct nutrient source in regions affected by subglacial discharge plumes can be estimated using buoyant plume theory (Morton et al., 1956). Using a shelf profile derived from the 3 Greenland shelf cruises used herein, and runoff concentrations from 4 regions around Greenland (Supplementary Table S2), we force a nutrient entrainment calculation as has been previously undertaken for macronutrients in select case studies (Cape et al., 2018; Hopwood et al., 2018; Cape et al., 2019). In practically all cases, the modelled plume is associated with a rapid dilution of dissolved trace metals close to the source (Figure 8). The fractional importance of entrained water for determining the concentration of dissolved trace metals in the resulting plume at neutral buoyancy is relatively minor. As illustrated by contrasting these entrainment curves with NO3 (Figure 8), this is a reversal for the situation with macronutrients (PO4, NO3, and silicic acid) where freshwater generally accounts for only a minor fraction of the total nutrient inventory in the plume; invariably <50% for model glaciers with groundling lines >100 m deep (Hopwood et al., 2018). The relative importance of freshwater for determining (micro)nutrient concentrations, on average, decreases in the order dFe>dCu>dNi>NO3 reflecting the relative difference between runoff and sub-surface shelf dissolved nutrient concentrations. Most trace element distributions close to marine-terminating glaciers in Arctic glacier fjords could therefore be interpreted, on this spatial scale (Table 1), in terms of dilution and biogeochemical processing of a concentrated freshwater associated source moving away from a glacier outflow. The main caveat with the use of existing proglacial freshwater concentrations (Supplementary Table S2) to force such a calculation is that these are assumed to be representative of subglacial discharge released from large marine-terminating glaciers. If metal concentrations were in fact higher, the importance of freshwater concentration for driving the observed trends would be further reinforced.
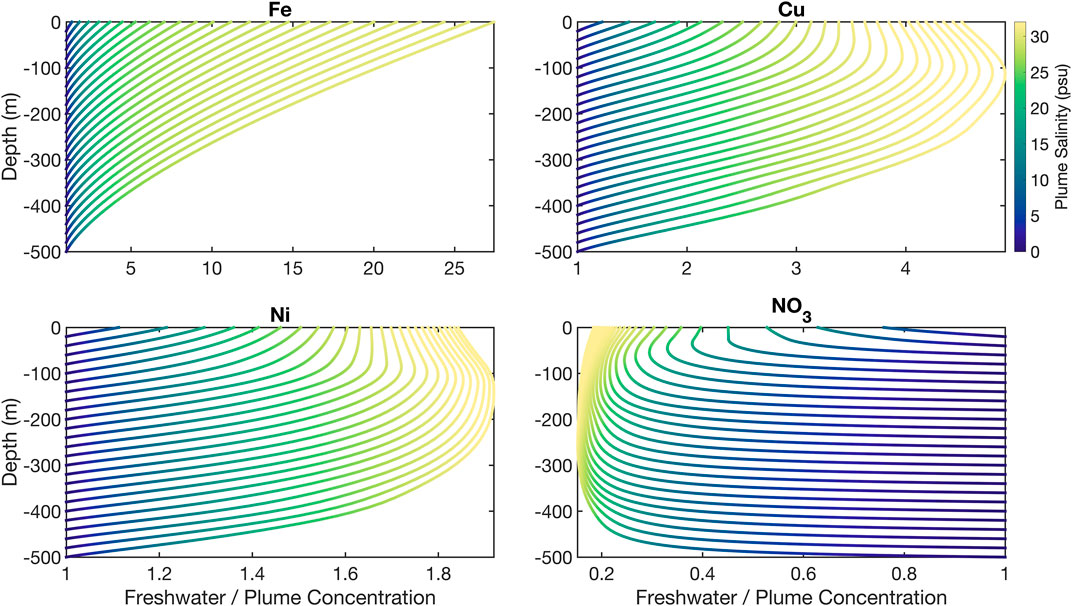
FIGURE 8. Ratio of dissolved Fe, Cu, Ni, and NO3 derived from freshwater in modeled glacier plumes using profiles from the Greenland shelf. Depth indicates the grounding line of a glacier from which 500 m3 s−1 freshwater discharge is released. Each coloured line represents the same discharge released at varying grounding line depths. When the x axis values approach 1 or less at 0 m, surface lateral trends are driven mainly by the properties of inflowing saline waters rather than by freshwater properties. The relative significance of freshwater concentration to determining nutrient concentrations in the resulting plume (x axis) can be seen to decline in the order dFe>dCu>dNi>NO3.
It is important to note that these calculations are exploratory and only designed to test how the relative difference between metal concentrations in subglacial discharge and inflowing saline waters affects trace metal gradients in outflowing surface waters. In reality, as discussed herein, any two-member mixing model (here unmodified shelf profiles and a single freshwater concentration) would clearly be inadequate to explain fjord-scale metal distributions. Even though dFe concentrations in runoff are sufficiently high to drive a strong gradient in dFe downstream of a modelled glacier (Figure 8), and Fe is theoretically the element most affected by such discharge, it is clear from observational data in Nuup Kangerlua that high dFe concentrations along the fjord are not driven solely by the seasonal release of freshwater (Figure 6). Other features of the glacier-fjord system including estuarine removal processes or scavenging (Schroth et al., 2014), sedimentary process (Laufer-Meiser et al., 2021) and seasonal changes in circulation (Mortensen et al., 2014) clearly exert strong enough effects that a relatively steady concentration of dFe is observed along the fjord surface throughout the year (Figure 2).
Conclusion
Using a comparison of eight contrasting glacier fjords we demonstrate that the dissolved trace metals Fe, Co, Ni and Cu are normally present at elevated concentrations associated with glacier runoff in the marine environment. For six Arctic glacier fjords, salinity and lateral distance from areas of strong glacier influence were found to impact trace metal distributions, although salinity alone explained more variance in metal distributions. At two Antarctic field locations, the limited freshwater discharge rate, absence of a major point source of discharge, and modest salinity range precluded a strong kilometer-scale gradient in dissolved metal concentrations associated specifically with freshwater outflow for most elements. Across salinity gradients, dFe exhibited a strong non-conservative loss at low salinities, dCo and dNi concentrations appeared to be relatively conservative, and dCu behavior was variable. A combination of dCu absorption onto particle surfaces at low salinities and silicate weathering likely explain variation in dCu distributions between different systems. Si* indicated that the surveyed areas within Greenlandic glacier fjords encompassed the regions over which a direct glacial influence on macronutrient stoichiometry was evident. Despite this, contrasting spring and summertime conditions in two Greenlandic fjords indicated a limited or negligible influence of seasonality on dFe concentrations. With the exception of low salinity waters in the immediate vicinity of glacier outflows (salinity <15 and distance <40 km), dFe concentration appeared to be relatively constant across multiple transects (boreal spring, mid- and late-summer) and years.
Data Availability Statement
The original contributions presented in the study are included in the article/Supplementary Material, further inquiries can be directed to the corresponding author.
Author Contributions
EPA, MH, MR, JH, and HG designed the project. JK, MH, JH, SK, LM, EA, HG, TJ-P, TL, and PL conducted cruise work. MH, EA, JK, and SK conducted laboratory analysis. MH, JK, and JH conducted data analysis. DC conducted plume modelling. JK and MH wrote the first draft of the manuscript with all authors conducting to its revision.
Funding
Antarctic sampling was possible through FONDAP-IDEAL 15150003. JH was supported by FONDECYT-Regular 1211338. MH received support from the DFG (award number HO 6321/1-1), INTERACT (European Union Horizon 2020, grant 730938) and from the GLACE project, organised by the Swiss Polar Institute and supported by the Swiss Polar Foundation. LM was funded by research programme VENI with project number 016.Veni.192.150, which is financed by the Dutch Research Council (NWO). Ship time and work in Nuup Kangerlua was conducted in collaboration with MarineBasis-Nuuk, part of the Greenland Ecosystem Monitoring project (GEM). We gratefully acknowledge contributions from the Danish Centre for Marine Research (DCH), Greenland Institute of Natural Resources, Novo Nordic Foundation (NNF17SH0028142) and the Instituto Antártico Chileno (INACH) for their logistical support.
Conflict of Interest
The authors declare that the research was conducted in the absence of any commercial or financial relationships that could be construed as a potential conflict of interest.
Publisher’s Note
All claims expressed in this article are solely those of the authors and do not necessarily represent those of their affiliated organizations, or those of the publisher, the editors and the reviewers. Any product that may be evaluated in this article, or claim that may be made by its manufacturer, is not guaranteed or endorsed by the publisher.
Acknowledgments
Tim Steffens (GEOMAR) is thanked for technical assistance with ICP-MS, André Mutzberg (GEOMAR) for macronutrient data, Case van Genuchten (GEUS) and Alice Stuart-Lee (NIOZ) for assistance with sampling, and Katrine Raundrup (GINR) for coordinating INTERACT fieldwork. The captain and crew of RV Sanna and Escudero/Yelcho stations are thanked for field support. Hélène Planquette and Géraldine Sarthou (University of Brest) are thanked for providing GEOVIDE data and for comments on the text.
Supplementary Material
The Supplementary Material for this article can be found online at: https://www.frontiersin.org/articles/10.3389/feart.2021.725279/full#supplementary-material
References
Achterberg, E. P., Steigenberger, S., Klar, J. K., Browning, T. J., Marsay, C. M., Painter, S. C., et al. (2021). Trace Element Biogeochemistry in the High‐Latitude North Atlantic Ocean: Seasonal Variations and Volcanic Inputs. Glob. Biogeochem. Cycles 35, e2020GB006674. doi:10.1029/2020GB006674
Achterberg, E. P., Steigenberger, S., Marsay, C. M., Lemoigne, F. A. C., Painter, S. C., Baker, A. R., et al. (2018). Iron Biogeochemistry in the High Latitude North Atlantic Ocean. Sci. Rep. 8, 1283. doi:10.1038/s41598-018-19472-1
Aciego, S. M., Stevenson, E. I., and Arendt, C. A. (2015). Climate versus Geological Controls on Glacial Meltwater Micronutrient Production in Southern Greenland. Earth Planet. Sci. Lett. 424, 51–58. doi:10.1016/j.epsl.2015.05.017
Alderkamp, A.-C., Mills, M. M., van Dijken, G. L., Laan, P., Thuróczy, C.-E., Gerringa, L. J. A., et al. (2012). Iron from Melting Glaciers Fuels Phytoplankton Blooms in the Amundsen Sea (Southern Ocean): Phytoplankton Characteristics and Productivity. Deep Sea Res. Part Topical Stud. Oceanography 71-76, 32–48. doi:10.1016/j.dsr2.2012.03.005
Annett, A. L., Fitzsimmons, J. N., Séguret, M. J. M., Lagerström, M., Meredith, M. P., Schofield, O., et al. (2017). Controls on Dissolved and Particulate Iron Distributions in Surface Waters of the Western Antarctic Peninsula Shelf. Mar. Chem. 196, 81–97. doi:10.1016/j.marchem.2017.06.004
Annett, A. L., Skiba, M., Henley, S. F., Venables, H. J., Meredith, M. P., Statham, P. J., et al. (2015). Comparative Roles of Upwelling and Glacial Iron Sources in Ryder Bay, Coastal Western Antarctic Peninsula. Mar. Chem. 176, 21–33. doi:10.1016/j.marchem.2015.06.017
Ardelan, M. V., Holm-Hansen, O., Hewes, C. D., Reiss, C. S., Silva, N. S., Dulaiova, H., et al. (2010). Natural Iron Enrichment Around the Antarctic Peninsula in the Southern Ocean. Biogeosciences 7, 11–25. doi:10.5194/bg-7-11-2010
Ardiningsih, I., Krisch, S., Lodeiro, P., Reichart, G.-J., Achterberg, E. P., Gledhill, M., et al. (2020). Natural Fe-Binding Organic Ligands in Fram Strait and over the Northeast Greenland Shelf. Mar. Chem. 224, 103815. doi:10.1016/j.marchem.2020.103815
Ardiningsih, I., Seyitmuhammedov, K., Sander, S. G., Stirling, C. H., Reichart, G.-J., Arrigo, K. R., et al. (2021). Fe-binding Organic Ligands in Coastal and Frontal Regions of the Western Antarctic Peninsula. Biogeosciences 18, 4587–4601. doi:10.5194/bg-18-4587-2021
Azetsu-Scott, K., and Syvitski, J. P. M. (1999). Influence of Melting Icebergs on Distribution, Characteristics and Transport of marine Particles in an East Greenland Fjord. J. Geophys. Res. 104, 5321–5328. doi:10.1029/1998JC900083
Bamber, J. L., Tedstone, A. J., King, M. D., Howat, I. M., van den Broeke, M. R., et al. (2018). Land Ice Freshwater Budget of the Arctic and North Atlantic Oceans: 1. Data, Methods, and Results. J. Geophys. Res. Oceans 123, 1827–1837. doi:10.1002/2017JC013605
Bendtsen, J., Mortensen, J., Lennert, K., and Rysgaard, S. (2015). Heat Sources for Glacial Ice Melt in a West Greenland Tidewater Outlet Glacier Fjord: The Role of Subglacial Freshwater Discharge. Geophys. Res. Lett. 42, 4089–4095. doi:10.1002/2015GL063846
Bhatia, M. P., Kujawinski, E. B., Das, S. B., Breier, C. F., Henderson, P. B., and Charette, M. A. (2013). Greenland Meltwater as a Significant and Potentially Bioavailable Source of Iron to the Ocean. Nat. Geosci 6, 274–278. doi:10.1038/ngeo1746
Boersma, T., and Foley, K. (2014). The Greenland Gold Rush - Promise and Pitfalls of Greenland’s Energy and Mineral Resources.
Borcard, D., Gillet, F., and Legendre, P. (2011). in Numerical Ecology with R. Editors D. Borcard, F. Gillet, and P. Legendre (Legendre New York: Springer).
Boyle, E. A., Edmond, J. M., and Sholkovitz, E. R. (1977). The Mechanism of Iron Removal in Estuaries. Geochimica et Cosmochimica Acta 41, 1313–1324. doi:10.1016/0016-7037(77)90075-8
Boyle, E. A., Huested, S. S., and Grant, B. (1982). The Chemical Mass Balance of the Amazon Plume-II. Copper, Nickel, and Cadmium. Deep Sea Res. A. Oceanographic Res. Pap. 29, 1355–1364. doi:10.1016/0198-0149(82)90013-9
Browning, T. J., Achterberg, E. P., Rapp, I., Engel, A., Bertrand, E. M., Tagliabue, A., et al. (2017). Nutrient Co-limitation at the Boundary of an Oceanic Gyre. Nature 551, 242–246. doi:10.1038/nature24063
Browning, T. J., Al‐Hashem, A. A., Hopwood, M. J., Engel, A., Wakefield, E. D., and Achterberg, E. P. (2019). Nutrient Regulation of Late spring Phytoplankton Blooms in the Midlatitude North Atlantic. Limnol. Oceanogr. 65, 1136–1148. doi:10.1002/lno.11376
Bullard, J. E. (2013). Contemporary Glacigenic Inputs to the Dust Cycle. Earth Surf. Process. Landforms 38, 71–89. doi:10.1002/esp.3315
Cape, M. R., Straneo, F., Beaird, N., Bundy, R. M., and Charette, M. A. (2018). Nutrient Release to Oceans from Buoyancy-Driven Upwelling at Greenland Tidewater Glaciers. Nat. Geosci 12, 34–39. doi:10.1038/s41561-018-0268-4
Cape, M. R., Vernet, M., Pettit, E. C., Wellner, J., Truffer, M., Akie, G., et al. (2019). Circumpolar Deep Water Impacts Glacial Meltwater export and Coastal Biogeochemical Cycling along the West Antarctic Peninsula. Front. Mar. Sci. 6. doi:10.3389/fmars.2019.00144
Carroll, D., Sutherland, D. A., Hudson, B., Moon, T., Catania, G. A., Shroyer, E. L., et al. (2016). The Impact of Glacier Geometry on Meltwater Plume Structure and Submarine Melt in Greenland Fjords. Geophys. Res. Lett. 43, 9739–9748. doi:10.1002/2016GL070170
Carroll, D., Sutherland, D. A., Shroyer, E. L., Nash, J. D., Catania, G. A., and Stearns, L. A. (2015). Modeling Turbulent Subglacial Meltwater Plumes: Implications for Fjord-Scale Buoyancy-Driven Circulation. J. Phys. Oceanogr. 45, 2169–2185. doi:10.1175/JPO-D-15-0033.1
Cauvy-Fraunié, S., and Dangles, O. (2019). A Global Synthesis of Biodiversity Responses to Glacier Retreat. Nat. Ecol. Evol. 3, 1675–1685. doi:10.1038/s41559-019-1042-8
Coale, K. H. (1991). Effects of Iron, Manganese, Copper, and Zinc Enrichments on Productivity and Biomass in the Subarctic Pacific. Limnol. Oceanogr. 36, 1851–1864. doi:10.4319/lo.1991.36.8.1851
Cowan, E. A., and Powell, R. D. (1990). Suspended Sediment Transport and Deposition of Cyclically Interlaminated Sediment in a Temperate Glacial Fjord, Alaska, U.S.A. Geol. Soc. Lond. Spec. Publications 53, 75–89. doi:10.1144/GSL.SP.1990.053.01.04
Cowton, T., Slater, D., Sole, A., Goldberg, D., and Nienow, P. (2015). Modeling the Impact of Glacial Runoff on Fjord Circulation and Submarine Melt Rate Using a New Subgrid‐scale Parameterization for Glacial Plumes. J. Geophys. Res. Oceans 120, 796–812. doi:10.1002/2014JC010324
Crusius, J., Schroth, A. W., Resing, J. A., Cullen, J., and Campbell, R. W. (2017). Seasonal and Spatial Variabilities in Northern Gulf of Alaska Surface Water Iron Concentrations Driven by Shelf Sediment Resuspension, Glacial Meltwater, a Yakutat Eddy, and Dust. Glob. Biogeochem. Cycles 31, 942–960. doi:10.1002/2016GB005493
Cutter, G. A., and Bruland, K. W. (2012). Rapid and Noncontaminating Sampling System for Trace Elements in Global Ocean Surveys. Limnol. Oceanogr. Methods 10, 425–436. doi:10.4319/lom.2012.10.425
Dierssen, H. M., Smith, R. C., and Vernet, M. (2002). Glacial Meltwater Dynamics in Coastal Waters West of the Antarctic peninsula. Proc. Natl. Acad. Sci. 99, 1790–1795. doi:10.1073/pnas.032206999
Dinniman, M. S., St‐Laurent, P., Arrigo, K. R., Hofmann, E. E., and Dijken, G. L. (2020). Analysis of Iron Sources in Antarctic continental Shelf Waters. J. Geophys. Res. Oceans 125, e2019JC015736. doi:10.1029/2019jc015736
Downs, T. M., Schallenberg, M., and Burns, C. W. (2008). Responses of lake Phytoplankton to Micronutrient Enrichment: A Study in Two New Zealand Lakes and an Analysis of Published Data. Aquat. Sci. 70, 347–360. doi:10.1007/s00027-008-8065-6
Duprat, L., Corkill, M., Genovese, C., Townsend, A. T., Moreau, S., Meiners, K. M., et al. (2020). Nutrient Distribution in East Antarctic Summer Sea Ice: A Potential Iron Contribution from Glacial Basal Melt. J. Geophys. Res. Oceans 125, e2020JC016130. doi:10.1029/2020JC016130
Edwards, R., Sedwick, P., Morgan, V., and Boutron, C. (2006). Iron in Ice Cores from Law Dome: A Record of Atmospheric Iron Deposition for Maritime East Antarctica during the Holocene and Last Glacial Maximum. Geochem. Geophys. Geosyst. 7, a–n. doi:10.1029/2006gc001307
Falk, U., Gieseke, H., Kotzur, F., and Braun, M. (2016). Monitoring Snow and Ice Surfaces on King George Island, Antarctic Peninsula, with High-Resolution TerraSAR-X Time Series. Antarctic Sci. 28, 135–149. doi:10.1017/S0954102015000577
Forsch, K., Hahn-Woernle, L., Sherrell, R., Roccanova, J., Bu, K., Burdige, D., et al. (2021). Seasonal Dispersal of Fjord Meltwaters as an Important Source of Iron to Coastal Antarctic Phytoplankton. Biogeosciences Discuss. 2021, 1–49. doi:10.5194/bg-2021-79
GEM 2021 The Greenland Ecosystem Monitoring (GEM) Database Available at: https://data.g-e-m.dk/.
Gerringa, L. J. A., Alderkamp, A.-C., Laan, P., Thuróczy, C.-E., De Baar, H. J. W., Mills, M. M., et al. (2012). Iron from Melting Glaciers Fuels the Phytoplankton Blooms in Amundsen Sea (Southern Ocean): Iron Biogeochemistry. Deep Sea Res. Part Topical Stud. Oceanography 71-76, 16–31. doi:10.1016/j.dsr2.2012.03.007
Gerringa, L. J. A., Rijkenberg, M. J. A., Slagter, H. A., Laan, P., Paffrath, R., Bauch, D., et al. (2021). Dissolved Cd, Co, Cu, Fe, Mn, Ni, and Zn in the Arctic Ocean. J. Geophys. Res. Oceans 126, e2021JC017323. doi:10.1029/2021JC017323
Hansen, H. P., and Koroleff, F. (1999). “Determination of Nutrients,” in Methods of Seawater Analysis. Editors K. Grasshoff, K. Kremling, and M. Ehrhardt Wiley-VCH Verlag GmbH, 159–228.
Hastie, T., and Tibshirani, R. (2014). Generalized Additive Models. Wiley StatsRef Stat. Ref. Online. doi:10.1002/9781118445112.stat03141
Hawkings, J. R., Skidmore, M. L., Wadham, J. L., Priscu, J. C., Morton, P. L., Hatton, J. E., et al. (2020). Enhanced Trace Element Mobilization by Earth's Ice Sheets. Proc. Natl. Acad. Sci. USA 117, 31648–31659. doi:10.1073/pnas.2014378117
Henley, S. F., Tuerena, R. E., Annett, A. L., Fallick, A. E., Meredith, M. P., Venables, H. J., et al. (2017). Macronutrient Supply, Uptake and Recycling in the Coastal Ocean of the West Antarctic Peninsula. Deep Sea Res. Part Topical Stud. Oceanography 139, 58–76. doi:10.1016/j.dsr2.2016.10.003
Hodson, A., Nowak, A., Sabacka, M., Jungblut, A., Navarro, F., Pearce, D., et al. (2017). Climatically Sensitive Transfer of Iron to Maritime Antarctic Ecosystems by Surface Runoff. Nat. Commun. 8, 14499. doi:10.1038/ncomms14499
Höfer, J., Giesecke, R., Hopwood, M. J., Carrera, V., Alarcón, E., and González, H. E. (2019). The Role of Water Column Stability and Wind Mixing in the Production/export Dynamics of Two Bays in the Western Antarctic Peninsula. Prog. Oceanography 174, 105–116. doi:10.1016/j.pocean.2019.01.005
Holding, J. M., Markager, S., Juul-Pedersen, T., Paulsen, M. L., Møller, E. F., Meire, L., et al. (2019). Seasonal and Spatial Patterns of Primary Production in a High-Latitude Fjord Affected by Greenland Ice Sheet Run-Off. Biogeosciences 16, 3777–3792. doi:10.5194/bg-16-3777-2019
Holland, D. M., and Jenkins, A. (1999). Modeling Thermodynamic Ice-Ocean Interactions at the Base of an Ice Shelf. J. Phys. Oceanogr. 29, 1787–1800. doi:10.1175/1520-0485(1999)029<1787:mtioia>2.0.co;2
Holmes, T. M., Wuttig, K., Chase, Z., van der Merwe, P., Townsend, A. T., Schallenberg, C., et al. (2019). Iron Availability Influences Nutrient Drawdown in the Heard and McDonald Islands Region, Southern Ocean. Mar. Chem. 211, 1–14. doi:10.1016/j.marchem.2019.03.002
Hopwood, M. J., Carroll, D., Browning, T. J., Meire, L., Mortensen, J., Krisch, S., et al. (2018). Non-linear Response of Summertime marine Productivity to Increased Meltwater Discharge Around Greenland. Nat. Commun. 9, 3256. doi:10.1038/s41467-018-05488-8
Hopwood, M. J., Carroll, D., Dunse, T., Hodson, A., Holding, J. M., Iriarte, J. L., et al. (2020). Review Article: How Does Glacier Discharge Affect marine Biogeochemistry and Primary Production in the Arctic. The Cryosphere 14, 1347–1383. doi:10.5194/tc-14-1347-2020
Hopwood, M. J., Connelly, D. P., Arendt, K. E., Juul-Pedersen, T., Stinchcombe, M. C., Meire, L., et al. (2016). Seasonal Changes in Fe along a Glaciated Greenlandic Fjord. Front. Earth Sci. 4. doi:10.3389/feart.2016.00015
Jenkins, A. (2011). Convection-Driven Melting Near the Grounding Lines of Ice Shelves and Tidewater Glaciers. J. Phys. Oceanogr. 41, 2279–2294. doi:10.1175/JPO-D-11-03.1
Juul-Pedersen, T., Arendt, K., Mortensen, J., Blicher, M., Søgaard, D., and Rysgaard, S. (2015). Seasonal and Interannual Phytoplankton Production in a Sub-arctic Tidewater Outlet Glacier Fjord, SW Greenland. Mar. Ecol. Prog. Ser. 524, 27–38. doi:10.3354/meps11174
Kanna, N., Sugiyama, S., Fukamachi, Y., Nomura, D., and Nishioka, J. (2020). Iron Supply by Subglacial Discharge into a Fjord Near the Front of a Marine‐Terminating Glacier in Northwestern Greenland. Glob. Biogeochem. Cycles 34, e2020GB006567. doi:10.1029/2020GB006567
Kanna, N., Sugiyama, S., Ohashi, Y., Sakakibara, D., Fukamachi, Y., and Nomura, D. (2018). Upwelling of Macronutrients and Dissolved Inorganic Carbon by a Subglacial Freshwater Driven Plume in Bowdoin Fjord, Northwestern Greenland. J. Geophys. Res. Biogeosci. 123, 1666–1682. doi:10.1029/2017JG004248
Kim, H., Ducklow, H. W., Abele, D., Ruiz Barlett, E. M., Buma, A. G. J., Meredith, M. P., et al. (2018). Inter-decadal Variability of Phytoplankton Biomass along the Coastal West Antarctic Peninsula. Phil. Trans. R. Soc. A. 376, 20170174. doi:10.1098/rsta.2017.0174
Krawczyk, D. W., Witkowski, A., Juul-Pedersen, T., Arendt, K. E., Mortensen, J., and Rysgaard, S. (2015). Microplankton Succession in a SW Greenland Tidewater Glacial Fjord Influenced by Coastal Inflows and Run-Off from the Greenland Ice Sheet. Polar Biol. 38, 1515–1533. doi:10.1007/s00300-015-1715-y
Krisch, S., Browning, T. J., Graeve, M., Ludwichowski, K.-U., Lodeiro, P., Hopwood, M. J., et al. (2020). The Influence of Arctic Fe and Atlantic Fixed N on Summertime Primary Production in Fram Strait, North Greenland Sea. Sci. Rep. 10, 15230. doi:10.1038/s41598-020-72100-9
Krisch, S., Hopwood, M. J., Schaffer, J., Al-Hashem, A., Höfer, J., Rutgers van der Loeff, M. M., et al. (2021). The 79°N Glacier Cavity Modulates Subglacial Iron export to the NE Greenland Shelf. Nat. Commun., 12. 3030. doi:10.1038/s41467-021-23093-0
Laufer-Meiser, K., Michaud, A. B., Maisch, M., Byrne, J. M., Kappler, A., Patterson, M. O., et al. (2021). Potentially Bioavailable Iron Produced through Benthic Cycling in Glaciated Arctic Fjords of Svalbard. Nat. Commun. 12, 1349. doi:10.1038/s41467-021-21558-w
Lippiatt, S. M., Lohan, M. C., and Bruland, K. W. (2010). The Distribution of Reactive Iron in Northern Gulf of Alaska Coastal Waters. Mar. Chem. 121, 187–199. doi:10.1016/j.marchem.2010.04.007
Lis, H., Shaked, Y., Kranzler, C., Keren, N., and Morel, F. M. M. (2015). Iron Bioavailability to Phytoplankton: An Empirical Approach. ISME J. 9, 1003–1013. doi:10.1038/ismej.2014.199
Liu, X., and Millero, F. J. (2002). The Solubility of Iron in Seawater. Mar. Chem. 77, 43–54. doi:10.1016/s0304-4203(01)00074-3
Mankoff, K. D., Noël, B., Fettweis, X., Ahlstrøm, A. P., Colgan, W., Kondo, K., et al. (2020). Greenland Liquid Water Discharge from 1958 through 2019. Earth Syst. Sci. Data 12, 2811–2841. doi:10.5194/essd-12-2811-2020
Mark Moore, C., Mills, M. M., Achterberg, E. P., Geider, R. J., LaRoche, J., Lucas, M. I., et al. (2009). Large-scale Distribution of Atlantic Nitrogen Fixation Controlled by Iron Availability. Nat. Geosci 2, 867–871. doi:10.1038/ngeo667
Markussen, T. N., Elberling, B., Winter, C., and Andersen, T. J. (2016). Flocculated Meltwater Particles Control Arctic Land-Sea Fluxes of Labile Iron. Sci. Rep. 6, 24033. doi:10.1038/srep24033
Marsay, C. M., Barrett, P. M., McGillicuddy, D. J., and Sedwick, P. N. (2017). Distributions, Sources, and Transformations of Dissolved and Particulate Iron on the R Oss S Ea continental Shelf during Summer. J. Geophys. Res. Oceans 122, 6371–6393. doi:10.1002/2017JC013068
Martin, J. H., and Fitzwater, S. E. (1988). Iron Deficiency Limits Phytoplankton Growth in the north-east Pacific Subarctic. Nature 331, 341–343. doi:10.1038/331341a0
Martin, J. H., Gordon, R. M., and Fitzwater, S. E. (1990). Iron in Antarctic Waters. Nature 345, 156–158. doi:10.1038/345156a0
Meire, L., Meire, P., Struyf, E., Krawczyk, D. W., Arendt, K. E., Yde, J. C., et al. (2016a). High export of Dissolved Silica from the Greenland Ice Sheet. Geophys. Res. Lett. 43, 9173–9182. doi:10.1002/2016GL070191
Meire, L., Mortensen, J., Meire, P., Juul-Pedersen, T., Sejr, M. K., Rysgaard, S., et al. (2017). Marine-terminating Glaciers Sustain High Productivity in Greenland Fjords. Glob. Change Biol. 23, 5344–5357. doi:10.1111/gcb.13801
Meire, L., Mortensen, J., Rysgaard, S., Bendtsen, J., Boone, W., Meire, P., et al. (2016b). Spring Bloom Dynamics in a Subarctic Fjord Influenced by Tidewater Outlet Glaciers (Godthåbsfjord, SW Greenland). J. Geophys. Res. Biogeosci. 121, 1581–1592. doi:10.1002/2015JG003240
Meredith, M. P., Falk, U., Bers, A. V., Mackensen, A., Schloss, I. R., Ruiz Barlett, E., et al. (2018). Anatomy of a Glacial Meltwater Discharge Event in an Antarctic cove. Phil. Trans. R. Soc. A. 376, 20170163. doi:10.1098/rsta.2017.0163
Meredith, M., Sommerkorn, M., Cassotta, S., Derksen, C., Ekaykin, A., Hollowed, A., et al. (2019). “Polar Regions,” in IPCC Special Report on the Ocean and Cryosphere in a Changing Climate.
Monien, D., Monien, P., Brünjes, R., Widmer, T., Kappenberg, A., Silva Busso, A. A., et al. (2017). Meltwater as a Source of Potentially Bioavailable Iron to Antarctica Waters. Antarctic Sci. 29, 277–291. doi:10.1017/S095410201600064X
Monien, P., Lettmann, K. A., Monien, D., Asendorf, S., Wölfl, A.-C., Lim, C. H., et al. (2014). Redox Conditions and Trace Metal Cycling in Coastal Sediments from the Maritime Antarctic. Geochimica et Cosmochimica Acta 141, 26–44. doi:10.1016/j.gca.2014.06.003
Moore, C. M., Mills, M. M., Arrigo, K. R., Berman-Frank, I., Bopp, L., Boyd, P. W., et al. (2013). Processes and Patterns of Oceanic Nutrient Limitation. Nat. Geosci 6, 701–710. doi:10.1038/ngeo1765
Mortensen, J., Bendtsen, J., Lennert, K., and Rysgaard, S. (2014). Seasonal Variability of the Circulation System in a West Greenland Tidewater Outlet Glacier Fjord, Godthåbsfjord (64°N). J. Geophys. Res. Earth Surf. 119, 2591–2603. doi:10.1002/2014JF003267
Mortensen, J., Bendtsen, J., Motyka, R. J., Lennert, K., Truffer, M., Fahnestock, M., et al. (2013). On the Seasonal Freshwater Stratification in the Proximity of Fast-Flowing Tidewater Outlet Glaciers in a Sub-arctic Sill Fjord. J. Geophys. Res. Oceans 118, 1382–1395. doi:10.1002/jgrc.20134
Mortensen, J., Lennert, K., Bendtsen, J., and Rysgaard, S. (2011). Heat Sources for Glacial Melt in a Sub-arctic Fjord (Godthåbsfjord) in Contact with the Greenland Ice Sheet. J. Geophys. Res. 116, C01013. doi:10.1029/2010jc006528
Mortensen, J., Rysgaard, S., Bendtsen, J., Lennert, K., Kanzow, T., Lund, H., et al. (2020). Subglacial Discharge and its Down‐Fjord Transformation in West Greenland Fjords with an Ice Mélange. J. Geophys. Res. Oceans 125, e2020JC016301. doi:10.1029/2020JC016301
Morton, B. R., Taylor, G., and Turner, J. S. (1956). Turbulent Gravitational Convection from Maintained and Instantaneous Sources. Proc. R. Soc. Lond. A. 234, 1–23. doi:10.1098/rspa.1956.0011
Nielsen, T., and Hansen, B. (1995). Plankton Community Structure and Carbon Cycling on the Western Coast of Greenland during and after the Sedimentation of a Diatom Bloom. Mar. Ecol. Prog. Ser. 125, 239–257. doi:10.3354/meps125239
Oksanen, J., Blanchet, F. G., Friendly, M., Kindt, R., Legendre, P., McGlinn, D., et al. (2020). Vegan: Community Ecology Package.
Oliver, H., Castelao, R. M., Wang, C., and Yager, P. L. (2020). Meltwater‐Enhanced Nutrient Export from Greenland's Glacial Fjords: A Sensitivity Analysis. J. Geophys. Res. Oceans 125, e2020JC016185. doi:10.1029/2020JC016185
Overeem, I., Hudson, B. D., Syvitski, J. P. M., Mikkelsen, A. B., Hasholt, B., van den Broeke, M. R., et al. (2017). Substantial export of Suspended Sediment to the Global Oceans from Glacial Erosion in Greenland. Nat. Geosci 10, 859–863. doi:10.1038/NGEO3046
Pan, B. J., Vernet, M., Manck, L., Forsch, K., Ekern, L., Mascioni, M., et al. (2020). Environmental Drivers of Phytoplankton Taxonomic Composition in an Antarctic Fjord. Prog. Oceanography 183, 102295. doi:10.1016/j.pocean.2020.102295
Prospero, J. M., Bullard, J. E., and Hodgkins, R. (2012). High-Latitude Dust over the North Atlantic: Inputs from Icelandic Proglacial Dust Storms. Science 335, 1078–1082. doi:10.1126/science.1217447
Raiswell, R., and Canfield, D. E. (2012). The Iron Biogeochemical Cycle Past and Present. GeochemPersp 1, 1–220. doi:10.7185/geochempersp.1.1
Randelhoff, A., Holding, J., Janout, M., Sejr, M. K., Babin, M., Tremblay, J.-É., et al. (2020). Pan-Arctic Ocean Primary Production Constrained by Turbulent Nitrate Fluxes. Front. Mar. Sci. 7. doi:10.3389/fmars.2020.00150
Rapp, I., Schlosser, C., Rusiecka, D., Gledhill, M., and Achterberg, E. P. (2017). Automated Preconcentration of Fe, Zn, Cu, Ni, Cd, Pb, Co, and Mn in Seawater with Analysis Using High-Resolution Sector Field Inductively-Coupled Plasma Mass Spectrometry. Analytica Chim. Acta 976, 1–13. doi:10.1016/j.aca.2017.05.008
Raven, J. A., Evans, M. C. W., and Korb, R. E. (1999). The Role of Trace Metals in Photosynthetic Electron Transport in O2-Evolving Organisms. Photosynth. Res. 60, 111–150. doi:10.1023/a:1006282714942
Saito, M. A., Rocap, G., and Moffett, J. W. (2005). Production of Cobalt Binding Ligands in a Synechococcus Feature at the Costa Rica Upwelling Dome. Limnol. Oceanogr. 50, 279–290. doi:10.4319/lo.2005.50.1.0279
Sarmiento, J. L., Gruber, N., Brzezinski, M. A., and Dunne, J. P. (2004). High-latitude Controls of Thermocline Nutrients and Low Latitude Biological Productivity. Nature 427, 56–60. doi:10.1038/nature02127
Sarthou, G., Lherminier, P., Achterberg, E. P., Alonso-Pérez, F., Bucciarelli, E., Boutorh, J., et al. (2018). Introduction to the French GEOTRACES North Atlantic Transect (GA01): GEOVIDE Cruise. Biogeosciences 15, 7097–7109. doi:10.5194/bg-15-7097-2018
Schaffer, J., Kanzow, T., von Appen, W.-J., von Albedyll, L., Arndt, J. E., and Roberts, D. H. (2020). Bathymetry Constrains Ocean Heat Supply to Greenland's Largest Glacier Tongue. Nat. Geosci. 13, 227–231. doi:10.1038/s41561-019-0529-x
Schloss, I. R., Ferreyra, G. A., and Ruiz-Pino, D. (2002). Phytoplankton Biomass in Antarctic Shelf Zones: a Conceptual Model Based on Potter Cove, King George Island. J. Mar. Syst. 36, 129–143. doi:10.1016/S0924-7963(02)00183-5
Schroth, A. W., Crusius, J., Hoyer, I., and Campbell, R. (2014). Estuarine Removal of Glacial Iron and Implications for Iron Fluxes to the Ocean. Geophys. Res. Lett. 41, 3951–3958. doi:10.1002/2014GL060199
Shaked, Y., and Lis, H. (2012). Disassembling Iron Availability to Phytoplankton. Front. Microbio. 3, 123. doi:10.3389/fmicb.2012.00123
Shaw, T. J., Raiswell, R., Hexel, C. R., Vu, H. P., Moore, W. S., Dudgeon, R., et al. (2011). Input, Composition, and Potential Impact of Terrigenous Material from Free-Drifting Icebergs in the Weddell Sea. Deep Sea Res. Part Topical Stud. Oceanography 58, 1376–1383. doi:10.1016/j.dsr2.2010.11.012
Sherrell, R. M., Annett, A. L., Fitzsimmons, J. N., Roccanova, V. J., and Meredith, M. P. (2018). A 'shallow Bathtub Ring' of Local Sedimentary Iron Input Maintains the Palmer Deep Biological Hotspot on the West Antarctic Peninsula Shelf. Phil. Trans. R. Soc. A. 376, 20170171. doi:10.1098/rsta.2017.0171
Sherrell, R. M., Lagerström, M. E., Forsch, K. O., Stammerjohn, S. E., and Yager, P. L. (2015). Dynamics of Dissolved Iron and Other Bioactive Trace Metals (Mn, Ni, Cu, Zn) in the Amundsen Sea Polynya, Antarctica. Elem. Sci. Anthr. 3, 000071. doi:10.12952/journal.elementa.000071
Slater, D. A., Straneo, F., Felikson, D., Little, C. M., Goelzer, H., Fettweis, X., et al. (2019). Estimating Greenland Tidewater Glacier Retreat Driven by Submarine Melting. The Cryosphere 13, 2489–2509. doi:10.5194/tc-13-2489-2019
Sørensen, K., Korstgård, J. A., Glassley, W. E., and Møller Stensgaard, B. (2006). The Nordre Strømfjord Shear Zone and the Arfersiorfik Quartz Diorite in Arfersiorfik, the Nagssugtoqidian Orogen, West Greenland. GEUS Bull. 11, 145–162. doi:10.34194/geusb.v11.4922
St‐Laurent, P., Yager, P. L., Sherrell, R. M., Stammerjohn, S. E., and Dinniman, M. S. (2017). Pathways and Supply of Dissolved Iron in the Amundsen Sea (Antarctica). J. Geophys. Res. Oceans 122, 7135–7162. doi:10.1002/2017JC013162
Statham, P. J., Skidmore, M., and Tranter, M. (2008). Inputs of Glacially Derived Dissolved and Colloidal Iron to the Coastal Ocean and Implications for Primary Productivity. Glob. Biogeochem. Cycles 22. Gb3013. doi:10.1029/2007gb003106
Stevenson, E. I., Fantle, M. S., Das, S. B., Williams, H. M., and Aciego, S. M. (2017). The Iron Isotopic Composition of Subglacial Streams Draining the Greenland Ice Sheet. Geochimica et Cosmochimica Acta 213, 237–254. doi:10.1016/j.gca.2017.06.002
Straneo, F., and Cenedese, C. (2015). The Dynamics of Greenland's Glacial Fjords and Their Role in Climate. Annu. Rev. Mar. Sci. 7, 89–112. doi:10.1146/annurev-marine-010213-135133
Tagliabue, A., Bowie, A. R., Boyd, P. W., Buck, K. N., Johnson, K. S., and Saito, M. A. (2017). The Integral Role of Iron in Ocean Biogeochemistry. Nature 543, 51–59. doi:10.1038/nature21058
Thuróczy, C.-E., Alderkamp, A.-C., Laan, P., Gerringa, L. J. A., Mills, M. M., Van Dijken, G. L., et al. (2012). Key Role of Organic Complexation of Iron in Sustaining Phytoplankton Blooms in the Pine Island and Amundsen Polynyas (Southern Ocean). Deep Sea Res. Part Topical Stud. Oceanography 71-76, 49–60. doi:10.1016/j.dsr2.2012.03.009
Tonnard, M., Planquette, H., Bowie, A. R., van der Merwe, P., Gallinari, M., Desprez de Gésincourt, F., et al. (2020). Dissolved Iron in the North Atlantic Ocean and Labrador Sea along the GEOVIDE Section (GEOTRACES Section GA01). Biogeosciences 17, 917–943. doi:10.5194/bg-2018-14710.5194/bg-17-917-2020
Twining, B. S., and Baines, S. B. (2013). The Trace Metal Composition of Marine Phytoplankton. Annu. Rev. Mar. Sci. 5, 191–215. doi:10.1146/annurev-marine-121211-172322
Vernet, M., Martinson, D., Iannuzzi, R., Stammerjohn, S., Kozlowski, W., Sines, K., et al. (2008). Primary Production within the Sea-Ice Zone West of the Antarctic Peninsula: I-Sea Ice, Summer Mixed Layer, and Irradiance. Deep Sea Res. Part Topical Stud. Oceanography 55, 2068–2085. doi:10.1016/j.dsr2.2008.05.021
Waeles, M., Riso, R. D., and Le Corre, P. (2005). Seasonal Variations of Dissolved and Particulate Copper Species in Estuarine Waters. Estuarine, Coastal Shelf Sci. 62, 313–323. doi:10.1016/j.ecss.2004.09.019
Wehrmann, L. M., Formolo, M. J., Owens, J. D., Raiswell, R., Ferdelman, T. G., Riedinger, N., et al. (2014). Iron and Manganese Speciation and Cycling in Glacially Influenced High-Latitude Fjord Sediments (West Spitsbergen, Svalbard): Evidence for a Benthic Recycling-Transport Mechanism. Geochimica et Cosmochimica Acta 141, 628–655. doi:10.1016/j.gca.2014.06.007
Whittaker, S., Bidle, K. D., Kustka, A. B., and Falkowski, P. G. (2011). Quantification of Nitrogenase in Trichodesmium IMS 101: Implications for Iron Limitation of Nitrogen Fixation in the Ocean. Environ. Microbiol. Rep. 3, 54–58. doi:10.1111/j.1758-2229.2010.00187.x
Windom, H., Byrd, J., Smith, R., Hungspreugs, M., Dharmvanij, S., Thumtrakul, W., et al. (1991). Trace Metal-Nutrient Relationships in Estuaries. Mar. Chem. 32, 177–194. doi:10.1016/0304-4203(91)90037-W
Windom, H., Wallace, G., Smith, R., Dudek, N., Maeda, M., Dulmage, R., et al. (1983). Behavior of Copper in southeastern United States Estuaries. Mar. Chem. 12, 183–193. doi:10.1016/0304-4203(83)90079-8
Wood, S. N. (2011). Fast Stable Restricted Maximum Likelihood and Marginal Likelihood Estimation of Semiparametric Generalized Linear Models. J. R. Stat. Soc. Ser. B (Statistical Methodol. 73, 3–36. doi:10.1111/j.1467-9868.2010.00749.x
Keywords: iron, copper, nickel, cobalt, glacier, fjord, Arctic, Antarctic
Citation: Krause J, Hopwood MJ, Höfer J, Krisch S, Achterberg EP, Alarcón E, Carroll D, González HE, Juul-Pedersen T, Liu T, Lodeiro P, Meire L and Rosing MT (2021) Trace Element (Fe, Co, Ni and Cu) Dynamics Across the Salinity Gradient in Arctic and Antarctic Glacier Fjords. Front. Earth Sci. 9:725279. doi: 10.3389/feart.2021.725279
Received: 16 June 2021; Accepted: 13 September 2021;
Published: 27 September 2021.
Edited by:
Jon Telling, Newcastle University, United KingdomReviewed by:
Jon Hawkings, Florida State University, United StatesElizabeth Bagshaw, Cardiff University, United Kingdom
Copyright © 2021 Krause, Hopwood, Höfer, Krisch, Achterberg, Alarcón, Carroll, González, Juul-Pedersen, Liu, Lodeiro, Meire and Rosing. This is an open-access article distributed under the terms of the Creative Commons Attribution License (CC BY). The use, distribution or reproduction in other forums is permitted, provided the original author(s) and the copyright owner(s) are credited and that the original publication in this journal is cited, in accordance with accepted academic practice. No use, distribution or reproduction is permitted which does not comply with these terms.
*Correspondence: Mark J. Hopwood, bWFya0BzdXN0ZWNoLmVkdS5jbg==