 Penghui Ma
 Jianqi Zhuang
 Xinghua Zhu
 Yuxiang Cheng
- College of Geological Engineering and Surveying of Chang’an University/Key Laboratory of Western China Mineral Resources and Geological Engineering, Xi’an, China
Loess has a strong water sensitivity, so loess landslides often transform into loess mudflows when water is added on the Chinese Loess Plateau, which results in high casualties and property loss of the Chinese government. In this study, a series of flume tests were designed to study the initiation of loess mudflows. The results reveal that the initiation modes of loess mudflows include large-scale mudflow and retrogressive toe sliding (Type A), and small-scale mudflow and retrogressive toe sliding (Type B). A model was used to analyze the test results that describe the effects of water flow on the potential for hillslope failure and liquefaction. It was found that the soil accumulation was unconditionally stable before a loess mudflow was formed, but as the rainfall continued, the water gradually infiltrated the soil, and the soil accumulation changed from unconditionally stable to unconditionally unstable. Thus, this led to different initiation modes during the tests. For Type A, the water preferentially infiltrated into the area with an uneven density and a large amount of water accumulated. The pore water pressure increased quickly and could not dissipate in time, so the loess liquefied. As the liquefaction area continued to expand and became larger, Type A occurred. Relatively speaking, Type B occurs in soil accumulations with relatively uniform densities. These results provide a certain scientific reference for the study of loess mudflows.
Introduction
Loess is widely distributed over about 6.3 × 10⁵ km2 in China (Liu, 1985; Ma et al., 2019a). At present, loess landslides occur frequently in the loess area in China. Field investigations have revealed that from 1950 to 1992, a total of 14,109 loess landslides occurred on the Chinese Loess Plateau, with a distribution density of greater than 6/km2 (Zhuang and Peng, 2014). The loess landslides in Shanxi Province account for about one third of the landslides on the Chinese Loess Plateau, causing huge casualties and property loss of the Chinese government (Zhou et al., 2002; Peng et al., 2019).
Loess mudflows are a special type of landslide. There are many joints exposed on the surface of loess, and its structure is loose and porous. The strength of natural dry loess is very high, and it has a good uprightness. However, loess is prone to collapse, softening, and even deformation as its water content increases, and water is the most important inducing factor of loess geohazards (Xu et al., 2013; Zhang et al., 2013; Fan et al., 2017; Peng et al., 2018; Pu et al., 2021), In addition, as with sand, loess can also undergo liquefaction. A high pore water pressure can be produced quickly and will not dissipated in a short time period, and thus, the soil’s strength drops quickly, and the soil body liquefies and flows like water (Pei et al., 2017; Peng et al., 2018; Ma et al., 2019b). Therefore, sometimes, loess landslides can transform into loess mudflows due to liquefaction of the loess. At present, loess mudflows occur frequently on the Chinese Loess Plateau, and they have become the most catastrophic and influential loess disaster (Zhang et al., 2019).
Compared with traditional loess landslides, loess mudflows exhibit fluid movement, so a loess mudflow has a greater mobility and a wider accumulation range, leading to greater danger (Leng et al., 2018; Zha et al., 2019). A large number of field investigations have shown that the motion characteristics of loess mudflows mainly include the following aspects. 1) The flow distance is long. According to the statistics of landslide movement distance on the Heifangtai Platform, Gansu Province, China, the average apparent friction angle of the loess landslides is 0.53. However, once a loess landslide is transformed into a mudflow, its average apparent friction angle is about 0.3 (Peng et al., 2018; Ma et al., 2019a). The statistics of the loess landslides on the Jingyang South Platform show that once a loess landslide transforms into a loess mudflow, the average apparent friction angle is 0.185, or about 10.5°, which is close to the critical apparent friction angle (10°) of loess landslide caused by the liquefaction of loess (Ma et al., 2019a). Thus, the movement distance of a loess mudflow is far greater than that of a traditional loess landslide. 2) The movement speed is large (Peng et al., 2015). According to the statistics of loess mudflows in Tianshui City, China, in the movement of a loess landslide, once the loess experiences liquefaction and transforms into a loess mudflow, its movement speed will increase sharply, and the maximum speed will reach about 8 m/s. For example, a large landslide occurred on Salle Mountain, Gansu Province, China, in 1983, and then, it transformed into a mudflow. The maximum peak velocity was about 15 m/s, and the velocity was very high, i.e., much higher than that of a loess landslide (Zhang et al., 2002; Kang et al., 2018). Therefore, ascertaining the initiation mechanisms of loess mudflows has great significance for geohazards prevention and mitigation on the Loess Plateau.
As the most disastrous geological hazard on the Chinese Loess Plateau, the initiation mechanisms of loess mudflows have been seldom been studied over the years when investigating loess geological hazards in China. Based on the initiation characteristics of the loess mudflows on the Chinese Loess Plateau, in this study relevant flume tests were designed to investigate the modes and initiation mechanisms of loess mudflows in order to provide a scientific basis for scientific research on loess mudflows.
Loess Mudflows on the Chinese Loess Plateau
The Loess Plateau has evolved landforms, including loess platforms, beams, and hills (Loess yuan, Liang, and Mao in Chinese) (Liu, 1985; Ma et al., 2019a). Generally speaking, loess mudflows often occur in loess gullies and on the edges of loess platforms (Yuan et al., 2015; Peng et al., 2019).
For the loess mudflows in gullies, the gully is generally steep in the upper reaches of the channel. The upstream area is relatively open and has a wide catchment area, which is conducive to the collection of mudflow sources. Figure 1 shows a loess mudflow that occurred near Dagou Village in Tianshui City, China, in 2013. The sliding body quickly transformed into a loess mudflow during the movement process. The flow distance was more than 1 km, and it destroyed more than 10 houses in the village (Figure 1A). Field investigations revealed that the gully was V-shaped with a large channel gradient. The slope on both sides of the ditch was steep, with a gradient of 35–50°, which provided a potential source for the loess mudflow (Figures 1A–C). According to the meteorological data, heavy rainfall occurred before the loess mudflow. Due to the infiltration of a large amount of rainwater, the debris started to form a loess mudflow. The loess mudflow entrained a large amount of loose deposits on the surface of the channel throughout the entire movement process, causing the scale of the mudflow to increase continuously (Figure 1) (Peng et al., 2015).
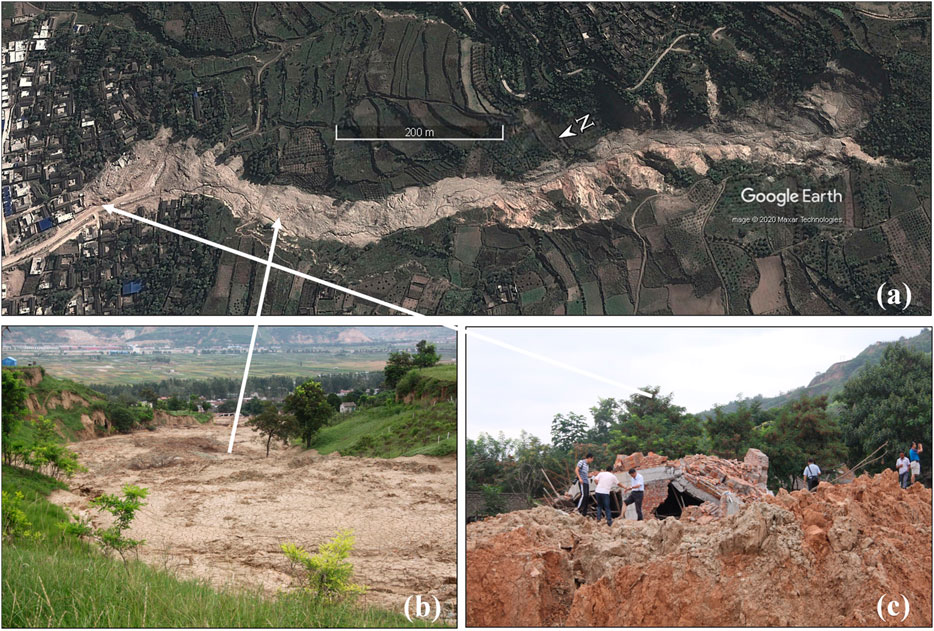
FIGURE 1. A loess mudflow that occurred near Dagou Village, Tianshui City, China. (A) View of the entire loess mudflow; (B) Accumulation characteristics; (C) House destruction.
Loess mudflows that occur on the edges of loess platforms always require the landslide substrate is always flat, which is suitable for loess mudflow moving with a high speed (Peng et al., 2018; Ma et al., 2019b). The Jingyang South Platform and the Heifangtai Platform are both typical platforms in China. There are many sites which observed slides multiple times in these two platforms. Lots of previous landsliding materials deposits at the foot of the slope, which would trigger a loess mudflow when a large amount of water infiltrate into the materials. For example, a loess mudflow occurred in Jiangliu Village in the Jingyang South Platform on March 8, 2016. The volume of the sliding body was only about 2.0 × 10⁴ m3. However, the deposits turned loess mudflow like water with a sliding distance reached 260 m in a very short time. Another example, a loess mudflow occurred near Chenjia Village on the Heifangtai Platform, Gansu Province. Three loess mudflows occurred at the same location in 2015. These mudflows were all characterized by high-speeds, long runout distances, and liquefaction (Figure 2).
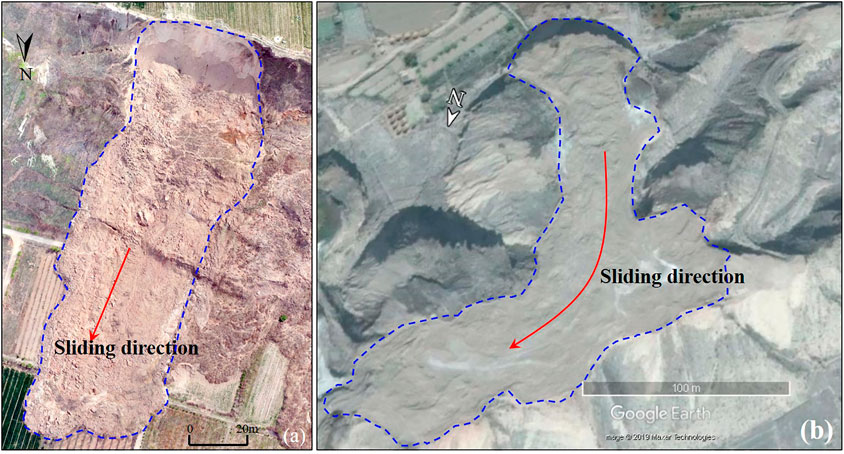
FIGURE 2. The characteristics of loess mudflows on loess platforms. (A) A loess mudflow that occurred near Jiangliu Village on March 9, 2016 on the South Jingyang Platform in Xi’an, China; (B) A loess mudflow occurred near Chenjia Village in 2015 on the Heifangtai Platform, Gansu.
Flume Tests
Flume Instrumentation
Flume tests were designed to study the initiation modes and mechanisms of loess mudflows. The flume used in the tests was 4 m long, 0.4 m wide, and 0.8 m deep. Both sides of the flume are constructed of tempered glass, which allows for observations of the entire initiation process of the loess mudflow. The bottom of the flume is equipped with a rough steel plate. The slope angle of the flume can be adjusted between 6° and 35°, which is sufficient for the experimental research requirements. The rainfall system can automatically lift and move to control its position and height. A voltage pump was installed in the rainfall system, which can automatically control the rainfall intensity, and the effective area of the rainfall can reach 150 × 50 cm2. Pore pressure sensors and water content sensors were arranged for the tests. The water content sensors were model-5TE produced by the American Decagon Company (Figure 3). The pore pressure sensors were produced by the Tianjin Aoyou Xingtong Company, China, with a measuring range of 0–50 kPa. The specific layout of the soil sensors is shown in Figure 4.
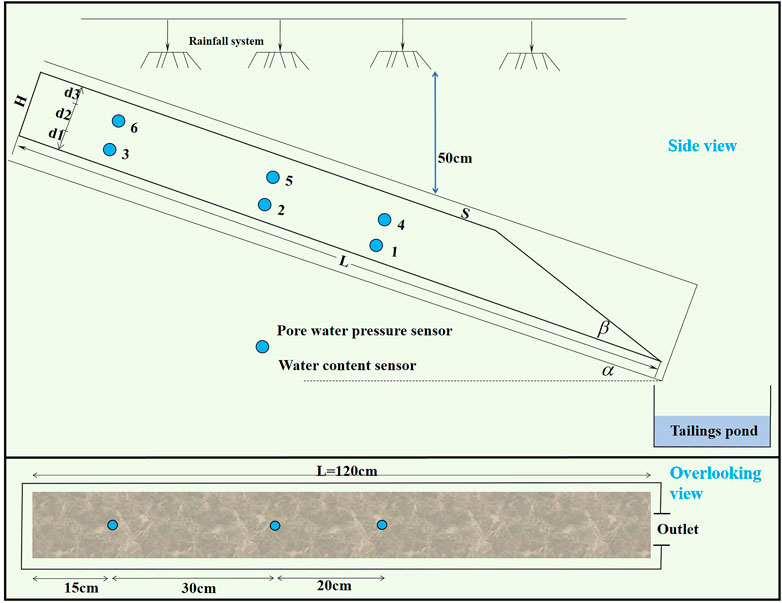
FIGURE 3. A sketch of the flume and its hydrological equipment.
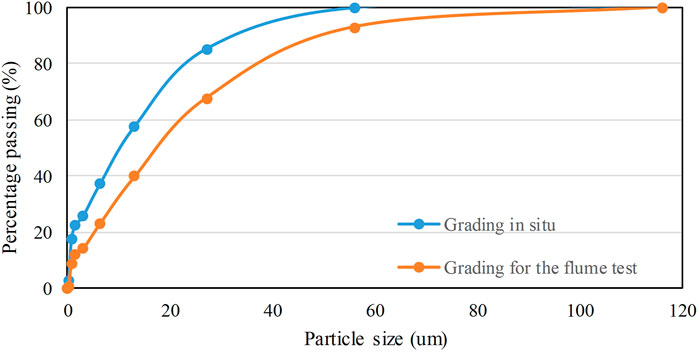
FIGURE 4. The grading of the in situ soil and the material used for the flume test.
Experimental Procedure
A series of different tests were set up by controlling the slope angle and rain intensity. We investigated the types of loess mudflows that occur on the Loess Plateau. The critical rain intensity on the Chinese Loess Plateau is mostly 100–220 mm/h, so the rainfall intensity in the tests was controlled between 100 and 220 mm/h (Peng et al., 2015) (Table 1). Because the South Jingyang Platform is one of the areas in China in which loess mudflows frequently occur, soil from the South Jingyang Platform was selected for the tests. Before the tests, the soil particles with diameters of >5 cm were eliminated. The particle size of the test soil and the particle size of the actual soil are shown in Figure 4. In the situ soil, particles less than 50 μm in diameter accounted for 98%, while those less than 75 μm in diameter accounted for 100%. In the material used for the flume test, particles less than 50 μm in diameter accounted for 90%, while those less than 75 μm in diameter accounted for 97%. They are relatively consistent, so the soil can be tested. According to statistics, the average apparent friction angle of loess mudflow on the South Platform is 0.185, or about 10.5°, and the average apparent friction angle of loess mudflow on the South Platform is 0.3, or about 17° (Peng et al., 2018; Ma et al., 2019b), so the slope angle of the accumulation was controlled between 10° and 20°. Before a test was carried out, it was necessary to test the roughness of the bottom of the flume and confirm whether it was necessary to increase the roughness in order to reduce the influence of the bottom boundary effect on the tests. According to the Manning formula, the roughness coefficient of the flume test was calculated to be 0.055 (Zhu et al., 2020). The loess used in the experiment has a higher silt and clay content, about 30%. Thus, there was no need to increase the roughness of the flume’s bottom during the tests (Table 1).
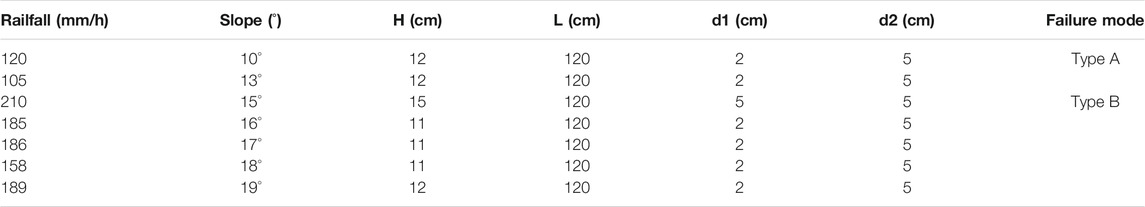
TABLE 1. An overview of the tests.
A total of seven sets of experiments were designed to study the initiation processes of loess mudflows. In the actual soil accumulation process, it is difficult to achieve homogenous parameters. Therefore, the dried bulk density of the seven groups of tests were controlled between 1.50 g/cm3 and 1.70 g/cm3. The water content of the seven sets of tests was controlled between 17.5 and 24.0%. In addition, the basic mechanical parameters of the soil were tested using relevant related geotechnical tests (Table 2). Altogether six pore water pressure sensors and six water content sensors were arranged in the soil accumulation (Figure 3). Before a test was carried out, the sensors and rainfall intensity were calibrated accurately.

TABLE 2. Parameter values of the materials.
Results and Discussion
By analyzing the video and data results of the seven groups of tests, it was found that there are two different initiation modes: large-scale mudflow and retrogressive toe sliding, and small-scale mudflow and retrogressive toe sliding.
Large-Scale Mudflow and Retrogressive Toe Sliding
Type A. When the test began, the water started to infiltrate gradually. Because the loess structure was loose and the initial volumetric water content of the loess was low, almost all of the rainfall infiltrated into the soil. The soil particles began to shrink and the porosity began to decrease. The soil accumulation underwent overall collapse and subsidence. The thickness of the soil in the toe part of the accumulation was thinner than that in other areas, so the water quickly penetrated to the bottom of the soil. The volumetric water content of the soil began to increase, and a small amount of sliding occurred at the toe part of the accumulation. The small amount of sliding at the toe part led to further loss of the accumulation’s support, and retrogressive compound loess mudflows constantly occurred at the toe part of the soil accumulation. As the rainfall continued to infiltrate into the soil, the soil accumulation underwent shear deformation as a whole and a potential shear zone began to form. Then, a loess mudflow (large scale) occurred (Table 3).
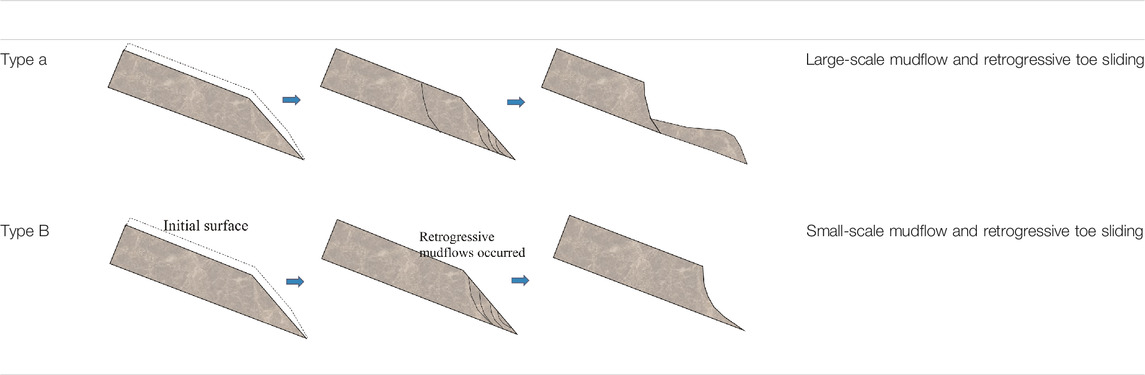
TABLE 3. Summarized failure modes.
The variations in the water content and pore water pressure of the soil in the test with a slope angle of 13° are shown in Figure 5. At 458 s, the volumetric water content at position six began to increase first. Then, the volumetric water content at position four began to increase at 488 s. The water contents at these two positions exceeded 40% of the original water content in a short time, and then, they began to increase slowly. The water content at position three began to increase at 1950 s, and the water content at position two began to increase at 2,580 s. The increase rate of the water content at these two positions was slow and then increased to the peak value. Comparatively speaking, the water content at position one began to increase at 2,670 s, rapidly increased to the peak value, and rapidly exceeded 60 percent of the original water content. Because position one is located at the bottom of the toe part of the soil accumulation, the rainfall infiltrated at position four in the shallow part of the soil accumulation first. The surrounding soil began to loosen, and then, the seepage channel began to expand, so the water quickly infiltrated vertically, which led to a rapid increase in the water content at position 1. This process led to the occurrence of a slide at the toe part of the soil accumulation. We observe the change in the pore water pressure. Before 3,200 s, although the water content of the soil increased greatly, the pore water pressure did not change at position 1. The pore water pressure increased rapidly until 3,200 s, reached a peak value of 1.8 kPa at 4,200 s (Point A in Figure 5), and then began to decrease sharply. The total pressure before sliding was
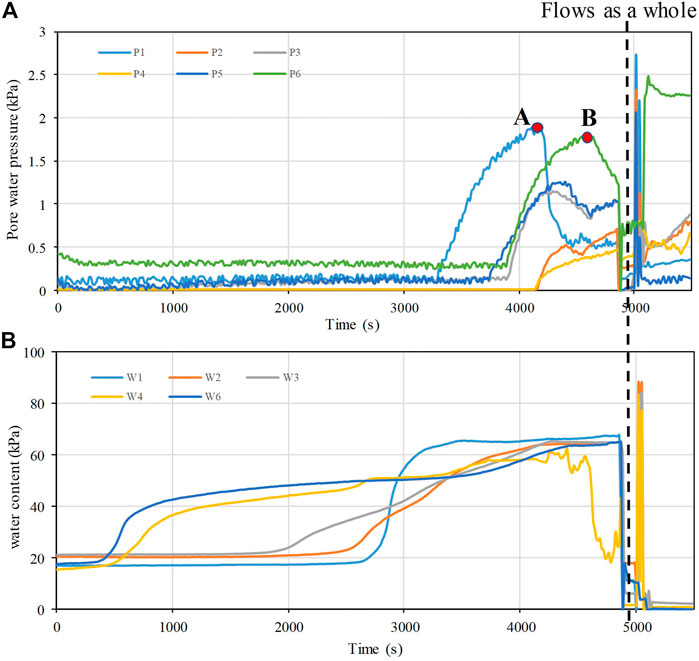
FIGURE 5. Variations in pore water pressure and water content with time in the flume test with a slope angle of 13°. (A) Pore water pressure; (B) Water content. Small-scale mudflow and retrogressive toe sliding.
Type B. First all, as the rainfall continued, the wetting peak during the water infiltration into the soil accumulation gradually moved downward, so the volumetric water content of the soil increased. Then, the soil began to shrink, and the soil accumulation underwent overall collapse and subsidence. When the water recharge was greater than the infiltration rate of the soil, surface runoff formed and the slope’s surface was continuously eroded. As a large amount of water accumulated in the toe part of the slope, the volumetric water content of the soil at the toe part of the slope increased, the pore water pressure of the soil began to increase, and retrogressive shallow composite sliding occurred in the toe part. Then, the soil accumulation began to generate retrogressive mudflows around a position. There was no large-scale mudflow throughout the entire experiment. The scale of the loess mudflow was less than the scale of Type A. Moreover, because of the continuous sliding, several sensors were moved and the sensor positions changed, Therefore, some of the volumetric water content and pore water pressure sensor data may not match (such as P5) (Figure 6). Overall, the pore water pressure of each location exhibited a sudden increase. This shows that the loess liquefied during the initiation of the loess mudflow.
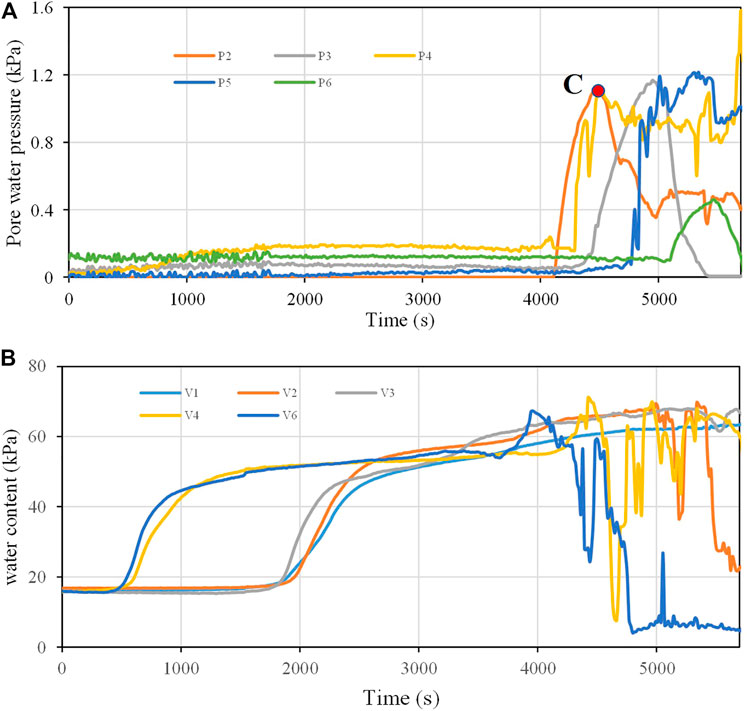
FIGURE 6. Variations in pore water pressure and water content with time in the flume test with a slope angle of 15°. (A) Pore water pressure; (B) Water content. Discussion of the initiation mechanisms of loess mudflows.
The initiation mode of the test with a slope angle of 15° was Type B (Table 3). Figure 6 shows the variations in the volumetric water content and pore water pressure in the soil accumulation. At 480 s, the water content at shallow positions four and six began to increase. At 1,500 s, the volumetric water content reached 50%. As the rainfall continued, the water constantly infiltrated, In the first 1,800 s, the water contents at deep positions 1, 2, and three began to increase, and the water contents increased to >50% at 3,000 s. The soil was nearly saturated. At the same time, there was no response in the pore water pressure before 4,000 s. After 4,000 s, the pore water pressure at every location began to increase suddenly. Then, the soil began to liquefy (Point C in Figure 5). Later, retrogressive shallow compound sliding occurred.
The seven sets of tests were conducted under different rainfall intensities and slope angles. First, we analyzed the variations in the seepage field in the different tests to compare the effects of the rainfall intensity and slope angle on the initiation processes of the loess mudflows. The test with slope angle of 13° and the lowest rainfall intensity and the test a slope angle of 15° and the largest rainfall intensity were selected, and then, the test with a slope angle of 17° and a moderate rainfall intensity was selected for comparison (Table 1). The changes in the seepage fields before the first sliding event in each group of tests were selected for analysis. According to the change in the pore water pressure at each location, the streamline of the slope was drawn (Figure 7). It can be seen that the infiltration direction of the water in each group of experiments was almost vertical, and the horizontal infiltration was much smaller. The rainfall intensity in the test with a slope angle of 13° was 120 mm/h, and the rainfall intensity in the test with a slope angle of 16° was 185 mm/h. However, the rainfall intensity had little effect on the initiation timings of the first sliding events, which occurred at 4,700 s and 4,300 s, respectively. This may be because the rainfall intensities in all of the experiments in this paper are rainstorm levels, which exceed the permeability coefficient of loess. Therefore, the rainfall intensity had little effect on the infiltration time, and only the slope angle had a significant influence on the initiation time of the first sliding event in a series of experiments (Figure 7). This may be because increasing the slope angle increased the sliding force of the accumulation slope, and after rainfall infiltration, as the volumetric water content of the soil increased, the stability coefficient decreased, and then, a loess mudflow occurred.
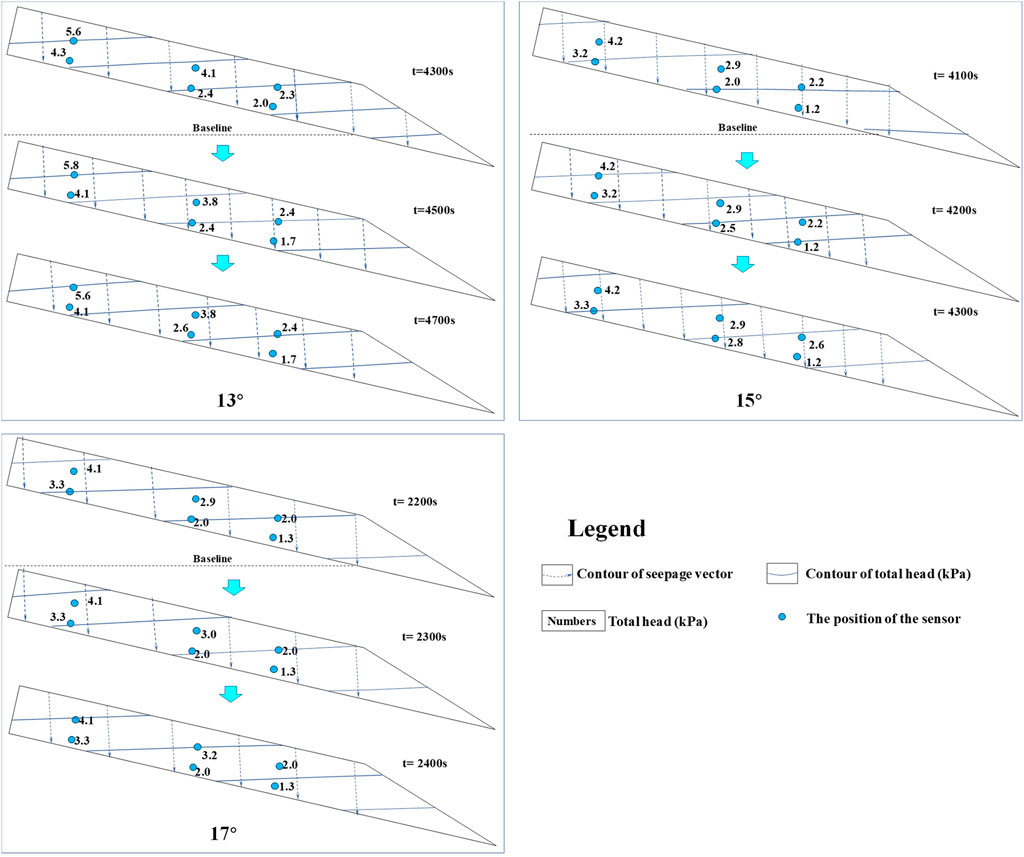
FIGURE 7. Distribution of the seepage field in the flume tests (the slope angle was respectively 13°, 15°and 17°).
Iverson and Major (1986) investigated the effect of groundwater flow on the potential for hillslope failure and liquefaction based on a novel limit-equilibrium analysis of infinite slopes with steady, uniform Darcian seepage with an arbitrary magnitude and direction. Normalization of the limit-equilibrium solution shows that three dimensionless parameters completely govern the Coulomb failure potential of a saturated infinite homogeneous hillslope (Figure 8A). These results indicate that three dimensionless parameters completely govern the Coulomb failure of the slope, including the ratio of the force magnitude of the seepage to the force magnitude of the gravitational body. The angle is
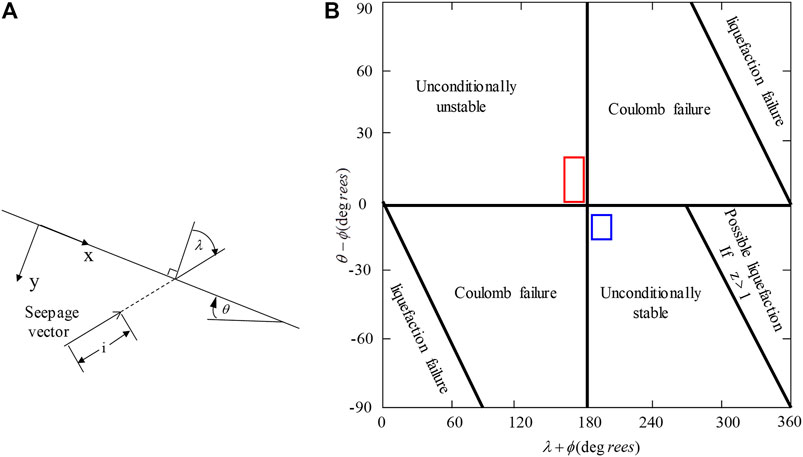
FIGURE 8. Distribution of the domains that exhibit a preferred slope failure mode. (A) Definition of the seepage vector magnitude and direction; (B) The tests’ failure mode.
The angles of the soil accumulation selected in the tests was 10°–20°. The internal angle
In the seven sets of tests, as the pore water pressure increased, the pore water pressure came close to the total stress σ several times (Figures 5, 6), so the range of
Although loess has a loose structure, its infiltration rate is far less than that of sand. The deep sensor positions (4, 5, and 6) were about 8 cm away from the ground. The infiltration rate of the soil was only 0.042 m/h (Table 2). The infiltration of the water was mainly vertical infiltration. It would take at least 2 h for the water content of the deep sensor positions (4, 5, 6) to begin to respond under the condition of homogeneous infiltration. However, the water content of the deep positions in the seven groups of tests basically responded within 3,000 s, i.e., less than 2 h (Figures 5, 6). This indicates that advantageous infiltration occurred during the water infiltration process, which led to a reduction in the time required for the water to reach the deep positions. The viewpoint of dominant infiltration in loess has long been described by many scholars (Xu et al., 2013; Ma et al., 2019a; Zhuang et al., 2020). In the experiments described in this paper, the advantage infiltration mainly occurred in two locations. 1) The soil was looser in the sensor layout area, with a larger porosity than in the other parts of the soil accumulation, which was beneficial to water infiltration. For example, in the test with a slope angle of 17°, positions one and three provided advantageous infiltration channels. Thus, water infiltration occurred in these positions first (Figure 9). 2) In the process of stacking the soil in the models, it is inevitable that there will be some areas with uneven density, resulting in places with a larger porosity that easily conduct water. As the rainfall continued, the infiltration into the homogeneous soil was limited, and a large amount of water flowed into the sensor location or area with a lower density, which caused the volumetric water content of the soil to increase. In addition, due to the water sensitivity of loess, the loess shrank when it encountered the water, its strength decreased, and the area continued to expand, forming a crack. As the infiltration of the water continued, when the water content of the soil had nearly reached the saturated water content, the water accumulated in this area, and the pore water could not dissipate in time. The pore water pressure increased rapidly, and the soil was liquefied in a small area (Figure 10A). As the rainfall continued, the water storage capacity increased and the local liquefied soil flowed, causing the liquefaction area to continue to spread and become larger (Figures 10B,C). Thus, the unstable area of the accumulation increased until the driving force was greater than the resistance of the slope, at which point a loess mudflow (large scale) occurred (Figure 10).
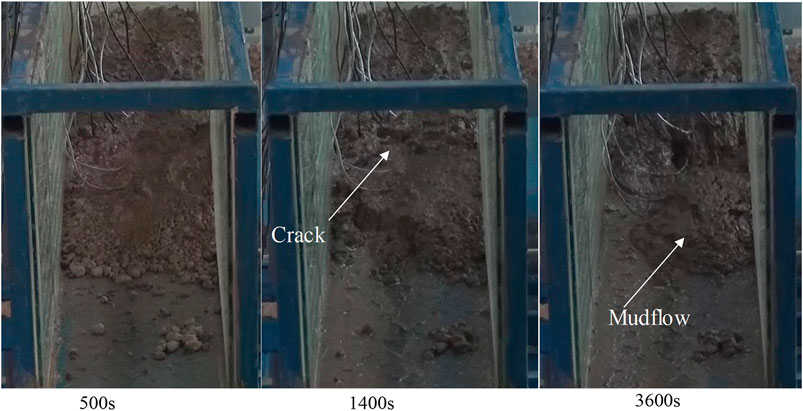
FIGURE 9. Failure process in the experiment with a slope angle of 17°.
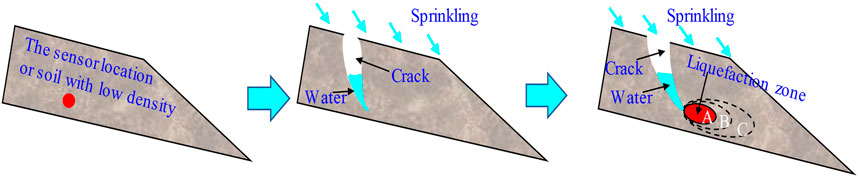
FIGURE 10. The initiation process of the loess mudflows in the tests with slope angles of 10° and 13°.
Conclusion
Loess mudflows occur frequently on the Chinese Loess Plateau, resulting huge casualties and property damage. In this study, a series of flume tests were designed by controlling the slope angle between 10° and 20° to study the initiation mechanism of loess mudflows. The following conclusions were drawn from the results of the experiments.
1) There are two initiation modes when the slope angle of the soil accumulation is 10°–20°. For slopes of 10–13°, the mode is large-scale mudflow and retrogressive toe sliding (Type A); and for slopes of 14–19°, the mode is small-scale mudflow and retrogressive toe sliding (Type B).
2) Based on the distribution of the domains that exhibit the preferential slope failure mode proposed by Iverson and Major (1986), the soil accumulation was unconditionally stable before a loess mudflow was formed. However, as the rainfall continued, the water gradually entered the soil, and the soil accumulation changed from unconditionally stable to unconditionally unstable, which led to different initiation modes for the loess mudflows during the tests.
3) The water preferentially infiltrated into the areas with uneven densities and a large amount of water accumulated. The pore water pressure quickly increased and could not dissipate in time, so the loess liquefied. As the liquefaction area continued to spread and became larger, the soil accumulation underwent shear deformation as a whole and a potential shear zone began to form. Then, a loess mudflow (large scale) occurred. Relatively speaking, Type B occurred in the tests in which the soil accumulation had a relatively uniform density. Lei, 2001.
Data Availability Statement
The original contributions presented in the study are included in the article/Supplementary Material, further inquiries can be directed to the corresponding author.
Author Contributions
This paper represents a result of collaborative teamwork. PM and XZ designed the tests. JZ, YC and CL guided the laboratory experiments and conducted the field observation. JZ and PM prepared the original manuscript. All of the authors contributed equally to this work.
Funding
This work was financially supported by the Program of National Natural Science Foundation of China (42090053, 42107198, 42041006, 41790441).
Conflict of Interest
The authors declare that the research was conducted in the absence of any commercial or financial relationships that could be construed as a potential conflict of interest.
Publisher’s Note
All claims expressed in this article are solely those of the authors and do not necessarily represent those of their affiliated organizations, or those of the publisher, the editors and the reviewers. Any product that may be evaluated in this article, or claim that may be made by its manufacturer, is not guaranteed or endorsed by the publisher.
References
Fan, X., Xu, Q., Scaringi, G., Li, S., and Peng, D. (2017). A Chemo-Mechanical Insight into the Failure Mechanism of Frequently Occurred Landslides in the Loess Plateau, Gansu Province, China. Eng. Geology. 228, 337–345. doi:10.1016/j.enggeo.2017.09.003
Iverson, R. M., and Major, J. J. (1986). Groundwater Seepage Vectors and the Potential for Hillslope Failure and Debris Flow Mobilization. Water Resour. Res. 22, 1543–1548. doi:10.1029/wr022i011p01543
Kang, C., Zhang, F., Pan, F., Peng, J., and Wu, W. (2018). Characteristics and Dynamic Runout Analyses of 1983 Saleshan Landslide. Eng. Geology. 243, 181–195. doi:10.1016/j.enggeo.2018.07.006
Leng, Y., Peng, J., Wang, Q., Meng, Z., and Huang, W. (2018). A Fluidized Landslide Occurred in the Loess Plateau: a Study on Loess Landslide in South Jingyang Tableland. Eng. Geology. 236, 129–136. doi:10.1016/j.enggeo.2017.05.006
Ma, P. H., Peng, J. B., Wang, Q. Y., Zhuang, J. Q., and Zhang, F. Y. (2019a). The Mechanisms of a Loess Landslide Triggered by Diversion-Based Irrigation: a Case Study of the South Jingyang Platform, China. Bull. Eng. Geology. Environ. 78, 4945–4963. doi:10.1007/s10064-019-01467-5
Ma, P., Peng, J., Wang, Q., Duan, Z., Meng, Z., and Jianqi, Z. (2019b). Loess Landslides on the South Jingyang Platform in Shaanxi Province, China. Q. J. Eng. Geology. Hydrogeology 52 (4), 547–556. doi:10.1144/qjegh2018-115
Pei, X., Zhang, X., Guo, B., Wang, G., and Zhang, F. (2017). Experimental Case Study of Seismically Induced Loess Liquefaction and Landslide. Eng. Geology. 223, 23–30. doi:10.1016/j.enggeo.2017.03.016
Peng, D., Xu, Q., Liu, F., He, Y., Zhang, S., Qi, X., et al. (2018). Distribution and Failure Modes of the Landslides in Heitai Terrace, China. Eng. Geology. 236 (26), 97–110. doi:10.1016/j.enggeo.2017.09.016
Peng, J., Fan, Z., Wu, D., Zhuang, J., Dai, F., Chen, W., et al. (2015). Heavy Rainfall Triggered Loess-Mudstone Landslide and Subsequent Debris Flow in Tianshui, China. Eng. Geology. 186 (2), 79–90. doi:10.1016/j.enggeo.2014.08.015
Peng, J., Ma, P., Wang, Q., Zhu, X., Zhang, F., Tong, X., et al. (2018). Interaction between Landsliding Materials and the Underlying Erodible Bed in a Loess Flowslide. Eng. Geology. 234, 38–49. doi:10.1016/j.enggeo.2018.01.001
Peng, J., Wang, S., Wang, Q., Zhuang, J., Huang, W., Zhu, X., et al. (2019). Distribution and Genetic Types of Loess Landslides in China. J. Asian earth Sci. 170, 329–350. doi:10.1016/j.jseaes.2018.11.015
Pu, X., Wan, L., and Wang, P. (2021). Initiation Mechanism of Mudflow-like Loess Landslide Induced by the Combined Effect of Earthquakes and Rainfall. Nat. Hazards 105, 3079–3097. doi:10.1007/s11069-020-04442-6
Sassa, K., The Mechanism Starting Liquefied Landslides and Debris Flows.” in Proceedings of the 4th International Symposium on Landslides, Toronto, Canada, Sept 1984, 2, 349–354.
Xu, L., Dai, F. C., Tu, X. B., Javed, I., Woodard, M. J., Jin, Y. L., et al. (2013). Occurrence of Landsliding on Slopes where Flowsliding Had Previously Occurred: an Investigation in a Loess Platform, north-west China. Catena 104, 195–209. doi:10.1016/j.catena.2012.11.010
Yuan, B., Chen, W., Tang, Y., Li, J., and Yang, Q. (2015). Experimental Study on Gully-Shaped Mud Flow in the Loess Area. Environ. Earth Sci. 74 (1), 759–769. doi:10.1007/s12665-015-4080-9
Zha, X., Huang, C., Pang, J., Li, Y., Liu, J., Cuan, Y., et al. (2019). Sedimentary Records of Holocene Palaeo-Mudflow Events in Tianshui basin of the Western Loess Plateau, China. Quat. Int. 521, 129–137. doi:10.1016/j.quaint.2019.06.027
Zhang, F., Wang, G., Kamai, T., Chen, W., Zhang, D., and Yang, J. (2013). Undrained Shear Behavior of Loess Saturated with Different Concentrations of Sodium Chloride Solution. Eng. Geology. 155 (6), 69–79. doi:10.1016/j.enggeo.2012.12.018
Zhang, F., Yan, B., Feng, X., Lan, H., Kang, C., Lin, X., et al. (2019). A Rapid Loess Mudflow Triggered by the Check Dam Failure in a Bulldoze Mountain Area, Lanzhou, China. Landslides 16 (10), 1981–1992. doi:10.1007/s10346-019-01219-2
Zhang, Z.-Y., Chen, S.-M., and Tao, L.-J. (2002). “1983 Sale Mountain Landslide, Gansu Province, China,” in Catastrophic Landslides, Geological Society of America. Editors SG. Evans, and JV. DeGraff Colorado, US: Reviews in Engineering Geology, XV, 149–164. doi:10.1130/reg15-p149
Zhou, J. X., Zhu, C. Y., Zheng, J. M., Wang, X. H., and Liu, Z. H. (2002). Landslide Disaster in the Loess Area of China. J. For. Res. 13 (2), 157–161. doi:10.1007/bf02857244
Zhu, X., Peng, J., Liu, B., Jiang, C., and Guo, J. (2020). Influence of Textural Properties on the Failure Mode and Process of Landslide Dams. Eng. Geology. 271, 105613. doi:10.1016/j.enggeo.2020.105613
Zhuang, J. Q., and Peng, J. B. (2014). A Coupled Slope Cutting-A Prolonged Rainfall-Induced Loess Landslide: a 17 October 2011 Case Study. Bull. Eng. Geol. Environ. 73 (4), 997–1011. doi:10.1007/s10064-014-0645-1
Keywords: flume tests, loess mudflow, loess liquefaction, initiation modes, unconditionally stable, unconditionally unstable
Citation: Ma P, Zhuang J, Zhu X, Cheng Y and Liu C (2021) Flume Tests to Investigate the Initiation Mechanism of Loess Mudflows on the Chinese Loess Plateau. Front. Earth Sci. 9:724678. doi: 10.3389/feart.2021.724678
Received: 14 June 2021; Accepted: 28 September 2021;
Published: 12 October 2021.
Edited by:
Fanyu Zhang, Lanzhou University, ChinaReviewed by:
Shenghua Cui, Chengdu University of Technology, ChinaZhao Duan, Xi’an University of Science and Technology, China
Copyright © 2021 Ma, Zhuang, Zhu, Cheng and Liu. This is an open-access article distributed under the terms of the Creative Commons Attribution License (CC BY). The use, distribution or reproduction in other forums is permitted, provided the original author(s) and the copyright owner(s) are credited and that the original publication in this journal is cited, in accordance with accepted academic practice. No use, distribution or reproduction is permitted which does not comply with these terms.
*Correspondence: Jianqi Zhuang, anF6aHVhbmdAY2hkLmVkdS5jbg==