 Felipe Aguilera
 Javiera Caro
 Susana Layana1,2,3
- 1Núcleo de Investigación en Riesgo Volcánico-Ckelar Volcanes, Universidad Católica del Norte, Antofagasta, Chile
- 2Departamento de Ciencias Geológicas, Universidad Católica del Norte, Antofagasta, Chile
- 3Centro de Investigación para la Gestión Integrada del Riesgo de Desastres (CIGIDEN), Santiago, Chile
One of the major challenges in the understanding of the crater lakes dynamics and their connection with magmatic/hydrothermal processes is the continuous tracking of the physical behavior of lakes, especially in cases of remote and poorly accessible volcanoes. Peteroa volcano (Chile–Argentina border) is part of the Planchón–Peteroa–Azufre Volcanic Complex, one of the three volcanoes in the Southern Volcanic Zone of the Andes with crater lakes. Peteroa volcano is formed by a ∼5 km diameter caldera-type crater, which hosts four crater lakes and several fumarolic fields. Peteroa volcano has a large history of eruptive activity including phreatic-and-phreatomagmatic explosions and several episodes of strong degassing from its crater lakes. Here, we used TIR and SWIR bands from Landsat TM, ETM+, and OLI images available from October 1984 to December 2020 to obtain thermal parameters such as thermal radiance, brightness temperature, and heat fluxes, and Planet Labs Inc. images (RapidEye and PlanetScope) available between May 2009 and December 2020 to obtain physical parameters such as area, color, and state (liquid or frozen) of the crater lakes. We reviewed the historical eruptive activity and compared it with thermal and physical data obtained from satellite images. We determined the occurrence of two eruptive/thermal cycles: 1) Cycle 1 includes the formation of a new fumarolic field and two active craters during a short eruptive period, which includes thermal activity in three of the four crater lakes, and a strong degassing process between October 1998 and February 2001, coincident with a peak of volcanic heat flux (Qvolc) in two craters. The cycle finished with an eruptive episode (September 2010–July 2011). 2) Cycle 2 is represented by the thermal reactivation of two crater lakes, formation and detection of thermal activity in a new nested crater, and occurrence of a new eruptive episode (October 2018–April 2019). We observed a migration of the thermal and eruptive activity between the crater lakes and the interconnection of the pathways that feed the lakes, in both cases, partially related to the presence of two deep magma bodies. The Qvolc in Peteroa volcano crater lakes is primarily controlled by volcanic activity, and seasonal effects affect it at short-term, whilst at long-term, seasonal effects do not show clear influences in the volcanic heat fluxes. The maximum Qvolc measured between all crater lakes during quiescent periods was 59 MW, whereas during unrest episodes Qvolc in single crater lakes varied from 7.1 to 38 MW, with Peteroa volcano being classified as a low volcanic heat flux system. The detection of new thermal activity and increase of Qvolc in Peteroa volcano previous to explosive unrest can be considered as a good example of how thermal information from satellite images can be used to detect possible precursors to eruptive activity in volcanoes which host crater lakes.
Introduction
A crater lake is one of the several superficial expressions of volcanic activity which consist of a water body confined in a crater. Crater lakes are a consequence of a complex interaction between deep/shallow volcanic, hydrothermal, and degassing processes, superficial factors like climate conditions, and morphological elements such as crater geometry (Pasternack and Varekamp, 1997; Christenson et al., 2015). Several disciplines and methods have been applied to understand the processes involved in the formation and evolution of crater lakes, including fluid geochemistry (Dmitri Rouwet and Franco Tassi, 2011; Rouwet et al., 2017), geophysics (Caudron et al., 2012), hydrogeology (Mazza et al., 2015), biology (Mapelli et al., 2015), and limnology (Kling et al., 2015), among others. In the case of some high latitude and high altitude volcanoes, the applicability and frequency of the field methods is restricted to the dry season, impeding the study of the characteristics and dynamics of their crater lakes in a continuous manner. One technique that allows the study of crater lakes independently of seasonal restrictions is the use of satellite images, which have been widely used to monitor changes in lake temperature (Oppenheimer, 1993; Trunk and Bernard, 2008), determine heat fluxes and heat budget (Oppenheimer, 1996; Oppenheimer, 1997a; Lewicki et al., 2016), detect changes in the crater lake color (Oppenheimer, 1997b; Murphy et al., 2018), and investigate the thermal evolution of volcanic lakes through time (Candela-Becerra et al., 2020), among other applications. The combination of satellite images with accurate in situ and/or other remote measurements, such as lake temperature, air temperature, humidity, windspeed, and others, has allowed us to improve the calculations of energy balance and to better understand the dynamics of crater lakes (Lewicki et al., 2016). Additionally, the availability of improved satellite technology provides new tools and more accurate data, which have been recently incorporated into volcanological research. One example is the use of satellite data provided by Planet Labs Inc., a constellation of CubeSats with high temporal (<1–72 h) and spatial (from 0.8 to 5 m) resolutions, which have been recently used to map ash clouds, pyroclastic density currents (PDCs), lava flows, to track ash plumes, and to identify morphological changes in eruptive craters (Aldeghi et al., 2019; Romero et al., 2020).
Along the Southern Volcanic Zone of the Andes, where at least 60 volcanes have been considered as active/potentially active (Stern, 2004), only three volcanes host volcanic lakes on their craters, corresponding from north to south to Tupungatito, Peteroa, and Copahue volcanoes (Figure 1). Tupungatito hosts one lake and has sporadic low magnitude historical eruptive activity (Benavente et al., 2013), whereas Copahue and Peteroa volcanoes host one and four volcanic lakes, respectively, in both cases with frequent records of low-to-moderate eruptive activity (Naranjo and Polanco, 2004; Caselli et al., 2016; Aguilera et al., 2016; Romero et al., 2020).
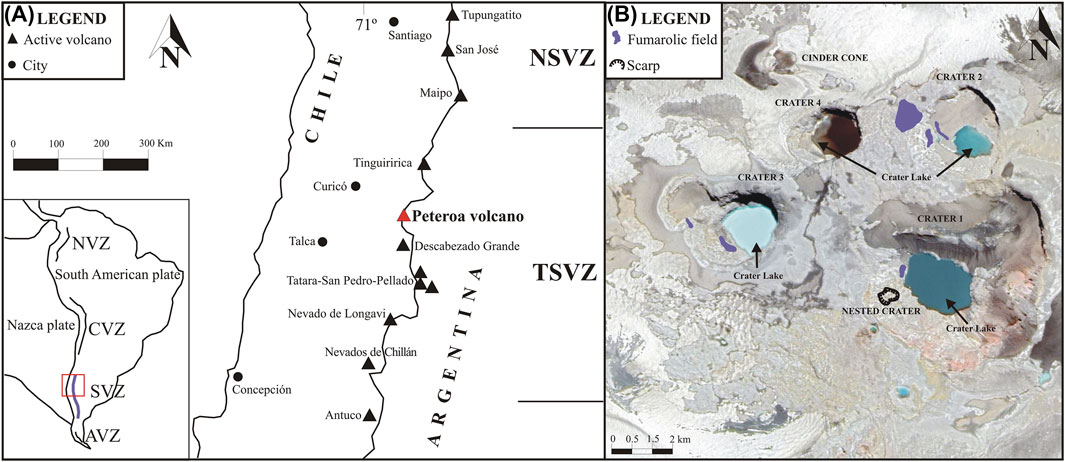
FIGURE 1. (A) Location map of Peteroa volcano. NSVZ: Northern Southern Volcanic Zone of the Andes; TSVZ: Transitional Southern Volcanic Zone of the Andes. (B) PlanetScope image (natural color) showing the location of the crater lakes and fumarolic fields of Peteroa volcano. The location of the new nested crater is also indicated.
Peteroa volcano (35.240ºS, 70.570ºW, 3,603 m a. s. l.) is a composite stratovolcano located in the Transitional Southern Volcanic Zone (TSVZ; López-Escobar et al., 1995; Sellés et al., 2004), on the border between Chile and Argentina, and it is formed by a ∼5 km diameter caldera-type crater, which includes four nested craters (150–500 m diameter; all hosting lakes) and a scoria cone (Figure 1). Fumarolic activity is present in Craters 1, 2, and 3, and in the zone between Craters 2 and 4 (Figure 1). Several glaciers are located in the caldera area and in the highest parts of the flank valleys. Peteroa volcano is part of a major north-to-south trending volcanic complex named the Planchón–Peteroa–Azufre Volcanic Complex. It constitutes three overlapping volcanic edifices, which have formed from basaltic andesites to rhyodacitic lava and pyroclastic flows and lahars. The Planchón–Peteroa–Azufre Volcanic Complex evolved in at least four eruptive stages, Azufre (<219 ± 14 ka), Planchón I (∼72 ± 11 to ∼11 ka), Planchón II (∼11–∼7 ka), and Peteroa (<7 ka) (Tormey et al., 1989; Tormey et al., 1995; Naranjo et al., 1999; Naranjo and Haller, 2002; Tormey, 2010; Klug et al., 2018). A total of 18 eruptions have been recorded at Peteroa volcano during the period between 1660 and 2020, mostly corresponding to phreatic-to-phreatomagmatic eruptions (VEI ≤ 2), although some major eruptions (VEI = 4) have been also recorded (Haller et al., 1994; Gonzalez-Ferrán, 1995; Naranjo et al., 1999; Haller and Risso, 2011). The greatest historical eruption occurred in 1762 (VEI = 4), when the explosive and effusive activity was followed by the partial collapse of the volcanic edifice, producing debris, avalanches, and lahars, and damming the Río Teno for several days (González-Ferrán, 1995; Haller and Risso, 2011). Explosive and/or effusive activity was recorded in 1660, 1835, 1837, 1860, 1869, 1878, 1889 (lasting 5 years), 1937 (a scoria cone was formed, and a short lava flow was emitted; Figure 1), 1938, 1959, 1960, 1962, 1967, 1991, 1998, 2010–2011, and 2018–2020.
In this article, we present a temporal analysis of Peteroa volcano crater lakes, by using two large databases based on Landsat imagery (1984–2020) including Landsat TM, ETM+, and OLI-TIRS and Planet Labs Inc. imagery (2009–2020) including RapidEye and PlanetScope images, with the objectives 1) to determine the temporal evolution of the Peteroa volcano crater lakes, 2) to assess the energy balance of those lakes, and 3) to correlate the temporal evolution of the lakes with the seasonal variations of the climate and eruptive activity. We have selected Peteroa volcano as a priority to be studied using a long-term remote-based monitoring system between the three volcanoes with crater lakes due to its extent and frequent eruptive historical record, which includes a VEI 4 eruption, partial flank collapse, lahars, and creation of new craters. Additionally, Peteroa has been categorized as the second most hazardous volcano for Argentina, and 23rd for Chile, being a priority for volcanic monitoring in both countries.
Historical Eruptive Activity in the Period 1984–2020
In the period 1984–1990 Peteroa volcano was still in a quiescence state, although in January 1987 a new fumarolic field was reported close to the 1937 cinder cone, covering an area of ∼100 m2 (Global Volcanism Program, 1987; Figure 2). On February 9, 1991, a new eruptive period started, characterized by the occurrence of phreatomagmatic explosions and emitting eruptive columns of 400–700 m over the main caldera, and occasionally over 1,000 m (Gardeweg, 1991; Global Volcanism Program, 1991). The eruption lasted until February 15, 1991, and generated two new craters, both hosting volcanic lakes, corresponding to Craters 3 and 4 (Figures 1, 3; Gardeweg, 1991; Global Volcanism Program, 1991). After 7 years of quiescence period, a short unrest occurred between October and November 1998, when steam and tephra plumes were produced and transported up to 8 km NW from the volcano (Global Volcanism Program, 1999). Increases in gas emissions were reported during February–March 1999 and December 2000–February 2001, producing a gas plume up to 500 m over the caldera and transported up to 1 km to the east (Global Volcanism Program, 2001). No eruptive activity was recorded between March 2001 and December 2009. The February 1991 eruptive period was characterized by the presence of juvenile eruptive products and by the low magnitude of the eruptions (VEI 1; Naranjo et al., 1999), whereas the later eruptions emitted exclusively non-juvenile products.

FIGURE 2. (A) Landsat TM (combination 754 in RGB) showing Crater Lakes 1 and 2 (August 17, 1986). (B) Landsat TM (TIR band) showing Crater Lakes 1 and 2 (August 17, 1986). (C) Landsat TM (combination 754 in RGB) showing the new fumarolic field, Crater Lakes 1 and 2 (August 18, 1986). (D) Landsat TM (TIR band) showing the new fumarolic field, Crater Lakes 1 and 2 (September 18, 1986). (E) Landsat TM (combination 754 in RGB) showing an extended fumarolic field, Crater Lakes 1 and 2 (January 10, 1991). (F) Landsat TM (TIR band) showing an extended fumarolic field, Crater Lakes 1 and 2 (January 10, 1991).
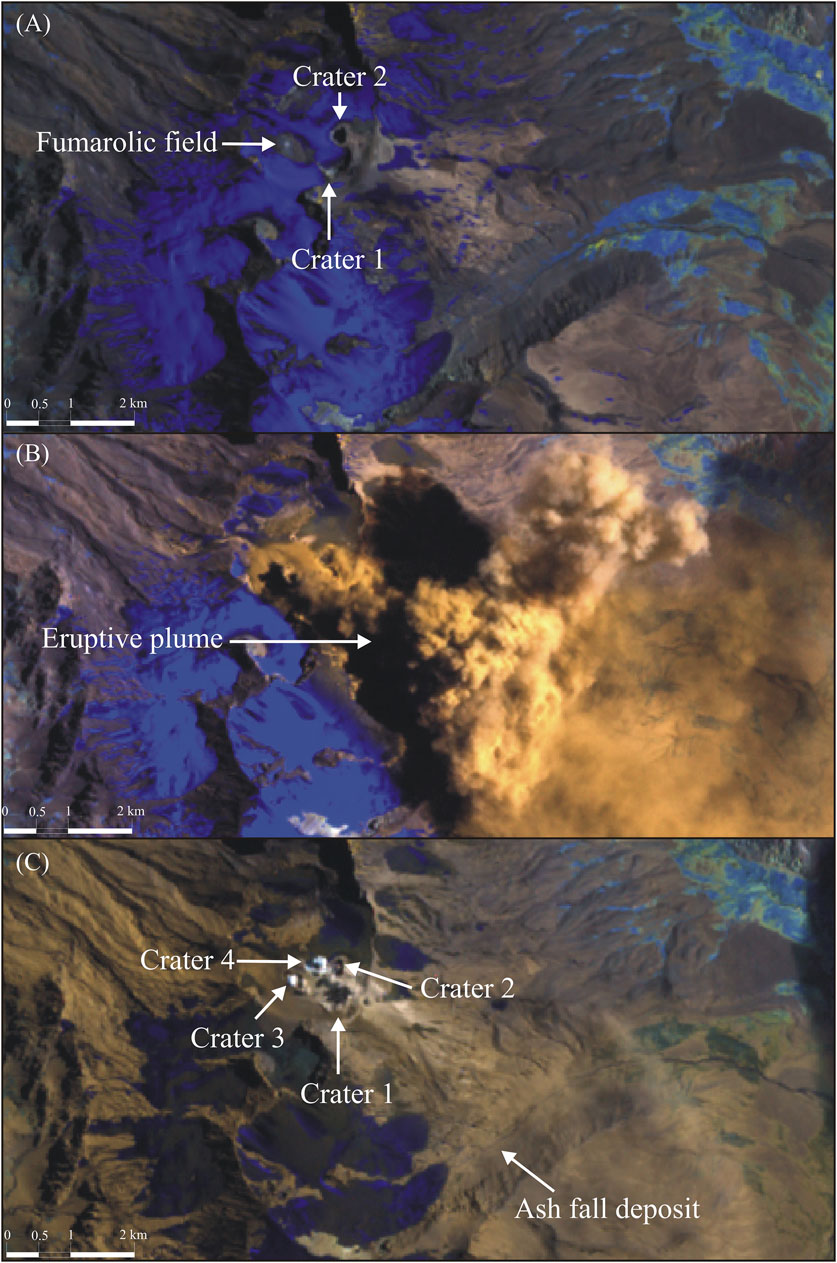
FIGURE 3. (A) Landsat TM (combination 754 in RGB) showing Crater Lakes 1 and 2 (February 4, 1991). (B) Landsat TM (combination 754 in RGB) showing the eruptive plume (February 11, 1991). (C) Landsat TM (combination 754 in RGB) showing Crater Lakes 1, 2, and the new Craters 3 and 4. Ash fall deposit is also shown (February 27, 1991).
On January 4, 2010, an increase in degassing activity started in Crater 3, producing frequent and rhythmical phreatic explosions, and generating a 200 m high gas plume over the crater rim, which lasted up to August 7, 2010 (Aguilera et al., 2016). On 8th August, scarce ash was observed in the gas plume (Aguilera et al., 2016). On September 4, 2010 a new eruptive activity started in Crater 3, characterized by the occurrence of phreatic explosions and the emission of tephra plumes (up to 3 km height over the crater rim; Aguilera et al., 2016). Between November 2, 2010, and February 16, 2011, only gas/steam plumes were emitted (up to 1.5 km height over the crater rim), and at least during November 2010 no lake was present in Crater 3, which was completely vaporized after previous eruptive activity (Aguilera et al., 2016). New eruptive activity was observed during 17th February–20th May 2011 and 17th June–13th July 2011, characterized by the emission of tephra plumes with maximum heights of 1.5 and 0.5 km over the crater rim, respectively (Aguilera et al., 2016). Since July 14, 2011, and at least in March 2012, the activity was restricted to the emission of low altitude gas plume (50–100 m; Aguilera et al., 2016). This eruptive period was characterized by the absence of juvenile eruptive products and by the low magnitude of the eruptions (VEI 0-2; Aguilera et al., 2016).
The last eruptive cycle started probably in January 2018, when a crater with a small lake was formed in the southwestern wall of Crater 1, accompanied with very diffuse degassing in the upper part of the wall. In March 2018, the degassing activity in the main lake of Crater 1 increased substantially. By May 2018, the nested crater increased its size and fumarolic activity. On October 13, 2018, tephra started to be emitted from the nested crater, followed by almost 7 months of intermittent emission of tephra and gas plumes, varying from 0.6 to 2 km over the crater rim (Global Volcanism Program, 2019; Romero et al., 2020). By the end of this eruptive cycle, the nested crater grew up to ∼75 m diameter. This eruptive period was characterized by the presence of abundant juvenile eruptive products (Romero et al., 2020) and by the low magnitude of the eruptions (VEI 0-2).
Methodologies
Landsat TM, ETM+, and OLI Imagery Acquisition and Processing
We used 1,208 Landsat images available from the period 1984–2020, corresponding to TM (600 images), ETM+ (302 images), and OLI-TIRS (306 images) sensors. Landsat TM sensor was mounted on two satellites (Landsat 4 and 5), whereas Landsat ETM+ and OLI-TIRS on one satellite each (Landsat 7 and 8, respectively). Landsat satellites include 7, 8, and 11 bands (TM, ETM+, and OLI-TIRS, respectively) between blue and thermal infrared, spatial resolution variable between 15 and 120 m, and the revisit time is 16 days for each satellite. The images were downloaded in a GeoTIFF format from the site http://earthexplorer.usgs.gov, and visually revised using natural color combination in RGB, with the objective to separate pixels corresponding exclusively to crater lakes, fumaroles, and the surrounding area. Additionally, the images were visually revised using natural color combination with the objective to determine the presence or absence of crater lakes. Thermal bands (TIR) were processed using the VIPS software included in the VOLCANOMS platform (Layana et al., 2020) to obtain the thermal radiance, brightness temperature, and radiant heat flux from the crater lakes and fumarolic fields separately. Short wave infrared bands (SWIR) were also processed to obtain thermal radiance from fumarolic fields. 400 images were discarded because of the presence of clouds covering the four craters; three images were discarded due to tephra plumes covering the four craters, and 113 images were partially processed due to the presence of black stripes (caused by the failure of the ETM + sensor), which covered between Craters 1 and 3.
PlanetScope Imagery Acquisition and Processing
A total of 551 RapidEye and PlanetScope images were acquired from the Planet Labs Inc. site (www.planet.com) for the period between May 27, 2009, and December 31, 2020. RapidEye is a constellation of five satellites which collected five bands (between blue and near infrared) images characterized by a spatial resolution of 5 m and a temporal resolution variable from 5.5 days to daily, being available between 2009 and 2020 (www.planet.com). PlanetScope is a constellation of ∼120 CubeSat (called doves) which collected four bands (between blue and near infrared) images with a 3–4 m pixel size and a daily or several images per day revisit time (www.planet.com). We acquired 117 RapidEye and 434 PlanetScope images, which were downloaded in the GeoTIFF format, and processed to obtain physical parameters including area, color, and state (liquid or frozen) of the crater lakes, presence or absence of crater lakes, and presence of clouds, gas/steam plumes, or tephra plumes.
Areas of lakes were calculated using a GIS-based analysis, with the lakes being mapped individually and their areas then obtained. The color and state of the crater lakes were obtained by a visual inspection, using natural color combination in RGB. Subsequently, color and the state of the crater lakes (liquid, frozen, liquid + ice, and no lake) classifications were done, with both parameters being expressed as frequency.
Heat Flux Calculations
According to Pasternack and Varekamp, (1997), the energy balance of a crater lake can be expressed as follows (Figure 4):
where Q expresses the heat flux from the sun (Qsun), atmosphere (Qatm), conductive heat from a shallow magma body (Qvolc-cond), and volcanic/hydrothermal contribution from the bottom of the lake (Qvolc). Heat fluxes related to a crater lake correspond to radiative (Qrad), evaporative (Qevap), conductive (Qcond), and rain water input (Qrain).
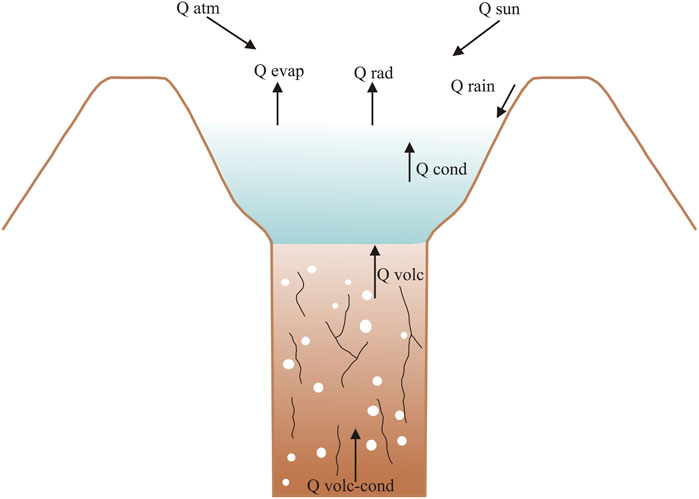
FIGURE 4. Heat fluxes involved in the energy balance of a crater lake. Heat flux from the sun (Qsun), atmosphere (Qatm), radiative (Qrad), evaporative (Qevap), conductive (Qcond), rain water input (Qrain), conductive heat from a shallow magma body (Qvolc-cond), and volcanic/hydrothermal contribution from the bottom of the lake (Qvolc).
According to Linacre (1992), heat fluxes from the sun (Qsun in MW) and atmosphere (Qatm in MW) are calculated as follows:
where
The atmospheric temperature was obtained for each month from Liaudat et al., 2014, corresponding to the atmospheric temperature at the Peteroa volcano caldera rim. Conductive heat flux has been considered negligible as the shallow magma source is located at depth > 1 km (Lewicki et al., 2016), whereas Qvolc is the parameter to be calculated. Radiative heat flux has been calculated using the procedure proposed by Layana et al. (2020), where the thermal radiance (RTIR, thermal) is initially calculated as follows:
where RTIR,U is the upwelling radiance,
Before applying Eq. 6, thermal and non-thermal pixels are separated by visual inspection of the satellite image, where thermal pixels are recognized by their higher brightness (high DN) than non-thermal pixels (very low brightness and DN). Brightness temperature (
where K1 and K2 are the thermal conversion constants (or calibration constants) 607.76 W/m2μmsr and 1,260.56 K, respectively. Radiative heat flux (Qrad in W/pixel) is calculated from each thermal pixel as follows:
where
where
The parameters ew and ea (mbar) correspond to saturated water and atmospheric vapor pressures at the temperature of water from the lake
where Pa is the atmospheric pressure in mbar. We calculated the Pa (670 mbar) from the NOAA atmospheric models for an altitude of 3,460 m a.s.l.
The rain water input heat flux (Qrain in MW) is calculated as follows (Pasternack and Varekamp, 1997):
where
Uncertainties Related to Atmospheric Parameters
Uncertainties linked to atmospheric parameters are related to the estimation of wind speed, atmospheric pressure, precipitation rate, and atmospheric temperature. The wind speed can vary largely if measurements are carried out 1) in free air conditions (tens/hundreds of meters over the surface) or 2) close to the surface. In the last case, some small variations could be related to topographic effects. In order to reduce the uncertainties related to wind speed, we used atmospheric models considering the closest altitude to the Peteroa caldera floor (3,460 m a.s.l.), which has small topographic variations. Although wind speed variability in the period 1984–2020 was reduced, we used a fixed average in order to avoid uncertainties related to wind speed variations possibly linked to seasonal effects. The relative “high” wind speed average (8 ms−1) used in this study is a consequence of the high latitude and high altitude where Peteroa volcano is located. Similarly, atmospheric pressure (assuming 100% of relative humidity) and precipitation rates were obtained at the same altitude of wind speed, in order to reduce the uncertainties due to variabilities in the atmospheric conditions. The use of fixed atmospheric pressure and precipitation rate removes strong variations of those parameters related to seasonal effects. The atmospheric temperature obtained from Liaudat et al., 2014 was measured in the inner rim of the caldera, at similar altitudes to other atmospheric parameters, with small uncertainties expected.
Uncertainties Related to Satellite Images
Uncertainties related to catchment and lake areas have a direct relation to the pixel size of RapidEye and PlanetScope images, with the uncertainties of the calculated area variable from ±2 to ±6 m2. In the case of Landsat imagery, one of the most critical uncertainties corresponds to the lake surface temperature. Lake temperature measured remotely has a strong dependence on the temperature distribution through the lake water body. This non-uniform distribution of the temperature can also affect the temperature calculation in a single pixel. Based on in situ measurements, we have estimated discrepancies of ±1 and ±4 K between satellite-based and in situ temperatures. These discrepancies can be attributed to several processes including differential absorption of thermal radiation by vapor and liquid phases present over the lake surface, especially in cases when intense evaporation occurs. Additionally, discrepancies can occur due to the location of in situ measurements, where differences can be observed between near and offshore measurements. However, the observed discrepancies imply small differences in the radiative heat flux if we consider only a single pixel (after background correction), varying between 0.003 and 0.006 MW. Average temperature difference between thermal and non-thermal pixels for our database was 8 K, whereas minimum difference was only 2 K. If we consider the minimum difference between thermal temperature threshold and non-thermal temperature (2 K), the minimum thermal radiative heat flux able to be measure in a single pixel, after background correction, is 0.007 MW.
Results
General Results From the Landsat and PlanetScope Imagery Database
The results from Landsat images are presented in detail in the Supplementary Table S1. The measured maximum radiative heat fluxes (Qrad) measured were 1.2, 1.5, 2.3, and 1.4 MW for Crater Lake 1, 2, 3, and 4, respectively, whereas the measured maximum volcanic heat fluxes (Qvolc) measured were 7.1, 38, 31, and 23 MW, respectively (Figure 5). The highest brightness temperature measured in each crater lake was 323, 328, 334, and 326 K for Lake 1, 2, 3, and 4, respectively, corresponding to the value of the single pixel with the highest temperature. The fumarolic fields detectable by TIR bands from Landsat images were those located in the western side of the Crater 1 (Figure 1), and the fumarolic field emerged previous to the formation of the Crater 3 during the eruptive process in February 1991. The maximum thermal radiance and radiative heat flux (Qrad) measured in the fumarolic field of Crater 1 were 13.3 W/m2μmsr and 1.1 MW, respectively, and in the case of fumarolic field pre-Crater 3 maximum thermal radiance and Qrad were 12.1 W/m2μmsr and 2.1 MW, respectively (Figure 5). Thermal anomalies in SWIR bands were observed exclusively in the nested Crater 1, being detected for the first time on December 6, 2018, exclusively in band 7 (Landsat OLI), with a thermal radiance of 0.4 W/m2μmsr (Table 2). On August 22, 2020, the maximum thermal radiance (17.4 W/m2μmsr) was recorded in band 7 (for Landsat ETM+ and OLI), whilst, simultaneously, for the first time an anomaly was recorded in band 5 (Landsat ETM+), with a radiance of 7.3 W/m2μmsr (Table 1). Thermal anomaly in band 5/6 (for Landsat ETM+/OLI, respectively) was newly detected on 14th September and November 1, 2020, with thermal radiance of 1 and 3.2 W/m2
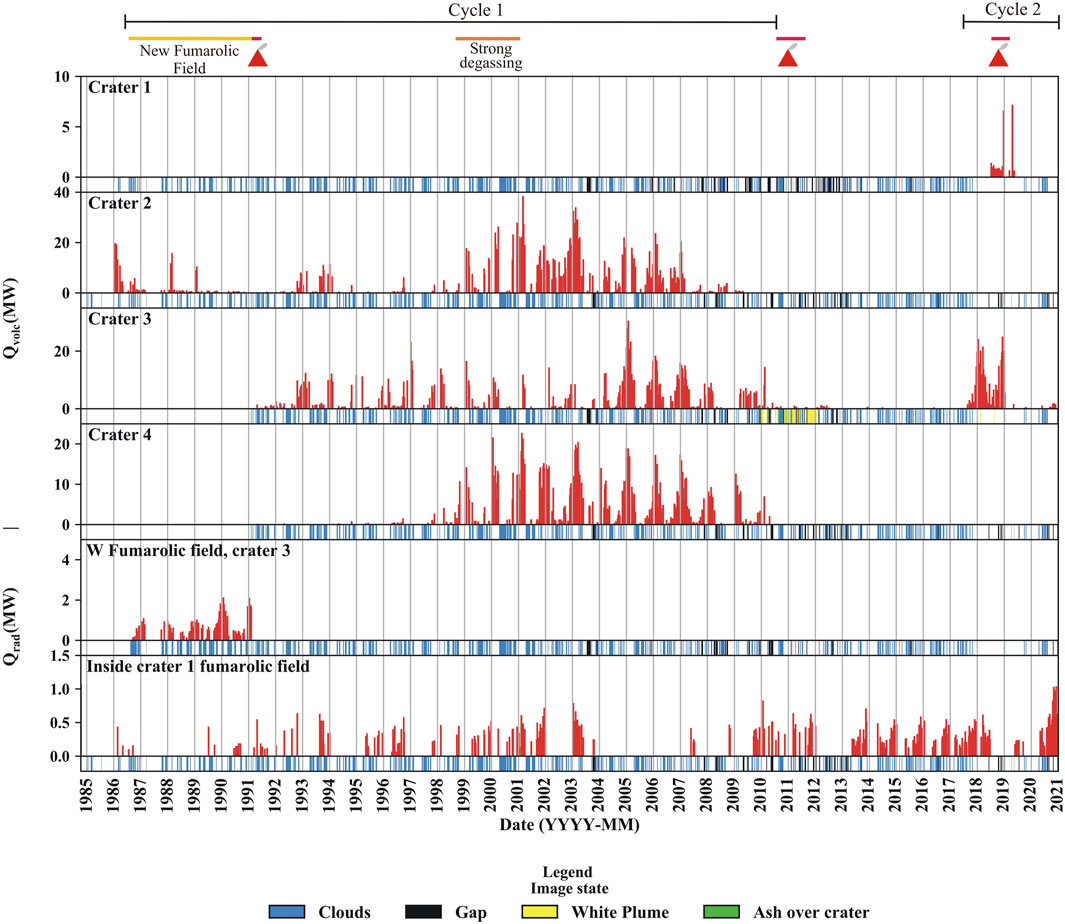
FIGURE 5. Qvolc and Qrad in MW vs. date (YYYY-MM) is shown for Crater Lakes 1, 2, 3, and 4, and for the new fumarolic field in the current position of Crater 3 and Crater 1 fumarolic field, respectively. The major evolutive cycles and eruptive activity are shown in the upper part. Red lines accompanied by red volcano indicate volcanic unrest periods, yellow line the presence of a new fumarolic field, and orange line the strong degassing process. The secondary graphics at the base of Qvolc and Qrad graphics showed the state of the satellite images, corresponding to free clouds images (white area), presence of clouds (light blue area), gas plume (yellow area), and ash (green area) over crater lakes. Vertical grey lines correspond to an annual timescale.
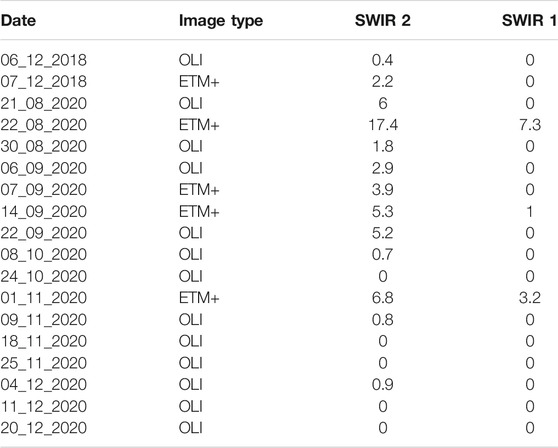
TABLE 1. Date, image type, and thermal radiance of SWIR bands 1 (band 5 and 6 for Landsat ETM+ and OLI, respectively) and 2 (band 7 for Landsat ETM+ and OLI) in W/m2
The results from Planet Lab Inc. images are presented in detail in the Supplementary Table S2, and the summary of the most relevant data is presented in Table 2. The maximum area measured of Crater Lakes 1, 2, 3, and 4 corresponds to 31,514, 10,575, 20,344, and 15171 m2, respectively (Figure 6). In all craters the lakes changed from liquid to frozen, and occasionally a transition corresponding to a liquid lake with ice patches (Figure 7). Craters 1, 2, and 4 present similar behaviors, dominated by presence of liquid water (between 47 and 67% of the total images processed), and frozen lakes between 24 and 35%. In the case of Crater Lake 3, liquid water appears in 78% of the images, whereas frozen lakes only in 3% of the images. Liquid water + ice was observed only between 1 and 7% of the images in all craters. Absence of crater lakes was observed in all cases, varying between 2% in the case of Crater 4 and 23% of the images in Crater 1. A wide range of colors were observed between all crater lakes, including turquoise, blue, brown-to-dark brown, green-to-dark green, and white, with Crater Lake 1 displaying the most variability of colors. The turquoise color is dominant in the case of Crater 2 and 3 (65 and 68%, respectively), blue in Crater 1 (72%), and brown in Crater 4 (68%).
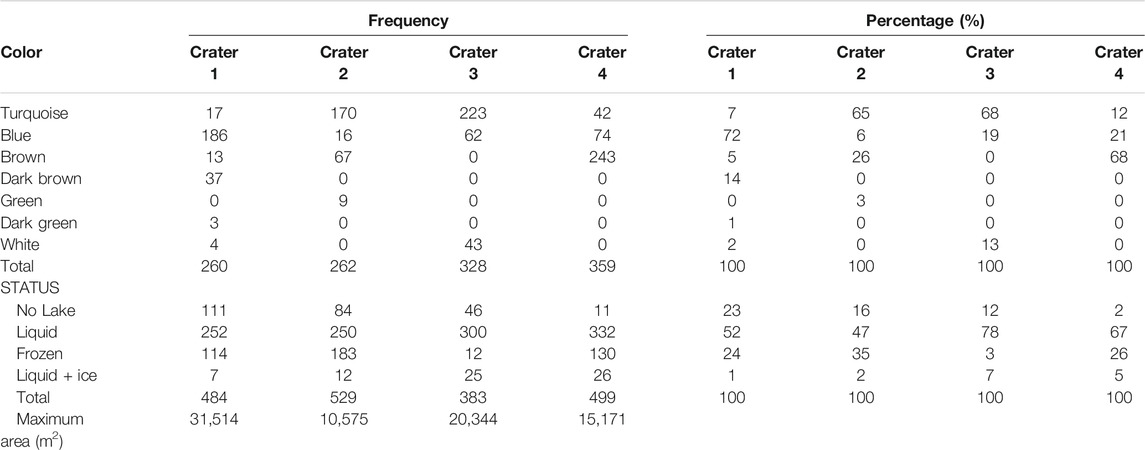
TABLE 2. Color and state of crater lakes of Peteroa Volcano. The frequency and percentage (%) of color and state of the lake is indicated. Maximum area (m2) of the lakes is also indicated.
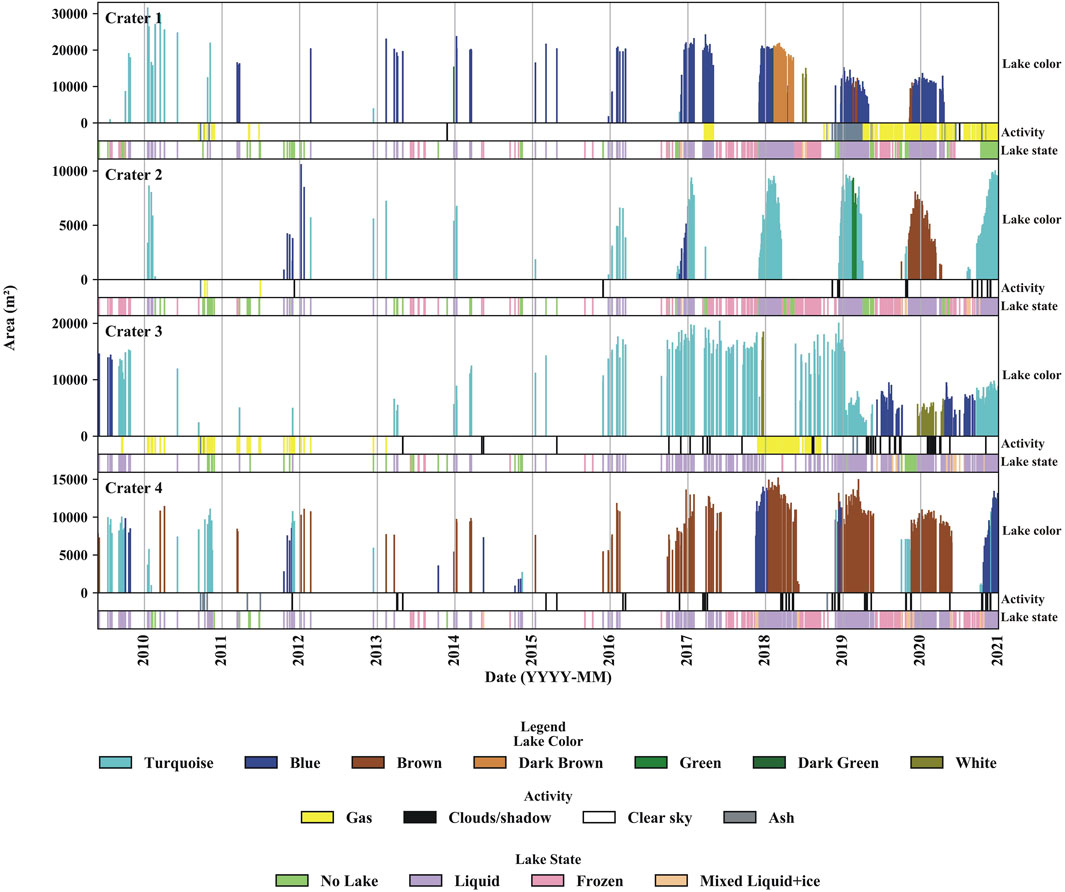
FIGURE 6. Area in m2 vs. date (YYYY-MM) is shown for Crater Lakes 1, 2, 3, and 4. The secondary graphics at the base of main graphics showed the lake color, superficial atmospheric/volcanic activity over the crater lakes (presence of gas, clouds or shadow, and ash over crater; white areas correspond to clear sky), and lake state (liquid, frozen, or mixed liquid + ice).
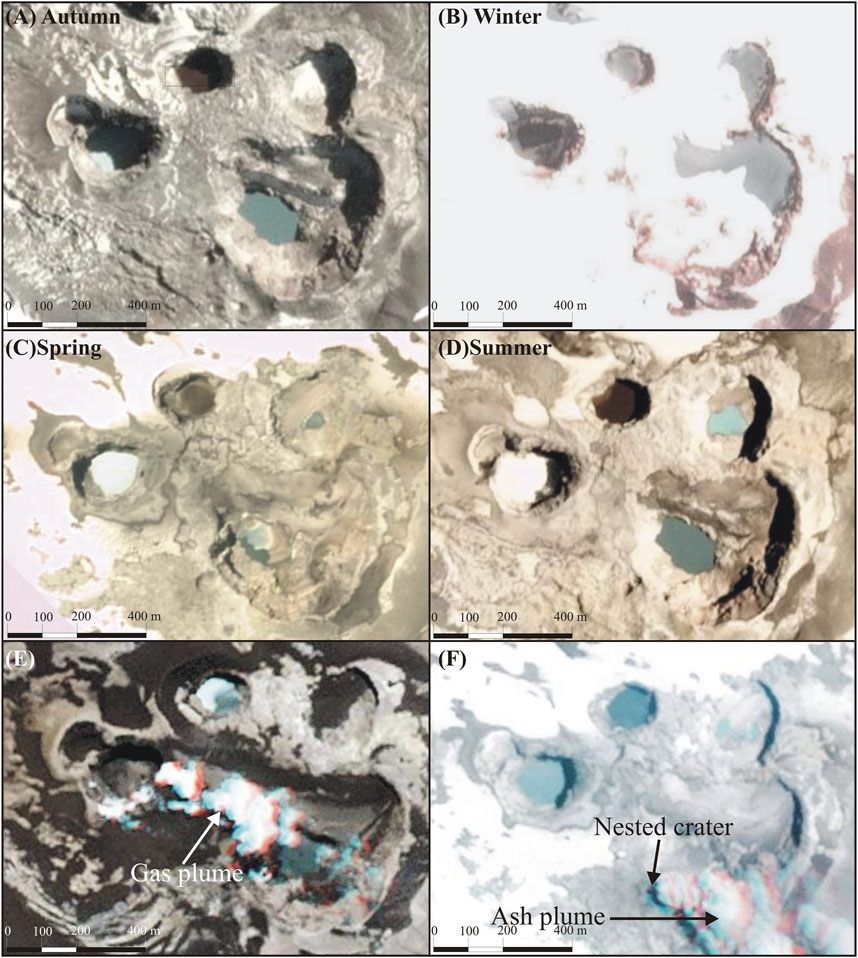
FIGURE 7. A sequence of PlanetScope images in natural color showing the Peteroa volcano crater lakes during autumn (A), winter (B), spring (C), and summer (D) seasons. Additionally, PlanetScope images in natural color show strong degassing and eruptive plume on October 25, 2010 (E) and December 14, 2018 (F), respectively.
Thermal and Temporal Evolution of Crater Lakes and Their Relation With Unrest Episodes
October 1984–January 1991
In late 1984, Peteroa volcano was in a long period of quiescence period since at least 1968 (González-Ferrán, 1995; Haller and Risso, 2011), with only two active craters (Crater 1 and 2; Figures 1, 2), both hosting lakes and fumarolic activity. Particularly in the case of Crater 1, the fumarolic activity was located in the western side of the crater (Figure 1). In the first image available from Landsat satellite (October 14, 1984; Landsat TM), a thermal anomaly was observed only in the Crater 1 fumarolic field, the lake in Crater 1 was absent, and the lake in Crater 2 produced no thermal anomaly. Up to September 1986, thermal activity was observed intermittently in the Crater 1 fumarolic field (Qrad 0.09–0.44 MW) and continuously in the lake of Crater 2 at least since January 1986, with Qvolc between 0.71 and 19 MW. On September 18, 1986, for the first time a thermal anomaly was observed in the same position as where Crater 3 is currently located, with a Qrad of 0.12 MW (Figures 2, 5). According to the Global Volcanism Program (1987), a new fumarolic field was created in the current position of Crater 3, constituted by 40–50 vents, covering an area of ∼100 m2, and producing a small plume (up to 300 m over the Peteroa caldera rim). The thermal activity related to the fumarolic field was continuous for 4 years and 5 months, being relatively stable for almost 3 years with Qrad between 0.1 and 1.1 MW (Figure 5). However, since October 1989 the Qrad began to increase up to 2.1 MW on February 1, 1990, returning to the normal values in April 1990 until November 1990, and increased between January and February 1991, with a peak of 2.1 MW on January 19, 1991 (Figure 5). In the period October 1986–January 1991, the thermal anomaly in the Crater 1 fumarolic field appeared very sporadically with relatively low Qrad (0.11–0.44 MW), whereas the Qvolc related to the Crater Lake 2 decreased quickly down to zero in December 1990, despite the occurrence of two peaks of thermal activity on February 28, 1988, and January 29, 1989 (10 and 15 MW, respectively; Figure 5).
February 1991–August 2010
Eruptive activity was recorded between 9th and February 15, 1991, when Craters 3 and 4 were formed (Figure 3; Gardeweg, 1991; Global Volcanism Program, 1991). No thermal anomalies were observed immediately after the end of the eruption in Crater lakes 1, 3, and 4, whereas in Crater Lake 2, the Qvolc measured was 0.3 MW. On April 25, 1991, thermal anomalies were detected for the first-time in Lakes 3 and 4, with Qvolc reaching up to 1.5 and 0.2 MW, respectively (Figure 5). After 1.5 years with very low Qvolc in Lakes 2, 3, and 4, the thermal activity of the Crater Lakes 2 and 3 started to increase on October 20, 1992 (Qvolc 4.5 and 9.5 MW, respectively; Figure 5), remaining relatively high in Crater Lake 3, whereas in the case of Lake 2, the thermal activity returned to a very low values after February 3, 1994 (Qvolc 6.6 MW). The lake in Crater 4 remained without detectable thermal activity up to May 3, 1994, when Qvolc measured was 0.12 MW (Figure 5).
In the following years, the activity of Crater Lake 3 remained relatively high, whilst in the case of lake 4, the thermal activity increased since December 1, 1997 (Qvolc 2.7 MW), and the Crater Lake 2 from January 25, 1999 (Qvolc 18 MW; Figure 5). The highest Qvolc for lakes 2 and 4 was detected on March 2, 2001, corresponding to 38 and 23 MW, respectively. The increase in the thermal activity in lakes 2 and 4 was coincident with the gas and tephra emissions between October and November 1998, and the increase in the gas emission in February–March 1999 and December 2000–February 2001 (Figure 5; Global Volcanism Program, 1999; Global Volcanism Program, 2001).
After February 2001, the thermal activity in Crater Lakes 2 and 4 remained relatively high, although a progressive decreasing was observed in both lakes, with the last thermal anomaly being recorded on April 26, 2009 (Qvolc 0.49 MW), and on August 2, 2010 (Qvolc 0.14 MW), for Crater 2 and 4, respectively (Figure 5). In the case of Crater Lake 3, a high and stable thermal activity was measured, and the highest Qvolc was detected on February 10, 2005 (31 MW; Figure 5). Subsequently, a decreasing thermal activity was observed, especially after March 2010, when Qvolc regularly was > 2 MW, with the lowest Qvolc detected on July 17, 2010 (0.28 MW; Figure 5). Since January 2010, an increase in the gas emission was observed in Crater Lake 3, with emissions continuing for several months up to August 8, 2010, when ash emission was observed for the first time (Aguilera et al., 2016).
In the case of Crater Lake 1, no thermal anomaly was observed in this period, whilst in the Crater 1 fumarolic field, the thermal anomaly was detected frequently, with a Qrad variable between 0.07 and 0.83 MW (Figure 5).
September 2010–December 2017
On September 4, 2010, a new eruptive cycle started in Crater 3, when several tephra explosions were observed, accompanied by an almost permanent strong degassing and the intermittent total evaporation of the lake, which caused its temporary absence (Figure 8). Despite the eruptive activity, Craters 1, 2, and 4 showed no thermal activity during the eruptive period (September 2010–July 2011), whereas Crater 3 presented low Qvolc values between 0.32 and 1.1 MW (Figures 5, 8). According to Aguilera et al. (2016), the temperatures during March 2011 in Lakes 1, 2, and 4 were 7.4, 43, and 19°C, respectively, which is consistent with the absence of a thermal anomaly in the case of Craters 1 and 4 due to their low temperatures, whereas in the case of Crater 2, the absence of thermal anomaly could be related to the very small size of lake at the moment of the measurement. After the eruptive cycle, in the period August 2011–December 2017, no anomalies were detected in Craters 1, 2, and 4, whilst in Crater 3, very sporadic anomalies were measured, with Qvolc variable from 0.13 to 1 MW up to May 2017 (Figure 5). Between June and December 2017, a fast increase in Qvolc was observed, starting with 0.34 MW (18th June) up to 20 MW (28th December; Figure 5). During the September 2010–December 2017 period, the Crater 1 fumarolic field maintained its behavior, producing sporadic thermal anomalies with Qrad variable between 0.12 and 0.7 MW (Figure 5).
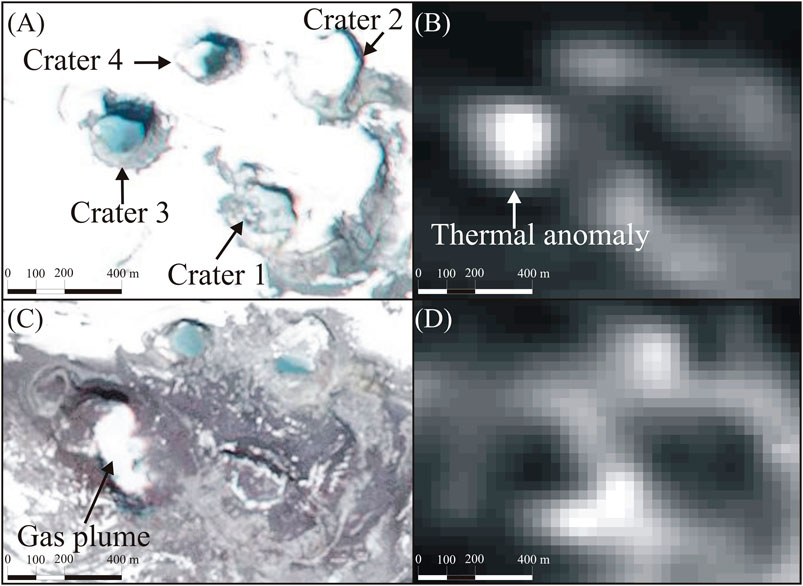
FIGURE 8. (A) RapidEye image (natural color) showing the crater lakes on October 3, 2009. (B) Landsat TM Thermal Infrared Band (TIR) showing the thermal anomaly on Crater Lake 3 (October 3, 2009). (C) RapidEye image (natural color) showing the crater lakes on November 15, 2011. A gas plume emitted from Crater 3 is also shown. (D) Landsat TM Thermal Infrared Band (TIR) showing no thermal anomalies (November 17, 2011).
January 2018–December 2020
On July 8, 2018, the first thermal anomaly was identified in Crater Lake 1 (Qvolc 1.4 MW; Figure 5), which occurred during the autumn–winter seasons, when the lake is typically frozen. The presence of the thermal anomaly is coincident with a short-lived (16 days) defrosting of the lake. In the following months, the crater was characterized by the presence of snow patches in the crater bottom and several fumarolic vents, the last producing thermal anomalies with Qvolc variable between 0.42 and 1.2 MW (Figure 5). In October 2018, the nested crater in the southwestern flank of the Crater 1, which started to be formed in January 2018 (Historical Eruptive Activity in the Period 1984–2020), began to emit gas and tephra plumes (Figure 9). Between November 2018 and May 2019, although the lake was present, it was smaller in comparison with the previous years in the same seasons and was completely absent for short periods. This period is coincident with the maximum Qvolc recorded on December 22, 2018 (6.6 MW), and April 21, 2019 (7.1 MW; Figure 5). On 6th and 7th December 2018, for the first time thermal anomalies were recorded in the nested crater using Landsat SWIR bands (Figure 9; Table 2). After May 2019 and up to early November 2019, no lake was observed (only snow patches between June and early August, and a few days in September), no thermal anomalies were recorded, and gas plumes were constantly emitted from the nested crater. From November 2019 up to December 2020, Crater 1 was characterized initially by the presence of a lake (November 2019–April 2020) and subsequently, by its total absence (snow patches were observed during late May–early June 2020). The activity in the nested crater for the same period was characterized by a constant emission of gas plumes, with very sporadic tephra explosions, and since August 2020 thermal anomalies were recorded by the Landsat SWIR bands (thermal radiance between 0.7 and 17 W/m2μmsr; Figure 9 and Table 2). Along the eruptive activity of the nested crater, the Crater 1 fumarolic field (Figure 1) showed similar behavior (intermittent thermal anomalies) and heat fluxes (0.12–0.16 MW) than previous periods (Figure 5). However, a sustained increase of the heat fluxes was observed since May 2020, with a peak of 1 MW on December 11, 2020.
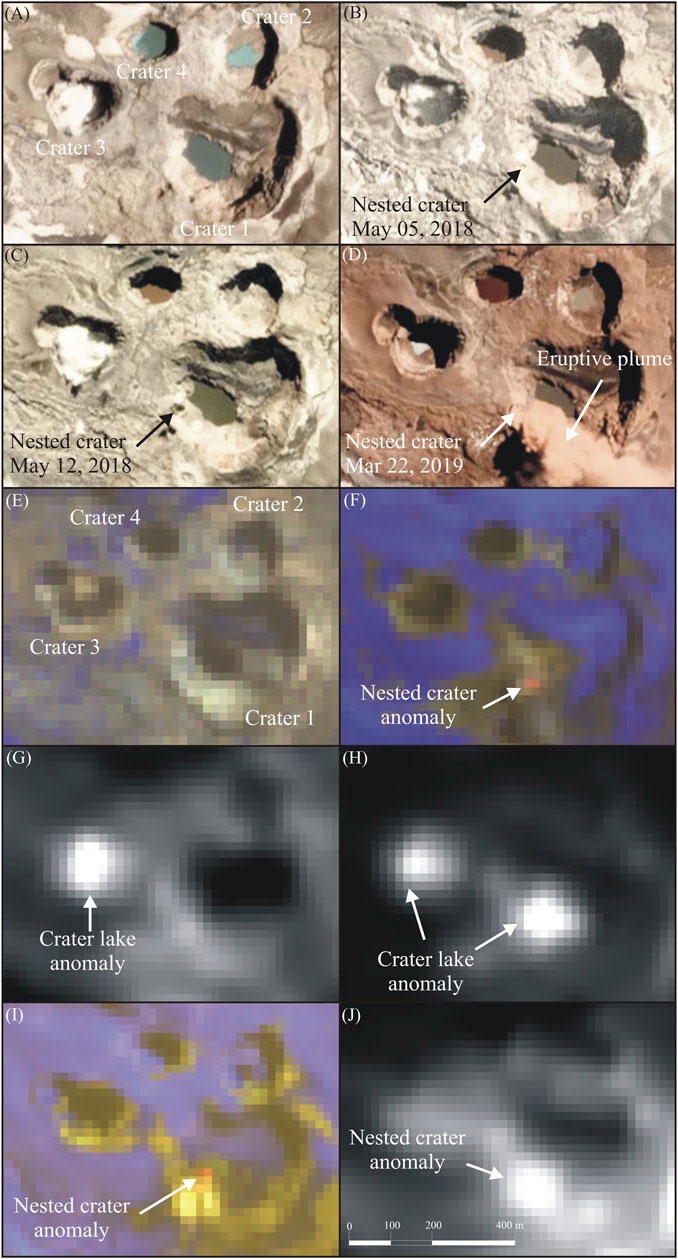
FIGURE 9. A sequence of PlanetScope images (natural color) showing the evolution of the nested crater in Crater 1 on January 12, 2018 (A), May 5, 2018 (B), May 12, 2018 (C), and March 22, 2019 (D). Landsat OLI images (combination 765 in RGB) showing the nested crater without [May 5, 2018; (E)] and with thermal anomaly [December 6, 2018; (F)]. Landsat OLI images (TIR bands) showing the thermal anomaly in Crater Lake 3 [May 5, 2018; (G)], and Crater Lakes 1 and 3 [November 4, 2018; (H)]. Landsat OLI image showing the nested crater with thermal anomaly on August 21, 2018, combination 765 in RGB (I) and TIR band (J).
Between January 2018 and January 2019, a renewed and strong thermal activity was recorded in Crater Lake 3, following the increased thermal activity observed in the previous period (started on June 18, 2017), measuring several peaks of Qvolc on 20th January, 21st February, 25th March, 29th November, and December 31, 2018 (24, 20, 22, 20, and 20 MW, respectively; Figure 5). The increase of the thermal activity is partially coincident with the increase in the eruptive and thermal activity in Crater Lake 1. However, in the next 2 years (2019–2020), very low Qvolc were measured due to the decreasing activity.
According to the Planet Labs Inc. images, in the period reviewed here (January 2018–December 2020), Crater Lakes 1, 2, and 4 showed a regular behavior considering area of the lakes and their states, being liquid and having their bigger areas during summer, whereas frozen lakes were present during winter and partially in spring and autumn. The only exception occurred in Crater 1 during spring and the beginning of summer 2020–2021 (December 2020) when the lake was completely absent, probably due to the intense thermal activity of both the nested crater and Crater 1 fumarolic field. The color of the lakes was relatively regular in the Craters 1, 2, and 4. Lake 1 was mostly blue, although in some periods it appeared in brown, dark brown, and green colors. Lake 2 was permanently turquoise, although in the summer of 2019 and 2020 it changed to green and brown color, respectively. Lake 4 is mostly brown, but at the beginning of summer season changed to blue or turquoise colors (Figure 6).
At the beginning of the period, between January and September 2018, intense evaporation was observed from Crater Lake 3, which produced a permanent gas/steam plume. This activity correlates with the high Qvolc measured in the same period. In the following months, the behavior of Crater Lake 3 had no correlation with the meteorological seasons, being mostly in liquid state (78% of the images reviewed), whereas frozen and mixed liquid + ice lakes appear in 11% of the images, and 11% absence of lake. Since January 2019, the Crater Lake 3 area has decreased to 56% of the average area in the last 9 years, whilst the color of the lake underwent changes from the regular turquoise color to blue and white.
Discussion
Cyclic Thermal Activity
Thermal Cycle 1 (September 1986–July 2011)
The thermal activity of Peteroa volcano has varied through time in concordance to the eruptive activity. Since October 1984, thermal activity was recorded exclusively in the Crater 1 fumarolic field, whilst Crater Lake 2 started with a continuous, but decreasing, thermal activity since January 1986 (Figure 5). We interpret the decreasing thermal activity in Crater Lake 2 as a remnant heat related to the unrest activity between 1959 and 1967, which occurred in that crater (González-Ferrán, 1995).
In September 1986, the appearance of a new fumarolic field in the current position of Crater 3 can be cataloged as a precursor activity previous to the eruptive cycle recorded in February 1991, which finished with the creation of Craters 3 and 4. Complementary, the sustained increase of Qrad in the fumarolic field since September 1986 up to the eruption in February 1991 (Figure 5) supports our interpretation.
After the eruptive period in February 1991, and for the next ∼20 years, the thermal activity was continuous in Crater Lakes 2, 3, and 4. In the case of Crater Lakes 2 and 4, both lakes showed very similar thermal behavior, correlating very well with the increase in degassing between October 1998 and February 2001, when an increase in Qvolc was observed, reaching a peak in March 2001, and then a progressive descending after February 2001, in coincidence with the absence of superficial activity up to December 2009. In the case of Crater 3, it seems that the thermal activity in the lake was initially not completely coupled with Craters 2 and 4, especially during the increased degassing in the period October 1998–February 2001. In fact, the highest Qvolc was measured in February 2005. However, after February 2005 its decreasing thermal activity is coincident with the decrease of Qvolc in Craters 2 and 4, suggesting that thermal activity between the three craters is linked. At the end of the ∼20 years of continuous thermal activity in the three crater lakes, the thermal activity disappeared in Crater Lakes 2 and 4, whereas in Crater 3 Qvolc remained with minimum values since April 1991.
In January 2010, eruptive activity was detected in Crater 3, characterized by phreatic explosions. This was followed by an eruptive episode that started in September 2010 and lasted 10 months (up to July 2011). We suggest that this eruptive activity is the last event related to thermal cycle 1 of Peteroa volcano.
Transitional Period (August 2011–May 2017)
This period was characterized by occurrence of thermal activity exclusively in Crater Lake 3, with sporadic presence of thermal anomalies (Qvolc <1 MW; Figure 5). We interpret that this transitional period corresponds to a residual heat after the intense thermal activity related to cycle 1.
Thermal Cycle 2 (June 2017–December 2020)
During June 2017, the thermal activity in Crater Lake 3 increased, and in July 2018, a thermal anomaly was recorded for the first time in Crater Lake 1. These anomalies are coincident with the formation of a new nested crater in the southwestern flank of Crater 1, and an eruptive episode between October 2018 and April 2019. Similarly to thermal cycle 1, we suggest that the previously described thermal activity in Crater Lakes 1 and 3 is precursor of the eruptive activity recorded since October 2018. Since December 2018, thermal activity has also been recorded in the nested crater, being detected in SWIR bands (for first time along the studied period), and the Crater 1 fumarolic field showed an increase in Qrad from May 2020, after decades of intermittent and irregular thermal activity not correlating to previous eruptive activity and thermal cycles. No thermal activity was observed in Crater Lakes 2 and 4 (Figure 5).
In this period all craters presented a regular behavior, with a liquid lake during summer and partially during late spring and early spring, whereas frozen and liquid + ice lakes occurred during winter, late autumn, and early spring. The only exception corresponds to Crater Lake 3, especially during 2017, where the lake was present in liquid state also during autumn, winter, and spring. Since March 2018, the lake area in Crater 1 decreased progressively, disappearing completely in April 2020, whereas Crater Lake 3 decreased in area since January 2019 from ∼15,000 to ∼5,000 m2 (Figure 6).
The 1) detection of thermal anomalies in Crater Lake 1 and the nested crater, 2) decreasing of the area in the Crater Lakes 1 and 3, 3) increase of thermal activity in the Crater 1 fumarolic field and Crater 3, and 4) previous of eruptive activity in the period December 2018–April 2019 all suggest a second thermal cycle. In this cycle, Crater Lakes 1 and 3, Crater 1 fumarolic field, and the nested crater are involved and directly linked.
Relationships Between Migration of Thermal/Eruptive Activity, Fluid Pathways, and Magma Sources
The migration of eruptive and thermal activity has been clearly observed in Peteroa volcano. Eruptive activity during the 20th century was concentrated mainly in Crater 2 (González-Ferrán, 1995). In fact, the first thermal activity detected with Landsat imagery in Peteroa volcano was in Crater 2 (Figure 5). However, at the beginning of thermal cycle 1, the activity migrated to the new fumarolic field located in the current position of Crater 3, and after the eruptive activity of February 1991, when Crater 3 and 4 were formed, the thermal activity was concentrated in the Craters 2, 3, and 4. At the end of thermal cycle 1, the thermal and eruptive activity were concentrated exclusively in Crater 3. Subsequently, in thermal cycle 2 the thermal activity was still active in Crater 3, with the thermal and eruptive activity concentrated in Crater 1. The migration has been accompanied by simultaneous thermal activity in at least two craters, which suggests an interconnection between the fluid pathways that feed the crater lakes. In fact, the formation of Craters 3 and 4 during the eruptive activity of February 1991 evidences that fluid pathways are related and/or connected to each other. Additionally, we suggest that Crater 2 was partially connected with Craters 3 and 4, considering the simultaneous thermal activity early in thermal cycle 1 with the fumarolic field, and subsequently, the coincident thermal activity of Crater Lakes 2, 3, and 4. Similarly, early in thermal cycle 2, the coincident thermal activity of Crater Lakes 1 and 3, including the precursory activity of October 2018–April 2019 unrest, could be a consequence of an interconnection of fluid pathways between these crater lakes.
The migration of eruptive/thermal activity, and the possible interconnection of crater lakes, could be partially explained by the presence of more than one magmatic source. Romero et al. (2020) showed that eruptive products related to the activities of the scoria cone in 1937, February 1991, and October 2018–April 2019, had basaltic andesite, andesitic-to-dacitic, and andesitic compositions, respectively. These three eruptions involved juvenile products, whereas eruptive products from September 2010–July 2011 were constituted only by lithics fragments, without juvenile products, and a wide range of compositions, including from basaltic andesites to rhyolites. Similarly, Tassi et al. (2016) showed that fumarolic gases from Crater 2 varied their compositions in the period between February 2010 and March 2015. Fumarolic fluids emitted between 2010 and 2011 were sourced from a basaltic magma body, fumarolic fluids released during 2012 had compositions related to a more degassed dacitic body, whereas gases sampled in 2014 and 2015 showed compositions compatible with a mixing of fluids from both sources. Consequently, both gas and rock geochemistry data show evidence of the existence of at least two magmatic sources. We suggest that those magmatic sources are feeding and connecting the crater lakes, and sourcing the fluids released and the eruptive products, individually and/or mixed, in different periods of time. Probably the location of the magmatic sources, and how these sources are connected to the craters that host the acid lakes, dictate the migration of the thermal/eruptive activity.
Energy Balance of Peteroa Volcano Crater Lakes
According to our data (Supplementary Table S1), and the previously exposed relation between Qvolc and eruptive activity, the energy balance of four crater lakes in Peteroa volcano is primarily controlled by volcanic activity, and partially affected by seasonal effects. In fact, the variations of Qvolc, Qrad, Qevap, and Qcond were directly controlled by the eruptive activity, the increase/decrease of degassing (in both fumarolic fields and lakes), and the activity of the crater lakes. Qvolc from crater lakes and Qrad both from crater lakes and fumarolic fields showed a close relation with the occurrence of eruptive activity, changes in the crater lakes, and degassing processes, especially in the cases previous to February 1991 eruption, with increasing degassing in the period October 1998–February 2001, and before, during, and after the eruptive process between January 2018 and May 2019. On the contrary, before and during the eruptive activity for the period September 2010–July 2011, a fast decrease in Qvolc and Qrad was recorded, lasting for several years after this unrest period. Qcond and Qevap showed similar behavior, although they are partially influenced by seasonal effects, as it is reflected in the oscillatory behavior of Qvolc (Figure 5). The oscillation is caused by the decrease in evaporation and conduction during the winter season (partially in spring and autumn), when the crater lakes are totally or partially frozen. Despite this, we reduced the seasonal effects by use of fixed atmospheric parameters such as wind speed, atmospheric pressure, and precipitation rate, which could be strongly dependent on seasonal effects (Uncertainties Related to Atmospheric Parameters). Qevap, and consequently Qcond, are dependent on the lake area, which is partially controlled by seasonal effects. However, it has been observed that the variation of lake areas is strongly influenced by the eruptive activity, especially in the cases of Crater Lakes 1 and 3 (e.g., 2010–2011, and 2018–2020 unrest activity; Aguilera et al., 2016; Romero et al., 2020). Additionally, it is noteworthy that the oscillatory behavior of Qvolc is strongly controlled by the absence or limited data due to total or partial cloud coverage over crater lakes, producing an underestimation of Qvolc, especially in cases when total cloud coverage occurs, where Qvolc = 0 (Figure 5). Although seasonal effects do not totally mask the primary volcanic activity in a long-term assessment of the Qvolc, they must be taken into account when short periods of time are considered, since some climate factors (e.g., evaporation) can cause under or overestimation of Qvolc, during winter and summer seasons, respectively. In the case of Qsun and Qatm, they showed a very limited influence on Qvolc, whilst Qcond-volc is negligible as was indicated previously in the Heat Flux Calculations.
The highest Qvolc recorded on Peteroa volcano was reached during a quiescence period, specifically in January 2006, corresponding to 59 MW, when three craters were thermally active (Craters 2, 3, and 4). Individually, the peak of Crater Lake 1 occurred at the end of October 2018–April 2019 eruptive activity (April 2019, 7.1 MW), and in Crater Lakes 2 and 4 immediately after the increase in degassing period between October 1998 and February 2001 finished (March 2001, 38 and 23 MW, respectively), and the peak of Crater Lake 3 occurred during a quiescence period (January 2005, 31 MW). According to those Qvolc, Peteroa volcano can be considered at a global scale as a low volcanic heat flux system. Similar Qvolc has been found during quiescence periods in Copahue (Chile–Argentina) (7–45 MW; Varekamp et al., 2001), Ruapehu (New Zealand) (50 MW; Hurst et al., 2012), Ebeko (Kuril Islands, Russia), and Quilotoa (Ecuador) volcanoes (69 and 72 MW; Pasternack and Varekamp, 1997), whereas moderate-to-high Qvolc have been measured at 68–111 Kawah Ijen (Indonesia) (Lewicki et al., 2016) and Poás (Costa Rica) volcanoes ∼200–600 (Rowe et al., 1992). As a comparison, volcanoes during unrest periods could reach high Qvolc like the cases of Ruapehu volcano (265 MW; Hurst et al., 2012) and Kawah Ijen volcano (289–430 MW; Lewicki et al., 2016). The low volcanic heat flux emitted from Peteroa volcano can be explained by the small size of the crater lakes, and probably by the limited contributions from magmatic sources to the lakes (Aguilera et al., 2016), which prevent higher volcanic heat fluxes. This behavior is very similar to that observed on Copahue volcano, previous to the eruptive activity of 2012 (Caselli et al., 2016). Consequently, despite the frequent eruptive activity on Peteroa volcano, the scarce magmatic inputs produce low Qvolc during unrest periods. This is clearly observed in its thermal precursory activity, which starts when thermal activity is very low or absent. Consequently, the occurrence of medium-to-high Qvolc in Peteroa volcano could be considered as an increase of the magmatic inputs, and a precursor of major future eruptive activity.
Conclusion
We conclude that only two major eruptive/thermal cycles have occurred at Peteroa volcano in the period 1984–2020; the first one represented by the formation of a new fumarolic field and Craters 3 and 4, followed by the thermal activity of Crater Lakes 2, 3, and 4, which were directly related to strong degassing process occurring between October 1998 and February 2001 (Figures 5, 10). This process finished with the September 2010–July 2011 eruptive episode. The second cycle is represented by the reactivation of Crater Lake 3, detection of the thermal activity in Crater Lake 1, formation of the nested crater in Crater 1, occurrence of the eruptive episode between October 2018 and April 2019, and an increase of the thermal activity in the Crater 1 fumarolic field and the nested crater (Figures 5, 10). The increase of thermal activity in the new fumarolic field located in the current site where Crater 3 is present (early thermal cycle 1) and the increase of Qvolc in Crater Lakes 1 and 3 (early thermal cycle 2) can be considered as good examples of how thermal information from satellite images can be used to detect possible precursors to eruptive activity, even in volcanoes with low volcanic heat fluxes, like the case of Peteroa volcano.
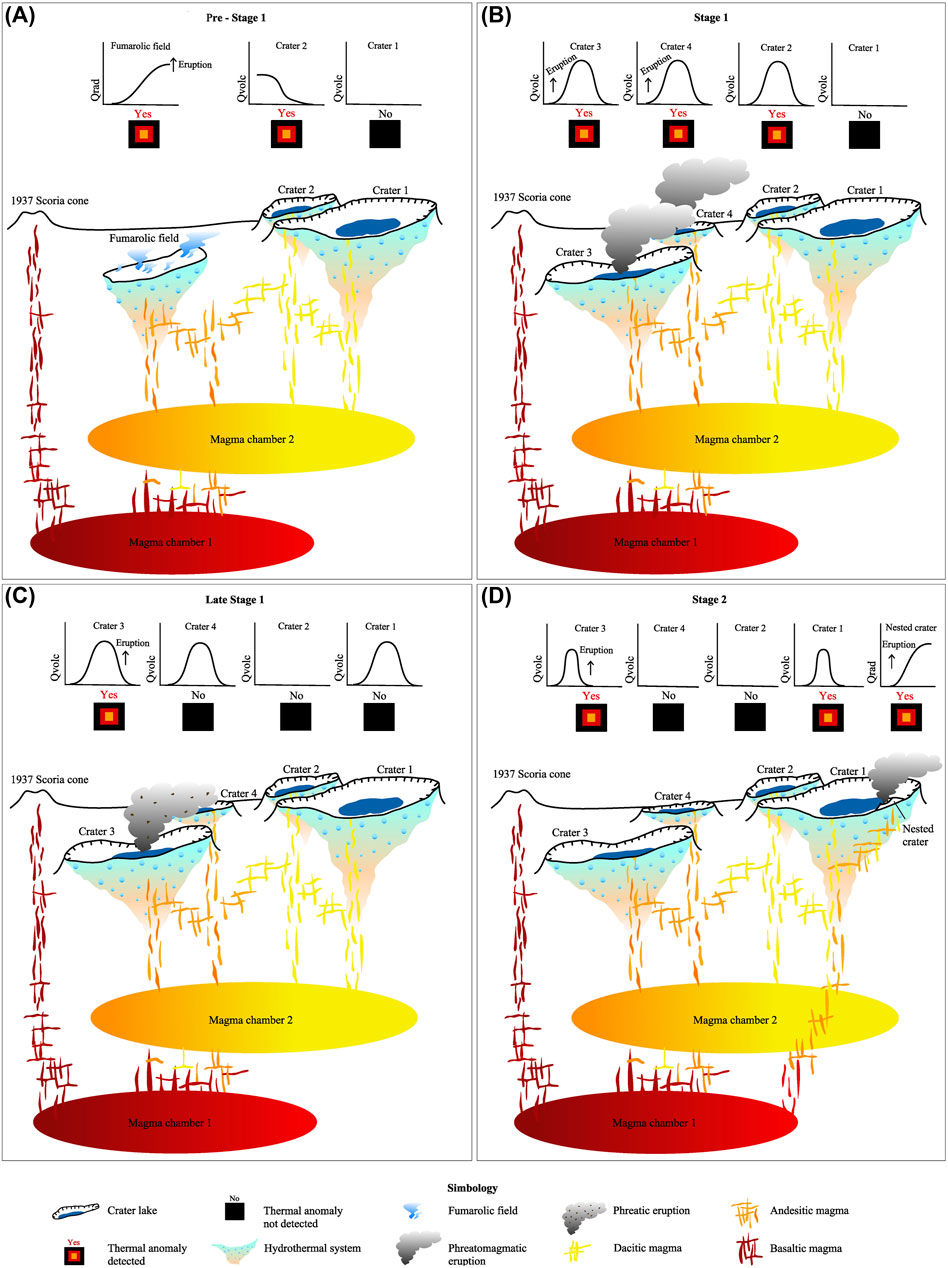
FIGURE 10. Conceptual model of Peteroa volcano evolution between 1984 and 2020. (A) Pre-Stage 1 (1984-January 1991). (B) Early Stage 1 (February 1991–August 2010). (C) Late Stage 1 (September 2010–July 2011). (D) Stage 2 (June 2017–December 2020). Presence/absence of thermal anomalies and behavior of Qvolc and Qrad are also shown. Model not to scale.
One of the most important findings is that we have observed the migration of the thermal/eruptive activity, and the interconnection of fluid pathways that feed the crater lakes (Figure 10). Both processes seem to be partially related to the existence of at least two deep magmatic sources, which are feeding the craters that host the acid lakes.
The Qvolc in the four crater lakes are primarily controlled by volcanic activity, whereas seasonal effects can affect the Qvolc at short-term, whilst at long-term the seasonal effects do not show major influence. The highest Qvolc on Peteroa volcano was measured during a quiescence period (59 MW), which included thermal activity in three crater lakes (lakes 2, 3, and 4). During unrest periods, Qvolc in single crater lakes varied from 7.1 to 38 MW, which still corresponds to low volcanic heat flux. Consequently, we expect that future medium-to-high Qvolc could be considered as a possible precursor to major magmatic-dominated eruptive activity.
Data Availability Statement
The original contributions presented in the study are included in the article/Supplementary Material; further inquiries can be directed to the corresponding author.
Author Contributions
FA and SL made the conceptualization and wrote the heat fluxes routines; FA wrote and reviewed the original draft; JC downloaded and processed the satellite images database and reviewed the original draft; SL reviewed the original draft and drew the figures.
Funding
This work has been partially funded by Antofagasta Regional Government, FIC-R project, code BIP N°30488832-0 and by Research Center for Integrated Disaster Risk Management (CIGIDEN), ANID/FONDAP/15110017. SL is funded by CONICYT-PCHA Doctorado Nacional 2016-21160276 fellowship.
Conflict of Interest
The authors declare that the research was conducted in the absence of any commercial or financial relationships that could be construed as a potential conflict of interest.
Publisher’s Note
All claims expressed in this article are solely those of the authors and do not necessarily represent those of their affiliated organizations, or those of the publisher, the editors, and the reviewers. Any product that may be evaluated in this article, or claim that may be made by its manufacturer, is not guaranteed or endorsed by the publisher.
Acknowledgments
Our acknowledgements to Planet Labs Education and Research Standard Program for providing us the PlanetScope and RapidEye imagery. We are warmly grateful of Dr. Thomas Wilkes (The University of Sheffield, United Kingdom) for his English revision of the last version of the manuscript. Alfredo Esquivel (Universidad Católica del Norte, Chile) to provide data related to atmospheric parameters, and to Felipe Rojas (Universidad Católica del Norte, Chile) for his very valuable help in the drawing of some graphics. Our acknowledgments to two reviewers and the editors (Dr. Valerio Acocella and Dr. Dmitri Rouwet) by their comments, which helped to improve the original version of the manuscript.
Supplementary Material
The Supplementary Material for this article can be found online at: https://www.frontiersin.org/articles/10.3389/feart.2021.722056/full#supplementary-material
References
Aguilera, F., Benavente, O., Gutiérrez, F., Romero, J., Saltori, O., González, R., et al. (2016). Eruptive Activity of Planchón-Peteroa Volcano for Period 2010-2011, Southern Andean Volcanic Zone, Chile. andgeo 43 (1), 20–46. doi:10.5027/andgeoV43n1-a02
Aldeghi, A., Carn, S., Escobar-Wolf, R., and Groppelli, G. (2019). Volcano Monitoring from Space Using High-Cadence Planet CubeSat Images Applied to Fuego Volcano, Guatemala. Remote Sensing 11, 2151. doi:10.3390/rs11182151
Benavente, O., Tassi, F., Gutiérrez, F., Vaselli, O., Aguilera, F., and Reich, M. (2013). Origin of Fumarolic Fluids from Tupungatito Volcano (Central Chile): Interplay between Magmatic, Hydrothermal, and Shallow Meteoric Sources. Bull. Volcanol 75, 746. doi:10.1007/s00445-013-0746-x
Brown, G. C., Rymer, H., and Stevenson, D. (1991). Volcano Monitoring by Microgravity and Energy Budget Analysis. J. Geol. Soc. 148, 585–593. doi:10.1144/gsjgs.148.3.0585
Candela-Becerra, L. J., Toyos, G., Suárez-Herrera, C. A., Castro-Godoy, S., and Agusto, M. (2020). Thermal Evolution of the Crater lake of Copahue Volcano with ASTER during the Last Quiescence Period between 2000 and 2012 Eruptions. J. Volcanology Geothermal Res. 392, 106752. doi:10.1016/j.jvolgeores.2019.106752
Caselli, A., Agusto, M., Velez, M. L., Forte, P., Bengoa, C., Daga, R., et al. (2016). “The 2012 Eruption,” in Copahue Volcano. Editors F. Tassi, O. Vaselli, and A. Caselli (Berlin Heidenberg: Springer-Verlag), 61–77. doi:10.1007/978-3-662-48005-2_4
Caudron, C., Mazot, A., and Bernard, A. (2012). Carbon Dioxide Dynamics in Kelud Volcanic lake. J. Geophys. Res. 117, a–n. doi:10.1029/2011JB008806
Christenson, B., Németh, K., Rouwet, D., Tassi, F., Vandemeulebrouck, J., and Varekamp, J. C. (2015). “Volcanic Lakes,” in Volcanic Lakes. Editors D. Rouwet, B. Christenson, F. Tassi, and J. Vandemeulebrouk (Berlin Heidenberg: Springer-Verlag), 1–20. doi:10.1007/978-3-642-36833-2_1
Dmitri Rouwet, D., and Franco Tassi, F. (2011). Geochemical Monitoring of Volcanic Lakes. A Generalized Box Model for Active Crater Lakes. Ann. Geophys. 54, 2. doi:10.4401/ag-5035
Gardeweg, M. (1991). Erupción 1991 Volcán Planchón-Peteroa (Informe N°1). Santiago, Chile: SERNAGEOMIN.
Global Volcanism Program (1987). “Report on Planchon-Peteroa (Chile),” in Scientific Event Alert Network Bulletin. Editor L. McClelland (Smithsonian Institution), 12, 3. doi:10.5479/si.GVP.SEAN198703-357040
Global Volcanism Program (1991). “Report on Planchon-Peteroa (Chile),” in Bulletin of the Global Volcanism Network. Editor L. McClelland (Smithsonian Institution), 16, 1. doi:10.5479/si.GVP.BGVN199101-357040
Global Volcanism Program (2019). “Report on Planchon-Peteroa (Chile),” in Bulletin of the Global Volcanism Network. Editors D. B. Krippner,, and E. Venzke (Smithsonian Institution), 44, 6. doi:10.5479/si.GVP.BGVN201906-357040
Global Volcanism Program (1999). “Report on Planchon-Peteroa (Chile),” in Bulletin of the Global Volcanism Network. Editor R. Wunderman (Smithsonian Institution), 24, 3. doi:10.5479/si.GVP.BGVN199903-357040
Global Volcanism Program (2001). “Report on Planchon-Peteroa (Chile),” in Bulletin of the Global Volcanism Network. Editor R. Wunderman (Smithsonian Institution), 26, 3. doi:10.5479/si.GVP.BGVN200103-357040
Haar, L., Gallagher, J. S., and Kelt, G. S. (1984). NBS/NRC Steam Tables. New York: Hemisphere, 320. doi:10.1002/cite.330570931
Haller, M. J., Ostera, H. A., Pesce, A. H., Gardini, M., and Folguera, A. (1994). Vulcanoestratigrafía reciente y eruptividad del Volcán Peteroa. Actas: 7° Congreso Geológico Chileno, 319–323. (Concepción).
Haller, M. J., and Risso, C. (2011). La erupción del volcán Peteroa (35°15’S, 70°18’o) del 4 de septiembre de 2010. Rev. Asoc. Geol. Argent. 68 (2), 295–305.
Hurst, T., Christenson, B., and Cole-Baker, J. (2012). Use of a Weather Buoy to Derive Improved Heat and Mass Balance Parameters for Ruapehu Crater Lake. J. Volcanology Geothermal Res. 235-236, 23–28. doi:10.1016/j.jvolgeores.2012.05.004
Kling, G. W., Evans, W. C., and Tanyileke, G. Z. (2015). “The Comparative Limnology of Lakes Nyos and Monoun, Cameroon,” in Volcanic Lakes. Editors D. Rouwet, B. Christenson, F. Tassi, and J. Vandemeulebrouk (Berlin Heidenberg: Springer-Verlag), 401–425. doi:10.1007/978-3-642-36833-2_18
Klug, J., Singer, B., Jicha, B., Ramirez, A., and Sruoga, P. (2018). “40Ar/39Ar Geochronology and Geochemical Evolution of Planchon-Peteroa Volcanic Complex,” in GSA Annual Meeting in Indianapolis, Indiana, USA – 2018, January 2018 (Boulder, CO: Geological Society of America Abstracts with Programs), 270–277. doi:10.1130/abs/2018am-322292
Layana, S., Aguilera, F., Rojo, G., Vergara, Á., Salazar, P., Quispe, J., et al. (2020). Volcanic Anomalies Monitoring System (VOLCANOMS), a Low-Cost Volcanic Monitoring System Based on Landsat Images. Remote Sensing 12, 1589. doi:10.3390/rs12101589
Lewicki, J. L., Caudron, C., van Hinsberg, V. J., and Hilley, G. E. (2016). High Spatio-Temporal Resolution Observations of Crater lake Temperatures at Kawah Ijen Volcano, East Java, Indonesia. Bull. Volcanol 78, 53. doi:10.1007/s00445-016-1049-9
Liaudat, D. T., Penas, P., and Aloy, G. (2014). Impact of Volcanic Processes on the Cryospheric System of the Peteroa Volcano, Andes of Southern Mendoza, Argentina. Geomorphology 208, 74–87. doi:10.1016/j.geomorph.2013.11.016
López-Escobar, L., Cembrano, J., and Moreno, H. (1995). Geochemistry and Tectonics of the Chilean Southern Andes Basaltic Quaternary Volcanism (37-46°S). Rev. Geol. Chile 22 (2), 219–234. doi:10.5027/andgeoV22n2-a06
Mapelli, F., Marasco, R., Rolli, E., Daffonchio, D., Donachie, S., and Borin, S. (2015). “Microbial Life in Volcanic Lakes,” in Volcanic Lakes. Editors D. Rouwet, B. Christenson, F. Tassi, and J. Vandemeulebrouk (Berlin Heidenberg: Springer-Verlag), 507–522. doi:10.1007/978-3-642-36833-2_23
Mazza, R., Taviani, S., Capelli, G., De Benedetti, A. A., and Giordano, G. (2015). “Quantitative Hydrogeology of Volcanic Lakes: Examples from the Central Italy Volcanic Lake District,” in Volcanic Lakes. Editors D. Rouwet, B. Christenson, F. Tassi, and J. Vandemeulebrouk (Berlin Heidenberg: Springer-Verlag), 355–377. doi:10.1007/978-3-642-36833-2_16
Murphy, S., Wright, R., and Rouwet, D. (2018). Color and Temperature of the Crater Lakes at Kelimutu Volcano through Time. Bull. Volcanol 80, 2. doi:10.1007/s00445-017-1172-2
Naranjo, J. A., and Haller, M. J. (2002). Erupciones holocenas principalmente explosivas del volcán Planchón, Andes del sur (35°15'S). Rev. Geol. Chile 29 (1), 93–113. doi:10.4067/S0716-02082002000100006
Naranjo, J. A., Haller, M. J., Ostera, H. A., Pesce, A. H., and Sruoga, P. (1999). Geología y peligros del Complejo Volcánico Planchón-Peteroa, Andes del Sur (35°15’S), Región del Maule, Chile-Provincia de Mendoza, Argentina. Boletín 52, 55.
Naranjo, J. A., and Polanco, E. (2004). The 2000 AD Eruption of Copahue Volcano, Southern Andes. Rev. Geol. Chile 31 (2), 279–292. doi:10.4067/S0716-02082004000200007
Oppenheimer, C. (1996). Crater lake Heat Losses Estimated by Remote Sensing. Geophys. Res. Lett. 23 (14), 1793–1796. doi:10.1029/96GL01591
Oppenheimer, C. (1993). Infrared Surveillance of Crater Lakes Using Satellite Data. J. Volcanology Geothermal Res. 55, 117–128. doi:10.1016/0377-0273(93)90093-7
Oppenheimer, C. (1997a). Ramifications of the Skin Effect for Crater lake Heat Budget Analysis. J. Volcanology Geothermal Res. 75, 159–165. doi:10.1016/S0377-0273(96)00037-6
Oppenheimer, C. (1997b). Remote Sensing of the Colour and Temperature of Volcanic Lakes. Int. J. Remote Sensing 18, 5–37. doi:10.1080/014311697219259
Pasternack, G. B., and Varekamp, J. C. (1997). Volcanic Lake Systematics I. Physical Constraints. Bull. Volcanology 58, 528–538. doi:10.1007/s004450050160
Robie, R. A., Hemingway, B. S., and Fisher, J. (1978). Thermodynamic Properties of Minerals and Related Substances at 298.15 K and 1 Bar (105 Pascals) Pressure and at Higher Temperatures. US Geol. Surv. Bull. 1452, 456. doi:10.3133/b1452
Romero, J. E., Aguilera, F., Delgado, F., Guzmán, D., Van Eaton, A. R., Luengo, N., et al. (2020). Combining Ash Analyses with Remote Sensing to Identify Juvenile Magma Involvement and Fragmentation Mechanisms during the 2018/19 Small Eruption of Peteroa Volcano (Southern Andes). J. Volcanology Geothermal Res. 402, 106984. doi:10.1016/j.jvolgeores.2020.106984
Rouwet, D., Mora-Amador, R., Ramírez-Umaña, C. J., González, G., and Inguaggiato, S. (2017). “Dynamic Fluid Recycling at Laguna Caliente (Poás, Costa Rica) before and during the 2006-ongoing Phreatic Eruption Cycle (2005-10),”. Geochemistry and Geophysics of Active Volcanic Lakes. Editors T. Ohba, B. Capaccioni, and C. Caudron (London: Geological Society), 437, 73–96. doi:10.1144/SP437.11
Rowe, G. L., Brantley, S. L., Fernandez, M., Fernandez, J. F., Borgia, A., and Barquero, J. (1992). Fluid-volcano Interaction in an Active Stratovolcano: the Crater lake System of Poás Volcano, Costa Rica. J. Volcanology Geothermal Res. 49, 23–51. doi:10.1016/0377-0273(92)90003-V
Ryan, P. J., Harleman, D. R. F., and Stolzenbach, K. D. (1974). Surface Heat Loss from Cooling Ponds. Water Resour. Res. 10, 930–938. doi:10.1029/WR010i005p00930
Sellés, D., Rodríguez, A. C., Dungan, M. A., Naranjo, J. A., and Gardeweg, M. (2004). Geochemistry of Nevado de Longaví Volcano (36.2°S): a compositionally atypical arc volcano in the Southern Volcanic Zone of the Andes. Rev. Geol. Chile 31 (2), 293–315. doi:10.4067/S0716-02082004000200008
Stern, C. R. (2004). Active Andean Volcanism: Its Geologic and Tectonic Setting. Rev. Geol. Chile 31, 161–206. doi:10.5027/andgeoV31n2-a01
Tassi, F., Aguilera, F., Benavente, O., Paonita, A., Chiodini, G., Caliro, S., et al. (2016). Geochemistry of Fluid Discharges from Peteroa Volcano (Argentina-Chile) in 2010-2015: Insights into Compositional Changes Related to the Fluid Source Region(s). Chem. Geology. 432, 41–53. doi:10.1016/j.chemgeo.2016.04.007
Tormey, D., Frey, F., and López-Escobar, L. (1989). Geologic History of the Active Azufre-Planchón-Peteroa Volcanic Center (35°15’S, Southern Andes) with Implications for the Development of Compositional Gaps. Rev. Asoc Geol. Argent 44 (1–4), 420–430.
Tormey, D. (2010). Managing the Effects of Accelerated Glacial Melting on Volcanic Collapse and Debris Flows: Planchon-Peteroa Volcano, Southern Andes. Glob. Planet. Change 74 (2), 82–90. doi:10.1016/j.gloplacha.2010.08.003
Tormey, D. R., Frey, F. A., and Lopez-Escobar, L. (1995). Geochemistry of the Active Azufre--Planchon--Peteroa Volcanic Complex, Chile (35 15'S): Evidence for Multiple Sources and Processes in a Cordilleran Arc Magmatic System. J. Pet. 36 (2), 265–298. doi:10.1093/petrology/36.2.265
Trunk, L., and Bernard, A. (2008). Investigating crater lake warming using ASTER thermal imagery: Case studies at Ruapehu, Poás, Kawah Ijen, and Copahué Volcanoes. J. Volcanology Geothermal Res. 178, 259–270. doi:10.1016/j.jvolgeores.2008.06.020
Keywords: Southern Volcanic Zone of the Andes, eruptive activity, RapidEye, PlanetScope, VIPS, VOLCANOMS, energy balance
Citation: Aguilera F, Caro J and Layana S (2021) The Evolution of Peteroa Volcano (Chile–Argentina) Crater Lakes Between 1984 and 2020 Based on Landsat and Planet Labs Imagery Analysis. Front. Earth Sci. 9:722056. doi: 10.3389/feart.2021.722056
Received: 08 June 2021; Accepted: 23 September 2021;
Published: 28 October 2021.
Edited by:
Dmitri Rouwet, Istituto Nazionale di Geofisica e Vulcanologia, sezione di Bologna, ItalyReviewed by:
Akihiko Terada, Tokyo Institute of Technology, JapanClive Oppenheimer, University of Cambridge, United Kingdom
Copyright © 2021 Aguilera, Caro and Layana. This is an open-access article distributed under the terms of the Creative Commons Attribution License (CC BY). The use, distribution or reproduction in other forums is permitted, provided the original author(s) and the copyright owner(s) are credited and that the original publication in this journal is cited, in accordance with accepted academic practice. No use, distribution or reproduction is permitted which does not comply with these terms.
*Correspondence: Felipe Aguilera, ZmVhZ3VpbGVyYUB1Y24uY2w=