- 1State Key Laboratory of Geodesy and Earth’s Dynamics, Innovation Academy for Precision Measurement Science and Technology, Chinese Academy of Sciences, Wuhan, China
- 2University of the Chinese Academy of Sciences, Beijing, China
Satellite radar altimetry has made unique contributions to global and coastal gravity field recovery. This paper starts with a general introduction followed by the progress of satellite radar altimetry technology. Then, the methods of marine gravity field recovery and dominating gravity models are described briefly. Finally, typical gravity models are compared with shipboard gravity measurements to evaluate their accuracies in offshore and coastal regions of China. The root mean squares of deviations between gravity models and shipboard gravity are all more than 7 mGal in offshore regions and within the range of 9.5–10.2 mGal in coastal regions. Further analysis in coastal regions indicates that the new gravity models with new satellite missions including Jason-2, SARAL/Altika, and Envisat data have relatively higher accuracy, especially SARAL/Altika data, significantly improving the coastal gravity field. Accuracies are low in areas with strong currents, showing that tide correction is very important for altimetry-derived marine gravity recovery as well as shipboard measurements in coastal gravity field determination. Moreover, as an external check, shipboard gravity data need more operations to improve their precision, such as higher instrument accuracy and finer data processing.
Introduction
The gravity field is one of the most important basic physical fields of the Earth, reflecting the distribution, movement, and state change of Earth’s interior material. Marine gravity anomalies are important data sources to construct Earth’s gravity field, as the ocean occupies approximately 70% of the Earth’s surface. High accuracy marine gravity observations are essential data for seafloor bathymetry and marine geological structure and mineral resource distributions, submarine volcanoes, and global changes (Fairhead et al., 2001; Fu et al., 2001; Sandwell and Smith., 2009,2014; Hwang and Chang, 2014; Li et al., 2020; Li et al., 2021).
A variety of methods can be applied to determine the marine gravity field, at respective accuracy and spatial resolutions, using ship or airborne gravity measurements, satellite gravity, satellite altimetry, and satellite gradiometry. Marine gravity data measured onboard ships and airplanes usually have sparse data coverage, long measurement periods, and lack of repeated observations, making it impossible to obtain global marine gravity information in a relatively short time. However, their high accuracies make them important means for auxiliary measurement to construct global marine gravity field (Forsberg and Olesen 2010). Gravity Recovery and Climate Experiment (GRACE) twin-satellite gravimetry mission can only detect Earth’s mass transport signals in medium-long waves longer than 300–400 km (half-wavelength) (Tapley et al., 2004; Tapley et al., 2019). In recent decades, satellite altimetry has evolved as an effective tool for recovering the global or regional marine gravity field due to its high resolution, wide coverage, and easy access to the data (Rapp, 1979; Haxby et al., 1983; Sandwell and Smith, 1997; Andersen and Knudsen, 1998; Hwang, 1998; Sandwell et al., 2014). Satellite altimeters developed from first-generation altimeters on Geosat/GM and ERS-1/GM, through more altimeter series on TOPEX/Poseidon, Envisat, Jason-1/2, and HY-2, to the new generation, either in SAR mode (CryoSat-2 over ocean, Sentinel-3, and Sentinel-6) or in Ka band (SARAL/AltiKa, abbreviated Altika) have significantly improved the quality of altimetry range in terms of accuracy and spatial resolution (Abdalla et al., 2021; Zhang and Sandwell, 2016). Accordingly, the levels of accuracy and precision of altimetry-derived marine gravity field models, which can be derived from radar altimeter measurements of sea surface heights (Rapp, 1979; Haxby et al., 1983) or slopes (Sandwell and Smith, 1997; Andersen and Knudsen, 1998; Hwang, 1998), have greatly evolved. Until now, they have demonstrated accuracy and spatial resolution at 1–2 mGal and 1′ × 1′ (approximately 2 km × 2 km), respectively and, as a result, have allowed many contemporary geophysical questions to be addressed (e.g., Fairhead et al., 2001; Bao et al., 2013; Sandwell et al., 2013; Sandwell et al., 2014; Sandwell et al., 2019; Hwang and Chang, 2014; Andersen et al., 2019; Li et al., 2020; Li et al., 2021).
In the early 1980s, the first global marine gravity map was produced by the Lamont Doherty geological observatory, which marked a significant step towards the study of global, high resolution, and high accuracy marine gravity field models (Zhang et al., 2020). Over the years, the theory for recovering marine gravity fields by using satellite radar altimetry has been developed. Several methods can be adopted to derive marine gravity fields using satellite altimetry observations, such as the inverse Stokes formula, inverse Vening-Meinesz formula (IVM formula), and least squares collocation method (LSC). Among them, the IVM method, based on the deflection of the vertical (DOV), can effectively suppress the radial orbit error and has evolved as the primary method. In addition, Sandwell’s method is widely used to calculate high accuracy marine gravity fields, which is based on DOV, Laplace equation, and fast Fourier transform (FFT) (Sandwell and Smith, 1997). Many studies have obtained high precision and high resolution global or regional marine gravity fields based on the above methods. The S&S series from the Scripps Institution of Oceanography, University of California San Diego (SIO), and DTU series from the Technical University of Denmark (DTU) are typical representatives. They update constantly with improvements in accuracy and resolution, having more data available from CryoSat-2, Jason-1, Jason-2, and Altika in their geodetic phases. All this progress has provided a new understanding of the topography and tectonics of the deep oceans.
In this paper, we briefly introduce the evolution of satellite radar altimetry technology and the contributions it has made since the beginning. Then, the methods for constructing the global marine gravity models are summarized into four groups, which are described in detail. Accordingly, typical altimetry-derived marine gravity field models, S&S and DTU series, their area coverage, resolution, and the methods adopted are described. Finally, gravity anomalies V24.1 and V27.1 from S&S and DTU10 and DTU13 from DTU and the global Earth gravity model EGM2008 are compared with the shipborne gravity values to evaluate the accuracy in offshore and coastal regions of China.
Methods For Gravity Field Recovery
At present, methods for marine gravity field recovery mainly include the inverse Stokes formula, IVM formula, LSC, and Laplace equation. The progress and main formulas of these methods will be introduced as follows.
Inverse Stokes Formula
The classic Stokes formula is derived from the basic equations in physical geodesy and the Bruns formula, to determine the geoidal undulation from gravity anomalies. For the solution of the inverse problem, i.e., the determination of the gravity anomaly field from the geoidal undulation, we may use a direct inverse formulation. Molodenskii first proposed a direct means for the determination of the gravity anomaly from the geoidal undulation in 1962 (Molodenskii et al., 1962). After continuous improvement, we obtain the inverse Stokes formula:
where R is the Earth’s mean radius.
Least Squares Collocation
In the 1960s, the LSC method was developed based on theoretical advances by Krarup (1969) and Moritz (1965) (Tscherning, 2015). Smith (1974) and Rapp (1974) proposed that the LSC method can be applied to the process of recovering gravity anomalies from satellite altimeters in the same year. Then, it was improved into the perfect method as follow:
where
Rapp (1983) and Rapp (1986) computed the gravity anomalies on a 0.125° grid in ocean areas from a combined GEOS-3/Seasat altimeter dataset using LSC. The 1° mean anomalies were compared with terrestrial data where an RMS difference of ±7 mGal was found when comparing 10,139 values. Appling the LSC method has major limitations in that one needs to know the covariance function and matrix first. In contrast, it is difficult to determine the covariance function of large sea areas. Therefore, it has only been applied to local marine gravity field computations so far.
Inverse Vening-Meinesz Formula
In the 1980s, DOV, as the initial data, began to be applied to the recovery of the marine gravity field and gradually evolved into the main effective means. For decades, the IVM formula was developed into an optimized method that needs no cross adjustment but can restrain the radial orbital error. At present, it has become the preferred method to retrieve high precision and resolution marine gravity field from altimeter data compared with others.
The inverse Vening-Meinesz formula was presented as follow:
where
In 1998, the IVM formula and FFT were employed to compute gravity anomalies over the South China Sea using deflections from Seasat, Geosat, ERS-1, and T/P satellite altimetry, and the accuracy was 9.9 mGal compared with 180297 shipborne gravity anomalies, approximately 30% better than the contemporary altimeter-derived gravity anomalies from Sandwell and Smith (1997) (Hwang, 1998). Therefore, the IVM method to compute marine gravity field not only ensures the accuracy, but also simplifies the calculation process to save time. It is very suitable for gravity field recovery in large areas and even global areas.
Laplace Equation With FFT
In 1983, Haxby et al. proposed a two-dimensional form of Laplace’s equation in cartesian coordinates. Combined with the Fourier transform operation, we arrive at an algebraic equation relating the Fourier transform of the gravity anomaly to the sum of the Fourier transforms of the two components of vertical deflection. Finally, one performs inverse Fourier transforms to obtain gravity anomaly.
where
In 1997, Sandwell and Smith recovered a 2′ × 2′ gridded global marine gravity field based on Laplace equation and FFT and ERS-1 and Geosat different phase data. A comparison with shipboard gravity measurements shows that the accuracy of the altimetry-derived gravity anomaly is about 4–7 mGal for random ship tracks. These data provide the first view of the ocean floor structures in many remote areas of the Earth. With improvements in the recent years, this method is one of the effective means for marine gravity field recovery in large areas and even global areas.
Global Marine Gravity Field Models
With the development of satellite altimetry, many researchers and institutions have constructed regional or global marine gravity models. Sandwell and Smith (1997) recovered a 2′ × 2′ gridded global marine gravity field with RMS agreements of 7 mGal compared with ship-measured gravity data. The gravity field is based on the ERS-1 and Geosat different phase data, CSR V3.0 tide model correction, the collinear average and low-pass filter to suppress the noise, and the Remove-Restore method with the 70-order JGM-3 model as a reference field. In 1998, Andersen and Knudsen (1998) applied ERS-1/GM and Geosat/GM data with denser spatial coverage, the AG95.1 tide model to correct the sea tide and load tide, and the EGM96 model as a reference field to construct the global marine gravity field with a 3.75′ × 3.75′ resolution by using the Remove-Restore and LSC methods. The RMS of the discrepancy is superior to l0 mGal when compared with the ship-measured gravity data. Furthermore, there are also some excellent related results from other institutions and scholars. Hwang (1998) computed the global marine gravity anomalies over the area 82°S to 82°N and 0°E to 360°E on a 2′ × 2′ grid based on Seasat, Geosat, ERS-1, and T/P altimeter data by IVM. Rapp and Bašić (1992) computed the 0.125° × 0.125° marine gravity field gridded set by LSC based on the Geos-3, Seasat, and Geosat ERM data, along with 5′ × 5′ bathymetry data. Olgiati et al. (1995) computed gravity anomalies from the geoidal undulation and DOV by inverse Stokes formula and IVM, respectively. The latter results with more continuous shortwave features were superior to the former. Hsu et al. (1999) recovered the 30′ × 30′ gridded marine gravity anomalies in the China Sea and adjacent seas using the inverse Stokes formula and LSC, respectively, based on the gridded geoidal height from T/P and ERS-1. Li et al. (2001) and Li et al. (2003) computed the deflection of vertical and gravity anomalies based on the T/P, ERS-2, and Geosat data. The RMS agreement is 9.3 mGal compared with ship-measured gravity.
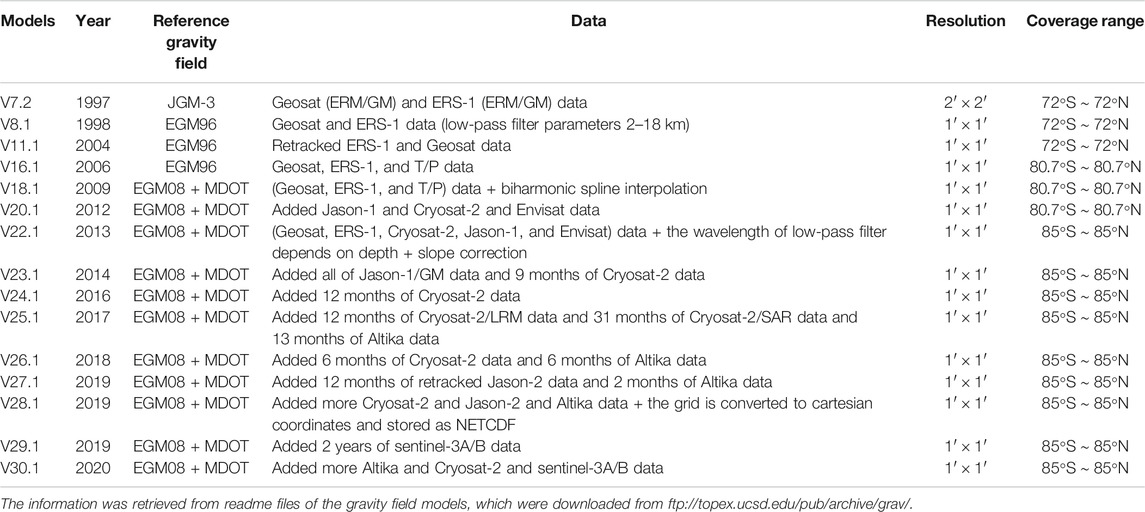
Up to now, research teams represented by Sandwell et al. and Andersen et al. have dominated in global marine gravity field model construction, as they have been continuously exploring higher-quality global marine gravity field models and performing achievements from generation to generation. Sandwell et al. published S&S series global marine gravity field models from the SIO, as shown in Table 1 (the gravity model data can be downloaded from: ftp://topex.ucsd.edu/pub/archive/grav/). Since 1997, Sandwell and Smith constructed the global marine gravity field model V7.2, with the accumulation of new altimetry satellite data, introduction of new reference fields, emergence of waveform retracking, and improvement of data processing. Sandwell’s team has successively published a series of global gravity field models. Among them, models V18.1 and V22.1 both have noteworthy improvements in data processing, which contribute to accuracy improvement. In V18.1, Sandwell and Smith retracked the raw waveforms from the ERS-1 and Geosat/GM missions to improve the range precision, used the EGM2008 global gravity model as a reference field to provide a seamless gravity transition from land to ocean, and used a biharmonic spline interpolation method to construct residual vertical deflection grids. Its accuracy precedes 4 mGal compared with shipboard gravity. In V22.1, they added Cryosat-2, Jason-1, and Envisat data and adopted a low-pass filter whose wavelength depends on depth and slope corrections to account for the offset of the footprint away from NADIR due to a high geoid slope based on former models. To date, the gravity model has evolved into V30.1, with an accuracy of 1–2 mGal in some regions.
Another important global marine gravity field model series is DTU from Andersen et al., which is shown in Table 2 (the data can be downloaded from https://ftp.space.dtu.dk/pub/) (Andersen and Knudsen, 1998; Andersen and Knudsen, 2019; Andersen et al., 2010; Andersen et al., 2014; Andersen et al., 2015; Andersen et al., 2019; Zhang et al., 2020). Similarly, they started to calculate the global marine gravity field using satellite altimetry in the 1990s. The difference is that they started with EGM96 as reference field and the coverage range was wider. Over time, they also introduced the new Earth’s gravitational field EGM2008 as a reference field and added new satellite altimetry data, which improved the accuracy and precision of gravity models. Up to now, Andersen et al. have published DTU17 and DTU18, which added new Altika data. The accuracy also achieved 1–2 mGal in some regions.
Study Area and Data
Previous studies have verified marine gravity models by comparing different models and comparing with shipboard gravity measurements. In particular, the latter can provide a more quantitative assessment of the accuracy of gravity models. It has been confirmed that the accuracy of some current models has achieved 1–2 mGal for latitudes less than 72° and somewhat lower accuracy (2–3 mGal) at higher latitudes depending on ice cover (Sandwell et al., 2013). These validations mostly focus on the deep sea and even offshore basins. The accuracy is indeterminate in many coastal regions as the shipboard gravity is unavailable. In this paper, we collected shipboard gravity in the coastal region of China from the China Offshore Marine Comprehensive Survey and Evaluation Project (908 Project for short) and many survey lines from the NCEI (National Centers for Environmental Information), as shown in Figure 1. The magenta lines are the gravity measurement points from China and the black lines are from the NCEI. The former measurements were acquired by different departments in multiple time periods and distributed in different areas. To maintain data consistency, the same fine data processing is implemented, such as Eotvos correction, correction for drift, and free air correction. Moreover, the systematic error between different survey lines in different survey areas is eliminated by network adjustment and adopting a high precision gravity model as criterion (Ke et al., 2015). The gravity data were employed with a uniform benchmark and data format. As shown in Figure 1, the magenta shipboard gravity data covered almost the entire Chinese coastal zone, containing the Bohai Sea and the margins of the Yellow Sea, East China Sea, and South China Sea. It is an important data source to evaluate the altimeter-derived marine gravity anomalies in these areas. Based on the data distribution, the offshore and coastal regions of China within 0°–45°N, 100°–130°E were chosen as the study area.
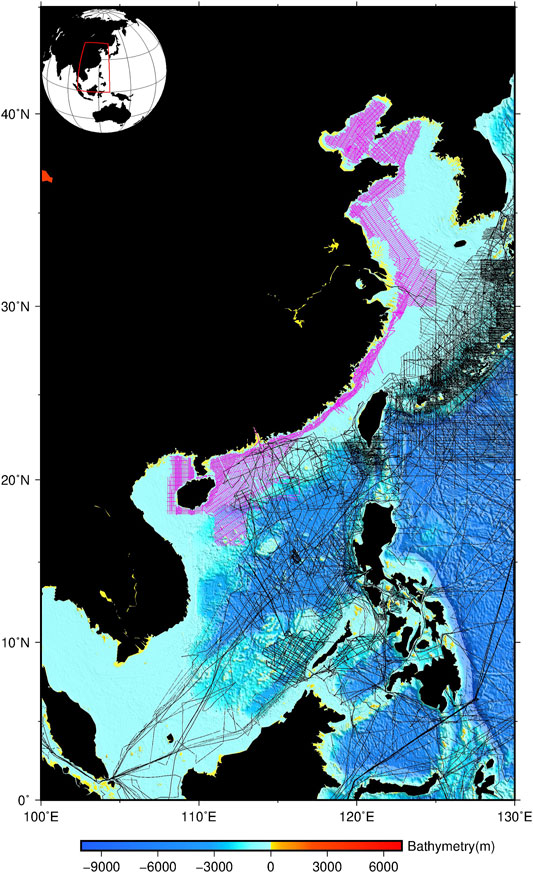
FIGURE 1. Geographic distribution of shipboard gravity measurements in the coastal region of China. The magenta lines are from the 908 Project, and the black lines are from the NCEI. The map was created by using GMT (http://gmt.soest.hawaii.edu). The background bathymetric data is from GEBCO (https://download.gebco.net/); its spatial resolution is resampled to 1′ × 1′.
The NCEI has 181 available survey lines in the study area, black lines in Figure 1. All these survey missions were conducted by different institutions in different years with different instruments. There must be systematic bias that needs to be corrected before validation. In addition, these ship-measured data inevitably contain a certain number of gross error data pieces limited to various measuring conditions. Consequently, these shipboard gravity data need extra procedures to eliminate system bias and outliers according to the preliminary evaluations with respect to EGM2008, which is described in the following text.
Marine gravity models V24.1 and V27.1 from SIO, DTU10 and DTU13 from DTU, and the Earth Gravity Field Model EGM2008 were introduced as protagonists to be verified. As shown in Tables 1 and 2, V24.1 employed Geosat, ERS-1, Cryosat-2, Jason-1, and Envisat data and retracking waveforms, biharmonic spline interpolation, low-pass filtering, and slope correction. V27.1 adopted the same data processing method but added more Cryosat-2, Jason-2, and Altika data. DTU10 employed Geosat, ERS-1/2, T/P, GFO, ICESat, Jason-1, and Envisat data and double waveform retracking to improve the range precision in coastal and polar regions and improved geophysical corrections. DTU13 added Cryosat-2 data on the basis of DTU10. It is widely believed that these marine gravity models have high spatial resolution and precision, even though they adopted different altimetry satellite missions and methods to recover gravity anomalies. However, accuracy assessments of these marine gravity models in the coastal region of China are absent, which is the concerned issue in this paper.
Results and Analysis
Validation in Offshore Regions of China
As discussed earlier, there is a need to remove the systematic bias of the shipboard gravity measurements from the NCEI before validation. The method edits these data through comparison with EGM2008. Simple processing is applied to directly discard the survey lines and points with large errors in the offshore area as the accuracy evaluation of marine gravity field models in the coastal region of China is the focus of this paper. We calculated the discrepancies between EGM2008 and survey data by linear interpolation whose distribution is shown in Figure 2A. Some points with large discrepancies cover the entire survey lines, indicating that survey lines have overall large errors. These lines are 84001311 in 1984, 84003111 in 1984, JARE29L1 in 1987, POL7201 in 1972, RC2612 in 1985, RC2613 in 1985, RC2614 in 1985, and KH79 in 1979, which are discarded in this accuracy evaluation (blue lines in Figure 2B). First, the NCEI provides 181 tracks and 780,870 observations in the study area, which are reduced to 173 tracks and 699,355 observations after discarding the lines with large bias.
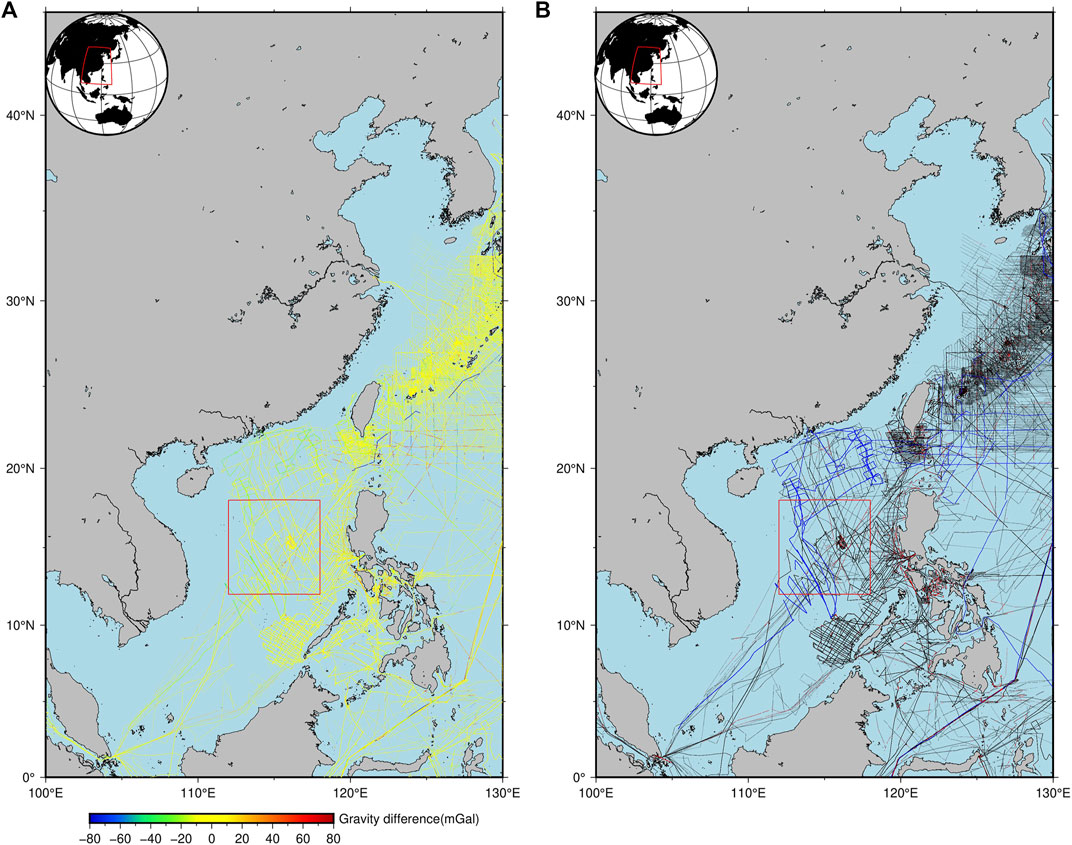
FIGURE 2. Shipboard gravity measurements from the NCEI. (A) Distribution of gravity differences between EGM2008 and shipboard gravity. (B) The survey lines (blue) and points (red) with large discrepancies that are discarded in this study. The remaining black points are the check points for accuracy evaluation. The red rectangle is the South China Sea Basin, which is selected as a representative offshore basin to evaluate the accuracy of the gravity field models.
In addition, the shipboard gravity data with a discrepancy threshold of 20 mGal are regarded as outliers to be eliminated (the red points in Figure 2B), which leads to a total proportion of 4.39% for deleted data, and 668,662 observations remain. These deleted observations are mainly distributed around the islands and at the corners of the survey lines, which may be due to the poor precision of EGM2008 near islands or the large error introduced in the shipboard gravity measurement when the ship turns a corner.
Altimetry-derived marine gravity anomalies were compared with the shipboard gravity measurements after eliminating systematic bias and outliers. The statistical results of differences between marine gravity models and shipboard gravity values are listed in Table 3, which demonstrate that all marine gravity models have similar precision in the offshore area of China. Models from SIO and DTU have slightly higher accuracy than EGM2008, indicating that satellite altimetry can improve the gravity signal accuracy on a short wavelength scale on the basis of global gravity models. In addition, by observing series models from SIO and DTU, the RMS deviation improves from 7.27 mGal for V24.1 to 7.21 mGal for V27.1 and from 7.47 mGal for DTU10 to 7.34 mGal for DTU13, indicating that the new model improved slightly in accuracy, possibly due to supplementation of the latest Cryosat-2, Jason-2, and Altika data.
Considering the effects of water depths and complicated submarine topography, we selected a typical offshore basin, the South China Sea Basin, whose depth is greater than 3,000 m (red rectangle in Figure 2) for further analysis. The pointwise RMS differences between the marine gravity models and shipboard gravity data were computed. As shown in Table 4, the RMS misfit is improved to 5.48 mGal for V24.1, 5.40 mGal for V27.1, 6.03 mGal for DTU10, and 5.69 mGal for DTU13, with respect to these in the entire region. The results indicate that altimetry-derived marine gravity fields have higher accuracy in the open sea than other regions. Meanwhile, the same conclusion can be obtained in the deep sea that the marine gravity models have higher accuracy than EGM2008 and new gravity models improve the accuracy due to data supplementation of new satellite missions.
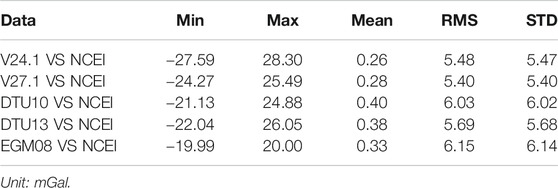
TABLE 4. Validation results of marine gravity models with NCEI shipboard gravity data in South China Sea Basin.
Validation in Coastal Regions of China
Similarly, the altimetry-derived marine gravity models were compared with shipboard gravity measurements from the China 908 Project in coastal regions of China. The statistical results are shown in Table 5. From that it is evident that the marine gravity models have relatively low accuracy in coastal regions of China, as the RMS difference between EGM2008 and shipboard gravity achieves 10.71 mGal. The authoritative models V24.1, V27.1, DTU10, and DTU13 have RMS differences of 9.80, 9.59, 10.57, and 10.57 mGal, respectively. This is consistent with the general understanding that satellite altimetry has poor-quality data near the coast due to the contaminated altimeter waveforms, bad tidal correction, and large sea surface variability (Wang et al., 2010).

TABLE 5. Comparison between marine gravity models and shipboard data in the coastal region of China, unit: mGal.
For further analysis, six areas, A–F, are selected along the coast of China to compare marine gravity models with shipboard gravity profiles. Area A is in the Bohai Sea, China’s continental sea, with a mean depth of 18 m (red rectangle in Figure 3). Area B is located in the northern part of the Yellow Sea, east of the Bohai Strait (blue rectangle in Figure 3), and area C is located in the midwestern part of the Yellow Sea (green rectangle in Figure 3), while the Yellow Sea is a semienclosed sea. Both the areas D (yellow rectangle in Figure 3) and E (cyan rectangle in Figure 3) are in the East China Sea; area D is near the Yangtze Estuary with a complex marine dynamic environment possibly due to river-sea interaction, and area E is near Taiwan Island. Finally, area F is located in the South China Sea, close to Hainan Island, with relatively deep water (white rectangle in Figure 3). The comparisons between marine gravity models and shipboard data over the above different areas are provided in Table 6 and Figure 4. In Figure 4, the black bar is the RMS deviation between EGM2008 and shipboard gravity data in different coastal regions of China. The blue, dark green, yellow, and red bars are the RMS deviations for DTU10, DTU13, V24.1, and V27.1, respectively. From Table 4 and Figure 4, EGM2008 has a larger RMS deviation than the other gravity models in almost all areas. In addition, the gravity model V27.1 has the highest accuracy among these gravity models. The reason is probably because gravity V27.1 added abundant Cryosat-2, Jason-2, and Altika data, especially the new satellite mission Altika, which functioned in Ka band, and with higher range precision, which greatly contributes to coastal ocean research.
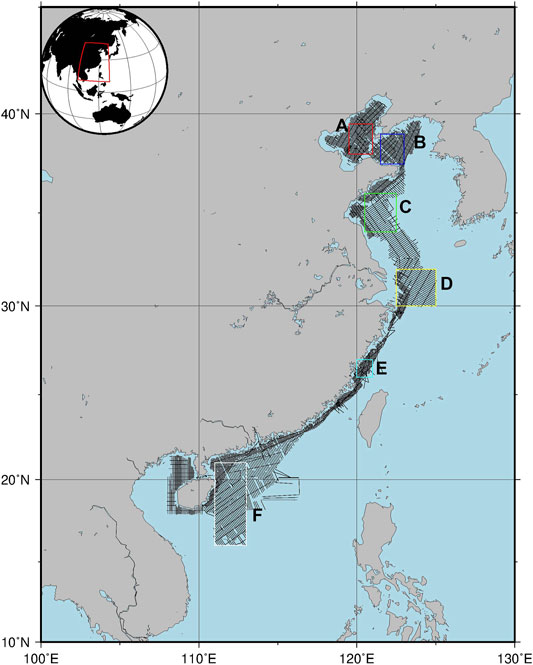
FIGURE 3. Geographic distribution of shipboard gravity measurements from the 908 Project in the coastal regions of China. Areas A–F in different colors are selected to demonstrate the accuracies of marine gravity models in different regions.
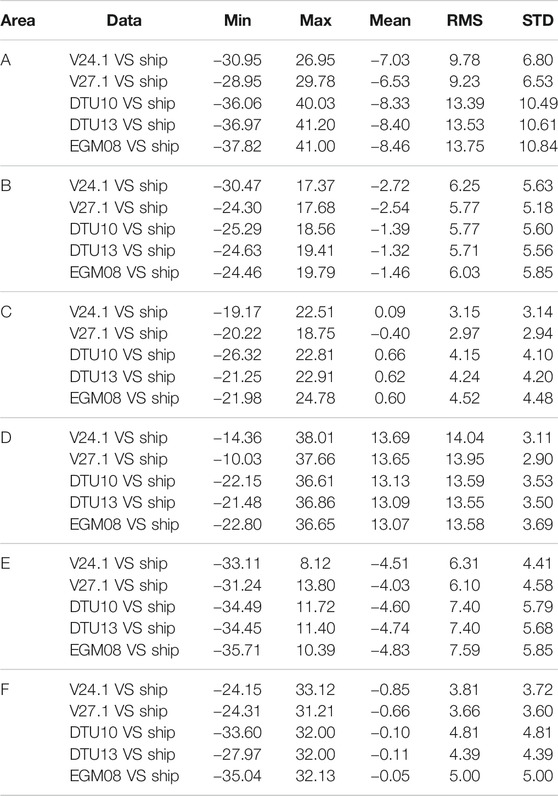
TABLE 6. Comparison between marine gravity models and shipboard data over different areas in the coastal region of China, unit: mGal.
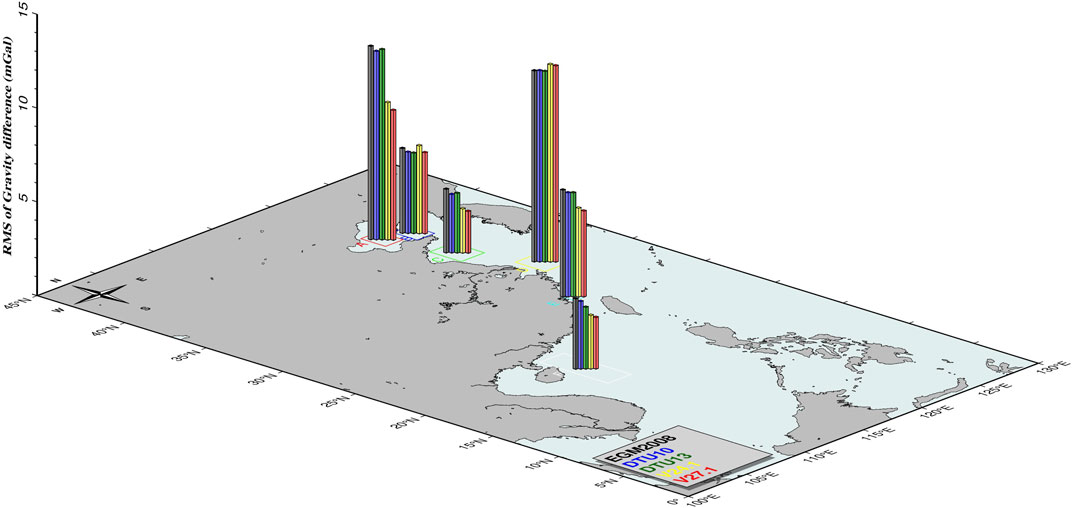
FIGURE 4. 3D bar graph of RMSs between marine gravity models and shipboard gravity in coastal region of China. The black bar is RMS deviation between EGM2008 and shipboard gravity, and the blue, dark green, yellow, and red bar are the RMS deviation for DTU10, DTU13, V24.1, and V27.1, respectively. From north to south, the red, blue, green, yellow, cyan, and white rectangle represent the areas A–F, respectively.
In area A, all marine gravity models obtained dissatisfactory accuracy. The better model, V27.1, has an RMS misfit of only 9.23 mGal, while DTU13 has an RMS misfit of 13.53 mGal. This is because area A is in the Bohai Sea, an almost enclosed continental sea surrounded by land, affecting the measurement quality of satellite altimetry to a large extent. This shows that there are significant challenges to improving coastal ocean gravity field recovery by using satellite altimetry. In area B, the marine gravity models have significant improvement in accuracy, and the largest RMS misfit is 6.25 mGal for V24.1. Furthermore, the RMS deviation of V27.1 with new satellite mission Altika data improved to 5.77 mGal with respect to V24.1, which is in line with models DTU10 and DTU13. In area C, the accuracies of gravity models are further improved as the influence of land is reduced. The RMS deviation of V24.1 is only 3.15 mGal and improves to 2.97 mGal for V27.1. Gravity models DTU10, DTU13, and EGM2008 have RMS misfits of 4.15, 4.24, and 4.52 mGal, respectively.
However, in area D, the RMS misfit of gravity models is abnormally large, such as reaching 14.04 mGal for V24.1. Complex ocean dynamics may principally be responsible for this case. Area D is located near the Yangtze Estuary, with strong currents flowing through, containing the East China Sea coastal current formed by discharge from the Yangtze River and Qiantang River and the Taiwan Warm Current, a branch of the Japan Current. Altimetry-derived marine gravity models adopt different global tidal models for tide correction, which can restrain the influence of currents to a certain extent. However, tidal models have different accuracy levels in coastal areas of China and tide model errors can be potentially very large in the near-coastal zone (Stammer et al., 2014), leading to marine gravity models exhibiting errors caused by currents. Moreover, the shipboard gravity measurements from the China 908 Project do not consider ocean diversity in postdata processing. The above reasons may have resulted in a low precision over area D.
In area E, all gravity models have a relatively low precision with respect to area B. Through the analysis and comparison of the topography of the two areas, we concluded that, in addition to the influence of Taiwan Island and the mainland, the coastal currents still play an important role in precision reduction. After all, the currents in area B are very weak. In area F, the RMS deviation is 3.81 mGal for V24.1, 3.66 mGal for V27.1, 4.81 mGal for DTU10, 4.39 mGal for DTU13, and 5.00 mGal for EGM2008, respectively.
Overall, along the coastal regions of China, the accuracies of gravity models varied greatly with region, and area C had the highest precision up to 2.97 mGal; in contrast, area D had the lowest precision of approximately 13.5 mGal. This was probably caused by a combination of surrounding topography and ocean currents, and ocean currents are a major priority. Moreover, the shipboard gravity measurements do not take the influence of currents into account, which may result in the lack of a reliable validation method in regions with strong currents. Therefore, as an external check, shipboard gravity data needs more operations to improve precision, such as higher instrument accuracy and finer data processing. Even so, these results still indicate that altimetry-derived marine gravity field models with new satellite data and advanced data processing have achieved a high accuracy level in coastal region of China.
Conclusion
In this paper, the methods of marine gravity determination and altimetry-derived marine gravity field recovery and the progress of satellite radar altimetry and global marine gravity field models were introduced. Typical models V24.1 and V27.1 from SIO, DTU10 and DTU13 from DTU, and EGM2008 were compared with shipboard gravity data to evaluate accuracies in offshore and coastal regions of China. The results show that the accuracies of gravity models in coastal regions are lower than those in offshore regions, and the new gravity models with new satellite missions Jason-2, Altika, and Envisat data have relatively higher accuracy, especially Altika data that brings significant improvement to coastal gravity field models. In addition, six areas are selected for further comparison and analysis, and the results show that altimetry-derived marine gravity field models with new satellite data and advanced data processing have achieved a high accuracy level. However, the accuracies are relatively low in areas with strong currents. We deduce that the reason may be related to altimetry-derived marine gravity recovery as well as shipboard gravity measurements in coastal regions. Tide correction is carried out during marine gravity model construction by using global tide models. The global tide models cannot be expected to be competitive with well-constructed local models based on high quality local bathymetric data and local tidal knowledge, whose errors can be potentially very large in the near-coastal zone (Stammer et al., 2014). On the other hand, the shipboard gravity measurements usually do not take the influence of ocean currents into account. Therefore, as an external check, shipboard gravity data need more operations to improve their precision, such as higher instrument accuracy and finer data processing.
Data Availability Statement
The original contributions presented in the study are included in the article/Supplementary Material; further inquiries can be directed to the corresponding author.
Author Contributions
LB and YW conceived the study. The data processing and the image rendering were conducted by QL. The analysis of the results was implemented by QL, LB, and YW. And the initial draft of the manuscript was written by QL with improvements and substantial edits from all authors.
Funding
This work is supported by the National Natural Science Foundation of China (Grant Nos. 41774022 and 41931076) and the Basic Frontier Science Research Program of Chinese Academy of Sciences (Grant No. ZDBS-LY-DQC028).
Conflict of Interest
The authors declare that the research was conducted in the absence of any commercial or financial relationships that could be construed as a potential conflict of interest.
Publisher’s Note
All claims expressed in this article are solely those of the authors and do not necessarily represent those of their affiliated organizations, or those of the publisher, the editors and the reviewers. Any product that may be evaluated in this article, or claim that may be made by its manufacturer, is not guaranteed or endorsed by the publisher.
Acknowledgments
The authors acknowledge David Sandwell, University of California at San Diego, and Ole Baltazar Andersen, Technical University of Denmark, for providing the radar altimeter-derived gravity models used in this study. The National Geomatics Center of China and National Centers for Environmental Information provided the shipboard gravity data in China’s offshore and coastal regions.
References
Abdalla, S., Abdeh, K. A., Adusumilli, S., Bhowmick, S., Alou, E., Amarouche, L., et al. (2021). Altimetry for the future: Building on 25 years of progress. Adv. Space Res. 68 (2), 319–363. doi:10.1016/j.asr.2021.01.022
Andersen, O. B., Knudsen, P., and Berry, P. A. M. (2010). The DNSC08GRA Global marine Gravity Field from Double Retracked Satellite Altimetry. J. Geod 84 (3), 191–199. doi:10.1007/s00190-009-0355-9
Andersen, O. B., and Knudsen, P. (1998). Global marine Gravity Field from the ERS-1 and Geosat Geodetic mission Altimetry. J. Geophys. Res. 103 (C4), 8129–8137. doi:10.1029/97JC02198
Andersen, O. B., Knudsen, P., Kenyon, S., Holmes, S., and Factor, J. K. (2019). “Evaluation of the Global Altimetric Marine Gravity Field DTU15: Using Marine Gravity and GOCE Satellite Gravity”, in International Symposium on Advancing Geodesy in a Changing World. International Association of Geodesy Symposia. Editors O. B. Andersen, and P. Knudsen (Cham: Springer), Vol. 149, 77–81. doi:10.1007/1345_2018_52
Andersen, O. B., Knudsen, P., Kenyon, S., and Holmes, S. (2014). “Global and Arctic Marine Gravity Field from Recent Satellite Altimetry (DTU13)”, in 76th European Association of Geoscientists and Engineers Conference and Exhibition 2014: Experience the Energy - Incorporating SPE EUROPEC 2014, 3049–3053. EAGE Publishing BV. doi:10.3997/2214-4609.20140897
Andersen, O. B., and Knudsen, P. (2019). “The DTU17 Global Marine Gravity Field: First Validation Results”. in Fiducial Reference Measurements for Altimetry. International Association of Geodesy Symposia. Editors S. Mertikas, and R. Pail, Vol. 150, 83–87. doi:10.1007/1345_2019_65
Andersen, O. B., Stenseng, L., Jain, M., and Knudsen, P. (2015). Towards the New Global Altimetric Gravity Field from Five Years of Cryosat-2 Geodetic mission Altimetry (DTU14). in EGU General Assembly 2015, Vienna, Austria, April 12–17, 2015.
Balmino, G., Moynot, B., Sarrailh, M., and Valès, N. (1987). Free Air Gravity Anomalies over the Oceans from Seasat and GEOS 3 Altimeter Data. Eos Trans. AGU 68, 17. doi:10.1029/EO068i002p00017
Bao, L., Xu, H., and Li, Z. (2013). Towards a 1 mGal Accuracy and 1 Min Resolution Altimetry Gravity Field. J. Geod 87 (10-12), 961–969. doi:10.1007/s00190-013-0660-1
Fairhead, J. D., Green, C. M., and Odegard, M. E. (2001). Satellite-derived Gravity Having an Impact on marine Exploration. The Leading Edge 20 (8), 873–876. doi:10.1190/1.1487298
Forsberg, R., and Olesen, A. V. (2010). Airborne Gravity Field Determination. Sciences of Geodesy - I: Advances and Future Directions. Berlin Heidelberg: Springer, 83–104. doi:10.1007/978-3-642-11741-1_3
Fu, L.-L., Cheng, B., and Qiu, B. (2001). 25-Day Period Large-Scale Oscillations in the Argentine Basin Revealed by the TOPEX/Poseidon Altimeter. J. Phys. Oceanogr. 31 (2), 506–517. doi:10.1175/1520-0485(2001)031<0506:DPLSOI>2.0
Haxby, W. F., Karner, G. D., Labrecque, J. L., and Weissel, J. K. (1983). Digital Images of Combined Oceanic and continental Data Sets and Their Use in Tectonic Studies. Eos Trans. AGU 64 (52), 995. doi:10.1029/EO064i052p00995
Hsu, H. T., Wang, H. Y., Lu, Y., and Wang, G. Y. (1999). GEOID UNDULATIONS AND GRAVITY ANOMALIES FROM T/P AND ERS-1 ALTIMETER DATA IN THE CHINA SEA AND VICINITY. Chin. J. Geophys. 42 (4), 465–471. (in Chinese with English abstract). doi:10.3321/j.issn:0001-5733.1999.04.005
Hwang, C., and Chang, E. T. Y. (2014). Seafloor Secrets Revealed. Science 346 (6205), 32–33. doi:10.1126/science.1260459
Hwang, C. (1998). Inverse Vening Meinesz Formula and Deflection-Geoid Formula: Applications to the Predictions of Gravity and Geoid over the South China Sea. J. Geodesy 72 (5), 304–312. doi:10.1007/s001900050169
Ke, B., Zhang, C., Guo, C., Wang, B., and Yang, L. (2015). System Error Correction for Shipborne Gravimetric Data from Different Regions of Offshore in China. Geomatics Inf. Sci. Wuhan Univ. 40 (003), 417–421. (in Chinese with English abstract). doi:10.13203/j.whugis20130299
Krarup, T. (1969). A Contribution to the Mathematical Foundation of Physical Geodesy. København: Geodætisk Institut. Meddelelse no. 44.
Li, J., Ning, J., Chen, J., and Chao., D. (2001). Determination of Gravity Anomalies over the South China Sea by Combination of TOPEX/Poseidon, ERS2 and Geosat Altimeter Data. Acta Geodaetica et Cartographica Sinica 30 (3), 197–202. (in Chinese with English abstract). doi:10.3321/j.issn:1001-1595.2001.03.003
Li, J., Ning, J., Chen, J., and Chao., D. (2003). Geoid Determination in China Sea Areas. Acta Geodaetica et Cartographica Sinica 32 (002), 114–119. (in Chinese with English abstract). doi:10.3321/j.issn:1001-1595.2003.02.004
Li, Q., Bao, L., and Shum, C. K. (2020). Altimeter-derived marine Gravity Variation Studies the Submarine Plate Tectonic Motions. Chin. J. Geophys. 63 (7), 2506–2515. (in Chinese with English abstract). doi:10.6038/cjg2020N0436
Li, Q., Bao, L., and Shum, C. K. (2021). Altimeter-derived marine Gravity Variations Reveal the Magma Mass Motions within the Subaqueous Nishinoshima Volcano, Izu-Bonin Arc, Japan. J. Geod 95 (5), 1–14. doi:10.1007/s00190-021-01488-7
Molodenskii, M. S., Eremeev, V. F., and Yurkina, M. I. (1962). Methods for Study of the External Gravitational Field and Figure of the Earth. Jurusalem: Translated from the Russian by the Israel Progr. for Sc. Transl.
Olgiati, A., Balmino, G., Sarrailh, M., and Green, C. M. (1995). Gravity Anomalies from Satellite Altimetry: Comparison between Computation via Geoid Heights and via Deflections of the Vertical. Bull. Géodésique 69 (4), 252–260. doi:10.1007/BF00806737
Rapp, R. (1974). Gravity Anomaly Recovery from Satellite Altimetry Data Using Least Squares Collocation Techniques. Dept. of Geodetic Science Report No.220. Columbus, OH: The Ohio State University.
Rapp, R. H., and Bašić, T. (1992). Oceanwide Gravity Anomalies from GEOS-3, Seasat and Geosat Altimeter Data. Geophys. Res. Lett. 19, 1979–1982. doi:10.1029/92GL02247
Rapp, R. H. (1979). Geos 3 Data Processing for the Recovery of Geoid Undulations and Gravity Anomalies. J. Geophys. Res. 84, 3784. doi:10.1029/JB084iB08p03784
Rapp, R. H., and Richard, H. (1986). Gravity Anomalies and Sea Surface Heights Derived from a Combined GEOS 3/Seasat Altimeter Data Set. J. Geophys. Res. 91 (B5), 4867–4876. doi:10.1029/JB091iB05p04867
Rapp, R. H. (1983). The Determination of Geoid Undulations and Gravity Anomalies from SEASAT Altimeter Data. J. Geophys. Res. 88, 1552–1562. doi:10.1029/JC088iC03p01552
Sandwell, D., Garcia, E., Soofi, K., Wessel, P., Chandler, M., and Smith, W. H. F. (2013). Toward 1-mGal Accuracy in Global marine Gravity from CryoSat-2, Envisat, and Jason-1. The Leading Edge 32, 892–899. doi:10.1190/tle32080892.1
Sandwell, D. T., Harper, H., Tozer, B., and Smith, W. H. F. (2021). Gravity Field Recovery from Geodetic Altimeter Missions. Adv. Space Res. 68, 1059–1072. doi:10.1016/j.asr.2019.09.011
Sandwell, D. T., Müller, R. D., Smith, W. H. F., Garcia, E., and Francis, R. (2014). New Global marine Gravity Model from CryoSat-2 and Jason-1 Reveals Buried Tectonic Structure. Science 346 (6205), 65–67. doi:10.1126/science.1258213
Sandwell, D. T., and Smith, W. H. F. (2009). Global marine Gravity from Retracked Geosat and ERS-1 Altimetry: Ridge Segmentation versus Spreading Rate. J. Geophys. Res. 114, B01411. doi:10.1029/2008JB006008
Sandwell, D. T., and Smith, W. H. F. (1997). Marine Gravity Anomaly from Geosat and ERS 1 Satellite Altimetry. J. Geophys. Res. 102 (B5), 10039–10054. doi:10.1029/96JB03223
Smith, G. N. (1974). Mean Gravity Anomaly Prediction from Terrestrial Gravity Data and Satellite Altimeter Data. Dept. of Geodetic Science Report No.214. Columbus, OH: The Ohio State University.
Stammer, D., Ray, R. D., Andersen, O. B., Arbic, B. K., Bosch, W., Carrère, L., et al. (2014). Accuracy Assessment of Global Barotropic Ocean Tide Models. Rev. Geophys. 52 (3), 243–282. doi:10.1002/2014RG000450
Tapley, B. D., Bettadpur, S., Ries, J. C., Thompson, P. F., and Watkins, M. M. (2004). GRACE Measurements of Mass Variability in the Earth System. Science 305 (5683), 503–505. doi:10.1126/science.1099192
Tscherning, C. C. (2015). “Developments in the Implementation and Use of Least-Squares Collocation,” in IAG 150 Years. International Association of Geodesy Symposia. Editors C. Rizos, and P. Willis (Cham: Springer), Vol. 143, 199–204. doi:10.1007/1345_2015_54
Wang, H., Yang, Y., Hwang, C., Chu, Y., and Ma, X. (2010). Improving Gravity Anomalies over China Marginal Sea from Retracked Geosat and ERS-1 Data. Geo-Spatial Inf. Sci. 13 (2), 144–149. doi:10.1007/s11806-010-0023-5
Zhang, S., and Sandwell, D. T. (2016). Retracking of SARAL/AltiKa Radar Altimetry Waveforms for Optimal Gravity Field Recovery. Mar. Geodesy 40 (1), 40–56. doi:10.1080/01490419.2016.1265032
Keywords: Satellite altimetry, Shipboard gravity, Marine gravity anomaly, Coastal regions of China, Accuracy evaluation
Citation: Li Q, Bao L and Wang Y (2021) Accuracy Evaluation of Altimeter-Derived Gravity Field Models in Offshore and Coastal Regions of China. Front. Earth Sci. 9:722019. doi: 10.3389/feart.2021.722019
Received: 08 June 2021; Accepted: 15 July 2021;
Published: 23 August 2021.
Edited by:
Jinyun Guo, Shandong University of Science and Technology, ChinaReviewed by:
Xu Ke, National Space Science Center (CAS), ChinaWan Xiaoyun, China University of Geosciences, China
Copyright © 2021 Li, Bao and Wang. This is an open-access article distributed under the terms of the Creative Commons Attribution License (CC BY). The use, distribution or reproduction in other forums is permitted, provided the original author(s) and the copyright owner(s) are credited and that the original publication in this journal is cited, in accordance with accepted academic practice. No use, distribution or reproduction is permitted which does not comply with these terms.
*Correspondence: Lifeng Bao, YmFvbGlmZW5nQHdoaWdnLmFjLmNu
 Qianqian Li
 Lifeng Bao
 Yong Wang1,2