- 1Xinjiang Pamir Intracontinental Subduction National Field Observation and Research Station, Beijing, China
- 2Urumqi Institute of Central Asia Earthquake, China Earthquake Administration, Urumqi, China
- 3State Key Laboratory of Earthquake Dynamics, Institute of Geology, China Earthquake Administration, Beijing, China
- 4School of Architecture and Civil Engineering, Xi’an University of Science and Technology, Xi’an, China
The 2020 Jiashi Mw 6.0 earthquake occurred at the Kepingtage fold-and-thrust belt in the South Tianshan front, Northwestern China. The ground shaking caused extensive co-seismic deformation of the Xiker dam in the meizoseismal area. We obtained strata distribution characteristics of the dam foundation through drilling. Using laboratory and in situ tests, the particle size distribution, standard penetration, and shear wave velocity of each layer were obtained. Along with peak ground acceleration, we evaluated the potential of sand liquefaction in various layers and proposed a relationship between dam fissures and sand liquefaction. Our results suggest that sand liquefaction occurred in the silty sand layer 0–3 m beneath the dam foundation. Sand liquefaction occurs behind the dam, resulting in uneven settlement of the dam foundation, making the horizontal deformation of the backslope of the dam significantly larger than the foreslope of the dam. Using numerical simulations, we found that sand liquefaction behind the dam can cause different horizontal deformation vectors (maximum deformation is ∼7.45 cm) in the dam foreslope and backslope, which cause the dam to rotate in the downstream direction. Large fissures also formed on the dam crest.
Highlights
• Dam fissures and sand liquefaction are examined following the Jiashi earthquake
• Only deep taupe silty sand layers are capable of liquefaction at the Xiker dam
• Frequent earthquakes and aftershocks may have caused undetectable damage to the dam
Introduction
Earth dams are used worldwide owing to the convenience of acquiring the required materials and the adaptability of such dams to the local terrain. Earth dams exhibit relatively strong seismic performance. However, many have been damaged during strong earthquakes and even broken in some serious cases (Seed et al., 1975; Chen et al., 2014). Therefore, it is necessary to conduct detailed investigations and testing of earth dams following earthquakes. This specific area of research has attracted considerable attention (Bardet and Davis, 1996; Tani, 2000; Ozkan et al., 2006; Jin et al., 2009; Yoshikazu et al., 2012; Chen et al., 2014). Ambraseys (1960) reviewed 58 dams damaged in 24 earthquakes and suggested that inertial forces and pore-pressure had the greatest effect on the structure. Chen (2014) analyzed a total of 670 earth dams damaged by the Wenchuan earthquake and found that fissures in the dams were one of the most important causes of damage. However, several studies (e.g., Ambrasey and Sarma, 1969; Youd and Hoose, 1977; Ishihara, 1993; Youd and Idriss, 2001; Wang, 2007; Holzer et al., 2010) have shown that medium–strong earthquakes (Mw 5.5–6.5) will not cause fissures in earth dams, but do cause sand liquefaction over large areas, especially in reservoir areas with high groundwater levels. Therefore, the relationship between dam fissures, sand liquefaction, and the mechanism of dam fissure formation must be determined.
Co-seismic soil liquefaction has been observed during numerous earthquakes, including the 1964 Mw 7.5 Niigata earthquake (Iwasaki, 1986), the 1964 M 9.2 Alaska earthquake (Seed, 1968), the 1966 M 6.8 Xingtai earthquake (Nagase and Ishihara, 1988), the 1999 Mw 7.5 Chi-Chi earthquakes (Lin et al., 1999; Wang et al., 2003), and the 2008 Mw 7.9 Wenchuan earthquake (Chen et al., 2009; Huang and Jiang, 2010; Cao et al., 2011; Hou et al., 2011; Liu et al., 2016). Sand liquefaction hazards must be adequately assessed in order to minimize the associated impacts (Boulanger and Idriss, 2014; Bastin et al., 2020). Post-earthquake field investigations provide fundamental data that enhance the understanding of processes that cause earthquake liquefaction. Prior studies have documented various aspects of liquefaction, including site conditions, temperature, grain size of the liquefied material, and the peak ground acceleration (PGA) of liquefaction sites (e.g., Housner and Hudson, 1958; Ambrasey and Sarma, 1969; Iwasaki, 1986; Ishihara, 1993; Obermeier, 2000; Holzer et al., 2010; Chen et al., 2014; Yao et al., 2019; Bastin et al., 2020).
On January 19, 2020, an Mw 6.0 earthquake (Figure 1, United States Geological Survey (USGS), 2020) struck Jiashi County in Xinjiang Province, Northwest China. The mainshock was widely recorded by local and global seismic networks and the epicenter was located at 39.83°N, 77.21°E [Figure 1, China Earthquake Networks Center (CENC), 2020]. The focal mechanisms obtained by the USGS and CENC both suggest that the earthquake primarily involved thrust faulting.
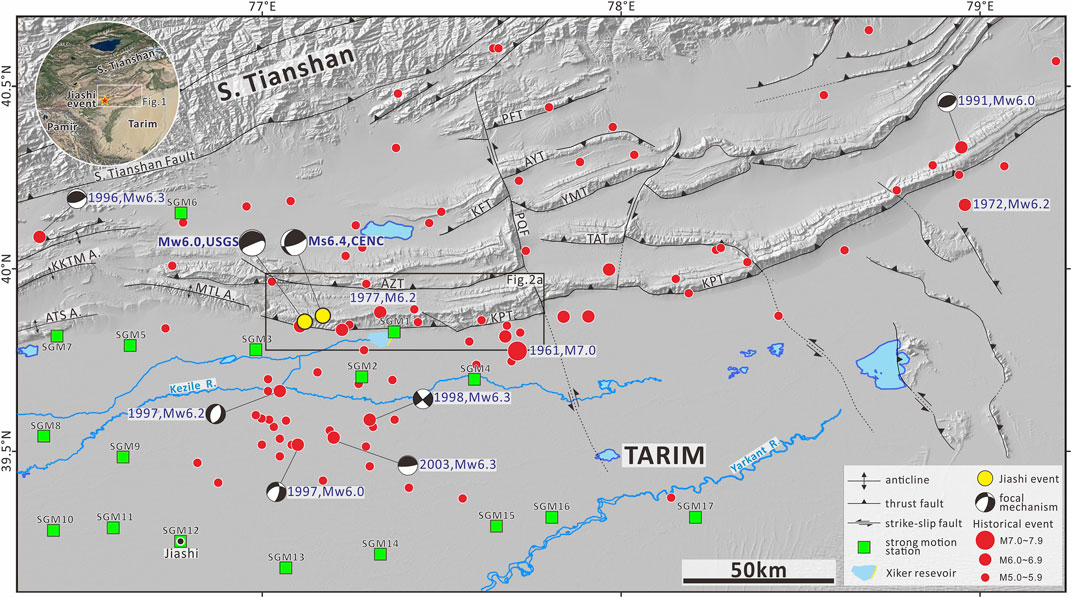
FIGURE 1. Digital Elevation Model (DEM), structures and historical earthquakes in the Kepingtage fold-and-thrust belt. The black line indicates the location of the study area (Figure 2A). Earthquake locations and focal mechanisms are from the China Earthquake Networks Center seismic catalog for 1900–2020. The green boxes denote strong-motion stations, and these data are from the Xinjiang Strong Vibration Observation Network (Figure 6; Table 2). KPT, Keping Thrust Fault; AZT, Aozigertawu Thrust Fault; TAT, Tataiertage Thrust Fault; KFT, Kekebuke Front Thrust Fault; YMT, Yimugantawu Thrust Fault; AYT, Aoyibulake Thrust Fault; PFT, Piqiangshan Front Thrust Fault; PQF, Piqiang Fault; KKTM A, Keketamu Anticline; MTL A, Mutule Anticline; ATS A, Atushi Anticline.
In this study, we obtained earthquake damage data and conducted a field investigation of the Xiker earth dam (hereafter referred to as the Xiker dam) after the Jiashi earthquake. Typical damage phenomena included dam fissures and sand liquefaction. Using the data collected from the field investigation following the earthquake, we herein determine and discuss the main reason for the seismic damage of the Xiker dam. Finally, we evaluate the potential for sand liquefaction in the foundation soil of the Xiker dam, analyze the relationship between the fissures observed on the dam crest and sand liquefaction, and discuss the superposition effect of multiple earthquakes on the Xiker dam.
Tectonic Background
The Tianshan range is located far from plate boundaries (1,000–2000 km) and is one of the youngest intracontinental orogenic belts in the world, as well as the most intensely seismically active region of central Asia (Tapponnier and Molnar, 1979; Avouac et al., 1993; Hendrix et al., 1994; Lu et al., 1994; Zhang et al., 1996; Burchfiel et al., 1999; Heermance et al., 2008). Recent Global Positioning System (GPS) measurements across the western section of the Tianshan region indicate that the current rate of crustal shortening is ∼19–20 mm/yr (Abdrakhmatov, 1996; Wang et al., 2000; Wang and Shen, 2020), which is almost half of the current northward convergence rate of the Indian plate. Geological and seismological research indicate that the Tianshan range has undergone compressional structural deformation since the Late Cenozoic. A large amount of shortening was absorbed by the N–S trending thrust faults and folds belt in the Tianshan front (Allen et al., 1999). The Kepingtage fold-and-thrust belt (FTB) has undergone the strongest neo-tectonic movement and deformation in the South Tianshan region. From 1997 to 1998, 9 Ms ≥ 6.0 earthquakes and several Ms ≥ 5.0 earthquakes occurred in this region (Gao et al., 1997; Lai et al., 2002; Zhao, 2006). In 2003, an Mw 6.3 earthquake occurred in the northeastern region of Jiashi County (Figure 1). Such a large number of strong earthquakes located in a small area over a short period of time are unprecedented in mainland China. These earthquakes also constitute a series of rare intraplate earthquakes. The Kepingtage FTB is ∼300 km long from east to west and 60–140 km wide from north to south. It is composed of a series of monoclinal or anticlinal mountains (fold-and-thrust) with near E–W strike directions and a parallel distribution (Figure 1; Allen et al., 1999).
The Keping thrust fault (KPT) is the foremost (southern) thrust fault of the Kepingtage FTB and is composed of an overturned fold-and-front thrust fault, with a total length of 220 km (Figure 1; Yin et al., 1998; Allen et al., 1999; Li et al., 2013; Li et al., 2020a). The fault formed primarily during the forward expansion of the fold and constitutes the boundary between the mountain and alluvial–diluvial platform or fault scarp (Figure 2A; Deng et al., 2000; Xu et al., 2019). Combined with the focal mechanism, seismic reflection profiles, and Interferometric Synthetic Aperture Radar coseismic deformation, the seismogenic structure of the 2020 Jiashi Mw 6.0 earthquake was the KPT at the leading edge of Kepingtage FTB (Yao et al., 2020).
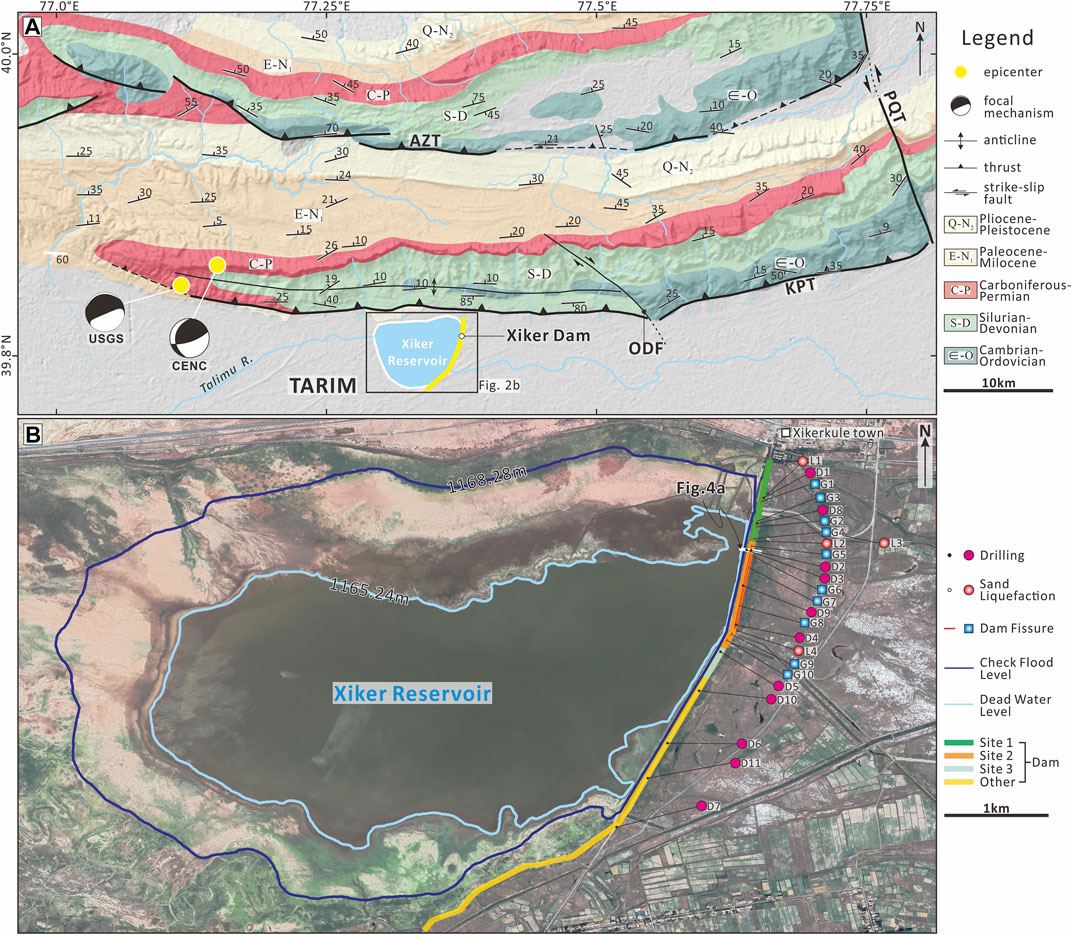
FIGURE 2. (A) Structural map of the KPT and AZT. The base figure is the 30-m DEM. The two epicenters and their focal mechanisms are from the USGS and the CENC. ODF: Ordaklik fault. (B) Satellite image of the Xiker reservoir and earth dam. The thick translucent areas of green, orange, blue, and yellow are the Xiker dam. A cross section of the dam is shown in Figure 4A, and the drilling data are shown in Figures 4B,C.
Materials and Methods
Xiker Dam
The Xiker dam is an earth dam located on the lower reaches of the Kizil River in the Kashgar Basin, Xinjiang (Figures 1, 3A). The reservoir area is an ancient channel depression, with the KPT piedmont alluvial fan on the northern side and the alluvial–diluvial plain on the southern side. The dam was built in 1958 and began operations in 1959. The checked flood level of the reservoir is 1,168.280 m, with a total water storage capacity of 10.41 million m³. The dead water level is 1,165.24 m, with a dead storage capacity of 14.5 million m³. The surrounding area includes a large plain reservoir containing both irrigation and ecological water. The dam is a homogeneous earth dam, with a length of 4,546 m, a crest width of 8.5 m, and a maximum crest height of 7 m (Wang, 2015).
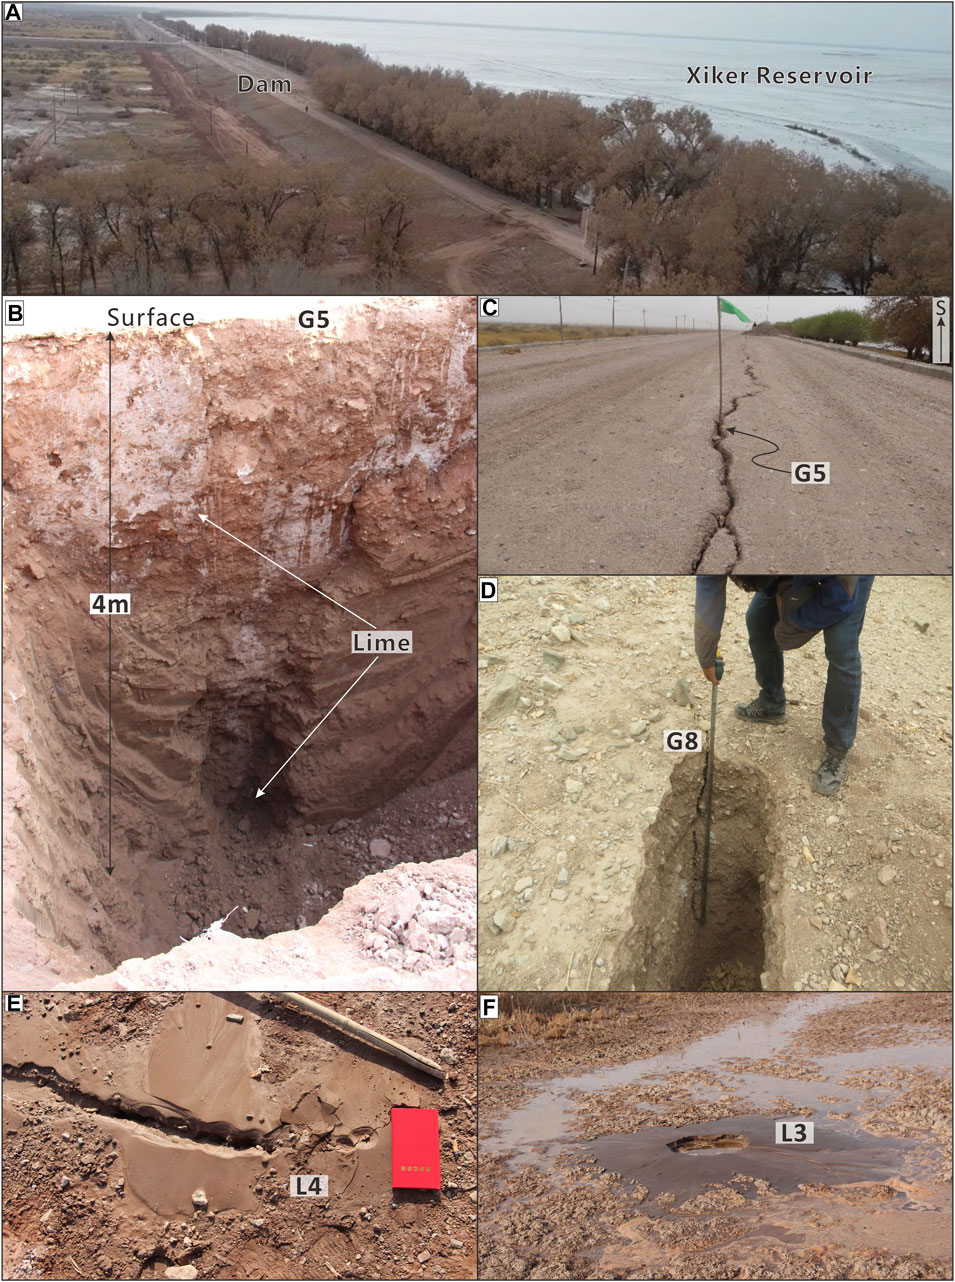
FIGURE 3. (A) A drone image of the Xiker reservoir and dam (taken on January 20, 2020). (B) A trench dug for the G5 dam fissure. Before excavation, lime was poured along the G5 dam fissure. The maximum depth of G5 was 4 m. (C) G5 is a tensile dam fissure with a staggered distribution. (D) G8 is similar to G5 in that it is the other major fissure in the dam. (E) A recent image of sand liquefaction site L4. The sand volcano is distributed in a beaded pattern. (F) The largest sand volcano at sand liquefaction site L3.
Drilling data (Figure 4A) show that the filling soil of the dam body is backfilled gravel soil and artificial soil fill, and the lithology of the dam foundation strata are Quaternary silty sands, clays, and fine sands. We conducted analyses of samples collected from different drilling locations and obtained the parameters of the dam body and dam base (Table 1). The maximum dry density of the dam body soil was 1.64 g/cm3 and the average dry density was 1.55 g/cm3. The maximum dry density of the dam foundation was 1.52 g/cm3 and the average dry density was 1.49 g/cm3.
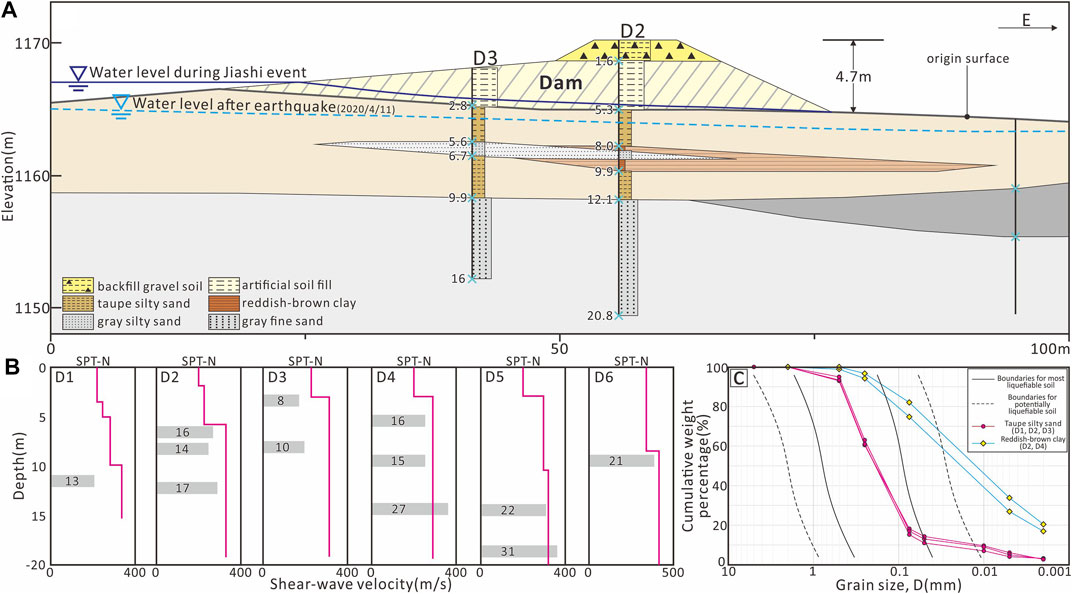
FIGURE 4. (A) Cross section of the Xiker dam. The dark blue line is the water level during the Jiashi earthquake, and the light blue line is the water level after the earthquake (April 11, 2020). (B) Shear wave velocity (purple line) and standard penetration test number (SPT-N) measured at different drill sites. (C) Particle size distributions of samples, in terms of cumulative weight percentages. The purple lines are data from the taupe silty sand samples (D1, D2, D3) and the blue lines are data from the reddish-brown clay samples.
The groundwater in the reservoir area is pore water in the Quaternary system, which is distributed in loose strata within depressions. The groundwater is replenished by reservoir water and atmospheric precipitation, and the water level changes significantly with the reservoir water level. Due to the need for irrigation in the spring of 2020, the reservoir had a high water level (∼1,167–1,168 m) when the Jiashi earthquake occurred on January 19. After the earthquake and damage to the dam occurred, to prevent the occurrence of a dam break, water was released downstream on January 20. When the drilling field work began, the reservoir had a lower water level (1,163–1,164 m).
Strong-Motion Seismometer and Parameters
The strong-motion seismometer used to collect earthquake data was an ETNA2 (ES-T type, America, Kinemetrics Inc), with a dynamic range of >155 dB and a frequency range of 0–200 Hz. The sampling rate of the data collector was 200 samples/s, the resolution exceeded 16 bits, the measurement range was ±4 g, and pre-storage was used to record the complete temporal history of the ground motion (Li et al., 2002).
Particle Size Analyses of Dam Foundation Material
Sands from 11 drilling locations at the Xiker dam were sampled for particle size analyses (Figure 2B). Sand was sampled at different depths of the drilled cores and analyzed at the Xinjiang Research Institute of Investigation Design of Water Conservancy Hydropower. The sieving analysis utilized particle size as a selection parameter:
where D is the diameter of the particles (in mm).
We dried the samples at a temperature of 105–110°C until their weight was constant (after about 24 h). Particle size distributions were determined by weighing the material obtained using sieves with apertures of 0ϕ, 0.5ϕ, 1.0ϕ, 1.5ϕ, 2.0ϕ, 2.5ϕ, 3.0ϕ, 3.5ϕ, and 4ϕ (JPHRI, 1989; Lee et al., 2004).
Standard Penetration Test and Shear Wave Velocity Test
The standard penetration test (Seed et al., 1985) is a kind of dynamic penetration test, which is a method to determine the bearing capacity of sand or cohesive soil foundation in the field. It used a hammer function (hammer weight 63.5 kg, falling from 76 cm) to a certain specification of split tube type injection machine (51 mm split duct diameter, inner diameter of 35 mm, greater than 457 mm in length, bottom length of 76 mm, blade angle of 18–20°, edge thick end 1.6 mm tube boots, upper joint pipe) into the hole in the soil at the bottom of the bore, according to the penetration-into-the-soil impedance, identifying changes and the engineering properties of the soil.
Shear wave velocity test (Cheng et al., 2000; Noutash et al., 2012) is suitable for determining the velocity of compression wave, shear wave or Rayleigh wave of all kinds of rock and soil. The iron ball is used to hit the board horizontally, which makes the board and the ground move and generates abundant shear waves, so that the shear waves propagating down through the soil layer are received at different heights in the borehole. Preparation before testing:
1) The test drilling should be vertical.
2) When the shear wave vibration source is used to hammer the upper pressed wooden board, the vertical line of the length of the board should be aligned with the center of the test hole, and the distance between the hole and the board should be 1 ∼ 3 m. The weight on the plate should be more than 400 kg. The board should be in close contact with the ground.
3) When the compression wave vibration source is used to hammer the metal plate, the distance between the metal plate and the orifice should be 1 ∼ 3 m.
Sand Liquefaction Evaluation
The Seed method (Seed, 1979; 1977) was used to evaluate sand liquefaction, in which if the shear stress generated by the seismic vibrations is greater than the shear stress required to produce liquefaction (here, the shear strength of the sand under the corresponding action), sand liquefaction may occur. All simplified methods that follow the general stress-based approach pioneered by Seed (1979), Seed and Idriss (1982), and Seed et al. (1985) require the determination of two variables, namely the cyclic stress ratio (CSR) and the cyclic resistance ratio (CRR). If CRR > CSR, a site is non-liquefied; otherwise, it is liquefied.
Ground vibrations during an earthquake cause cyclic shear stress in the soil layer. In this study, the equation for CSR, originally defined by Seed and Idriss (1971), was adjusted for the benchmark earthquake (moment magnitude Mw = 7.5). The formula used to calculate CSR is as follows:
where τav is the cyclic shear stress caused by the earthquake in the soil (kPa), σv0 is the vertical total stress of the soil at the studied depth (kPa), σv0’ is the vertical effective stress of the soil at the studied depth (kPa), amax is the peak horizontal ground surface acceleration (m/s2), g is the acceleration due to gravity (m/s2), MSF is the magnitude scaling factor, and γd is the shear stress reduction factor. The magnitude of the Jiashi earthquake was Mw = 6.0, and its MSF was 1.77 (from Eq. 2).
Based on extensive on-site data measured during the earthquake, including data from liquefied and non-liquefied sites, the corresponding relationship between the Standard Penetration Test Number (SPT-N) and the Cyclic Resistance Ratio with SPT-N (CRRs) for a Mw 7.5 earthquake was proposed (Youd and Idriss, 2001; Wu et al., 2019):
where (N1)60 is the SPT-N; the measured SPT-N is corrected to an effective overburden pressure of ∼100 kPa and a falling weight energy ratio of 60%. N60 is the actual measured SPT-N, CN is the SPT-N correction factor, and σv0’ is the vertical effective stress of the soil at the studied depth (kPa, Seed and Idriss, 1982; Liao and Whitman, 1986).
Andrus et al. (1997) compiled data from 26 earthquakes around the world, improved the evaluation of the shear wave velocity test on the liquefaction site, and established a relationship between the CRR and the shear wave velocity. The cyclic resistance ratio with shear-wave velocity (CRRv) can be calculated using Eq. 4:
where Vs1 is the actual measured shear wave velocity (m/s), Vs1* is the upper shear wave velocity at which the soil layer may liquefy (m/s), Z is the depth of the soil (m), Kh is seismic peak ground acceleration coefficient, and rd is the depth reduction factor.
Numerical Simulation
We used the finite difference method and the general finite difference software FLAC 3D (America, Itasca) to simulate the deformation of the dam. The simulation content was permanent deformation of the dam, with the following parameters: a dam height of 7 m, a dam crest width of 8.5 m, and an upstream slope ratio of 1:8. The total number of nodes in the model was 1,069 and the total number of units was 1,003 (Figure 5A). The simulation environment consisted of a water level of 1,168 m and the measured seismic wave was obtained from the Xinjiang Seismic Network Center.
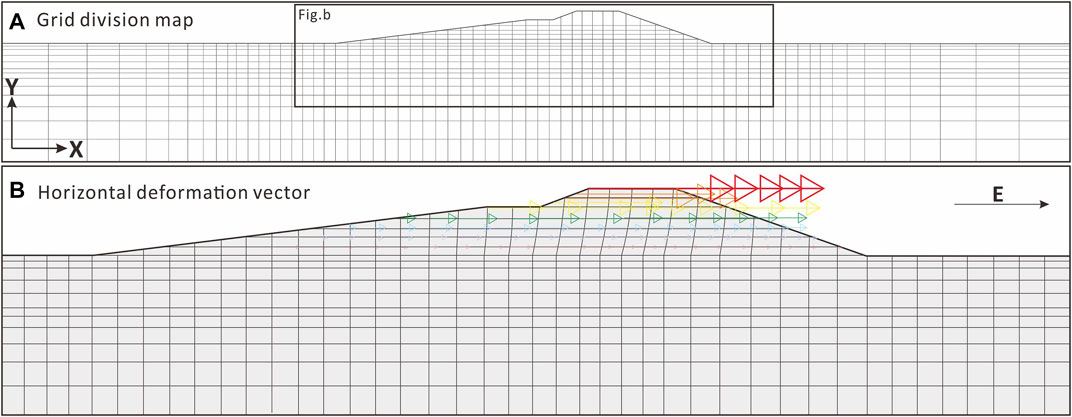
FIGURE 5. (A) Grid division map of the Xiker dam. The total number of nodes in the model was 1,069 and the total number of units was 1,003. (B) Horizontal deformation vector diagram of the dam (the deformation vector was magnified 10×). The deformation of the red arrow is ∼30 cm.
Results
Strong Ground Motion
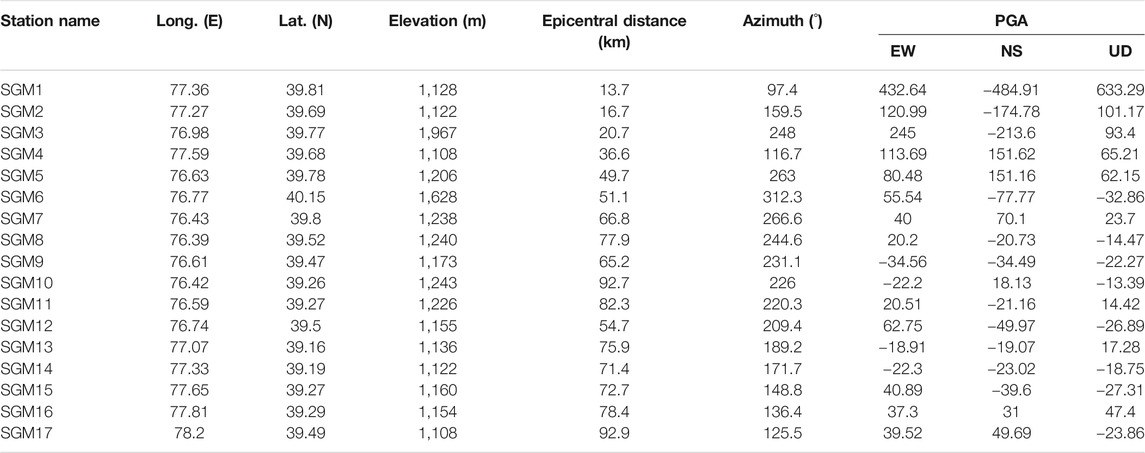
The Jiashi earthquake was located in an area of Xinjiang where strong earthquakes occur frequently. To observe and capture seismic data effectively, the Xinjiang Strong-Motion Network has set up a large number of strong-motion seismometer stations in this area. A total of 44 digital strong-motion observation stations were triggered during the Jiashi event. We selected 17 stations close to the epicenter to better demonstrate the strong-motion characteristics of the earthquake and its aftershocks. These stations were located 13.7–90 km from the epicenter, and 3 stations were within 20 km of it. The nearest station that experienced strong ground motion was the Xiker station (SGM1), which is ∼13.7 km east of the epicenter (Figure 1; Table 2). The peak ground accelerations (PGA) in three directions at station SGM1 were 432.6 cm/s2 (E–W), 484.9 cm/s2 (N–S), and 633.3 cm/s2 (vertical). These values are the highest maximum peak accelerations recorded since the Xinjiang strong-motion observation network was constructed (Figure 6A; Table 2; Li et al., 2020b).
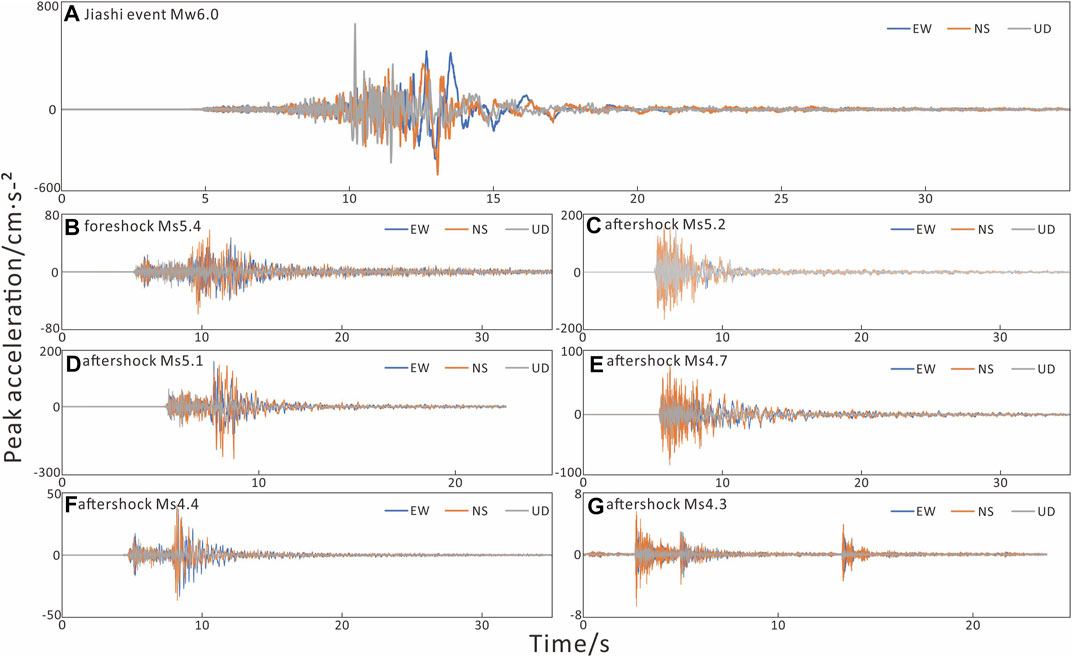
FIGURE 6. Peak Ground Acceleration (PGA) recorded by the Xiker strong ground motion stations. (A) Data from the Jiashi earthquake (Mw 6.0) on January 19, 2020. (B) Foreshock data (Ms 5.4) from January 18, 2020. (C, D, E, F, G) Data from five aftershocks with magnitudes larger than Ms 4.0.
Five strong-motion stations (SGM1, SGM2, SGM3, SGM4, and SGM5) recorded PGA values greater than 100 cm/s2 (Table 2). In an acceleration time–history curve (Figure 6A), as the epicenter distance increases, the PGA of each station gradually decreases, thereby showing an attenuating trend.
Conditions of the Dam Section and Formation
According to different stratal lithologies, the dam foundation could be divided into three sections (Figure 2B):
Site 1 (transition between proluvial and alluvial): the stratal lithology was mainly composed of silty sands, silts, and clays, with a thickness of 2–6 m. In some areas, clays, silts, and silty sands were interlayered as lenses (Figure 4) with thicknesses of 0.3–2 m. The standard penetration test number (SPT-N) of clay and silt within 10 m of the dam foundation was 13–18 (Figure 4B). The shear wave velocity (Vs) of silt and silty sand above 6 m from the dam foundation was 200–250 m/s.
Site 2 (alluvial section): most of the drilling sites in this section were on the dam crest. The artificially filled part (∼6 m) was excluded from the lithological classification process, so the starting point of the lithology stratification was calculated from the original ground level. From top to bottom, the lithology can be divided into four sections (Figure 4A): i) at 0–3 m there were silty sands and silts with a loose structure, a Vs of 200–300 m/s, and a SPT-N of 8–10, which represents a soft state; ii) at 3–4.5 m there was a thin or lenticular relatively water-resistant layer composed of clays; iii) at 4.5–7 m there were silty sands and silts, with a thin clay layer locally, a Vs of 250–300 m/s, and a SPT-N of 10–16, which is a slightly dense state; and iv) below 7 m there were mostly silty fine sands mixed with clay and silt lenses, with an SPT-N of 11–44.
Site 3 (ancient riverbed section): the lithology of the dam foundation was silty sands, silts, and clays. The ancient riverbed was 4.5–5.0 m deep near the axis of the dam. The Vs values of the dam foundation from 0 to 5.5 and 5 m below the stratum were ∼200 and >300 m/s, respectively (Figure 4B). The SPT-N of the silty fine sand was 20–30.
The cumulative weight (Figure 4C) indicated that the sand was composed primarily of material with diameters of 0.005–0.05 mm. Figure 4C shows that in D2 and D3, the grading curve of the 0–3 m gray-brown silt was located within boundaries for most liquefiable soil. This indicates that sand liquefaction may occur in these formations. The maximum dry density of the dam body soil was 1.64 g/cm3 and the average dry density was 1.55 g/cm3. The maximum dry density of the dam foundation was 1.52 g/cm3 and the average dry density was 1.49 g/cm3 (Table 1).
Sand Liquefaction and Dam Fissures
Sand Liquefaction
We conducted a detailed field survey of the dam and the area 300 m behind the dam. We observed only four small–medium scale sand liquefaction (L1–L4) instances at 5–700 m behind the dam (Figure 2B).
L1: Sand liquefaction occurred ∼10 m behind the dam. The diameter of the sand volcano was ∼0.4 m and the liquefaction occurred in an area of ∼10 m2. The liquefied material was mostly grey-brown and yellow-brown silty sands and silts.
L2: Small-scale sand liquefaction occurred 10 m behind the dam mainly in the form of pore water overflow after the earthquake. The liquefied material was mainly yellow–brown silty sands and silts, without fine sand.
L3: Sand liquefaction occurred in a low-lying area ∼700 m behind the dam, with strong salinization at the surface. We observed a large area of sand liquefaction here, with a total of nine sand volcanoes of different sizes. The diameters of the seven small sand volcanoes were less than 0.3 m, and the diameters of the two large sand volcanoes were greater than 1.0 m. The largest sand volcano diameter was ∼3 m (Figure 3F) and the smallest was approximately 0.1 m. The total liquefied area was ∼500 m2 and consisted of gray-brown and gray silty sands.
L4: Continuous small-scale sand liquefaction occurred ∼5 m behind the dam. The liquefied material was taupe silty sands (Figure 3E). During our investigation at the site one day after the earthquake (January 20, 2020), a small amount of water was still coming out of the liquefaction site.
Dam Fissures
Following the earthquake, we conducted a field survey of the Xiker dam and found ten discontinuous longitudinal fissures (Figures 2B, 3B–D; Table 3), designated as G1–G10 from north to south. The locations, lengths, and characteristics of the longitudinal fissures observed in the dam are shown in Table 3. Fissure G4 is located on the foreslope of the dam, fissures G6 and G7 are located on the backslope of the dam, and the other fissures are located on the dam crest. The maximum width of the dam fissures was 5 cm. We found that G5 is the most important fissure observed in the dam regarding width, depth, and length; therefore, we excavated a trench for further investigation. To accurately obtain the depth of the G5 fissure, we poured lime liquid into the fissure prior to excavation. We found that the maximum depth of fissure G5 was 4.0 m (Figures 3B,D). This fissure had an interdigitate shape (Figure 3C) with no horizontal dislocation, indicating that the fissure was tensile.
Discussion
Evaluation of Sand Liquefaction of the Dam Foundation
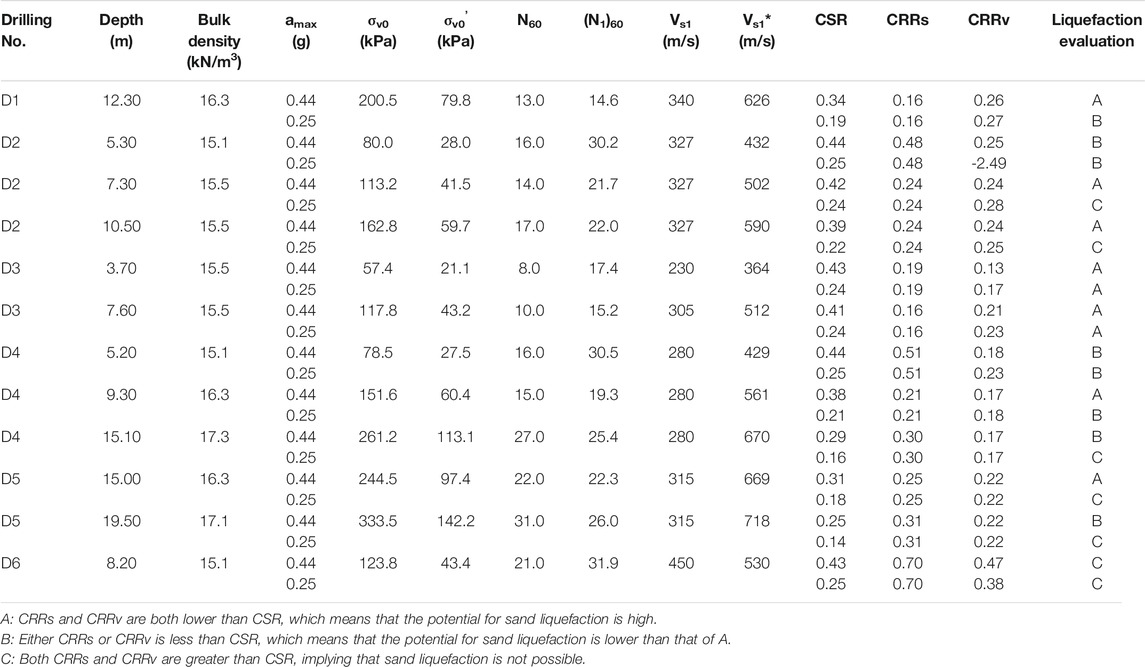
To utilize the Seed simplified method (1979; 1982; 1985) more effectively to evaluate the sand liquefaction of the Xiker dam foundation, we considered factors such as site conditions, near-fault characteristics, and formation lithology. The PGAs (E–W trending) of SGM1 and SGM3 [Table 2, 432.64 cm/s2 (0.44 g) and 245 cm/s2 (0.25 g), respectively] were selected to calculate amax using Eq. 2. We selected six drill sites (D1–6) in different sections of the dam (Sites 1, 2, and 3) for SPT and shear wave velocity tests (Figure 4B). By combining the parameters (SPT-N and Vs) obtained using the two methods, the CRRs, CRRv, and CSR were calculated, and the potential for sand liquefaction in the dam foundation was comprehensively evaluated. Table 4 shows the liquefaction assessment results for drill sites D1–D6.
Two sets of CSR, CRRs, and CRRv were obtained using two PGA values (0.44 g, 0.25 g). We compared the CRRs and CRRv to the CSR to assess the potential for sand liquefaction at the dam foundation. When the CRRs and CRRv were both smaller than the CSR, the soil layer had the highest potential for sand liquefaction (grade A). When either the CRRs or CRRv was smaller than the CSR, the potential for sand liquefaction of the soil layer was low (grade B). When both the CRRs and CRRv were greater than the CSR, the soil layer did not have any potential for sand liquefaction (grade C).
The results of the sand liquefaction evaluation of the Xiker Dam foundation were obtained based on the analyses described above (Table 4). For a PGA of 0.44 g, 58.3% of the soil layers exhibited a high potential for sand liquefaction (grade A). The shallowest soil layer was 3.7 m and the deepest soil layer was 15 m. In addition, 33.3% of the soil layers exhibited low probabilities of sand liquefaction (grade B), and only one set of soil layers was incapable of sand liquefaction. For a PGA of 0.25 g, these data dropped sharply. Only 16.7% of the soil layers had the highest potential (grade A) for sand liquefaction and 50% of the soil layers were incapable (grade C) of sand liquefaction. This also directly demonstrates that the PGA value strongly influences sand liquefaction in the soil layer. Notably, for both PGA values (0.44 and 0.25 g), only two sets of soil layers (at depths of 3.7 and 7.6 m in D3) exhibited the highest potential (grade A) for sand liquefaction (Table 4). From the particle distribution curve (Figure 4C), we found that the lenticular red-brown clay layer had a high clay particle content (D50 = 0.01 mm). This layer was relatively impermeable and was incapable of undergoing sand liquefaction. Therefore, there was no material channel for sand liquefaction in the stratum below it. Based on these results, we concluded that the taupe silty sand within 3 m of the original surface was the layer where sand liquefaction occurred in the foundation of the Xiker dam (Figure 4A).
Relationship Between Dam Fissures and Sand Liquefaction
Dam fissures are the most common type of earthquake damage suffered by earth dams (Krinitzsky and Hynes, 2002; Raghvendra et al., 2005). Such fissures were observed in almost all the damaged dams in this study that had a risk or high risk of a dam-break. Several longitudinal fissures were observed at the Xiker dam crest, most of which were located in the middle segment of the dam crest as well as on the dam backslope (Figures 2B–D, 3C,D). The lengths of the longitudinal fissures in the dam crest varied from ∼10 m to more than 900 m (Table 3), with widths that ranged from 0.3–3 cm (Table 3). The maximum depth of the fissures was ∼4 m. Moreover, the longitudinal fissures on the dam backslope always occurred near the dam crest. Fissures were present at Site 2 on the dam, where the fissure length and depth were relatively smaller than those observed on the dam crest. Figures 2B, 3C show the fissure distribution on the dam crest. The widths of the longitudinal fissures on the dam crest were small and the fracture planes were notably uneven. However, there was no obvious evidence of the horizontal slip that denotes tensile fissures.
Due to the earthquake vibrations, the effective stress of the layer of taupe silty sand under the dam decreased (Figure 7A), the pore water stress increased, and sand liquefaction occurred. We also observed sites of sand liquefaction located behind the dam (Figures 2B, 7A,B). Liquefaction caused uneven settling behind the dam, such that the rear part of the dam rotated in the downstream direction (Figure 7B), producing a series of longitudinal fissures that developed on the dam crest. Figure 4B shows the distribution of the sand liquefaction and fissures, both of which were observed at Site 2 on the dam. This indicates that the formation of dam fissures was directly related to the occurrence of sand liquefaction behind the dam (Figure 7C).
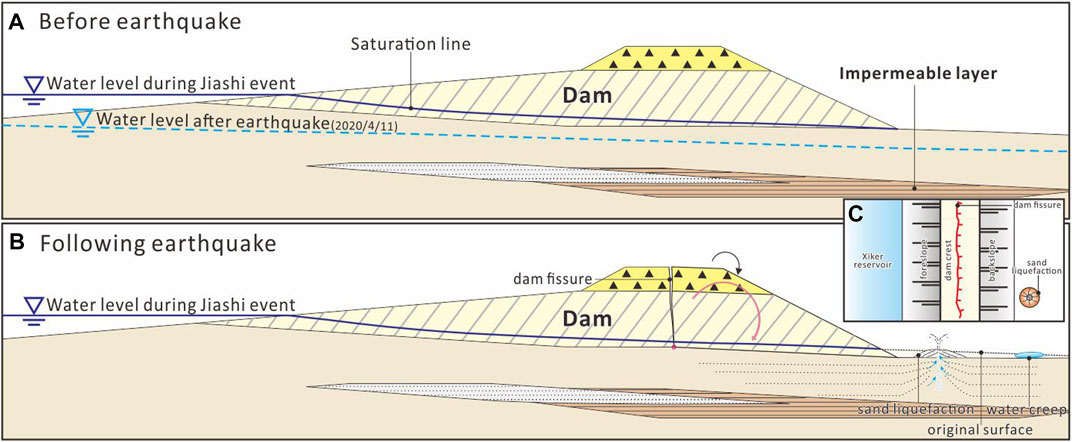
FIGURE 7. (A) The Xiker dam before the earthquake, including the formation and water level. (B) The state of the dam following the earthquake, including locations of dam fissures and sand liquefaction. (C) A plan of the dam after the earthquake showing the horizontal position of sand liquefaction and dam fissures.
The dynamic calculation results show that the maximum horizontal deformation of the dam foreslope and the dam backslope are 22.35 and 29.8 cm, respectively (Figure 5B). The horizontal deformation vector of the dam foreslope was ∼7.45 cm smaller than that of the dam backslope. Because of the sand liquefaction that occurred behind the dam, local settling of the foundation behind the dam also occurred, while the foreslope of the dam is more stable due to the pressure of the reservoir water. The horizontal deformations upstream and downstream of the dam crest were inconsistent, which produced the large-scale longitudinal tension fissures on the dam crest. The width of the maximum length fissures (G5 and G8) on the dam crest is 2–5 cm (Table 3). It is worth mentioning that this is in highly consistent with the numerical simulation results.
Superposition Effect of Multiple Earthquakes
The Xiker reservoir is located in one of the most seismically active regions in China. From 1997 to 1998, 9 Ms ≥ 6.0 earthquakes and several Ms ≥ 5.0 earthquakes occurred in this region (Gao et al., 1997; Lai et al., 2002; Zhao, 2006). In 2003, a Mw 6.3 earthquake occurred in northeastern Jiashi County (Figures 1, 8A). Frequent earthquakes have caused obvious damage (e.g., fissures and sand liquefaction) and undetecTable damage to the dam. This undetecTable damage may not have a major impact on the dam with a single earthquake. However, frequent earthquakes will result in the accumulation of undetecTable damage. Eventually, an earthquake or equivalent disaster (e.g., flood, rainstorm, or rat infestation) will produce large-scale damage and potentially even dam failure (Chen et al., 2014).
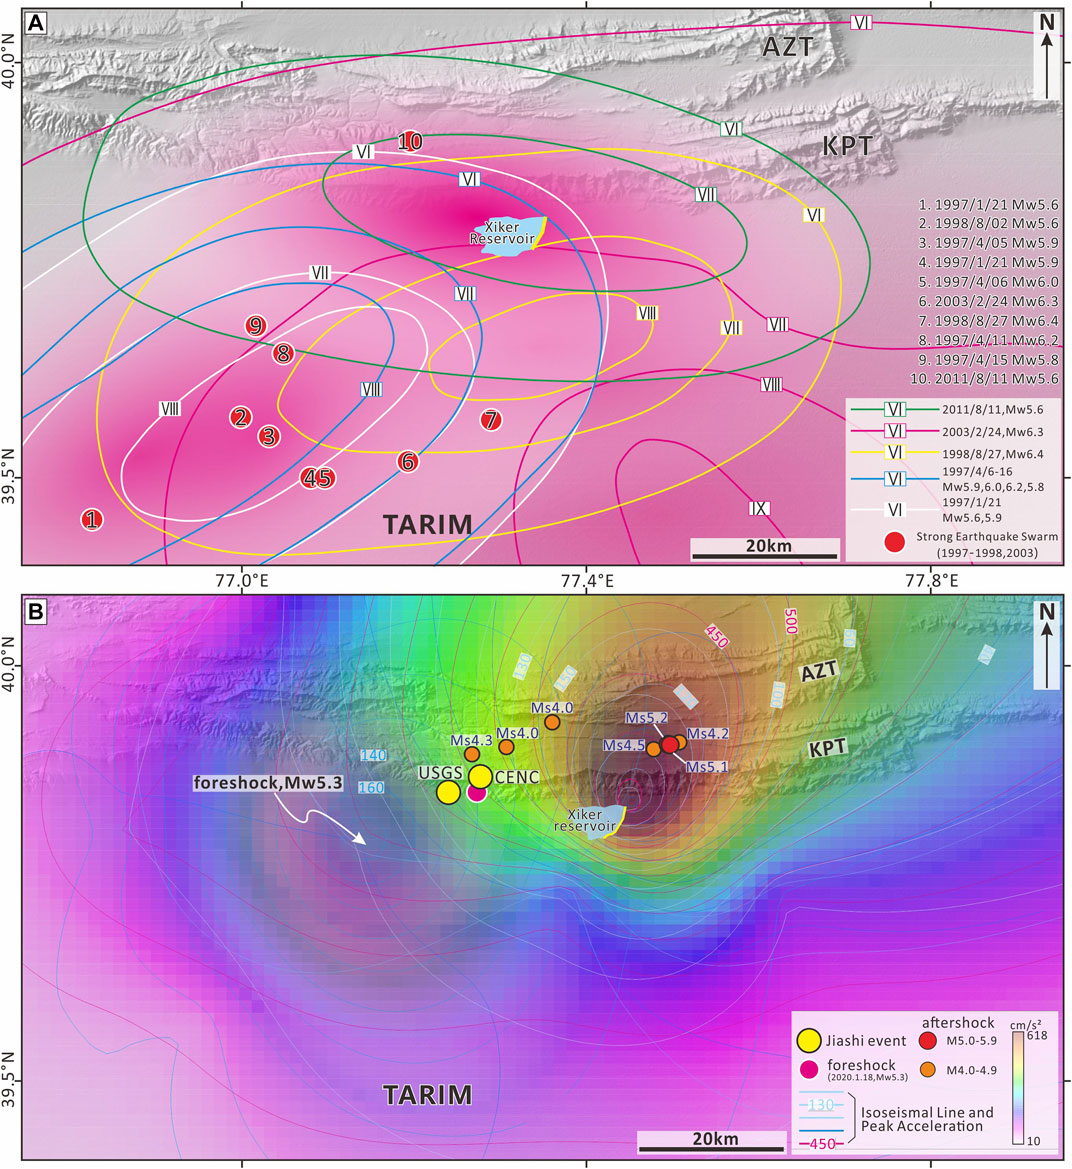
FIGURE 8. (A) Superposition diagram of the seismic intensities of each earthquake in the Jiashi strong earthquake swarm. The different colored lines represent the seismic intensity ranges of the different earthquakes, which are determined according to building damage characteristics. (B) PGA superposition map of the Jiashi earthquake, including the foreshock, main shock, and aftershocks (Ms > 4.0). PGA was measured by the strong-motion stations shown in Figure 1 (data are shown in Table 2).
We compiled the seismic intensity maps of all Mw > 5.0 earthquakes that occurred in the Jiashi region from 1997 to 2011 and superimposed them (Figure 8A). Figure 8A shows that the 1997–1998 Jiashi strong earthquake swarm and the 2003 Bachu-Jiashi earthquake (Nos. 1–9) affected the Xiker dam with intensity VI. This also explains why no earthquake damage was observed at the Xiker dam after the Jiashi strong earthquake swarm and the Bachu-Jiashi earthquake (Table 5). The 2011 Mw 5.6 earthquake caused serious damage to the Xiker dam (Figure 8A). Several longitudinal fissures appeared on the dam crest, and the maximum fissure depth was 2 m (Table 5). This should not occur in a dam built to withstand frequent earthquakes, with a seismic fortification intensity of VIII and a design PGA of 0.20 g. In addition to factors stemming from poor site conditions, the main reason for this damage was the occurrence of frequent medium–strong (Mw 5–6) earthquakes in a very small area during 1997–1998 and 2003, which caused undetecTable damage to the dam. The epicenter of the 2011 Mw 5.6 earthquake was close to the dam and the earthquake intensity was VII. This became the “fuse” for the compounded previously undetecTable damage that caused more serious damage to the dam.

TABLE 5. Damage to the Xiker dam caused by historic earthquakes (Aximu, 2006).
We collected a large amount of strong-motion earthquake data from the 2020 Jiashi earthquake (Table 2; Figure 3). By combining the fault strike and upper and lower wall effects, the PGAs of the foreshock, main shock, and aftershocks were fitted, and isoseismal lines were generated (Figure 8B). Figure 8B shows that the Xiker dam is located where the vibration intensity of the Jiashi event was the highest. The effects of the aftershocks were also superimposed mainly in this area. Notably, sand liquefaction and most of the fissures were caused by the main shock, while the aftershocks (Ms > 4.0) exacerbated this damage. However, in this study, we were unable to identify which damage was caused by the main earthquake and which by the aftershocks, because both the main earthquake and the aftershocks had already happened when we started the field investigation in April 2020.
Conclusion
We investigated the Xiker earth dam following the 2020 Jiashi earthquake and identified the locations, depths, and lengths of the dam fissures, as well as the locations and scale of sand liquefaction. Using the simplified method proposed by Seed and Idriss, the potential for sand liquefaction in the dam foundation was evaluated at PGAs of 0.44 and 0.25 g. The results suggest that only the 0–3 m and 5–7 m depth taupe silty sands were capable of liquefaction. A set of reddish-brown clay layers is present above the 5–7 m silty sand layer. These strata are relatively impermeable and will hinder the flow of materials; thus, the 5–7 m silty sand layer will not liquefy. Therefore, the sand liquefaction caused by this earthquake occurred in the taupe silty sand layer at a depth of 0–3 m beneath the dam foundation. Owing to the locations of sand liquefaction events behind the dam, uneven settling occurred at the dam foundation. Numerical simulation results also indicate that the horizontal deformation vector of the dam foreslope was ∼7.45 cm smaller than that of the dam backslope. Therefore, the backslope of the dam showed a relative motion in the downstream direction, which caused longitudinal tensile fissures to develop on the crest of the dam. Frequent strong earthquakes in the past 30 years (especially the 1997–1998 Jiashi strong earthquake swarm and the 2003 Bachu-Jiashi earthquake) were another important reason behind the large-scale damage suffered by the Xiker dam. However, without real-time monitoring data for the dam, we could not effectively evaluate any compounded damage. It is therefore critical to carry out real-time monitoring of all types of earth dams in areas with high earthquake intensities and frequencies. Monitoring includes installing continuous GPS stations, as well as regular leveling surveys and seepage monitoring instruments on the dams.
Data Availability Statement
The original contributions presented in the study are included in the article/Supplementary Material, further inquiries can be directed to the corresponding author.
Author Contributions
YY: Responsible for writing full text and data processing. LT: Responsible for data verification of sand liquefaction. WL: Responsible for data processing of strong vibration. JH: Responsible for strong vibration data collection and verification. HJ: Responsible for numerical simulation and related interpretation.
Funding
This study was supported by the Science for Earthquake Resilience of China Earthquake Administration (XH20067, XH19051, XH20068Y), the Special Projects for Basic Research Work of the Institute of Geology, China Earthquake Administration (IGCEA 1810), and Key R&D Program of Xinjiang Uygur Autonomous Region (2020B03006-1).
Conflict of Interest
The authors declare that the research was conducted in the absence of any commercial or financial relationships that could be construed as a potential conflict of interest.
Publisher’s Note
All claims expressed in this article are solely those of the authors and do not necessarily represent those of their affiliated organizations, or those of the publisher, the editors and the reviewers. Any product that may be evaluated in this article, or claim that may be made by its manufacturer, is not guaranteed or endorsed by the publisher.
Supplementary Material
The Supplementary Material for this article can be found online at: https://www.frontiersin.org/articles/10.3389/feart.2021.721997/full#supplementary-material
References
Abdrakhmatov, K. Y., Aldazhanov, S. A., Hager, B. H., Hamburger, M. W., Herring, T. A., Kalabaev, K. B., et al. (1996). Relatively Recent Construction of the Tien Shan Inferred from GPS Measurements of Present-Day Crustal Deformation Rates. Nature. 384, 450–453. doi:10.1038/384450a0
Allen, M. B., Vincent, S. J., and Wheeler, P. J. (1999). Late Cenozoic Tectonics of the Kepingtage Thrust Zone: Interactions of the Tien Shan and Tarim Basin, Northwest China. Tectonics. 18, 639–654. doi:10.1029/1999tc900019
Ambraseys, N. N. (1960). On the Seismic Behaviour of Earth Dams. Proc. 2nd World Conf. Earthquake Eng. 2, 331–358.
Ambraseys, N., and Sarma, S. (1969). Liquefaction of Soils Induced by Earthquakes. Bull. Seismol. Soc. Am. 59, 651–664. doi:10.1785/bssa0590020651
Andrus, R. D., and Stokoe, K. H. (1997). Liquefaction Resistance Based on Shear Wave Velocity. Buffalo, NY: NCEER Technical Report. NCEER-97-0022.
Avouac, J. P., Tapponnier, P., and Bai, M. (1993). Active Thrusting and Folding Along the Northern Tienshan and Late Cenozoic Rotation of the Tarim Relative to Dzungaria and Kazakhstan. J. Geophys. Res. 98 (B4), 6755–6804. doi:10.1029/92jb01963
Aximu, K. (2006). Influence of Earthquake on Xike'er Reservoir Dam and Rehabilitation. Dam Saf. (06), 64–67. (in Chinese). doi:10.3969/j.issn.1671-1092.2006.06.017
Bardet, J. P., and Davis, C. A. (1996). Performance of San Fernando Dams during 1994 Northridge Earthquake. J. Geotech. Eng. ASCE. 122 (7), 554–564. doi:10.1061/(asce)0733-9410(1996)122:7(554)
Bastin, S., van Ballegooy, S., Mellsop, N., and Wotherspoon, L. (2020). Liquefaction Case Histories From the 1987 Edgecumbe Earthquake, New Zealand – Insights from an Extensive CPT Dataset and Paleo-Liquefaction Trenching. Eng. Geology. 271, 1–14. doi:10.1016/j.enggeo.2019.105404
Boulanger, R., and Idriss, I. (2014). CPT and SPT Based Liquefaction Triggering Procedures. Davis: Center for Geotechnical Modeling, University of California. Report No. UCD/CGM-14/01.
Burchfiel, B. C., Brown, E. T., and Deng, Q. D. (1999). Crustal Shortening on the Margins of the TienShan, Xinjiang, China. Int. Geology. Rev. 41, 665–700. doi:10.1080/00206819909465164
Cao, Z. Z., Youd, T. L., and Yuan, X. M. (2011). Gravelly Soils that Liquefied During 2008 Wenchuan, China Earthquake, Ms = 8.0. Soil Dyn. Earthq. Eng. 31, 1132–1143. doi:10.1016/j.soildyn.2011.04.001
Chen, G., Jin, D., Mao, J., Gao, H., Wang, Z., Jing, L., et al. (2014). Seismic Damage and Behavior Analysis of Earth Dams during the 2008 Wenchuan Earthquake, China. Eng. Geology. 180, 99–129. doi:10.1016/j.enggeo.2014.06.001
Chen, J., Yin, J. H., and Qu, G. S. (2000). Timing, Lower Boundary, Genesis, and Deformation of Xiyu Formation Around the Western Margins of the Tarim basin. Seismology Geology. 22 (Suppl. l), 104–l16. (in Chinese with English abstract).
Chen, L. W., Yuan, X. M., Cao, Z. Z., Hou, L. Q., Sun, R., Dong, L., et al. (2009). Liquefaction Macrophenomena in the Great Wenchuan Earthquake. Earthq. Eng. Eng. Vib. 8, 219–229. doi:10.1007/s11803-009-9033-4
Deng, Q. D., Feng, X. Y., and Zhang, P. Z. (2000). Active Tectonics in the Tianshan. Beijing: Seismological Press. (in Chinese with English abstract).
Gao, G. Y., Ge, S. M., and Han, Y. P. (1997). The Characteristics of Rupture Process of Xinjiang Atushi Earthquake (Ms=6.9), 19 March 1996. Earthquake. 17 (3), 290–296. (in Chinese with English abstract).
Heermance, R. V., Chen, J., Burbank, D. W., and Miao, J. (2008). Temporal Constraints and Pulsed Late Cenozoic Deformation During the Structural Disruption of the Active Kashi Foreland, Northwest China. Tectonics. 27, TC6012. doi:10.1029/2007TC002226
Hendrix, M. S., Dumitru, T. A., and Graham, S. A. (1994). Late Oligocene-Early Miocene Unroofing in the Chinese TianShan: an Early Effect of the India-Asia Collision. Geology. 22, 487–490. doi:10.1130/0091-7613(1994)022<0487:loemui>2.3.co;2
Holzer, T, L., Jayko, A, S., Hauksson, E., Fletcher, J, P, B., Noce, T, E., Bennett, M, J., et al. (2010). Liquefaction Caused by the 2009 Olancha, California (USA), M 5.2 Earthquake. Eng. Geology. 116 (1–2), 184–188. doi:10.1016/j.enggeo.2010.07.009
Hou, L. Q., Li, A. F., and Qiu, Z. M. (2011). Characteristics of Gravelly Soil Liquefaction in Wenchuan Earthquake. Appl. Mech. Mater. 90–93, 1498–1502. doi:10.4028/www.scientific.net/amm.90-93.1498
Housner, G. W., and Hudson, D. E. (1958). The Port Hueneme Earthquake of March 18, 1957. Bull. Seismological Soc. America. 48 (2), 163–168. doi:10.1785/bssa0480020163
Huang, Y., and Jiang, X. M. (2010). Field-Observed Phenomena of Seismic Liquefaction and Subsidence During the 2008 Wenchuan Earthquake in China. Nat. Hazards. 54, 839–850. doi:10.1007/s11069-010-9509-6
Ishihara, K. (1993). Liquefaction and Flow Failure During Earthquakes. Géotechnique. 43 (3), 351–451. doi:10.1680/geot.1993.43.3.351
Iwasaki, T. (1986). Soil Liquefaction Studies in Japan: State-Of-The-Art. Soil Dyn. Earthquake Eng. 5 (1), 2–68. doi:10.1016/0267-7261(86)90024-2
Jin, L. P., Chen, G. X., Li, Y. Q., and Tang, H. (2009). Investigation on Earthquake-Induced Dam Damage During Wenchuan Earthquake. J. Earthquake Eng. Eng. Vib. 29 (1), 14–23. (In Chinese). doi:10.1016/S1874-8651(10)60080-4
JPHRI (1989). Port and Harbor Facilities Design Guide Book. Tokyo: Japan Port and Harbor Research Institute. (In Japanese).
Krinitzsky, E. L., and Hynes, M. E. (2002). The Bhuj, India, Earthquake: Lessons Learned for Earth-Quake Safety of Dams on Alluvium. Eng. Geol. 66 (3–4), 163–196. doi:10.1016/s0013-7952(02)00049-2
Lai, Y. G., Liu, Q. Y., and Chen, J. H. (2002). Features of the S-Wave Splitting and Stress Field in the Xinjiang Jiashi strong Earthquake Region. Chin. J. Geophys. 45 (1), 83–92. (in Chinese with English abstract). doi:10.1002/cjg2.219
Lee, D. H., Ku, C. S., and Yuan, H. (2004). A Study of the Liquefaction Risk Potential at Yuanlin, Taiwan[J]. Eng. Geology. 71 (1-2), 97–117. doi:10.1016/s0013-7952(03)00128-5
Li, A., Ran, Y., and Gomez, F. (2020a). Segmentation of the Kepingtage Thrust Fault Based on Paleo-Earthquake Ruptures, Southwestern Tianshan, China. Nat. Hazards. 103, 1385. doi:10.1007/s11069-020-04040-6
Li, W. Q., Zhu, H. Q., and He, J. G. (2020b). The Characteristics of Strong Motion Records of Xinjiang Jiashi Ms6.4 Earthquake on January 19, 2020. Inland earthquake. 34 (1). (in Chinese with English abstract).
Li, A., Ran, Y., and Xu, L. (2013). Paleoseismic Study of the East Kalpintage Fault in Southwest Tianshan Based on Deformation of Alluvial Fans and 10Be Dating. Nat. Hazards. 68 (2), 1075–1087. doi:10.1007/s11069-013-0675-1
Li, Y. J., Wang, Z. M., and Wu, H. R. (2002). New Discovery of Radiolarian Fossils from Aktik Group in Southern Tianshan. Aeta Geologica Sinica. 76 (2), 146–154.
Liao, S., and Whitman, R. V. (1986). Overburden Correction Factors for SPT in Sand. J. Geotechnical Eng. ASCE. 112 (3), 373–377. doi:10.1061/(asce)0733-9410(1986)112:3(373)
Lin, M. L., Liao, H. J., and Ueng, T. S. (1999). A Study on the Geotechnical-Related Damages in the Chi-Chi Earthquake. Civil Hydraulic Eng. 26 (3), 60–71. (in Chinese).
Liu, Z, J., Wang, P., Zhang, Z, H., Li, Z, G., Cao, Z, Z, Zhang, J, Y., et al. (2016). Liquefaction in Western Sichuan Basin during the 2008 Mw 7.9 Wenchuan Earthquake. China: Tectonophysics, 1–25.
Lu, H. F., Howell, D. G., and Dong, J. (1994). Rejuvenation of Kuqa Foreland basin, Northern Flank of the Tarim basin, Northwest China. Int. Geology. Rev. 36, 1151–1158. doi:10.1080/00206819409465509
Nagase, H., and Ishihara, K. (1988). Liquefaction-Induced Compaction and Settlement of Sand During Earthquake. Soils and Foundations. 28 (1), 65–76. doi:10.3208/sandf1972.28.65
Noutash, M. K., Dabiri, R., and Bonab, M. H. (2012). The Evaluation of Soil Liquefaction Potential Using Shear Wave Velocity Based on Empirical Relationships. Int. J. Eng. 6 (4), 218–232.
Obermeier, S. F. (2000). Liquefaction Evidence for the Strength of Ground Motions Resulting From Late Holocene Cascadia Subduction Earthquakes, With Emphasis on the Event of 1700 A.D. Bull. Ssmological Soc. America. 90 (4), 876–896. doi:10.1785/0119980179
Ozkan, M. Y., Ozyazicioglu, M., and Aksar, U. D. (2006). AN Evaluation of Guldurcek Dam Response During 6 June 2000 Orta Earthquake. Soil Dyn. Earthquake Eng. 26 (5), 405–419. doi:10.1016/j.soildyn.2005.10.007
Raghvendra, S., Debasis, R., and Sudhri, K. J. (2005). Analysis of Earth Dams Affected by the 2001 Bhuj Earthquake. Eng. Geol. 80 (3–4), 282–291. doi:10.1016/j.enggeo.2005.06.002
Seed, B. (1968). Landslides During Earthquakes Due to Soil Liquefaction. J. Soil Mech. Found. Div. Am. Soc. Civ. Eng. 94, 1053–1122. doi:10.1061/jsfeaq.0001182
Seed, H. B. (1979). Soil Liquefaction and Cyclic Mobility Evaluation for Level Ground during Earthquakes. J. Geotechnical Eng. Division. 105 (2), 201–255. doi:10.1061/ajgeb6.0000768
Seed, H. B., and Booker, J. R. (1977). Stabilization of Potentially Liquefiable Sand Deposits Using Gravel drain Systems. J. Ged Asce. 103 (4), 757–768. doi:10.1061/ajgeb6.0000453
Seed, H. B., and Idriss, I. M. (1971). Simplified Procedure for Evaluating Soil Liquefaction Potential. J. Soil Mech. Found. Division, ASCE. 97 (9), 1249–1273. doi:10.1061/jsfeaq.0001662
Seed, H. B., and Idriss, I. M. (1982). Ground Motions and Soil Liquefaction during Earthquakes. Earthquake Eng. Res. Inst. Monogr.
Seed, H. B., Lee, K. L., Idriss, I. M., and Makdisi, F. I. (1975). The Slides in the San Fernando Dams During the Earthquake of February 9, 1971. J. Geotech. Eng. ASCE. 101 (7), 651–688. doi:10.1061/ajgeb6.0000178
Seed, H. B., Tokimatsu, K., and Harder, L. F. (1985). The Influence of SPT Procedures in Soil Liquefaction Resistance Evaluation. J. Geotechnical Eng. ASCE. 111 (12), 1425–1445. doi:10.1061/(asce)0733-9410(1985)111:12(1425)
Tani, S. (2000). Behavior of Large Fill Dams During Earthquake and Earthquake Damage. Soil Dyn. Earthquake Eng. 20 (1), 223–229. doi:10.1016/s0267-7261(00)00055-5
Tapponnier, P., and Molnar, P. (1979). Active Faulting and Cenozoic Tectonics of the TienShan, Mongoliam and Baykal Regions. J. Geophys. Res. 84, 3425–2459. doi:10.1029/jb084ib07p03425
Wang, C, Y. (2007). Liquefaction Beyond the Near Field. Seismological Res. Lett. 78 (5), 512–517. doi:10.1785/gssrl.78.5.512
Wang, C., Dreger, D, S., Wang, C., Mayeri, D., and Berryman, J, G. (2003). Field Relations Among Coseismic Ground Motion, Water Level Change and Liquefaction for the 1999 Chi-Chi (Mw = 7.5) Earthquake, Taiwan. Geophys. Res. Lett. 30 (17), 1890. doi:10.1029/2003gl017601
Wang, M., and Shen, Z. K. (2020). Present-day Crustal Deformation of continental China Derived from GPS and its Tectonic Implications. J. Geophys. Res. Solid Earth. 125, e2019JB018774. doi:10.1029/2019JB018774
Wang, Q., Zhang, P. Z., Freymueller, J. T., Bilham, R., Larson, K. M., Lai, X., et al. (2000). Present-day Crustal Deformation in China Constrained by Global Positioning System Measurements. Science. 294, 574–577. doi:10.1126/science.1063647
Wang, X. L. (2015). Simple Analysis of Safety Verification and Reinforcement Measures for the Xiker Dam. Water Conservancy Sci. Technology Economy. 21 (5), 120–122. (in Chinese).
Wu, Y. L., Wang, Y. H., and Chen, D. X. (2019). Application of Seed Simplified Method in Sand Liquefaction Discrimination of Overseas Transmission Line Engineering. J. Green Sci. Technology. (14), 261–263. (in Chinese with English abstracts).
Xu, L., Ran, Y, K., and Liu, H. (2019). 10Be-derived Sub-Milankovitch Chronology of Late Pleistocene Alluvial Terraces Along the Piedmont of SW Tian Shan. Geomorphology. 328, 173–182. doi:10.1016/j.geomorph.2018.12.009
Yao, Y., Chen, J., Li, T., Fu, B., Wang, H., Li, Y., et al. (2019). Soil Liquefaction in Seasonally Frozen Ground During the 2016 Mw6.6 Akto Earthquake. Soil Dyn. Earthquake Eng. 117 (FEB), 138–148. doi:10.1016/j.soildyn.2018.08.024
Yao, Y., Wen, S., Li, T., and Wang, C. (2020). The 2020 Mw 6.0 Jiashi Earthquake: A Fold Earthquake Event in the Southern Tian Shan, Northwest China. Seismol. Res. Lett. 92, 859–869. doi:10.1785/0220200146
Yin, A., Nie, S., Craig, P., Harrison, T. M., Ryerson, F. J., Qian, X. L., et al. (1998). Late Cenozoic Tectonic Evolution of the Southern Chinese Tian Shan. Tectonics. 17, 1–27. doi:10.1029/97tc03140
Yoshikazu, Y., Masafumi, K., and Toshihide, K. (2012). Safety Inspections and Seismic Behavior of Embankment Dams during the 2011 off the Pacific Coast of Tohoku Earthquake. Soils Found. 52 (5), 945–955. doi:10.1016/j.sandf.2012.11.026
Youd, T. L., and Hoose, S. N. (1977). “Liquefaction Susceptibility and Geologic Setting,” in Proceedings of the 6th World Conference on Earthquake Engineering (Roorkee, India: Indian Society of Earth-quake Technology), 37–42.
Youd, T. L., and Idriss, I. M. (2001). Liquefaction Resistance of Soils: Summary Report From the 1996 NCEER and 1998 MCEER/ NSF Workshops on Evaluation of Liquefaction Resistance of Soils. J. Geotechnical Geo-environmental Eng. 2001 (10), 297–313. doi:10.1061/(asce)1090-0241(2001)127:4(297)
Keywords: the 2020 Jiashi Mw6.0 earthquake, Xiker dam, dam fissures, sand liquefaction, liquefaction evaluation
Citation: Yao Y, Tang L, Li W, He J and Jia H (2021) Seismic Damage and Analysis of the Xiker Earth Dam During the 2020 Jiashi Earthquake, Northwestern China. Front. Earth Sci. 9:721997. doi: 10.3389/feart.2021.721997
Received: 08 June 2021; Accepted: 26 July 2021;
Published: 06 August 2021.
Edited by:
Chong Xu, Ministry of Emergency Management, ChinaReviewed by:
Qi Yao, China Earthquake Administration, ChinaKiran Kumar Singh Thingbaijam, GNS Science, New Zealand
Copyright © 2021 Yao, Tang, Li, He and Jia. This is an open-access article distributed under the terms of the Creative Commons Attribution License (CC BY). The use, distribution or reproduction in other forums is permitted, provided the original author(s) and the copyright owner(s) are credited and that the original publication in this journal is cited, in accordance with accepted academic practice. No use, distribution or reproduction is permitted which does not comply with these terms.
*Correspondence: Yuan Yao, eXk4MDk2NjU4QDEyNi5jb20=
 Yuan Yao
 Lihua Tang1,2
 Hailiang Jia
