 Marika M. Holland
 Laura Landrum
94% of researchers rate our articles as excellent or good
Learn more about the work of our research integrity team to safeguard the quality of each article we publish.
Find out more
ORIGINAL RESEARCH article
Front. Earth Sci., 01 September 2021
Sec. Interdisciplinary Climate Studies
Volume 9 - 2021 | https://doi.org/10.3389/feart.2021.719024
This article is part of the Research TopicArctic Amplification: Feedback Process Interactions and ContributionsView all 10 articles
Under rising atmospheric greenhouse gas concentrations, the Arctic exhibits amplified warming relative to the globe. This Arctic amplification is a defining feature of global warming. However, the Arctic is also home to large internal variability, which can make the detection of a forced climate response difficult. Here we use results from seven model large ensembles, which have different rates of Arctic warming and sea ice loss, to assess the time of emergence of anthropogenically-forced Arctic amplification. We find that this time of emergence occurs at the turn of the century in all models, ranging across the models by a decade from 1994–2005. We also assess transient changes in this amplified signal across the 21st century and beyond. Over the 21st century, the projections indicate that the maximum Arctic warming will transition from fall to winter due to sea ice reductions that extend further into the fall. Additionally, the magnitude of the annual amplification signal declines over the 21st century associated in part with a weakening albedo feedback strength. In a simulation that extends to the 23rd century, we find that as sea ice cover is completely lost, there is little further reduction in the surface albedo and Arctic amplification saturates at a level that is reduced from its 21st century value.
Surface-based Arctic amplification is a well-known phenomenon in which the Arctic surface temperature warms more than the global average when the climate is subject to increased atmospheric greenhouse gas concentrations (or other similar external forcing). Climate models consistently simulate surface-based Arctic amplification in climate change projections (e.g., Manabe and Stouffer, 1980; Holland and Bitz, 2003) and it is also apparent in observations of the warming climate (e.g., Serreze et al., 2009; Screen and Simmonds, 2010). However, there are large uncertainties in projected Arctic warming across models primarily as a consequence of differences in model structure (e.g., Cai et al., 2021).
Numerous factors contribute to the amplified warming in the Arctic, including both radiative and non-radiative feedbacks (e.g., Goosse et al., 2018). These feedbacks are often a consequence of unique conditions in the Arctic, such as the presence of snow and ice, the relatively cold temperatures, and the prevalance of a stably stratified atmosphere. The feedbacks influencing Arctic amplification can also be interrelated. For example, both the surface-albedo feedback and the positive Arctic lapse rate feedback are strongly influenced by the loss of sea ice (e.g., Boeke et al., 2020; Feldl et al., 2020). Evidence from coupled climate models suggests that feedbacks local to the Arctic are the dominant drivers of amplification (e.g., Stuecker et al., 2018) although interactions with lower latitudes through changing atmospheric and oceanic heat transport for example can play some role (e.g., Mahlstein and Knutti, 2011). There are considerable discrepancies across models in the magnitude and relative importance of various feedbacks which contributes to uncertainty in Arctic warming (e.g., Pithan and Mauritsen, 2014; Bonan et al., 2018; Hu et al., 2020).
The amplified warming signature has a seasonal and spatial dependence. Even early climate models exhibited that amplified surface warming in the Arctic would primarily occur in fall and winter with much smaller warming in summer months (Manabe and Stouffer, 1980). This is due to a surface heat gain in summer associated primarily with reduced albedos and increased solar heating that warms the ocean and melts sea ice but has a small effect on air temperatures. This heat is then released to the atmosphere during fall and winter, causing a large amplification at that time. More recent studies (e.g., Deser et al., 2010; Dai et al., 2019) confirm that the seasonality of Arctic warming is associated with sea ice loss and seasonal variations in the oceanic storage and release of energy. Further work (Boeke and Taylor, 2018) suggests that the efficiency with which this localized seasonal heat exchange is dispersed across the Arctic are important for explaining inter-model spread in Arctic warming.
Much of this past work has considered Arctic warming and/or amplification at a certain point in time or for a certain increase in CO2 concentrations. Here we focus on the transient nature of surface-based Arctic amplification in 20th-21st century climate projections. We address several questions: 1.) When does Arctic amplification emerge from the background noise of the climate system? 2.) How does the Arctic amplification evolve over the 21st century? 3.) How is this evolution related to sea ice conditions? and 4.) How robust are these properties across climate models? We address these questions using the multi-model large ensemble (Deser et al., 2020) which includes seven climate models that have performed a large ensemble of simulations subject to historical and future forcing. The use of large ensemble simulations allows us to address questions of emergence of the anthropogenic signal.
We use models from the multi-model large ensemble (MMLE; Deser et al., 2020) to assess the time of emergence and transient nature of Arctic amplification. The MMLE includes data from seven single model initial-condition large ensembles (SMILEs) (Table 1). Differences in the ensemble members within a SMILE arise from internal variability as simulated by a particular model. Differences across the SMILEs provide a measure of model structural uncertainty. Thus, we are able to assess the influence of both factors, albeit with relatively few models.
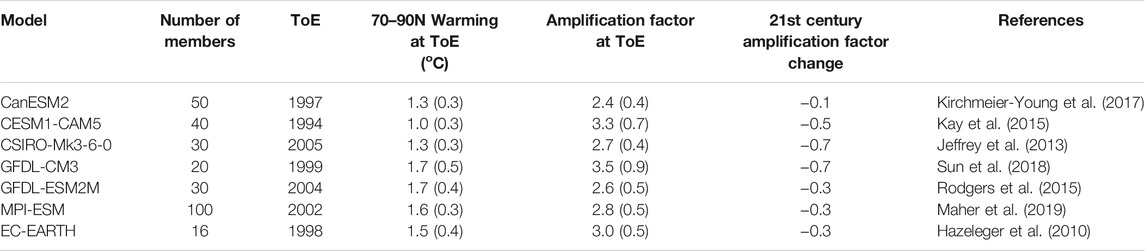
TABLE 1. Information on the SMILE simulations used in this study and their Arctic amplification. Properties are shown for annual ensemble mean values. Values in parenthesis indicate the standard deviation across ensemble members.
The SMILE simulations are run using CMIP5 historical forcing to 2005 and the RCP8.5 forcing scenario from 2006–2100 (Meinshausen et al., 2011). The minimum number of simulations from an individual model is 16 and the latest start year for the integrations is 1950. Because of this, we assess conditions over the 1950–2100 period for all of the SMILEs to enable intercomparison. Previous work has assessed the uncertainty in projected sea ice (Bonan et al., 2021) and the emergence of some metrics of Arctic climate conditions (Landrum and Holland, 2020) within these simulations. As noted by Bonan et al. (2021), these simulations are generally representative of the CMIP5 inter-model spread in Arctic sea ice and have considerably different representations of Arctic climate conditions. To further assess transient changes in amplification, we also analyze a single CESM1-CAM5 simulation that has been extended to 2300 (Meehl et al., 2013). This simulation is forced with an extension to the RCP8.5 scenario in which the CO2 level stabilizes in the mid-2200s. It reaches year-round ice-free conditions in the Arctic in the later part of the 22nd century.
As a metric of Arctic amplification, for each ensemble member, we define an amplification factor as the ratio of the running decadal mean 70–90N surface air temperature change relative to the running decadal mean global surface air temperature change. The change is computed relative to the 1950–1969 mean for each ensemble member within a SMILE (i.e., for a particular model) and for the CESM1-CAM5 extension simulation. We choose a 20-years base period here to reduce the effects of any potential decadal memory that is present for the simulations that are initialized in 1950 with a small initial perturbation error. 10-year running mean changes are used to allow us to assess how Arctic amplification evolves over time given the rapid decadal scale changes present in the Arctic.
To determine an Arctic amplification Time of Emergence (ToE), we quantify the time at which the decadal Arctic warming is larger than that of the global warming. In particular, for each SMILE model, we assess the year at which the decadal average centered on that year of the 70–90N surface air temperature change in all individual ensemble members is larger than the maximum ensemble member global mean decadal temperature change. This metric provides an estimate of when the anthropogenic signal of amplified Arctic warming emerges from the internal climate noise. By considering that the ensemble envelope of Arctic warming is outside the envelope of global change, it accounts for internal variability in both the Arctic and global temperature change. Note that this metric is sensitive to the choice of averaging length (which is chosen here to be decadal) and the choice that the Arctic warming is outside the range of global warming (instead of greater than a standard deviation metric or greater than the warming of an individual ensemble member for example). However, the choices made here are reasonable given the rapid change underway in the Arctic, the internal variability in both Arctic and global warming, and the fact that the real system only has a single climate realization. It also provides a reasonable means to compare across models.
We also compare the transient Arctic warming and amplification signal to various metrics of sea ice. For this analysis, we process the ice data following Landrum and Holland (2020) to obtain time series of Northern Hemisphere monthly ice area. The sea ice data was not available from the EC-EARTH model and so that model is excluded from any analysis involving sea ice.
We also assess the changing surface albedo feedback from the individual ensemble members of the various models using the radiative kernel method (e.g., Shell et al., 2008; Soden et al., 2008). This quantifies the surface albedo feedback as:
Where R is the net top of atmosphere (TOA) radiative flux,
To illustrate the general properties of Arctic temperature change, Arctic amplification and the differences across the models, we assess ensemble mean changes for 2050–2059 relative to the 1950–1969 base period. The decadal ensemble mean surface air temperature change at 2050 relative to 1950 is shown in Figure 1. All the models exhibit amplified warming in the Arctic. However, the magnitude of warming, both globally and regionally, and the location of maximum warming differ across the models. In some models (GFDL-CM3, CESM1-CAM5), the maximum warming is centered over the Arctic Ocean; whereas in others (CanESM2, GFDL-ESM2M, MPI-ESM, EC-EARTH) the maximum warming occurs in the Barents Sea. The maximum zonal mean temperature change (Figure 2A) also differs considerably across the models with a maximum high latitude warming of just over 4°C in GFDL-ESM2M and CSIRO-Mk3-6–0 and over 12°C in GFDL-CM3. Models with larger Arctic warming typically also have a larger amplification factor (Figure 2B) although there are some discrepancies which are related to the differences in global warming across the models. Across the models, the maximum zonal mean Arctic warming ranges from about 2 to 4 times the global average warming at 2050.
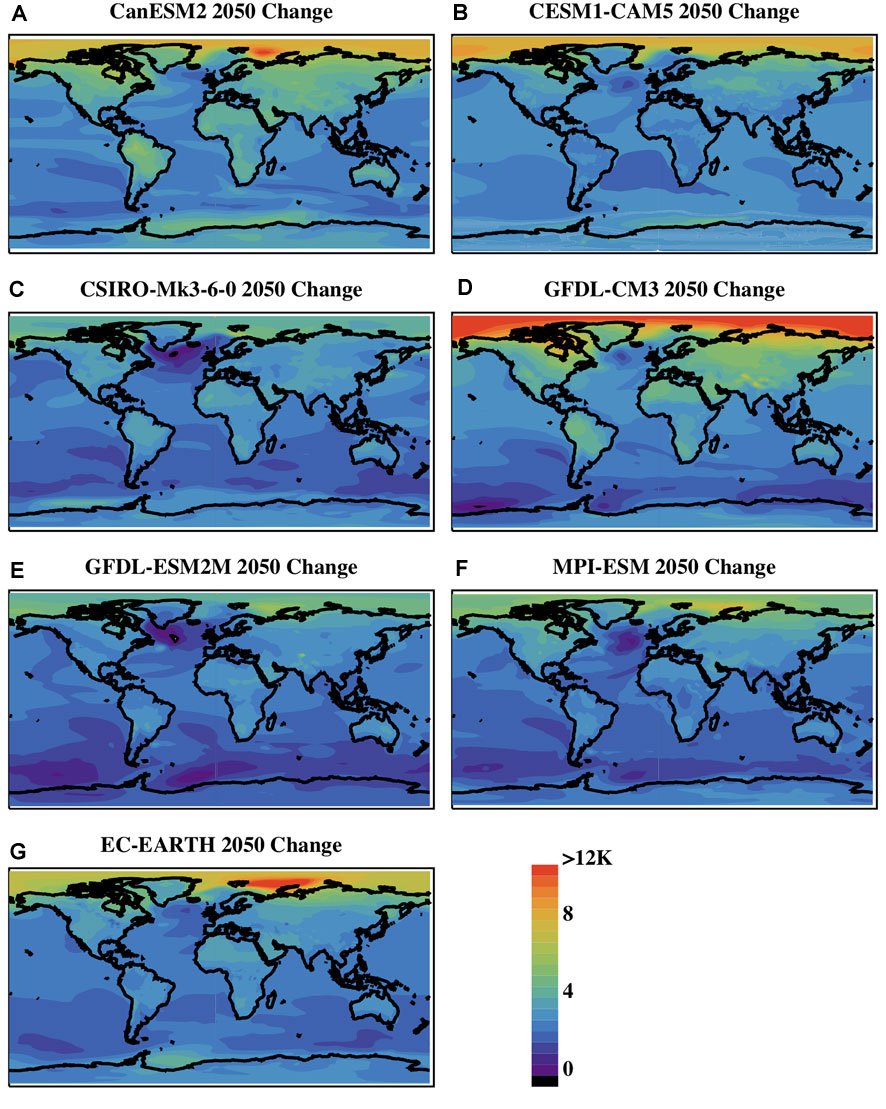
FIGURE 1. The annual ensemble mean surface air temperature change for the 2050s relative to the reference period for different SMILEs including (A) CanESM2, (B) CESM1-CAM5, (C) CSIRO-Mk-3-6-0, (D) GFDL-CM3, (E) GFDL-ESM2M, (F) MPI-ESM, and (G) EC-EARTH.
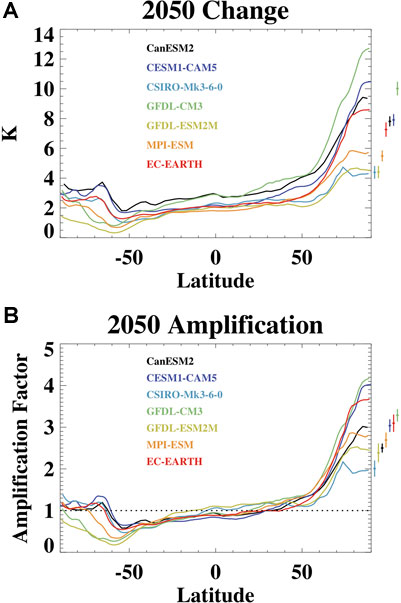
FIGURE 2. (A) The zonal mean change in surface air temperature for the 2050s relative to the reference period and (B) The amplification factor of that warming, defined as the zonal temperature change relative to the global mean change. The diamonds shown to the left indicate the ensemble mean 70–90N values for each model with the whiskers indicating one standard deviation.
The 2050 temperature change and temperature amplification have a distinct seasonal structure (Figure 3). All models exhibit reduced Arctic amplification during the summer months from June through August, which occurs as the surface ocean gains heat and there is limited coupling with the atmosphere. Indeed, for these months, several models simulate less warming in the Arctic than for the globe as a whole and so have an amplification factor less than one during these months (Figure 3H). Amplified Arctic warming is generally most apparent during the fall months as heat gained by the surface during summer is fluxed back to the atmosphere. The maximum amplification factor in 2050 typically occurs in November although this timing does vary somewhat across the models. The warming extends into the winter and an amplified Arctic warming (amplification factor greater than one) occurs for all but the summer (JJA) months in all models. These properties of the seasonality of the surface-based amplified warming agree with results from previous modeling studies (e.g., Manabe and Stouffer, 1980; Holland and Bitz, 2003; Deser et al., 2010; Dai et al., 2019) and are consistent with observed Arctic amplification (e.g., Serreze et al., 2009).
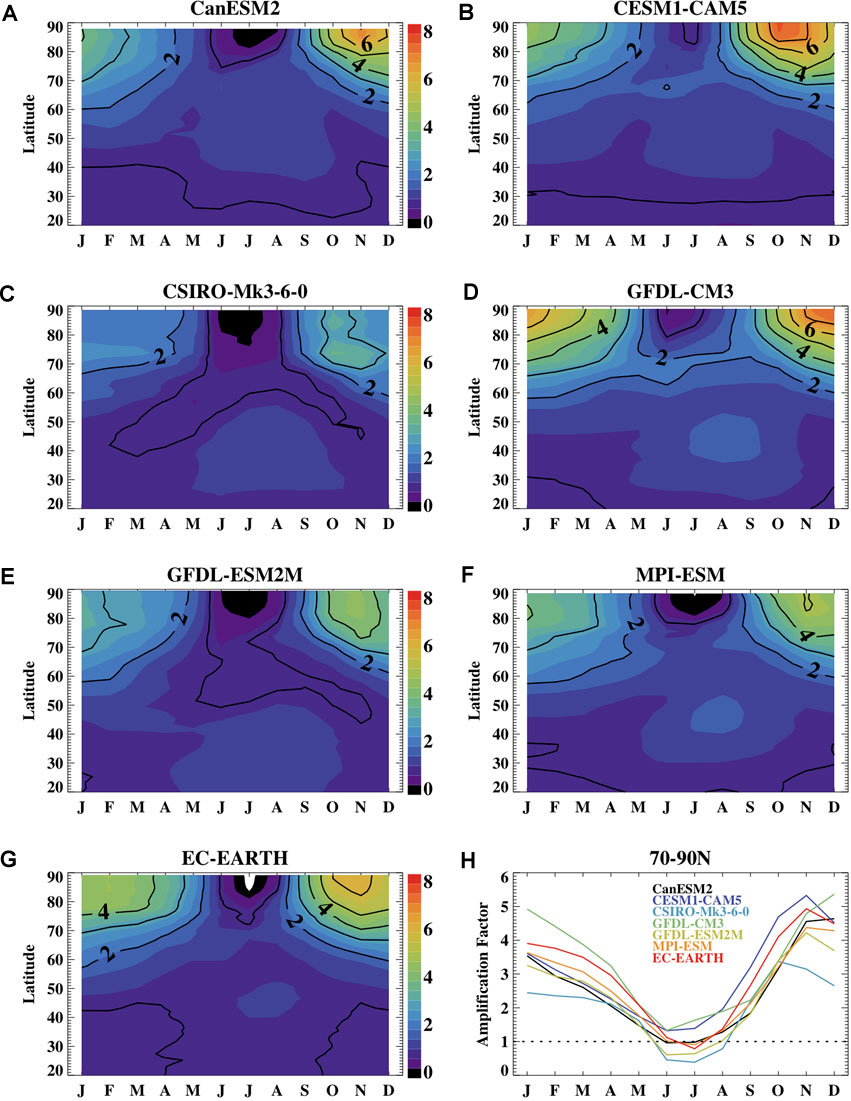
FIGURE 3. The zonal monthly ensemble mean amplification factor at 2050 as a function of month and latitude for the different models including (A) CanESM2, (B) CESM1-CAM5, (C) CSIRO-Mk-3-6-0, (D) GFDL-CM3, (E) GFDL-ESM2M, (F) MPI-ESM, and (G) EC-EARTH and (final panel) the 70–90N Amplification factor at 2050 as a function of month. The lined contour interval is one. The dotted line on the final panel shows a value of one for reference.
Many of these features of Arctic amplification have been documented in previous work. Large internal climate variability has also been noted for the Arctic. Because of this, the signal-to-noise ratio of surface air temperature change is small in the Arctic relative to other parts of the globe that have a modest change in temperature but also modest internal variability noise (e.g., Hawkins et al., 2020). Previous work indicates that an Arctic surface air temperature signal emerges from the noise in the first half of the 21st century, although it differs by season and by the metric used for emergence (Hawkins and Sutton, 2012). However, there is limited information on when the signal of amplified Arctic warming emerges from the background climate noise. Here we build on this previous work by assessing the emergence of Arctic amplification.
Figure 4 shows the timeseries of running decadal annual mean surface air temperature change for the 70–90N region and the globe. Based on our definition, the time of emergence of Arctic amplification occurs when the range of Arctic warming across the ensemble members is outside the envelope of the global mean warming. This timing differs across the models by approximately a decade, with the earliest emergence in 1994 in CESM1-CAM5 and the latest in 2005 in CSIRO-Mk3-6–0. The timing for the annual mean emergence is similar to that of a fall amplification emergence (not shown) because the annual mean warming is dominated by warming in the fall. At the ToE, the magnitude of the ensemble mean Arctic warming ranges from 1.0 to 1.7°C across the models and the 70–90N amplification factor varies from 2.4 to 3.5 (Table 1). From GISTEMP observations (GISTEMP Team, 2021), the observed 70–90N amplification factor for the 2000–2009 decadal average relative to the 1950–1969 base period is about 2.2 and it increases to 2.9 for the 2010–2019 average period, indicating large decadal variability in this property from the observations. The simulated values at ToE are generally consistent with the observations given the internal variability uncertainty. The GFDL based models, GFDL-CM3 and GFDL-ESM2M, are an interesting case study given that they are from the same model lineage and are quite close within the climate model “family tree” (Knutti et al., 2013), but differ considerably in their ToE amplification factor with a value of 3.5 in GFDL-CM3 and 2.6 in GFDL-ESM2M. These models also differ in their equilibrium climate sensitivity which is likely due to different atmospheric moist physics (Winton et al., 2013). Our results suggest that these (and possibly other) aspects of model uncertainty between GFDL-CM3 and GFDL-ESM2M also influence the magnitude of Arctic amplification.
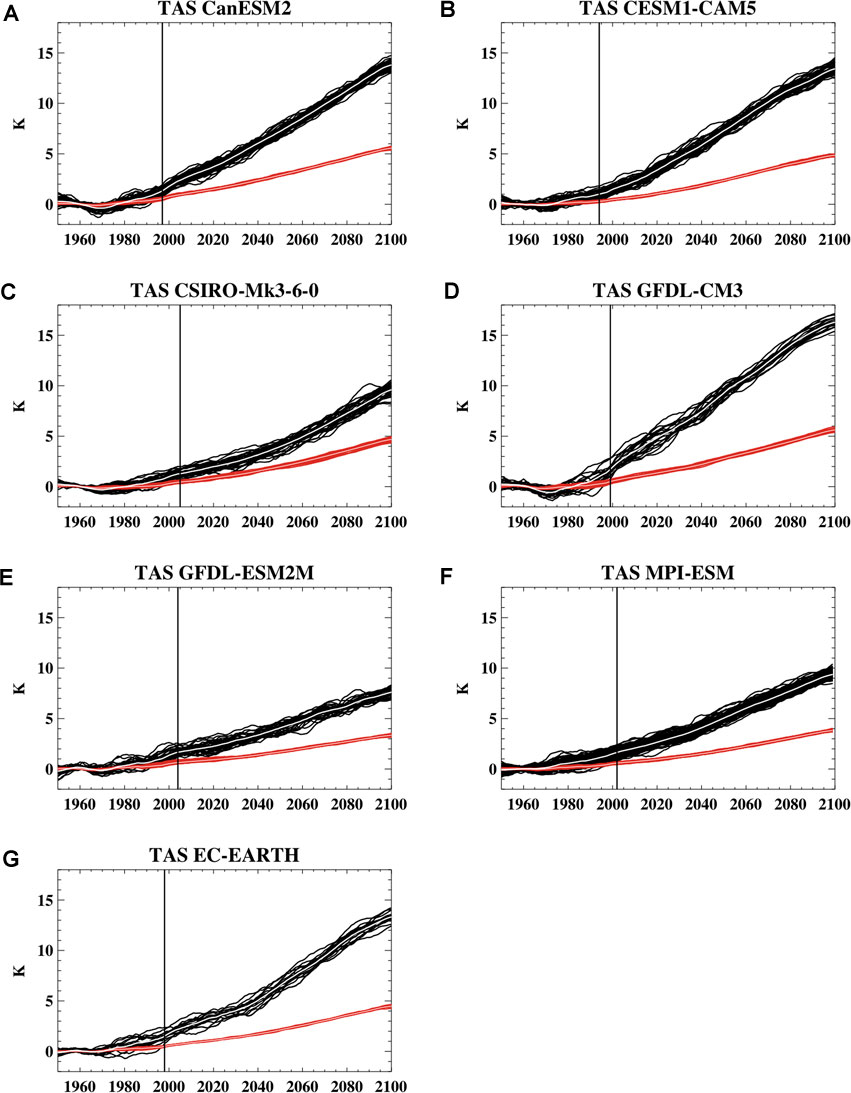
FIGURE 4. Timeseries of decadal running mean surface air temperature change relative to the reference period for the 70–90N average in black and the globe average in red for the different models including (A) CanESM2, (B) CESM1-CAM5, (C) CSIRO-Mk-3-6-0, (D) GFDL-CM3, (E) GFDL-ESM2M, (F) MPI-ESM, and (G) EC-EARTH. The ToE of an amplified Arctic warming signal is indicated by the vertical line.
Notably, even at the time of emergence, there is a large variation in the amplification factor across ensemble members that is often larger than the across-model spread in the ensemble mean amplification (Table 1). This indicates large uncertainty in this metric due to internal climate variability (Figure 5). The spread in amplification is primarily related to across-member spread in the decadal Arctic temperature change. This is consistent with previous work which has indicated large internal-variability uncertainty in decadal Arctic temperature variations (Hodson et al., 2013). The spread in the amplification factor across ensemble members within a SMILE at the time of emergence is correlated to the Northern Hemisphere annual mean sea ice area. Members with higher Arctic warming and consequently higher amplification typically exhibit lower sea ice. The correlation between the ensemble member values of ToE annual average ice area and their ToE amplification is similar for the different models at about R = −0.5, except in the two GFDL models where the relationship between ice area and amplification is weaker at R = −0.2 (for GFDL-CM3) and R = −0.3 (for GFDL-ESM2M).
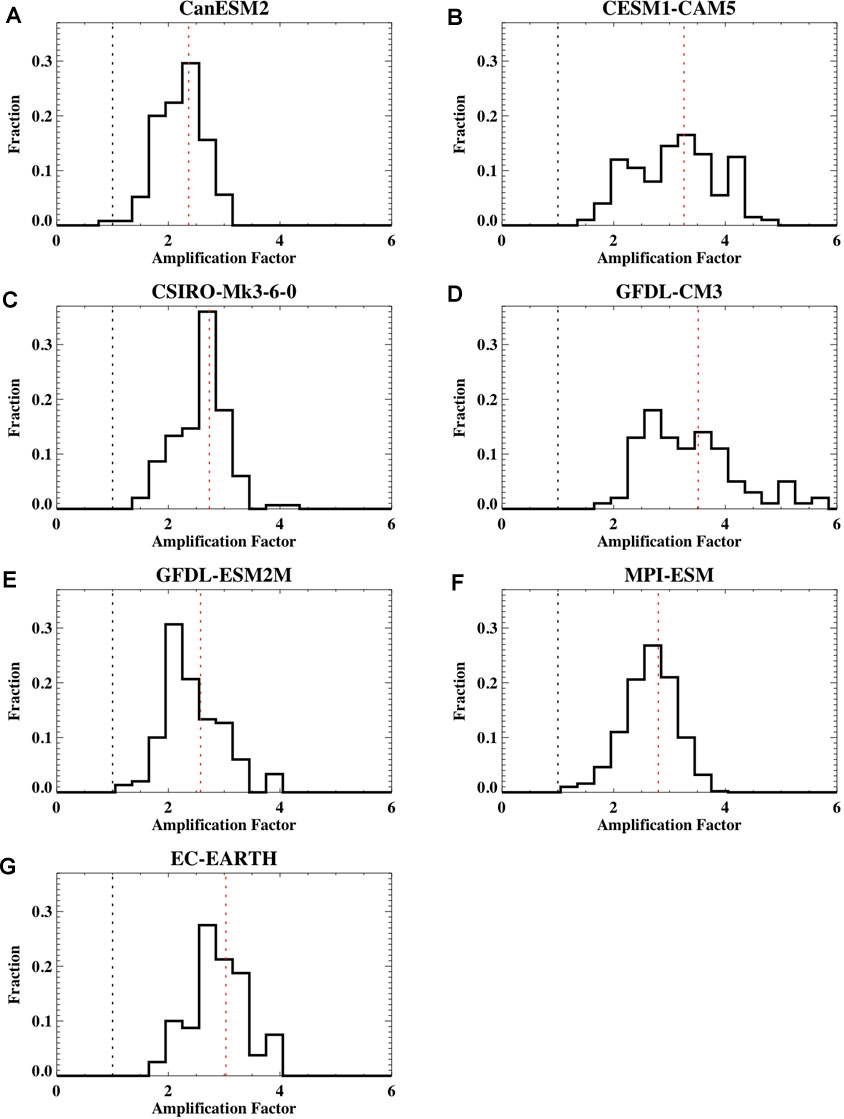
FIGURE 5. The histogram of the annual mean Arctic amplification factor at the ToE across the different ensemble members for each SMILE including (A) CanESM2, (B) CESM1-CAM5, (C) CSIRO-Mk-3-6-0, (D) GFDL-CM3, (E) GFDL-ESM2M, (F) MPI-ESM, and (G) EC-EARTH. A value of one (no amplification) is shown for reference in the black dotted line. The average amplification factor at the ToE is shown in the red dotted line.
Projected change in the amplification of annual mean Arctic warming over the 21st century is shown in Figure 6. The uncertainty associated with internal variability, as quantified by the spread across ensemble members, declines over the 21st century. This arises because the change in temperature since the mid-20th century for both the Arctic and the globe become large relative to the internal variability uncertainty in that change. It is an indication that as time progresses the ensemble members have a similar Arctic temperature change relative to the global change. Note that this does not necessarily represent a change in the internal variability of Arctic or global temperatures over the 21st century. Indeed, the within-model spread in the annual mean Arctic air temperature changes little over time and in most models, the spread in global temperatures also exhibits little change (not shown).
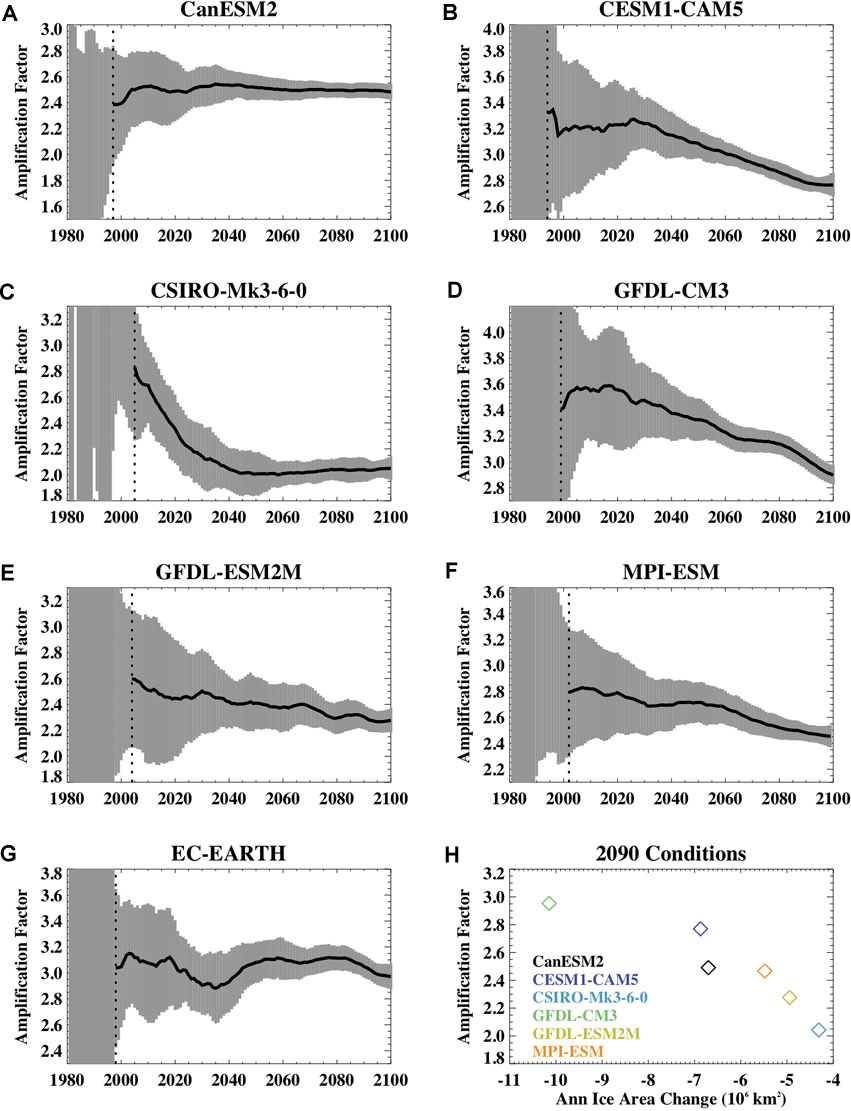
FIGURE 6. The 1980–2100 timeseries of the Arctic amplification factor for different SMILES computed from annual mean temperature including for (A) CanESM2, (B) CESM1-CAM5, (C) CSIRO-Mk-3-6-0, (D) GFDL-CM3, (E) GFDL-ESM2M, (F) MPI-ESM, and (G) EC-EARTH. The black line shows the ensemble mean amplification factor and the grey shading shows the standard deviation across the ensemble members. The dashed vertical line is the time of emergence. Note that the y-axis values are different across the different panels to better illustrate the changes within a model over time but all panels have the same y-axis range of 1.5. Panel (H) shows the average 2090s Amplification Factor as a function of the annual sea ice area loss across the models (except for EC-EARTH for which no sea ice data was available).
The annual ensemble mean amplification factor declines over the 21st century in the models (Table 1). This is largely related to a reduced amplification in the southern portion of the Arctic domain as is evident by the time series of the zonal mean amplification factor (Figure 7) when considering the values near 70N. We expect that this is associated with the location of sea ice loss which will contribute to a warming of the overlying atmosphere and which transitions northward over time. In some models, such as CanESM2 and EC-Earth, the change in 70N temperatures is relatively small and compensated in part by an increased warming amplification near the pole, leading to only a small reduction in the 70–90N amplification. Other models such as CESM1-CAM5 and GFDL-CM3, have a 21st century reduction in the amplification across the entire Arctic domain.
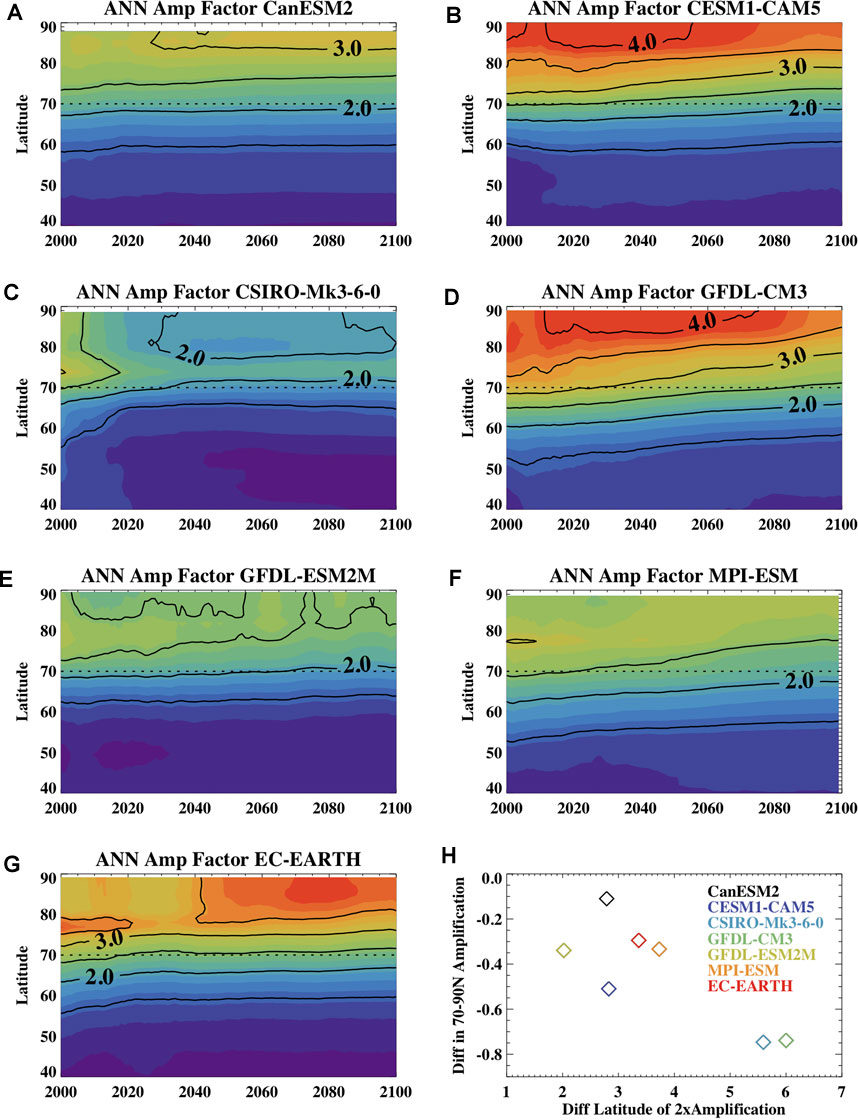
FIGURE 7. The ensemble mean annual mean amplification factor for the different SMILES over the 21st century as a function of year and latitude for (A) CanESM2, (B) CESM1-CAM5, (C) CSIRO-Mk-3-6-0, (D) GFDL-CM3, (E) GFDL-ESM2M, (F) MPI-ESM, and (G) EC-EARTH. The lined contour interval is 0.5. Panel (H) shows the 21st century change in the latitude at which doubled amplification occurs relative to the change in the 70–90N amplification factor for the ensemble means from different SMILES. The 21st century change is computed as the ensemble mean values in 2099 minus that in 2000.
Sea ice both responds to and affects Arctic surface warming. At the end of the 21st century, models with larger annual mean amplification (and typically larger Arctic warming) have larger annual mean sea ice loss (Figure 6H). Interestingly, there is no consistent relationship between the 21st century amplification and historical ice conditions, including 1950s sea ice area and volume (not shown). Within an individual model, the amplification factor declines over the 21st century with increasing ice loss. In response to global warming and as a consequence of snow and ice loss, the Arctic surface albedo declines over the 21st century. The magnitude of this decline is influenced by the amount of ice and snow loss, the simulated albedo of those surfaces which can differ considerably across models (e.g., Holland and Landrum, 2015), and the interaction of those changing albedos with the large annual cycle in solar radiation. It is possible that with continued warming, the albedo changes can saturate (for example, with complete sea ice loss in a particular month), and since the global temperature will continue to increase, the albedo feedback can weaken and thus contribute to a declining amplification. To assess this, we have computed the annual albedo feedback from decadal averages over the 21st century relative to the 1950–1969 base period for the models with available fields. Figure 8 shows the timeseries of feedback strength for the 70–90N region. For this region, three of the five models (CESM1-CAM5, CSIRO-Mk3-6-0, GFDL-ESM2M) show a declining feedback strength, CanESM2 has little change, and GFDL-CM3 shows an increase in strength. However, if we assess conditions for 60–90N (Figure 9), we find that all models have a declining feedback strength, except for CanESM2, which has little change. On the global scale, all models simulate a weakened albedo feedback by the end of the 21st century (not shown).
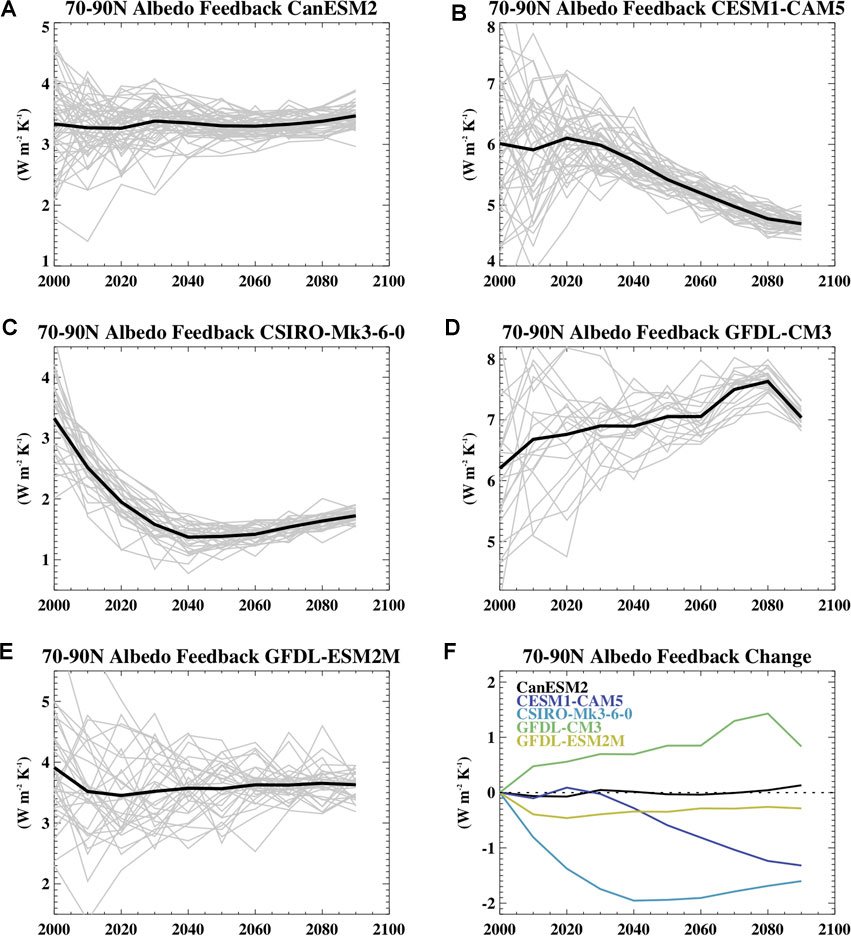
FIGURE 8. The 70–90N annual decadal mean surface albedo feedback in models that had shortwave terms available including for (A) CanESM2, (B) CESM1-CAM5, (C) CSIRO-Mk-3-6-0, (D) GFDL-CM3, and (E) GFDL-ESM2M. The final panel (F) shows the change in the ensemble mean albedo feedback over the 21st century computed as the ensemble mean values for the 2090–2099 average minus the 2000–2009 average to allow comparison across the models. For panels (A–E), individual ensemble members are shown in grey and the ensemble mean in black.
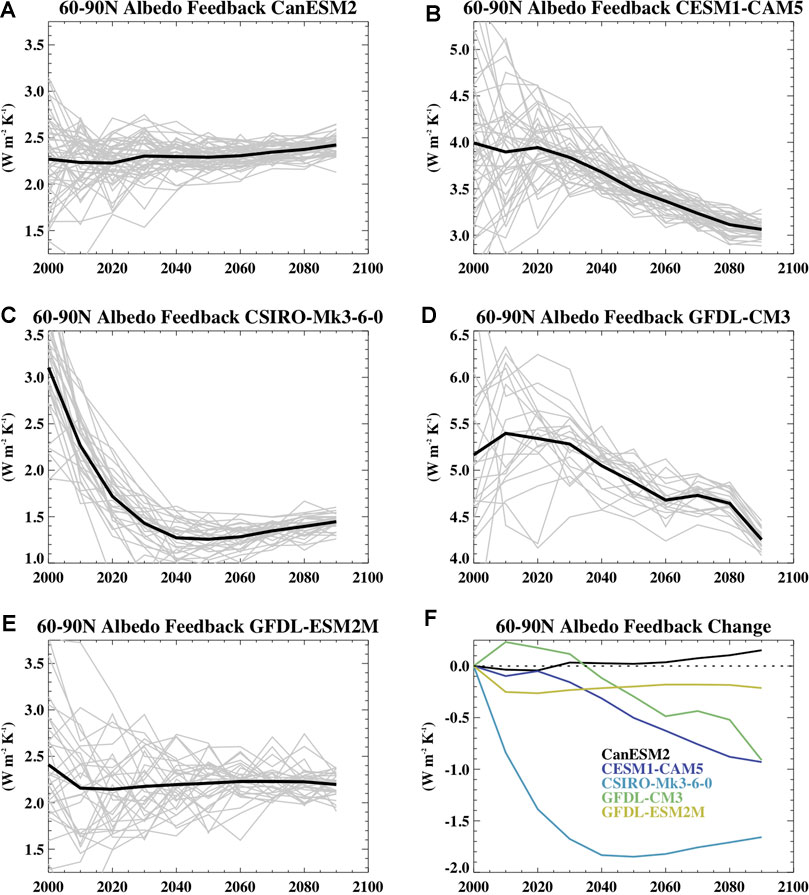
FIGURE 9. Same as Figure 8 but for the 60–90N average.
To better understand these disparate results, we assess the regional structure of the changing albedo feedback (Figure 10). This indicates that, in all models, there are ocean regions of reduced feedback strength, suggesting an albedo saturation. These are likely associated with regional sea ice loss that has largely maxed out in these areas for the sunlit time of year. In most models (except CSIRO-Mk3-6-0), there are also sizable ocean regions of increasing feedback strength often in the central Arctic where ice is still being lost during the spring and summer months. Interestingly, reductions in the Arctic ocean feedback strength in CSIRO-MK3-6-0 happen despite low sea ice loss (shown and discussed below in reference to Figure 11), suggesting a possible role for the snow on sea ice. Changing terrestrial snow also appears to be important in some models, leading to a weakened feedback indicative of an albedo saturation effect over land. This is most notable in GFDL-CM3 where the weakened feedback in high latitude terrestrial regions compensates for the strengthened feedback over the Arctic ocean and explains the discrepancy for the 60–90N versus 70–90N average feedback strength change in that model. Overall, the reduced high latitude feedback strength in most of the models will tend to reduce Arctic amplification but there is obviously considerable complexity in the interplay of regional changes in the ice and snow and the solar insolation annual cycle. Note that our results appear in conflict with Schneider et al. (2018) who found an increase in the global surface albedo feedback in the 21st century. However, there are differences in our analysis that we expect are responsible. Most notable are the use of large ensembles in this study and an analysis that computes decadal changes relative to the same base period of 1950–1969. In contrast, Schneider et al. (2018) computed the albedo feedback using temperature and albedo changes over 23 years periods at the beginning and end of the 21st century (rather than decadal mean changes from the 1950–1969 base period), used single simulations from multiple models, and focused on global rather than Arctic surface albedo feedbacks.
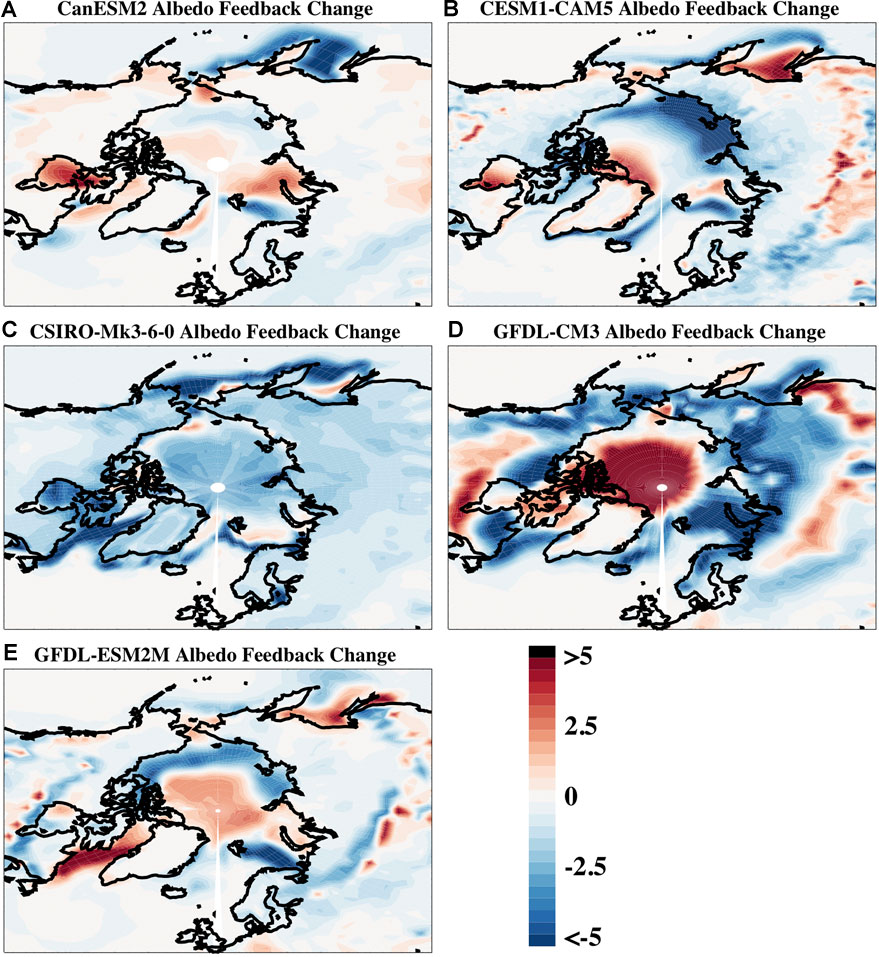
FIGURE 10. The changes in the ensemble mean surface albedo feedback for the 2090–2099 decadal average minus the 2000–2009 decadal average for the different models including (A) CanESM2, (B) CESM-CAM5, (C) CSIRO-Mk-3-6-0, (D) GFDL-CM3, and (E) GFDL-ESM2M. Values are shown in W m−2 K−1.
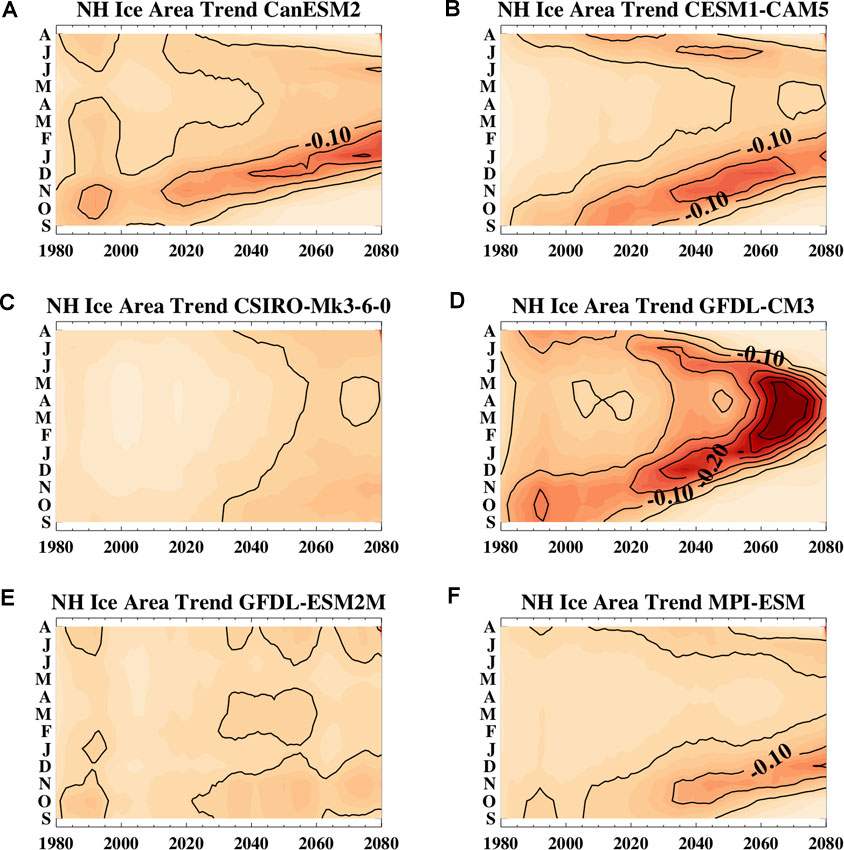
FIGURE 11. The 20-years running trend of Northern Hemisphere ensemble mean sea ice area for the different models as a function of month and year for (A) CanESM2, (B) CESM1-CAM5, (C) CSIRO-Mk-3-6-0, (D) GFDL-CM3, (E) GFDL-ESM2M, and (F) MPI-ESM. The lined contour interval is 0.05 million km2 per year. Note that as in Figure 12, the y-axis runs from September on bottom through August on top. Sea ice data was not available for EC-Earth and so that model is not shown.
With further and finally complete ice and snow loss in the sunlit season, we would expect that further reductions in the surface albedo would be negligible and that the albedo feedback would saturate across the northern high latitudes. This state is not yet reached in the SMILE climate simulations considered here. However, CESM-CAM5 runs extended to 2300 simulate complete Arctic ice loss (Meehl et al., 2013), and show that further Arctic albedo changes are minimal after about 2150 (Figure 12B), the albedo feedback weakens after 2150 (Figure 12C), and Arctic amplification declines from 2000–2300 (Figure 12A). Interestingly, this decline is not linear and the albedo feedback actually strengthens in the early part of the 22nd century (Figure 12C). There are indications that this is associated with the evolving seasonality of sea ice loss (Figure 12D). In these simulations, sea ice in July-September shows large declines in the 21st century and reaches an area less than one million km2 by 2100. However, an acceleration of May and June ice loss occurs around 2100 (Figure 12D). Because May and June are a time of high solar insolation, there is a consequent acceleration in the annual albedo reduction (Figure 12B). This contributes to a brief reversal in the declining albedo feedback and Arctic amplification. Thus, to understand the evolving amplification of Arctic warming, we must consider variations in the rate of ice and snow loss over both time and season. Notably, the strengths of other Arctic feedbacks are also likely to change in the warming climate and affect the transient amplification signal across the models. For example, the lapse rate feedback is also tightly tied to sea ice loss (e.g., Boeke et al., 2020; Feldl et al., 2020) suggesting that its strength will also be impacted by the changing rate of seasonal ice loss.
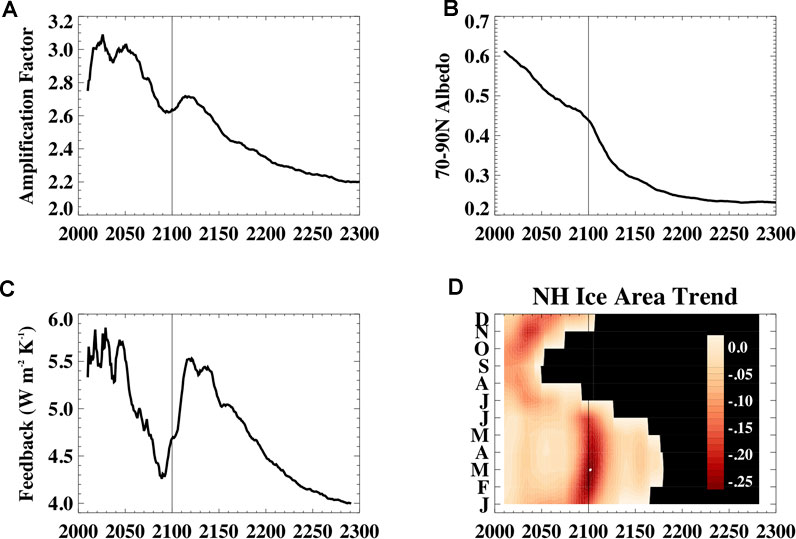
FIGURE 12. Results from CESM-CAM5 runs that are extended to 2300 using the RCP8.5 scenario including, (A) the annual mean Arctic amplification factor, (B) the annual mean 70–90N effective albedo, (C) the 70–90N surface albedo feedback, and (D) the running decadal trend in monthly sea ice area. Values in panel (a), (b), and (c) use 10-years running means. The annual mean effective albedo is computed as the annual surface upward solar radiation divided by the annual mean surface downward radiation and represents the fraction of solar radiation reflected from the surface on an annual basis. In panel (d), black regions indicate when the ice area is lower than one million km2 and trends are shown in units of million km2 per year.
Consistent with changes in seasonality of ice loss, the seasonality of Arctic warming also changes over the 21st century (Figure 13). Most models simulate that the maximum warming trends are initially largest in fall (October-November) but shift to winter (or even spring in the case of GFDL-CM3) over the 21st century. As noted, the changing seasonality of warming and how it differs across the models is related to their simulated ice loss rates (Figure 11). In the late 20th-early 21st centuries, the highest ice loss rates are in September and the surface heat gained over the melt season is then fluxed to the atmosphere resulting in maximum warming rates a month or so later. However, as ice-free conditions are reached in September, the maximum sea ice loss rates shift to later in the fall and winter. This indicates a longer melt season, a shift in when the surface loses its accumulated summer heat, and a later freeze up. In models with lower ice loss rates, such as CSIRO-Mk3.6 and GFDL-ESM2M, there is only a minimal seasonal shift in atmospheric warming in the 21st century.
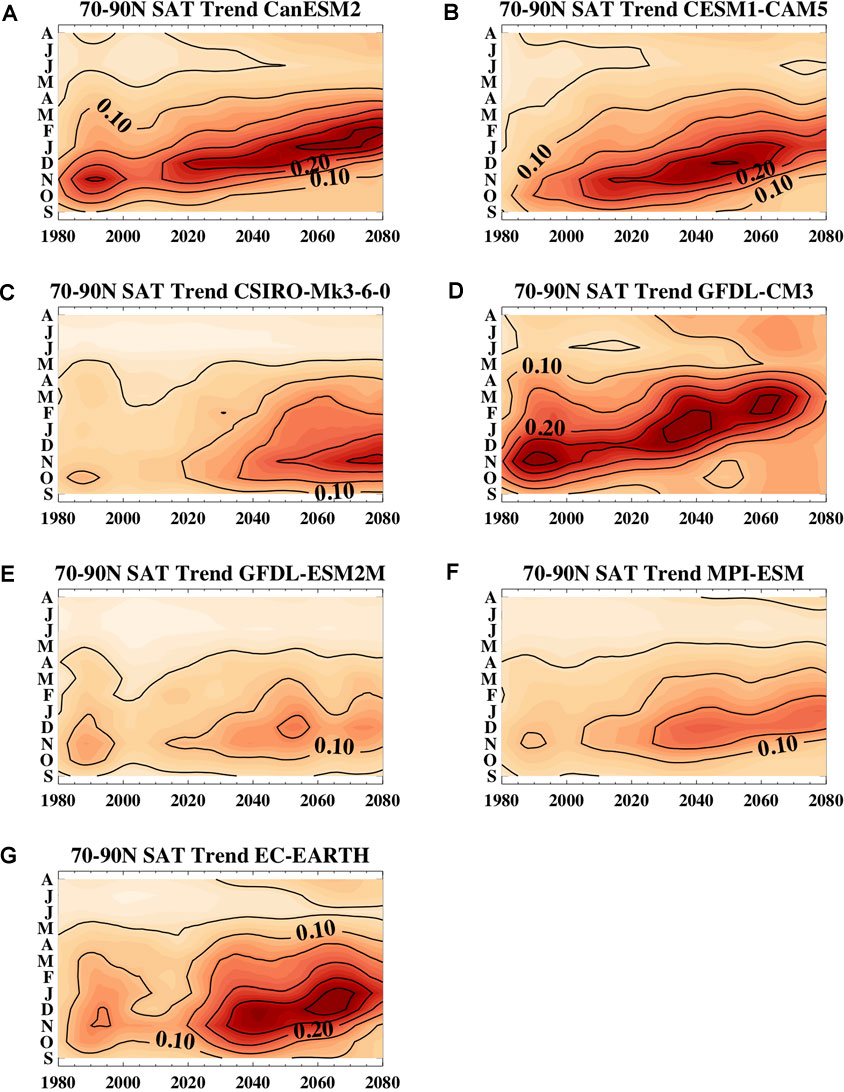
FIGURE 13. The running 20-years trend in the 70–90N ensemble mean surface air temperature as a function of month over the 21st century in the different SMILES including (A) CanESM2, (B) CESM1-CAM5, (C) CSIRO-Mk-3-6-0, (D) GFDL-CM3, (E) GFDL-ESM2M, (F) MPI-ESM, and (G) EC-EARTH. The lined contour interval is 0.05°C per year. Note that the y-axis runs from September on bottom through August on top to better highlight the changing seasonality of warming in the models.
Arctic amplification is a hallmark of the climate response to changing external forcing. It arises from multiple positive feedbacks that are related to the unique climate conditions of the Arctic (e.g., Pithan and Mauritsen, 2014). Among the most important of these are the surface albedo feedback, associated with the loss of high-albedo surfaces, and the positive lapse rate feedback, associated with variations in the vertical structure of temperature changes (e.g., Goosse et al., 2018). Both these feedbacks are strongly related to sea ice loss (e.g., Boeke et al., 2020; Feldl et al., 2020) and are both driven by and reinforce surface-based amplified warming in the Arctic. Notably, the positive Arctic feedbacks also lead to large internal variability in the region. Because these feedbacks are dependent on the climate state within the Arctic, it follows that their strength may vary with conditions such as the sea ice area and albedo.
Here we have considered the emergence and transient nature of amplified warming in the Arctic. We have used simulations from the multi-model large ensemble (Deser et al., 2020) which includes seven climate models that have performed initial-condition large ensembles that include the period from 1950–2100. The availability of large ensembles allows us to diagnose when amplified Arctic warming in response to rising greenhouse gases emerges from the internal variability of the climate system. Assessing this across multiple models provides information on the influence of model structural uncertainty on the characteristics of Arctic amplification.
We find that amplified Arctic warming emerges between 1994 and 2005 across all of the large ensembles and so the detection and timing of an anthropogenic signal in the amplified Arctic warming differs by about a decade across the models. The emergence of other characteristics of Arctic climate from these simulations is discussed in Landrum and Holland (2020). While an anthropogenically-driven Arctic amplification emerges near the transition of the 20th-21st centuries, the magnitude of that amplification remains quite uncertain at that time due to the influence of internal variability. It also varies considerably across the models, with the ensemble mean amplification factor ranging from 2.4 in CanESM2 to 3.5 in GFDL-CM3.
Over the course of the 21st century, the uncertainty in amplification magnitude that is associated with internal variability declines. However, the range in the amplification factor across the models remains similar, varying in 2,100 from a factor of 2.0 in CSIRO-Mk3-6-0 to 3.0 in EC-EARTH. This indicates that structural model uncertainty in the amplification magnitude remains high. In all models, the amplification factor declines over the 21st century, although in some (CanESM2 and EC-EARTH), the change is small. Analysis suggests that the 21st century reduction in Arctic amplification is associated in part with a declining surface albedo feedback strength. This is consistent with a possible “albedo saturation” effect in which the globe keeps warming as greenhouse gas concentrations rise, but ongoing reductions in surface albedo become limited due to complete sea ice or terrestrial snow loss during the sunlit season. However, in considering spatial maps of the 21st century albedo feedback change, we find that while this mechanism appears present in some high latitude locations in all the models with available data in the 21st centuries, other regions simulate a strengthening feedback as further ice (and snow) loss occur. Thus, for the 21st century, there are considerable complexities in the changing Arctic surface albedo feedback that are associated with spatial variations in the sea ice and terrestrial snow loss and the seasonality of that loss.
To assess how these factors play out with continued warming, we have also considered a CESM1-CAM5 simulation that has been extended to 2300 using RCP8.5 extension forcing (Meehl et al., 2013). This model reaches complete loss of the Arctic sea ice by the end of the 22nd century. We find that with total Arctic sea ice loss, the albedo reductions max out. This results in a saturation of the albedo feedback and further reductions in the amplification factor in the 22nd and 23rd centuries. However, reversals in the declining amplification occur in the early 22nd century when there is accelerated ice loss in May and June; a time of year with high solar insolation. This results in a temporary increase in the albedo feedback strength and Arctic amplification before complete ice loss occurs.
The characteristics of the transient nature of the amplification factor highlight the importance of seasonality in ice loss and albedo changes. Previous work (e.g., Manabe and Stouffer, 1980) has shown that amplified Arctic warming is a seasonal phenomenon and is highest in fall. We find that the seasonality of this signal transitions in the 21st century. In particular, the maximum rate of surface air temperature change transitions from the fall months in the early 21st century to winter or even spring by 2100. This transition and how it varies across the models is related to the seasonal timing of sea ice loss and the consequences that this has for the seasonality of increased air-sea heat exchange.
Taken together, our results show that while Arctic amplification is a defining characteristic of global warming, its magnitude and seasonality are likely to change with the changing climate. This has implications for comparisons across models and suggests that differences in models for a particular time period should consider that the amplification signal within a model may not be static over time. It also has implications for using paleoclimate records to constrain the magnitude of amplification in a future climate (e.g., Miller et al., 2010) given that the strength of feedbacks and consequent amplification are dependent on the particular features of a given climate state.
Publicly available datasets were analyzed in this study. This data can be found here: https://www.cesm.ucar.edu/projects/community-projects/MMLEA/
MH conceived of the study, performed much of the analysis, and wrote the article. LL contributed analysis of the sea ice data and to the writing of the article.
MH and LL acknowledge funding from the National Science Foundation under award OPP-1724748. MH’s contributions were also supported by the National Center for Atmospheric Research (NCAR), which is a major facility sponsored by the NSF under Cooperative Agreement 1852977.
The authors declare that the research was conducted in the absence of any commercial or financial relationships that could be construed as a potential conflict of interest.
All claims expressed in this article are solely those of the authors and do not necessarily represent those of their affiliated organizations, or those of the publisher, the editors and the reviewers. Any product that may be evaluated in this article, or claim that may be made by its manufacturer, is not guaranteed or endorsed by the publisher.
We acknowledge the US CLIVAR Working Group on Large Ensembles for organizing the Multi-model Large Ensemble project and making simulations available. We also acknowledge computing resources (doi:10.5065/D6RX99HX) provided by the Climate Simulation Laboratory at NCAR’s Computational and Information Systems Laboratory, sponsored by the National Science Foundation and other agencies. We thank all of the modelling groups listed in Table 1 for making their Large Ensemble simulations available. We thank Dirk Notz and an reviewer for helpful comments that led to improvements in the manuscript.
Boeke, R. C., and Taylor, P. C. (2018). Seasonal Energy Exchange in Sea Ice Retreat Regions Contributes to Differences in Projected Arctic Warming. Nat. Commun. 9, 5017. doi:10.1038/s41467-018-07061-9
Boeke, R. C., Taylor, P. C., and Sejas, S. A. (2021). On the Nature of the Arctic's Positive Lapse‐Rate Feedback. Geophys. Res. Lett. 48, e2020GL091109. doi:10.1029/2020GL091109
Bonan, D. B., Armour, K. C., Roe, G. H., Siler, N., and Feldl, N. (2018). Sources of Uncertainty in the Meridional Pattern of Climate Change. Geophys. Res. Lett. 45 (17), 9131–9140. doi:10.1029/2018GL079429
Bonan, D. B., Lehner, F., and Holland, M. M. (2021). Partitioning Uncertainty in Projections of Arctic Sea Ice. Environ. Res. Lett. 16 (4), 044002. doi:10.1088/1748-9326/ABE0EC
Cai, Z., You, Q., Wu, F., Chen, H. W., Chen, D., and Cohen, J. (2021). Arctic Warming Revealed by Multiple CMIP6 Models: Evaluation of Historical Simulations and Quantification of Future Projection Uncertainties. J. Clim. 1, 1–52. doi:10.1175/JCLI-D-20-0791.1
Dai, A., Luo, D., Song, M., and Liu, J. (2019). Arctic Amplification Is Caused by Sea-Ice Loss under Increasing CO2. Nat. Commun. 10, 121. doi:10.1038/s41467-018-07954-9
Deser, C., Lehner, F., Rodgers, K. B., Ault, T., Delworth, T. L., DiNezio, P. N., et al. (2020). Insights from Earth System Model Initial-Condition Large Ensembles and Future Prospects. Nat. Clim. Chang. 10, 277–286. doi:10.1038/s41558-020-0731-2
Deser, C., Tomas, R., Alexander, M., and Lawrence, D. (2010). The Seasonal Atmospheric Response to Projected Arctic Sea Ice Loss in the Late Twenty-First Century. J. Clim. 23, 333–351. doi:10.1175/2009JCLI3053.1
Feldl, N., Po-Chedley, S., Singh, H. K. A., Hay, S., and Kushner, P. J. (2020). Sea Ice and Atmospheric Circulation Shape the High-Latitude Lapse Rate Feedback. Npj Clim. Atmos. Sci. 3, 41. doi:10.1038/s41612-020-00146-7
GISTEMP Team (2021). GISS Surface Temperature Analysis (GISTEMP), Version 4. New York, NY: NASA Goddard Institute for Space Studies. Available at: https://data.giss.nasa.gov/gistemp (Accessed 01 01, 2021).
Goosse, H., Kay, J. E., Armour, K. C., Bodas-Salcedo, A., Chepfer, H., Docquier, D., et al. (2018). Quantifying Climate Feedbacks in Polar Regions. Nat. Commun. 9, 1919–2013. doi:10.1038/s41467-018-04173-0
Hawkins, E., Frame, D., Harrington, L., Joshi, M., King, A., Rojas, M., et al. (2020). Observed Emergence of the Climate Change Signal: From the Familiar to the Unknown. Geophys. Res. Lett. 47, e2019GL086259. doi:10.1029/2019GL086259
Hawkins, E., and Sutton, R. (2012). Time of Emergence of Climate Signals. Geophys. Res. Lett. 39, L01702. doi:10.1029/2011GL050087
Hazeleger, W., Severijns, C., Semmler, T., Ştefănescu, S., Yang, S., Wang, X., et al. (2010). EC-earth. Bull. Amer. Meteorol. Soc. 91, 1357–1364. doi:10.1175/2010bams2877.1
Hodson, D. L. R., Keeley, S. P. E., West, A., Ridley, J., Hawkins, E., and Hewitt, H. T. (2013). Identifying Uncertainties in Arctic Climate Change Projections. Clim. Dyn. 40, 2849–2865. doi:10.1007/s00382-012-1512-z
Holland, M. M., and Bitz, C. M. (2003). Polar Amplification of Climate Change in Coupled Models. Clim. Dyn. 21, 221–232. doi:10.1007/s00382-003-0332-6
Holland, M. M., and Landrum, L. (2015). Factors Affecting Projected Arctic Surface Shortwave Heating and Albedo Change in Coupled Climate Models. Phil. Trans. R. Soc. A. 373, 20140162. doi:10.1098/rsta.2014.0162
Hu, X., Fan, H., Cai, M., Sejas, S. A., Taylor, P., and Yang, S. (2020). A Less Cloudy Picture of the Inter-model Spread in Future Global Warming Projections. Nat. Commun. 11, 4472. doi:10.1038/s41467-020-18227-9
Jeffrey, S., Rotstayn, L., Collier, M., Dravitzki, S., Hamalainen, C., Moeseneder, C., et al. (2013). Australia's CMIP5 Submission Using the CSIRO-Mk3.6 Model. Aust. Meteorol. Oceanographic 63, 1–14. doi:10.22499/2.6301.001
Kay, J. E., Deser, C., Phillips, A., Mai, A., Hannay, C., Strand, G., et al. (2015). The Community Earth System Model (CESM) Large Ensemble Project: a Community Resource for Studying Climate Change in the Presence of Internal Climate Variability. Bull. Am. Meteorol. Soc. 96, 1333–1349. doi:10.1175/bams-d-13-00255.1
Kirchmeier-Young, M. C., Zwiers, F. W., and Gillett, N. P. (2017). Attribution of Extreme Events in Arctic Sea Ice Extent. J. Clim. 30, 553–571. doi:10.1175/jcli-d-16-0412.1
Knutti, R., Masson, D., and Gettelman, A. (2013). Climate Model Genealogy: Generation CMIP5 and How We Got There. Geophys. Res. Lett. 40, 1194–1199. doi:10.1002/grl.50256
Landrum, L., and Holland, M. M. (2020). Extremes Become Routine in an Emerging New Arctic. Nat. Clim. Chang. 10, 1108–1115. doi:10.1038/s41558-020-0892-z
Maher, N., Milinski, S., Suarez‐Gutierrez, L., Botzet, M., Dobrynin, M., Kornblueh, L., et al. (2019). The Max Planck Institute Grand Ensemble: Enabling the Exploration of Climate System Variability. J. Adv. Model. Earth Syst. 11, 2050–2069. doi:10.1029/2019ms001639
Mahlstein, I., and Knutti, R. (2011). Ocean Heat Transport as a Cause for Model Uncertainty in Projected Arctic Warming. J. Clim. 24, 1451–1460. doi:10.1175/2010JCLI3713.1
Manabe, S., and Stouffer, R. J. (1980). Sensitivity of a Global Climate Model to an Increase of CO2concentration in the Atmosphere. J. Geophys. Res. 85, 5529–5554. doi:10.1029/jc085ic10p05529
Meehl, G. A., Washington, W. M., Arblaster, J. M., Hu, A., Teng, H., Kay, J. E., et al. (2013). Climate Change Projections in CESM1(CAM5) Compared to CCSM4. J. Clim. 26 (17), 6287–6308. doi:10.1175/jcli-d-12-00572.1
Meinshausen, M., Smith, S. J., Calvin, K., Daniel, J. S., Kainuma, M. L. T., Lamarque, J.-F., et al. (2011). The RCP Greenhouse Gas Concentrations and Their Extensions from 1765 to 2300. Climatic Change 109, 213–241. doi:10.1007/s10584-011-0156-z
Miller, G. H., Alley, R. B., Brigham-Grette, J., Fitzpatrick, J. J., Polyak, L., Serreze, M. C., et al. (2010). Arctic Amplification: Can the Past Constrain the Future? Quat. Sci. Rev. 29 (15–16), 1779–1790. doi:10.1016/j.quascirev.2010.02.008
Pendergrass, A. G., Conley, A., and Vitt, F. M. (2018). Surface and Top-Of-Atmosphere Radiative Feedback Kernels for CESM-CAM5. Earth Syst. Sci. Data 10, 317–324. doi:10.5194/essd-10-317-2018
Pithan, F., and Mauritsen, T. (2014). Arctic Amplification Dominated by Temperature Feedbacks in Contemporary Climate Models. Nat. Geosci 7, 181–184. doi:10.1038/ngeo2071
Rodgers, K. B., Lin, J., and Frölicher, T. L. (2015). Emergence of Multiple Ocean Ecosystem Drivers in a Large Ensemble Suite with an Earth System Model. Biogeosciences 12, 3301–3320. doi:10.5194/bg-12-3301-2015
Schneider, A., Flanner, M., and Perket, J. (2018). Multidecadal Variability in Surface Albedo Feedback across CMIP5 Models. Geophys. Res. Lett. 45, 1972–1980. doi:10.1002/2017GL076293
Screen, J. A., and Simmonds, I. (2010). The central Role of Diminishing Sea Ice in Recent Arctic Temperature Amplification. Nature 464, 1334–1337. doi:10.1038/nature09051
Serreze, M. C., Barrett, A. P., Stroeve, J. C., Kindig, D. N., and Holland, M. M. (2009). The Emergence of Surface-Based Arctic Amplification. The Cryosphere 3, 11–19. doi:10.5194/tc-3-11-2009
Shell, K. M., Kiehl, J. T., and Shields, C. A. (2008). Using the Radiative Kernel Technique to Calculate Climate Feedbacks in NCAR’s Community Atmospheric Model. J. Clim. 21, 2269–2282. doi:10.1175/2007JCLI2044.1
Soden, B. J., Held, I. M., Colman, R., Shell, K. M., Kiehl, J. T., and Shields, C. A. (2008). Quantifying Climate Feedbacks using Radiative Kernels. J. Clim. 21, 3504–3520. doi:10.1175/2007JCLI2110.1
Stuecker, M. F., Bitz, C. M., Armour, K. C., Proistosescu, C., Kang, S. M., Xie, S.-P., et al. (2018). Polar Amplification Dominated by Local Forcing and Feedbacks. Nat. Clim. Change 8, 1076–1081. doi:10.1038/s41558-018-0339-y
Sun, L., Alexander, M., and Deser, C. (2018). Evolution of the Global Coupled Climate Response to Arctic Sea Ice Loss during 1990-2090 and its Contribution to Climate Change. J. Clim. 31, 7823–7843. doi:10.1175/jcli-d-18-0134.1
Keywords: arctic amplification, climate change, sea ice, climate modelling, time of emergence (TOE)
Citation: Holland MM and Landrum L (2021) The Emergence and Transient Nature of Arctic Amplification in Coupled Climate Models. Front. Earth Sci. 9:719024. doi: 10.3389/feart.2021.719024
Received: 01 June 2021; Accepted: 17 August 2021;
Published: 01 September 2021.
Edited by:
Patrick Charles Taylor, National Aeronautics and Space Administration, United StatesReviewed by:
Chad Thackeray, University of California, Los Angeles, United StatesCopyright © 2021 Holland and Landrum. This is an open-access article distributed under the terms of the Creative Commons Attribution License (CC BY). The use, distribution or reproduction in other forums is permitted, provided the original author(s) and the copyright owner(s) are credited and that the original publication in this journal is cited, in accordance with accepted academic practice. No use, distribution or reproduction is permitted which does not comply with these terms.
*Correspondence: Marika M. Holland, bWhvbGxhbmRAdWNhci5lZHU=
Disclaimer: All claims expressed in this article are solely those of the authors and do not necessarily represent those of their affiliated organizations, or those of the publisher, the editors and the reviewers. Any product that may be evaluated in this article or claim that may be made by its manufacturer is not guaranteed or endorsed by the publisher.
Research integrity at Frontiers
Learn more about the work of our research integrity team to safeguard the quality of each article we publish.