 Dajun Zhao
 Lianshou Chen1*
- 1State Key Laboratory of Severe Weather, Chinese Academy of Meteorological Sciences, Beijing, China
- 2University of Chinese Academy of Sciences, Beijing, China
Extreme rainfall induced by landfalling tropical cyclones (ERLTCs) in China can cause flash floods and other disastrous impacts, so investigating their genesis and mechanism of enhancement has been attracting considerable attention. This study demonstrates that the extreme rainfall of landfalling tropical cyclones (LTCs) possesses two key properties—namely, maintenance of the LTC circulation and a lagging (slowing down or looping) of its movement, and the monsoon surge can provide a positive contribution to these properties. Specifically, diagnostics show that the low-level cyclonic vorticity and upper-level divergence of ERLTCs are significantly stronger than those of NERLTCs (non-extreme-rainfall-producing LTCs). The continuous intensification of the cyclonic rotation in the lower troposphere before the occurrence of extreme rainfall is a significant feature that distinguishes ERLTCs from NERLTCs. Vorticity budget analysis further shows that the relative vorticity advection term contributes the most to the local increase and maintenance of vorticity in the middle and lower troposphere of ERLTCs under the influence of the southwest monsoonal surge, thus demonstrating that the monsoonal surge favors the maintenance of LTC circulation. On the other hand, the activity of the southwest monsoonal surge is mainly manifested in the zonal wind anomaly, and the corresponding strong westerly transport can significantly reduce the zonal component of the steering flow. As a result, the total steering flow can be weakened, which decreases the northwestward translation speed of ERLTCs, and thus the monsoonal surge favors a lagging (slowing down or looping) of LTC movement. These results reveal the mechanism of influence through which the monsoonal surge affects ERLTCs via its direct impacts on the maintenance of their circulation and lagging of their movement—two distinct evolutionary characteristics.
Introduction
Among all the countries in the world, China experiences the largest numbers of landfalling tropical cyclones (TC). As such, its coastal provinces, including districts and cities, and relevant inland areas of the country often suffer from the effects of TC-related disasters (Duan et al., 2019). The range of influence and losses caused by secondary disasters after a TC makes landfall, such as flash flooding and debris flow, are often larger than those of the TC rainfall in its inner-core region (Duan et al., 2014). Statistics have shown that TCs in China cause direct economic losses of about 0.4% of GDP and more than 9,000 casualties each year (Lei, 2020). Therefore, it is of great significance for disaster prevention in China to improve the forecasting skill for TCs and provide timely warnings of their arrival. China is heavily influenced by the East Asian summer monsoon in terms of the transportation of water vapor and rainfall—especially the eastern part of the country, where the monsoon and TCs have more opportunities to interact with each other (Chen and Xu, 2017). The interaction between TCs and monsoon circulation has a considerable influence on their precipitation. For instance, when the remnant vortex of a TC combines with the southwest monsoonal surge from the South China Sea to the mainland, the remnant vortex can acquire a large amount of water vapor and latent heat, enabling it to sustain over land for a long time and produce heavy rainstorms (Cheng et al., 2012). A famous example was the strong tropical storm Bilis (0604), which, after making landfall, maintained a long period of connection with the southwest monsoon flow, leading to continuous torrential rainfall in many provinces in Southeast China (Gao et al., 2009; Dong et al., 2010; Lu et al., 2012).
The intensity and frequency of extreme precipitation in China have shown increasing trends under global warming, especially since the 1990s (Xia et al., 2019), and extreme precipitation has become a hot topic in scientific research internationally (Gu and Zhang, 2020). As the strongest type of precipitation-related weather system, TCs often bring extreme precipitation, leading to serious secondary disasters. For example, the 24-h rainfall amount reached 1,062 mm after TC Nina (7503) made landfall, breaking the existing record of maximum daily rainfall over the mainland China held by the famous “75•8” extremely severe rainfall in Henan Province (Ding et al., 1978). Another very famous example is TC Morakot (0908), which landed in Taiwan Province and Fujian Province successively, and the associated extreme rainfall caused 673 deaths and 26 missing persons in Taiwan, and affected 14.3 million people on the mainland China. The direct economic losses reached 12.7 billion yuan (Chen et al., 2012). Recently, TC Lekima (1909) landed in Zhejiang Province of China with a double-eyewall structure (Dai et al., 2021), heavy rainfall, and a wide range of impact. It produced rainfall amounting to 488.1 mm over Shanghe, exceeding the maximum precipitation record produced by landfalling TCs (LTCs) since 1960 in Shandong Province (Jia et al., 2020). Therefore, research on the rainstorms of LTCs has always been of critical importance for TC research in China, and a wide range of results have been obtained from different perspectives (Ding, 2015; Chen and Xu, 2017; Ren and Yang, 2019; Lei, 2020).
Chen (1977), Chen and Xu (2017) analyzed the most extreme rainstorm processes of TCs throughout the history of China in which the 24-h accumulated rainfall exceeded 1,000 mm, and found that their maintenance and stagnation were the two most important conditions for the occurrence of extreme rainstorms. The extreme precipitation of TCs is associated mainly with the convective rain caused by the interaction of TC circulation and other weather systems (Bao et al., 2020). Cheng et al. (2012) carried out a systematic study on the torrential rainfall associated with LTCs and revealed that the southwest monsoon transported the water vapor and unstable energy to TC Bilis (2006) via the low-level jet stream, which was highly beneficial to its maintenance and severe torrential rainfall. Dong et al. (2010) pointed out that the interaction between the southwest monsoonal surge and LTCs can sustain the low-level jet in the lower troposphere and intensify the shear line convergence, leading to rainfall reinforcement. China is located in a typical monsoon climate region. On the synoptic scale, the summer monsoon is characterized by the low-level jet streams carrying large quantities of water vapor and unstable energy. The process of severe torrential rainfall is closely related to the low-level jet (Cheng et al., 2012). Lu et al. (2012) compared the mechanisms of how the low-latitude monsoonal surge affected the intensification of the torrential rainfall of LTCs Durian (0103) and Bilis (0604). They pointed out that the low-latitude monsoonal surges, represented by different low-frequency oscillation cycles, moved significantly northwards. When the low-frequency oscillation was in an extremely active phase, the monsoonal surge peaked and invaded the circulation, corresponding to the intensification of the TC rainstorms. Zhou and Wu (2019) compared the difference in rainfall area and intensity among westward LTCs against the background of strong and weak summer monsoons. The results showed that a strong summer monsoon tends to correspond to westward LTCs featuring heavy rainfall and is conducive to the maintenance of the warm-core structure of a TC after it has made landfall. Therefore, a strong summer monsoon enables the maintenance of TC circulation and the intensification of its associated rainfall. The above studies have laid the foundation for us to further understand TC-related torrential rainfall, as well as provide multiple research perspectives for us to further investigate the extreme rainfall of LTCs. However, the very recent study by Yu et al. (2020) showed that, when the precipitation of a LTC meets the criteria of extremely severe rainfall (≥250 mm/24 h), the ETS (equitable threat score) of the 24-h rainfall forecast can be as low as < 0.1, indicating that operational forecasting remains difficult. Therefore, it is necessary to carry out research on the extreme rainfall of LTCs (including offshore-affecting TCs) over China.
In the first part (Zhao et al., 2021) of this series of studies, we focused on the water vapor budget analysis of the ERLTC under the influence of monsoon surges, and preliminarily exploring impact of the zonal component of monsoonal surges on the slower translational speed of ERLTCs on the rainfall occurrence day. We further proposed a new dynamic monsoon surge index (DMSI) to characterize the intensity of monsoon surge quantitatively. Results showed that the monsoonal surges could enhance the convergence of horizontal wind and water vapor fluxes by strengthening the water vapor input at the western and southern boundaries of ERLTCs. Besides, the zonal component of monsoonal surges could also weaken the background zonal steering flow and decelerate the translation of ERLTCs. The present study is a further extension of Zhao et al. (2021). It attempts to comprehensively summarize the distinct evolution characteristics of ERLTCs (NERLTCs) during the whole rainfall process (3 days ago to the occurrence of rainfall) and investigate the mechanisms of monsoon surges for these evolution characteristics of the LTCs. In particular, the relative importance of zonal and meridional components of the monsoon surges and their influences on the steering flow will be examined in some detail. These investigations will further enrich our understanding of the role of monsoon surges impact on ERLTCs.
The rest of this paper is arranged as follows: Data and methods introduces the data and methods. Evolutionary characteristics of ERLTCs in terms of maintenance and lagging presents the characteristics of the circulation and translational-speed evolution of ERLTCs and NERLTCs). Mechanisms through which the monsoonal surge influences the maintenance and lagging of ERLTCs analyzes the mechanisms of influence of the monsoonal surge on the maintenance of ERLTCs (NERLTCs) circulation and the lagging (slowing down or looping) of its movement from the perspectives of the vorticity budget and environmental steering flow, respectively. Further presented in this section is a conceptual physical model of how the monsoonal surge influences ERLTCs, based on the present findings. Finally, conclusions and some further discussion around future work are provided in Conclusions and future work.
Data and Methods
Data
The six-hourly reanalysis dataset with a spatial resolution of 2.5° latitude × 2.5° longitude from the NCEP–NCAR (National Centers for Environmental Prediction–National Center for Atmospheric Research) and the TC best-track database developed by the Shanghai Typhoon Institute of the China Meteorological Administration (Ying et al., 2014; Lu et al., 2021) are employed in this study. The cloud-top brightness temperature (TBB, also named black body temperature) datasets obtained from the infrared channel of the FY-2 satellite are used. In addition, TC-induced precipitation data obtained by OSAT (the objective synoptic analysis technique) are also used (Ren et al., 2007), which cover 1888 stations affected by TC precipitation over China, including 21 stations in Taiwan. The composite analysis methods adopted in this work are introduced in detail in Zhao et al. (2021). Figures 1A,B show the entire tracks of ERLTC and NERLTC cases in the composite analyses. It can be seen that these TCs generated in the Northwest Pacific, landfalling in or affecting Taiwan Province and the mainland China following the northwestward track.
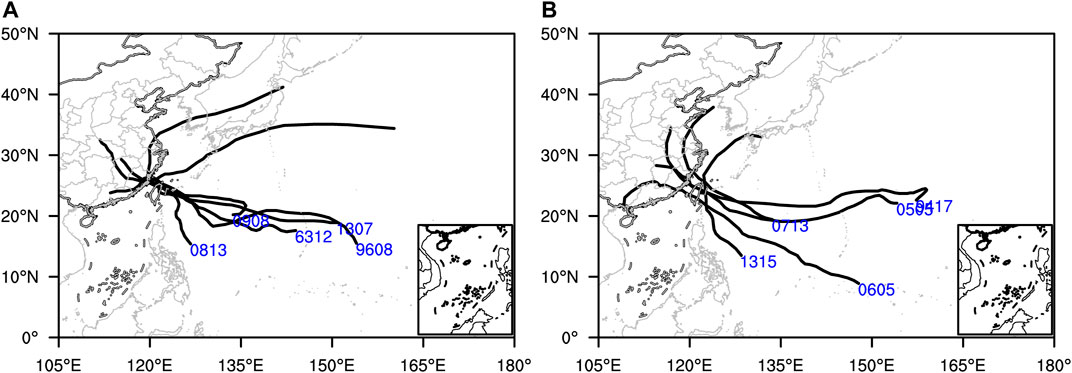
FIGURE 1. Tracks (black thick solid lines) of the selected (A) ERLTC and (B) NERLTC typhoon cases. The blue numbers represent the serial number (the year and the numbering of the TC in that year—for example, 0813 means the year 2008 and the 13th TC in 2008) of each TC.
Methods
Following Chen and Xu (2017), an absolute threshold method is used to define the ERLTCs, except the number of ERLTC samples and the representativeness of the ERLTCs are further taken into consideration. Thus, 24-h accumulated rainfall ≥600 mm at a single rain gauge station over China is defined as an ERLTC event; otherwise, it is an NERLTC event under the influence of an LTC. The evolution of the vertical component of the vorticity is often used to characterize the intensity and structural evolution of a weather system. The vertical vorticity equation in the p-coordinate system is as follows (Yang et al., 1983):
where
is the advection variation term of the relative vorticity, which is caused by the uneven horizontal distribution of the relative vorticity;
is the convective variation term of the relative vorticity, which is caused by the uneven vertical distribution of relative vorticity; −βv is the advection term of the geostrophic vorticity, which represents the variability of the relative vorticity induced by the different geostrophic vorticities during the north–south movement of the air parcel;
is the horizontal divergence or convergence term, indicating that the horizontal divergence will reduce the absolute vorticity;
is the tilting term, which represents the conversion of the horizontal vorticity to the vertical vorticity. In this study, the vertical vorticity equation in the p-coordinate system is used to further diagnose the physical processes that determine the maintenance of ERLTC (NERLTC) circulation under the influencing of the monsoonal surge, which has been widely used in previous diagnostic studies on TC structure and intensity evolution (Li et al., 2019; Rantanen et al., 2020).
The whole-layer steering airflow of the TC environmental field is calculated based on the mass-weighted average scheme recommended by the World Meteorological Organization (Kimberlain and Breman, 2017). This scheme can be calculated approximately based on several typical pressure layers, which is simplified as follows:
Here, Sx and Sy represent the zonal and meridional steering flows of the whole layer, respectively. Hereafter, U850 (V850), U500 (V500) and U200 (V200) on the right-hand side of Eqs 2, 3 describe the zonal (meridional) wind at the lower (850 hPa), middle (500 hPa) and upper (200 hPa) levels of the troposphere. The deep layer mean (DLM) of the environmental steering flow of a TC is
Figure 2 shows the infrared cloud images on the day before the extreme or non-extreme rainfall of ERLTC (Figures 2A–C) and NERLTC (Figures 2D–F) cases. Figures 2A–C show that the convection to the southwest of the ERLTC is strong. At the same time, there are significant cloud-band activities in the environmental field to the southwest of the TC, which can be seen in the area to the southwest of the TCs in the figure. It is difficult to strictly distinguish the ERLTC from the southwest monsoonal surge in the cloud image, and there is a clear connection between the two cloud bands. In comparison, the cloud-band activity in the environmental field to the southwest of the NERLTC (Figures 2D–F) is much weaker. In particular, there is a clearer boundary between this band and the cloud band to the southwest of the TC, and there is even a clear-sky area. Thus, the satellite cloud image can qualitatively reflect the interaction between the monsoonal surge and the typhoon. Further quantitative analyses of the contribution of monsoonal surges to the ERLTC based on meteorological data are carried out in the following analysis. A schematic diagram of the regional average calculation ranges of 5°, 10°, and 15° are shown in Figure 3.
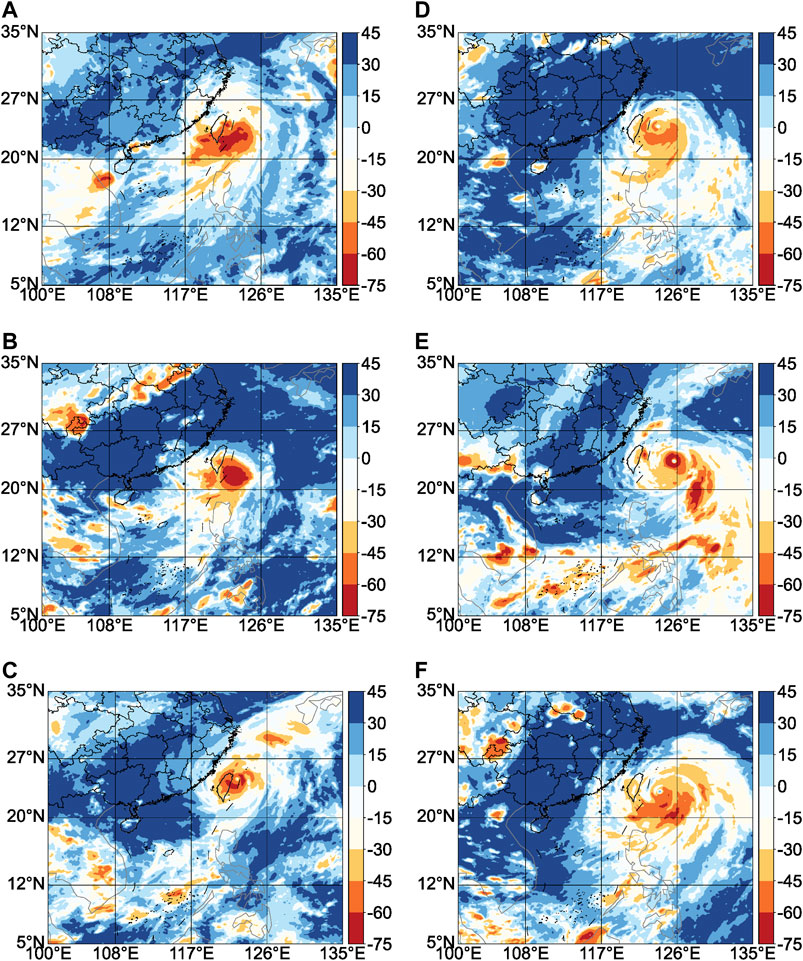
FIGURE 2. The cloud top brightness temperature (Unit: °C) from the Chinese geostationary meteorological satellite FY-2 for the ERLTC cases [(A–C) indicate Morakot, Soulik and Hagupit, respectively] and NERLTC cases [(D–F) indicate Kong-Rey, Wipha and Haitang respectively] 1 day before the extreme or non-extreme rainfall. Data for Herb, Gloria, Fred and Kaemi are unavailable, the corresponding figures omitted here.
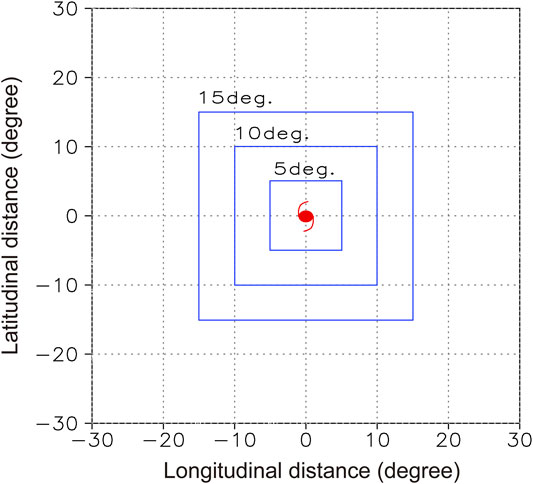
FIGURE 3. Schematic diagram of the regional average calculation ranges of 5°, 10° and 15°. The centers of the composited TC cases are set as the origin of the coordinates (shown as the red TC symbol), which are positive (negative) to the north (south) and east (west). The horizontal and vertical axes illustrate the horizontal distance in latitude and longitude from the composited TC center, which is the same in the following figures.
Evolutionary Characteristics of ERLTCs in Terms of Maintenance and Lagging
Maintenance of ERLTC Vorticity and Divergence
Figure 4 shows the temporal variation of the relative vorticity at 850-hPa (Figures 4A,B) and divergence at 200-hPa (Figures 4C,D) in the rectangular area around the composited ERLTC (Figures 4A,C) and NERLTC (Figures 4B,D) center with side lengths of 5°, 10° and 15°, as well as at the typhoon center. The rectangular areas of different sizes represent the evolution of the low-level vorticity and upper-level divergence of the TC and its surrounding environmental field. Figure 4 shows that the evolutionary trends of the low-level vorticity and upper-level divergence are basically the same for the regional average of the different rectangles.
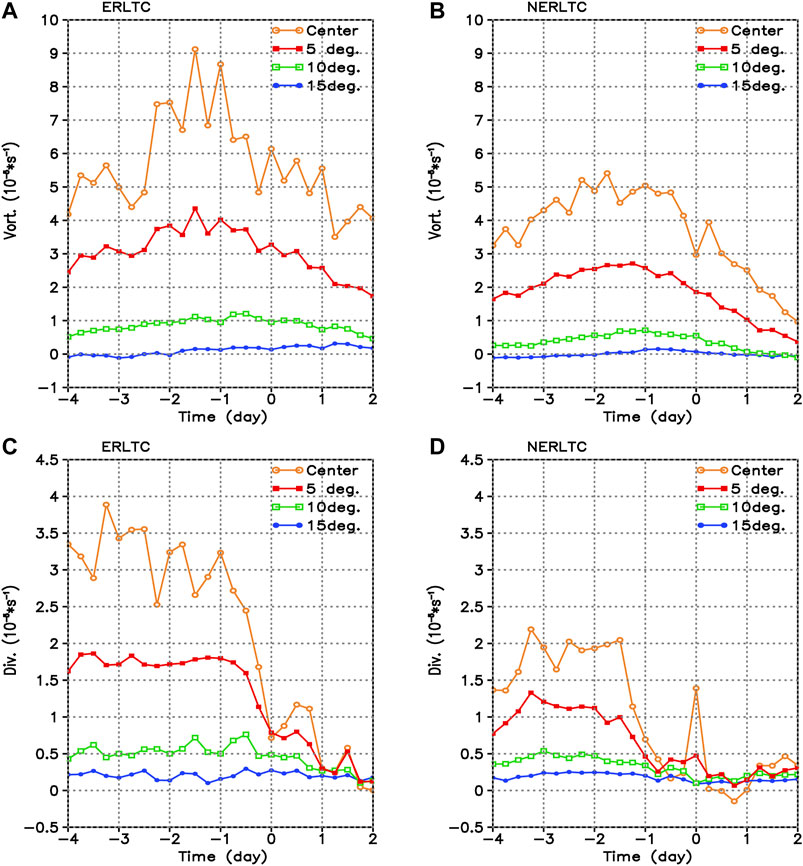
FIGURE 4. Temporal variations of the regional-average relative vorticity (units: 10–5 s−1) at 850 hPa (A, B) and the divergence (units: 10–5 s−1) at 200 hPa (C, D) for ERLTCs (A, C) and NERLTCs (B, D). The abscissa represents the relative time in days to the occurrence of the rainfall during the study period (unit: days), which is the same in the following figures.
The relative vorticity at 850-hPa (Figures 4A,B) shows fluctuating increases before the extreme or non-extreme rainfall and reaches its maximum one to 2 days before the extreme rainfall. It then decreases rapidly with the occurrence of the extreme or non-extreme rainfall. This evolutionary trend is most significant in the typhoon center, followed by the regional average in the 5° rectangle, while the variations of the regional average in the 10° and 15° rectangles are non-significant. This indicates that the low-level cyclonic rotation of the ERLTC is stronger than that of the NERLTC, and this difference is significant in the typhoon center and in the regional average of the 5° rectangle. Similarly, the temporal variations of the divergence at 200-hPa (Figures 4C,D) of these two types of TCs are significant in the typhoon center and in the regional average of the 5° rectangle, while those of the regional average of the 10° and 15° rectangles are non-significant. Compared with the NERLTC (Figure 4D), the upper-level divergence of the ERLTC is maintained at a high value before the extreme rainfall, which then decreases rapidly on the day of the extreme rainfall, indicating that the upper-level divergence of the ERLTC is significantly stronger than that of the NERLTC. Thus, the low-level cyclonic rotation and upper-level divergence of the ERLTC are significantly stronger than those of the NERLTC. The ERLTC differs from the NERLTC in that the cyclonic rotation at 850 hPa continuously intensifies before the extreme rainfall and the divergence at 200 hPa decreases sharply on the day of the extreme rainfall.
Figure 5 shows the height–time evolution of the relative vorticity (Figures 5A,B) and divergence (Figures 5C,D) of the composited ERLTC (Figures 5A,C) and NERLTC (Figures 5B,D) across the TC center to further illustrate the evolution of the vorticity and divergence at different heights. Before the extreme rainfall occurs, the high-value area of the ERLTC’s relative vorticity (Figure 5A) gradually descends from the middle and upper troposphere at 400–500 hPa to the lower troposphere at 800–900 hPa. On the day before the extreme rainfall, the relative vorticity near 850 hPa in the lower troposphere reaches its maximum. In comparison, the high-value area of the NERLTC’s relative vorticity (Figure 5B) is smaller and the vertical extent is lower than that of the ERLTC, which reaches its maximum 2 days before the non-extreme rainfall. The height–time evolution of the divergence shows that both the upper-level divergence and lower-level convergence of the ERLTC (Figure 5C) are stronger than those of the NERLTC (Figure 5D), and the lower-level convergence of the two types reaches its maximum before the rainfall. Combining the above analyses of the temporal evolution of the relative vorticity at 850 hPa and the divergence at 200 hPa in different regions, it can be seen that, before the extreme rainfall, the cyclonic rotation in the lower levels and the divergence in the upper levels are both strong in the case of the ERLTC. In general, the characteristics of the ERLTC’s structure are more similar to those of “strong typhoons” than those of the NERLTC. The reasons are explored in the next section based on the similarities and differences between the environmental fields of the two types of TC.
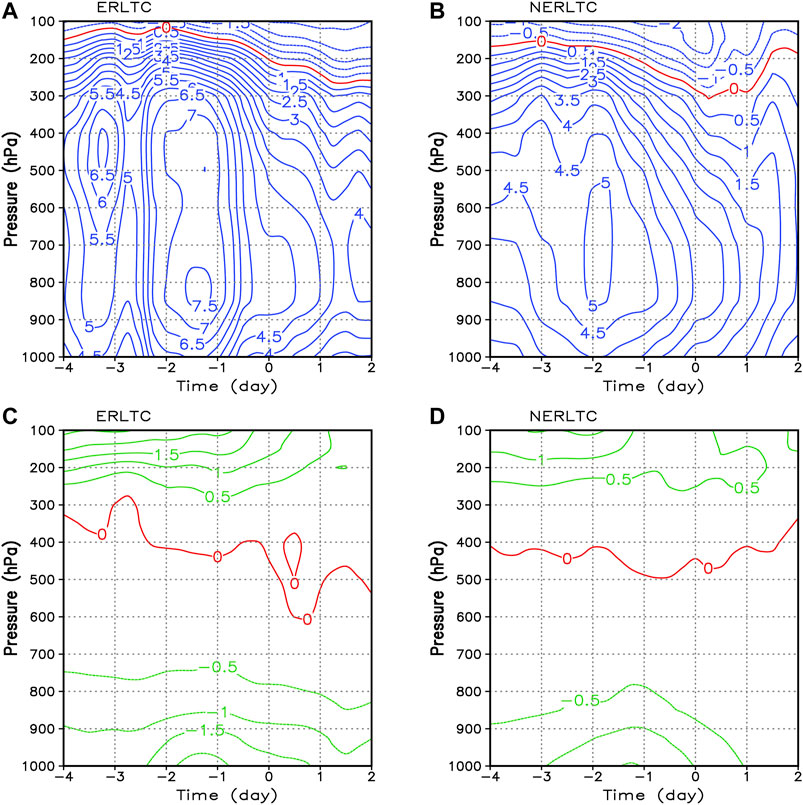
FIGURE 5. Height–time evolution of the (A,B) relative vorticity (units: 10–5 s−1) and (C,D) divergence (units: 10–5 s−1) for (A,C) ERLTCs and (B,D) NERLTCs across the typhoon center.
Basic Circulation Configuration of ERLTCs
Figure 6 shows the wind field and water vapor flux at 850 hPa of the composited ERLTC and NERLTC superimposed onto the 588-dagpm contour at the 500-hPa isobaric surface. Compared with the NERLTC (Figures 6C,D), the water vapor flux to the southwest of the ERLTC (Figures 6A,B) is much stronger. At the same time, this southwest water vapor is continuously transported from the environmental field, which can be seen 4 days before the extreme rainstorm (figures not shown). Therefore, the continuous and strong southwest water vapor transport in the ERLTC’s environmental field is an important feature that distinguishes it from the NERLTC, which is the southwest monsoonal surge activity discussed in this paper. The 588-dagpm contour on the 500-hPa isobaric surface represents the activity of the subtropical high, indicating a strong subtropical high to the east of the ERLTC. Thus, the joint effects of the strong monsoonal surge to the southwest and the strong activity of the subtropical high to the east of the ERLTC lead to a stronger lower-level cyclonic rotation and upper-level divergence of the ERLTC compared to those of the NERLTC.
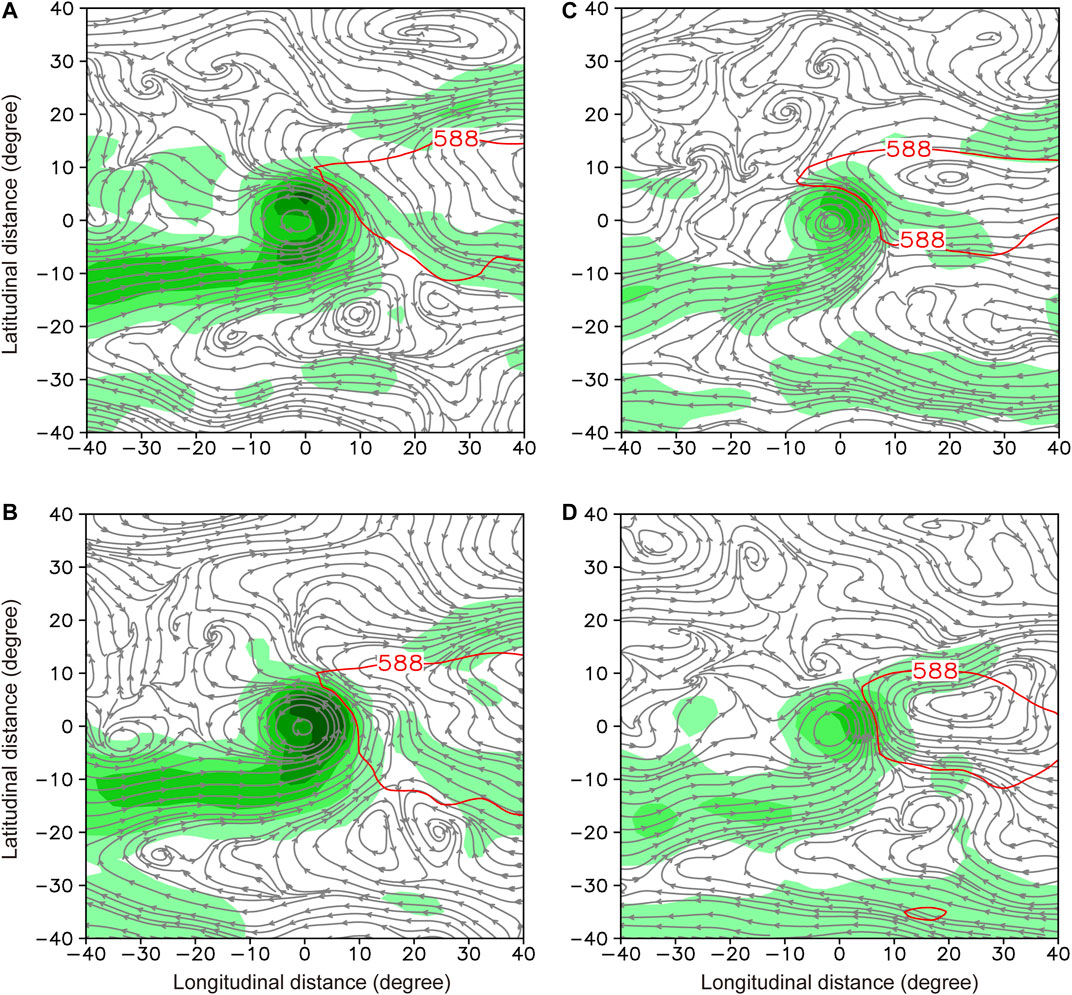
FIGURE 6. Streamlines, magnitude of water vapor flux at 850-hPa (shaded; units: kg m−1 s−1) and 588-dagpm contours (red line) at 500-hPa of the composited (A, B) ERLTC and (C, D) NERLTC 1 day before (A, C) and on the day (B, D) of the extreme or non-extreme rainfall. The meaning of the coordinates is the same as in Panel 3.
Figure 7 shows the height–time evolution of the water vapor flux and horizontal wind of the composited ERLTC and NERLTC to further explore the vertical structure characteristics of the southwest monsoonal surge. Figures 7D–F show that, although there are also high water vapor flux values to the west of the NERLTC before the non-extreme rainstorm, they are not connected to the TC. Combined with the horizontal wind, it can be seen that northerly wind prevails in the middle and lower troposphere between the TC and the high-value area of the water vapor flux, which is not conducive to the transport of water vapor from the environmental field in the southwest to the TC. On the contrary, Figures 7A–C show that the high-value area of the water vapor flux to the west of the ERLTC has an enduring connection to the TC, and southwesterly wind prevails between them, indicating strong southwest monsoonal surge activity. Two days before the extreme rainstorm (Figure 7A), there are two peaks of water vapor flux near 20° and 40° west of the TC center. One day before the extreme rainstorm (Figure 7B), the peak of the water vapor flux near 20° west of the TC center merges with the TC; and with the expansion of the high-value water vapor flux area in the TC, it further extends vertically on the day of the extreme rainstorm (Figure 7C). In addition, there are differences in the vertical structures of the TC and the southwest monsoonal surge, even though both are warm and wet weather systems. Figure 7 shows that the high-value area of the water vapor flux of the southwest monsoonal surge is located in the lower troposphere and reaches the underlying surface. However, the high-value area of the water vapor flux of the TC is located in the middle and lower troposphere, which cannot reach the underlying surface. This feature is determined by the wind structure in the TC boundary layer.
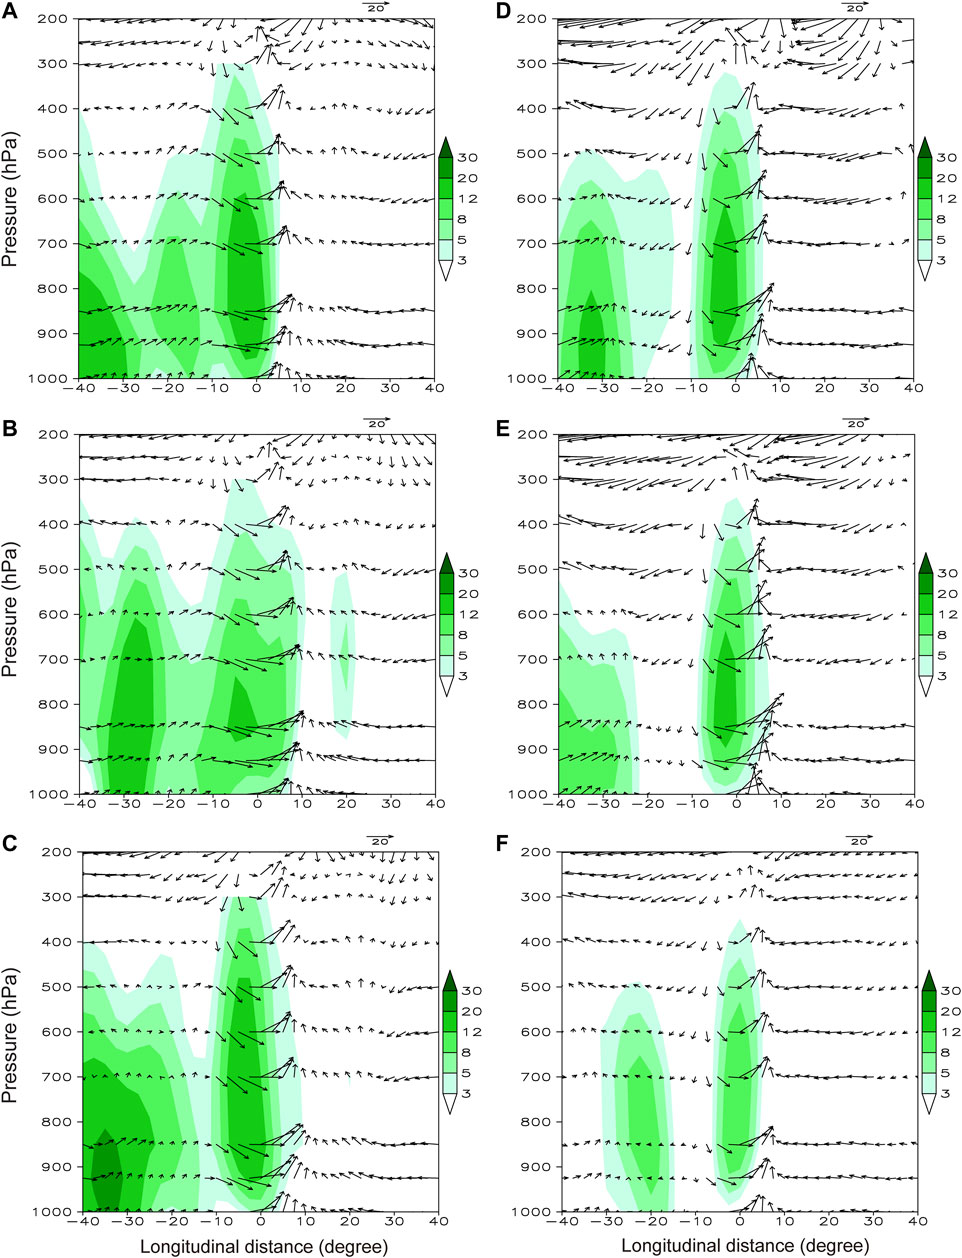
FIGURE 7. Height–time evolution of the magnitude of water vapor flux (shaded; units: kg m−1 s−1) and horizontal wind (vectors; units: m s−1) of the composited (A–C) ERLTC and (D–F) NERLTC 2 days before (A, D), 1 day before (B, E), and on the day (C, F) of the extreme or non-extreme rainfall.
Lagging of the ERLTC
Figure 8 shows the translational speed of the selected cases of ERLTCs and NERLTCs and their relative average translational speeds, which were calculated by the great circle distance between two latitudinal and longitudinal points in the best-track dataset at 6-h intervals. The results show that the average translational speeds of ERLTCs (NERLTCs) remains slower (faster) from 3 days before to the day when the rainfall occurs. During this 3-day period of rainfall, the average translational speed of the ERLTCs and NERLTCs in our study is 14.7 km h−1 and 20.4 km h−1, respectively. From this, we can see that the average translational speed of the ERLTCs is nearly a quarter slower than that of the NERLTCs, which is in consistent with previous conclusions (Chen, 1977; Wu, 2013; Chen and Xu, 2017) that the maintenance and stagnation of TCs are important characteristics for LTC extreme rainfall. We believe that the monsoonal surge is an important factor of influence for the lagging of ERLTCs. A detailed mechanistic analysis in this respect is further given in Lagging mechanism revealed by the environmental steering flow.
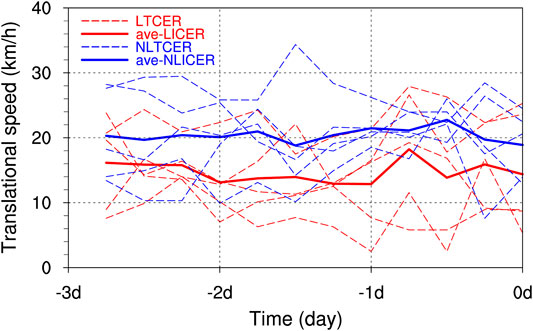
FIGURE 8. Translational speed (units: km h−1) of each selected ERLTC case (red dashed lines) and NERLTC case (blue dashed lines) and their composite average (red solid line for ERLTC cases and blue solid lines for NERLTC cases) calculated by their latitudinal and longitudinal position records at 6-h intervals.
Mechanisms Through Which the Monsoonal Surge Influences the Maintenance and Lagging of ERLTCs
Maintenance Mechanism Revealed by Vorticity Budget Analysis
Rotation is one of the most basic characteristics of the TC system. A TC is often considered as a flat cyclonic vortex, and the ratio of its vertical to horizontal scale is about 1:50 (Chen and Ding, 1979). The vorticity budget equation can be used to describe the characteristics of a TC’s vortex motion. Based on our earlier qualitative analyses, we next quantitatively analyze the vertical vorticity budgets of the ERLTC and NERLTC cases by focusing on the contribution of the southwest monsoonal surge to the ERLTC vorticity budget.
One day before the extreme rainfall (Figure 9A), the total vorticity tendency of the composited ERLTC is positive below 250 hPa and negative above 250 hPa, indicating that its vorticity increases below 250 hPa and decreases above 250 hPa. The horizontal divergence term contributes the most to the vorticity tendency, followed by the vorticity advection term. For the composited NERLTC (Figure 9C), the total vorticity tendency is positive (negative) below (above) 300 hPa, indicating that its vorticity increases below 300 hPa and decreases above 300 hPa. The horizontal divergence term also contributes the most to the vorticity tendency, but the vorticity advection term below 300 hPa has a negative contribution in general. Thus, the most significant difference in the vorticity budgets between the two types of LTC is the relative vorticity advection term between 700 hPa and 400 hPa in the middle and upper troposphere. The contributions of other terms are small. On the day of the extreme rainfall (Figure 9C), the peak total vorticity tendency of the ERLTC decreases near 500 hPa and increases significantly below 850 hPa, indicating that the vorticity decreases in the middle troposphere and increases in the lower troposphere. These analyses of the contributions of different terms show that the increase in the relative vorticity advection term in the lower troposphere plays an important role. However, the variations in total vorticity tendency and the budgets of the terms of the NERLTC (Figure 9D) are non-significant.
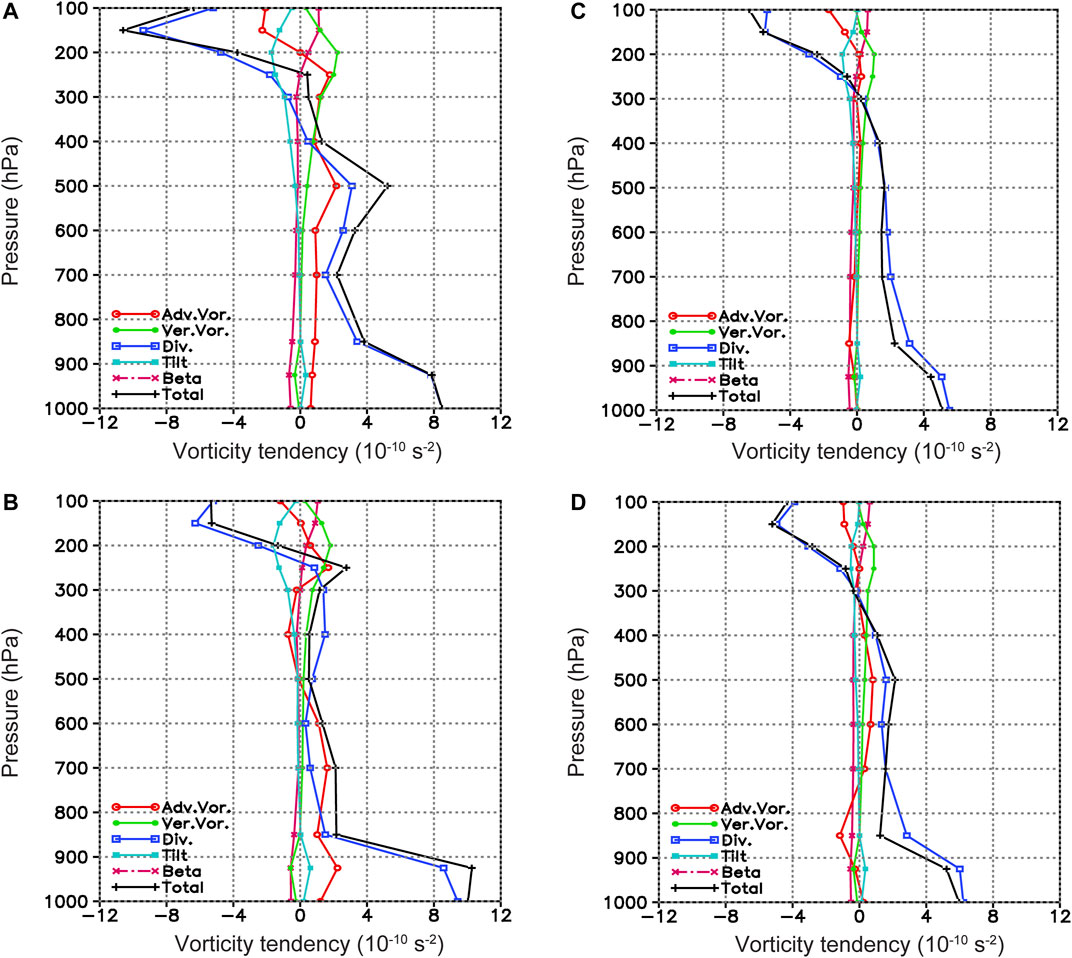
FIGURE 9. Vertical distribution of the regional average vorticity budget (units: 10–10 s−2) in the 5° area near the center of the composited (A, B) ERLTC and (C, D) NERLTC 1 day before (A, C) and on the day (B, D) of the extreme or non-extreme rainfall.
The vorticity of the ERLTC increases more significantly in the middle and lower troposphere compared with that of the NERLTC, especially in the lower troposphere on the day of the extreme rainfall. Although the vertical variational trends of the vorticity tendency of the two types of LTC are basically consistent with those of the horizontal divergence term, the relative vorticity advection term contributes significantly to the ERLTC in the middle and lower troposphere, indicating an important contribution of the southwest monsoonal surge to ERLTCs.
The height–time evolution of the average vorticity budgets in the 5° region near the center of the ERLTC (Figures 10A–F) and NERLTC (Figures 10G–L) before and after the extreme or non-extreme rainfall are given below. The patterns of the horizontal divergence terms (Figures 10C,I) of the ERLTC and NERLTC are similar, in which the convergence gradually intensifies in the lower troposphere before the extreme or non-extreme rainfall. The difference is that the convergence of the ERLTC is stronger than that of the NERLTC. The relative vorticity advection term (Figures 10B,H) shows the high-value area to be located in the middle and lower troposphere. The difference is that the value of the ERLTC is one order of magnitude larger than that of the NERLTC, which further proves that the relative vorticity advection term in the middle and lower troposphere makes an important contribution to ERLTCs. The vertical transport terms of the relative vorticity (Figures 10E,K) of the ERLTC and NERLTC are very similar, with both having peaks near 200 hPa in the upper troposphere. In addition, the β-effect terms (Figures 10D,J) and the tilting terms (Figures 10F,L) of the two types of typhoons are one order of magnitude smaller than the total vorticity tendency, horizontal divergence, and relative vorticity advection terms. Their contributions are relatively small, which is consistent with the dimensional analysis results of the TC system. All in all, the vorticity in the middle troposphere begins to increase and gradually extends to the lower troposphere before the extreme rainfall, and is contributed significantly by the relative vorticity advection term in the middle and lower troposphere.
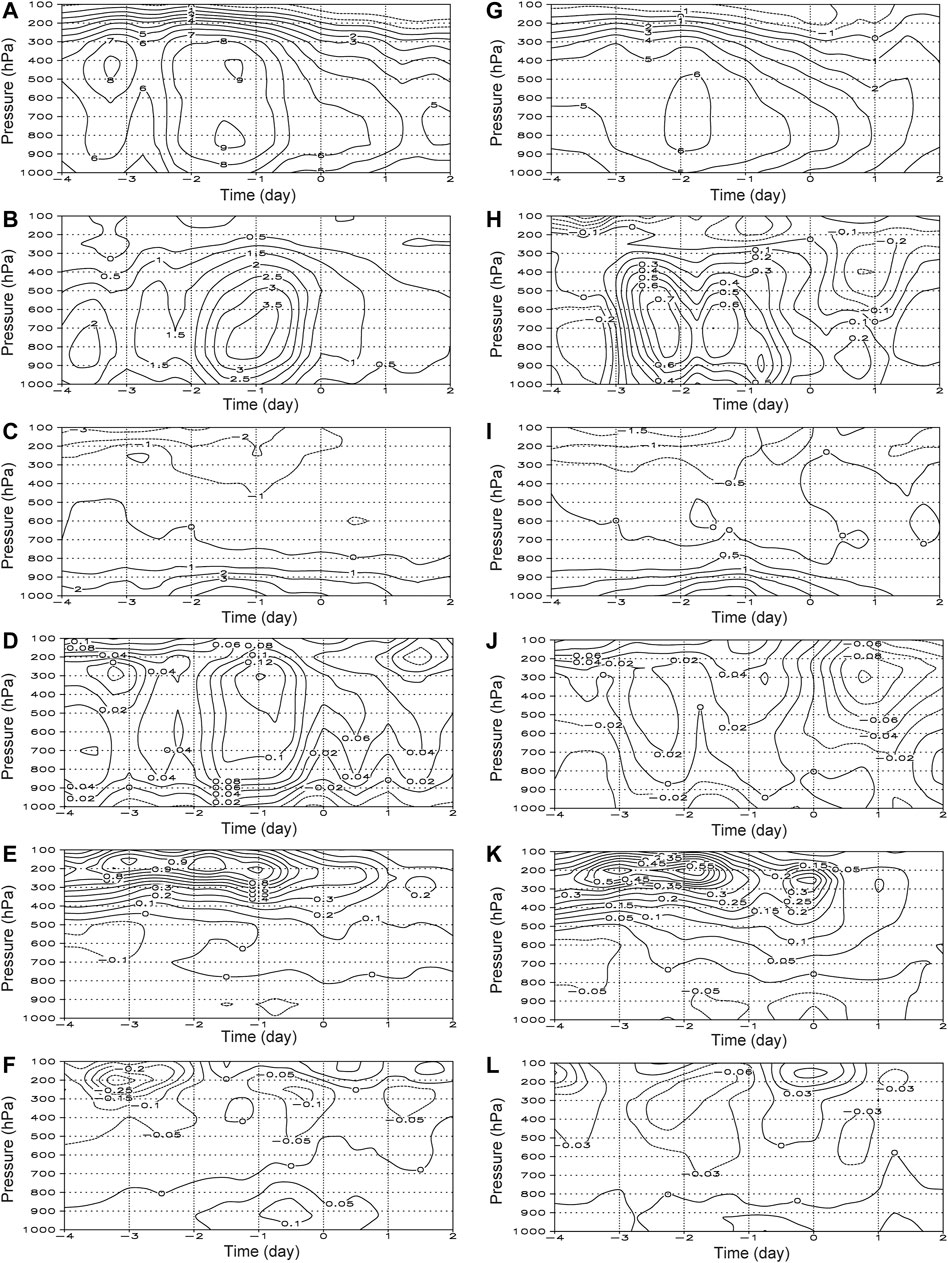
FIGURE 10. Height–time evolution of the regional-average vorticity budget terms (units: 10–10 s−2) in the 5° area near the centers of the (A–F) ERLTCs and (G–L) NERLTCs: (A, G) temporal vorticity evolution; (B, H) relative vorticity advection term; (C, I) horizontal divergence term; (D, J) β-effect term; (E, K) vertical transport term of the relative vorticity; (F, L) tilting term.
Lagging Mechanism Revealed by the Environmental Steering Flow
Figure 11 shows the DLM of the environmental steering flow, which is the southeasterly wind for both the composited ERLTC and NERLTC, thus explaining why the TC cases selected in this study all follow the northwestward track. In Zhao et al. (2021), the influence of the zonal component of the monsoonal surge on the zonal steering flow was discussed. Here, Figure 11 further shows the meridional component of the monsoonal surge and its influence on the meridional steering flow and the total DLM. Comparison between the ERLTC and NERLTC shows that the patterns of the meridional wind at different levels of the environmental field are similar to each other, with southerly wind in the lower levels, northerly wind in the upper levels, and weak southerly wind in the DLM. Thus, the magnitude of the DLM is mainly determined by the zonal component. Therefore, the activity of the southwest monsoonal surge is mainly manifested in the zonal anomaly, and the corresponding strong westerly wind transport can significantly reduce the zonal component of the TC steering flow. Subsequently, the TC steering flow can be weakened and the northwestward speed of movement of the ERLTC decreases, generating the favorable conditions for extreme rainfall.
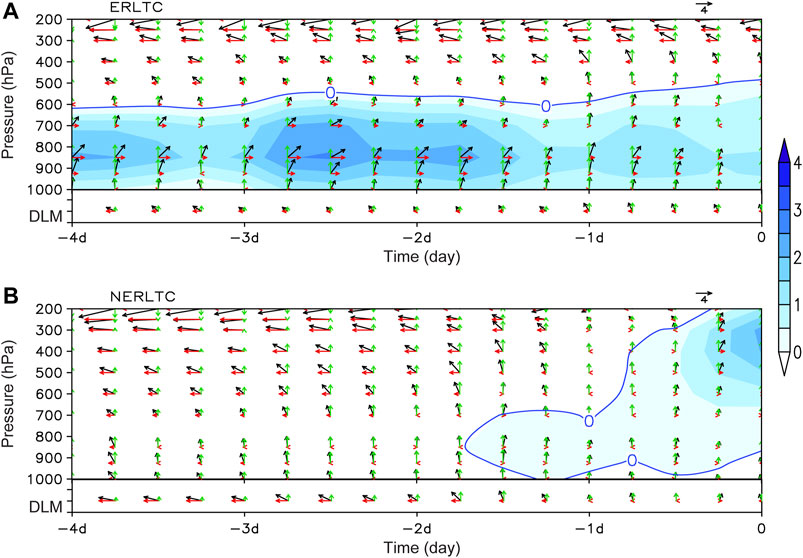
FIGURE 11. Environmental steering flow at different heights and the DLM for the (A) ERLTCs and (B) NERLTCs, including the total wind speed (black vectors; units: m s−1) the meridional (green vectors; unit: m s−1) and zonal (red vectors; units: m s−1) components of the steering flow and the DLM superimposed on the temporal evolution of the zonal zero wind-speed line (blue line; units: m s−1). Areas with zonal steering airflow greater than zero are shaded.
Conceptual Model of the Impacts of the Monsoonal Surge on ERLTCs
Combining the findings of Zhao et al. (2021) and the main conclusions of the present study, a complete conceptual model of the impacts of the monsoonal surge on ERLTCs is presented in Figure 12. Against the background of the East Asian summer monsoon, monsoonal surge with favorable underlying surface conditions play important roles in the evolution and characteristics of ERLTCs. Specifically, the impacts can be summarized into three aspects: Firstly, the monsoonal surge can continuously transport water vapor to the ERLTC. Secondly, the activities of the monsoonal surge can significantly reduce the ERLTC’s steering flow and TC translational speed. And thirdly, the monsoonal surge transports vorticity to the ERLTC via horizontal vorticity advection, which effectively increases the cyclonic vorticity in the middle and lower levels of the ERLTC and markedly affects the maintenance of the strong cyclonic circulation in the ERLTC.
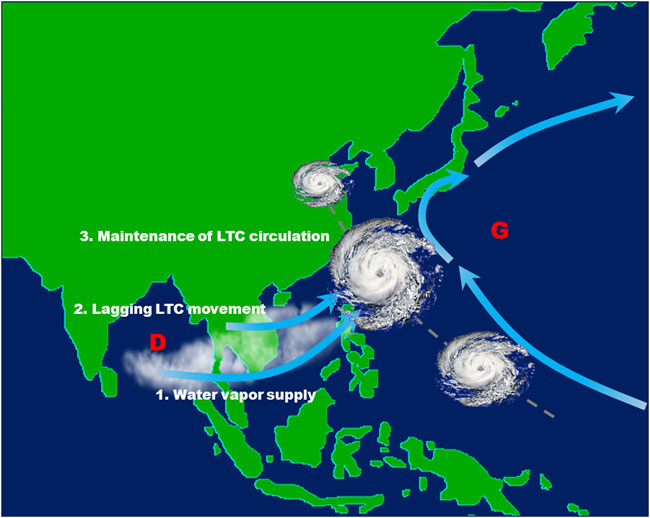
FIGURE 12. Conceptual model for the influence of the monsoonal surge on ERLTCs. The thick blue arrows represent the directions of the airflow; G and D represent the high pressure and low pressure associated with the anticyclonic circulation and cyclonic circulation, respectively; the grey dashed line indicates the track of the TC; and the cloud cluster to the southwest of the TC indicates the activity of the monsoonal surge.
Conclusion and Future Work
In this study, five typical ERLTC cases and five typical NERLTC cases were composited and compared in terms of the evolutionary characteristics of their circulation and their translational speed under the influence of a strong or weak monsoonal surge. Combined with our previous findings (Zhao et al., 2021), the mechanism through which the monsoonal surge influences ERLTCs is further discussed from a new perspective. The results can be summarized as follows:
1) Compared with NERLTCs, ERLTCs have two distinct characteristics—namely, maintenance of the LTC circulation and a lagging (slowing down or looping) of their movement. The monsoonal surge can provide a direct positive contribution to these two distinct characteristics of ERLTCs via two different mechanisms.
2) The low-level cyclonic rotation and upper-level divergence of an ERLTC are significantly stronger than those of an NERLTC, and the characteristics of an ERLTC’s structure are more similar to those of “strong typhoons” than they are for an NERLTC. The continuous intensification of the cyclonic rotation in the lower troposphere before the extreme rainfall is a significant feature that distinguishes ERLTCs from NERLTCs. Analysis of the vorticity budget shows that the total vorticity of ERLTCs increases significantly in the middle and lower levels, especially on the day of their extreme rainfall, when the high-value vorticity area in the middle troposphere gradually extends to the lower level and the vorticity increases more significantly in the lower troposphere. The relative vorticity advection in the middle and lower levels under the influence of the southwest monsoonal surge contributes greatly to the increased vorticity in the middle and lower levels of an ERLTC. Thus, a strong monsoonal surge is conducive to the maintenance of ERLTC circulation.
3) The magnitude of the DLM is mainly determined by the zonal wind. Thus, the activity of the southwest monsoonal surge is mainly manifested in the zonal wind anomaly, and the corresponding strong westerly transport can significantly reduce the zonal component of the TC’s steering flow. Hence, the TC steering flow can be weakened and the northwestward speed of movement decreases and favors the occurrence of extreme rainfall. Thus, the monsoonal surge contributes to a lagging (slowing down or looping) of ERLTC movement.
4) Strong monsoonal surge activity to the southwest of an ERLTC and strong activity of the subtropical high to the east jointly make the low-level cyclonic rotation and upper-level divergence of an ERLTC stronger than those of an NERLTC. The two types of LTC differ from the southwest monsoonal surge in vertical structure, even though they are both warm and wet weather systems. The high-value area of water vapor flux of the southwest monsoonal surge (TC) is located in the lower (middle and lower) troposphere, which can (cannot) extend to the underlying surface.
The above conclusions show that the activity of the monsoonal surge plays an important role in maintaining the cyclonic circulation of ERLTCs and slowing down their translational speed. This further enriches our previous understanding of the role played by the impact of the monsoonal surge on ERLTCs, which was already well known to relate to the supply and transportation of water vapor (Gao et al., 2009; Zhao et al., 2021) and their coupling with the low-level jet (Dong et al., 2010; Cheng et al., 2012). It also shows that the monsoonal surge plays an important role in ERLTCs with a northwestern track, i.e., not only those with a western track (Zhou and Wu, 2019). In terms of the synoptic-scale activity of the East Asian summer monsoon, the southwest monsoonal surge is universal in its interaction with LTCs in China. Our study shows that the intensity of the monsoonal surge differs significantly between ERLTCs and NERLTCs. Therefore, real-time quantitative monitoring of the activity of the monsoonal surge is of great significance towards improving the forecast skill for ERLTCs. It should be noted that some typical cases have shown ERLTCs to result from the optimal configuration and synergistic effects of multi-scale systems, such as the “75•8” extremely severe rainfall (Ding, 2015) in Henan Province and the extreme rainfall of TC Morakot (Lee et al., 2011). The mechanisms of influence on ERLTCs relating to the characteristics of the underlying surface, the TC structure, mid-latitude trough, binary TC interaction, and other environmental factors need to be further studied based on multi-source observational data derived from satellites and radar, as well as high-resolution numerical simulations.
Data Availability Statement
The original contributions presented in the study are included in the article/supplementary material, further inquiries can be directed to the corresponding author.
Author Contributions
LC designed the study. DZ analyzed the datasets and generated figures. DZ and LC wrote the paper with contributions from YY.
Funding
This study was supported by the National Key R&D Program of China (2017YFC1501602), National Science Foundation of China (41775048), National Basic Research Program of China (2015CB452804), Huafeng Meteorological Media Group Essential Research Project (CY-J2020002) and the Open Grants of the State Key Laboratory of Severe Weather (2020LASW-B06).
Conflict of Interest
The authors declare that the research was conducted in the absence of any commercial or financial relationships that could be construed as a potential conflict of interest.
Publisher’s Note
All claims expressed in this article are solely those of the authors and do not necessarily represent those of their affiliated organizations, or those of the publisher, the editors and the reviewers. Any product that may be evaluated in this article, or claim that may be made by its manufacturer, is not guaranteed or endorsed by the publisher.
Acknowledgments
The authors thank Fumin Ren for providing the TC-induced OSAT precipitation dataset over China in this study.
References
Bao, X., Wu, L., Zhang, S., Yuan, H., and Wang, H. (2020). A Comparison of Convective Raindrop Size Distributions in the Eyewall and Spiral Rainbands of Typhoon Lekima (2019). Geophys. Res. Lett. 47, e2020GL090729. doi:10.1029/2020GL090729
Chen, L. S., and Ding, Y. H. (1979). Overview of the Typhoons in Northwest Pacific. Beijing: Science Press, 491pp. (in Chinese).
Chen, L. S., Duan, Y. H., Song, L. L., and Xu, Y. L. (2012). Typhoon Forecast and Disaster. Beijing: China Meteorological Press, 370. (in Chinese).
Chen, L. S. (1977). Origin Analysis for Landfalling Typhoon Heavy Rainstorm. Meteorol. Mon 3 (11), 10–12. (in Chinese). doi:10.7519/j.issn.1000-0526.1977.11.007
Chen, L. S., and Xu, Y. L. (2017). Review of Typhoon Very Heavy Rainfall in China. Meteorol. Environ. Sci. 40 (1), 3–10. (in Chinese with English abstract). doi:10.16765/j.cnki.1673-7148.2017.01.001
Cheng, Z. Q., Chen, L. S., and Li, Y. (2012). Interaction between Landfalling Tropical Cyclone and Summer Monsoon with Influences on Torrential Rain. J. Appl. Meteorol. Sci 23 (6), 660–671. (in Chinese with English abstract).
Dai, H., Zhao, K., Li, Q., Lee, W. C., Ming, J., Zhou, A., et al. (2021). Quasi‐Periodic Intensification of Convective Asymmetries in the Outer Eyewall of Typhoon Lekima (2019). Geophys. Res. Lett. 48, e2020GL091633. doi:10.1029/2020GL091633
Ding, Y. H., Cai, Z. Y., and Li, J. S. (1978). 9. Demobilization. Chin. J Atmos Sci 2, 276–301. (in Chinese with English abstract). doi:10.1525/9780520310148-013
Ding, Y. H. (2015). On the Study of the Unprecedented Heavy Rainfall in Henan Province during 4-8 August 1975: Review and Assessment. Acta Meteorologica Sinica 73, 411–424. (in Chinese with English abstract). doi:10.11676/qxxb2015.067
Dong, M., Chen, L., Li, Y., and Lu, C. (2010). Rainfall Reinforcement Associated with Landfalling Tropical Cyclones. J. Atmos. Sci. 67, 3541–3558. doi:10.1175/2010JAS3268.1
Duan, Y. H., Chen, L. S., Liang, J. Y., Wang, Y., Wu, L. G., Cui, X. P., et al. (2014). Research Progresses in Abnormal Changes before and after Typhoon Landfall. J. Meteorol. Res. 72, 969–986. (in Chinese with English abstract).
Duan, Y., Wan, Q., Huang, J., Zhao, K., Yu, H., Wang, Y., et al. (2019). Landfalling Tropical Cyclone Research Project (LTCRP) in China. Bull. Am. Meteorol. Soc. 100 (12), ES447–ES472. doi:10.1175/BAMS-D-18-0241.1
Gao, S., Meng, Z., Zhang, F., and Bosart, L. F. (2009). Observational Analysis of Heavy Rainfall Mechanisms Associated with Severe Tropical Storm Bilis (2006) after its Landfall. Monthly Weather Rev. 137 (6), 1881–1897. doi:10.1175/2008MWR2669.1
Gu, X. H., and Zhang, Q. (2020). Statistical Characteristics of Extreme Precipitation Events and Associated Mechanisms. Beijing: Science Press, 185. (in Chinese).
Jia, L., Jia, Z., Ren, F., Ding, C., Wang, M., and Feng, T. (2020). Introducing TC Intensity into the DSAEF_LTP Model and Simulating Precipitation of Super‐typhoon Lekima (2019). Q.J.R. Meteorol. Soc. 146, 3965–3979. doi:10.1002/qj.3882
Kimberlain, T. B., and Breman, M. J. (2017). “Chapter 3: Tropical Cyclone Motion,” in Global Guide to Tropical Cyclone Forecasting. Editor C. C. Guard. 2nd ed. (Geneva, Switzerland: WMO), 63–125. 978-92-63-11194-4.
Lee, C.-S., Wu, C.-C., Wang, T.-C. C., and Elsberry, R. L. (2011). Advances in Understanding the "Perfect Monsoon-Influenced Typhoon": Summary from International Conference on Typhoon Morakot (2009). Asia-pacific J. Atmos. Sci. 47 (3), 213–222. doi:10.1007/s13143-011-0010-2
Lei, X. (2020). Overview of the Development History of China's Typhoon Research and Operational Work in the Past century. Sci. China Earth Sci. 63, 362–383. doi:10.1007/s11430-018-9379-8
Li, Z., Yu, W., Li, K., Wang, H., and Liu, Y. (2019). Environmental Conditions Modulating Tropical Cyclone Formation over the Bay of Bengal during the Pre-monsoon Transition Period. J. Clim. 32 (14), 4387–4394. doi:10.1175/JCLI-D-18-0620.1
Lu, S., Wang, L. J., Guan, Z. Y., He, J. L., and Song, H. (2012). Comparison of Impacts of Low-Latitude Monsoon Surge on the Enhanced Rainstorm from landing Typhoons Durian and Bilis. Trans. Atmos. Sci. 35 (2), 175–185. (in Chinese with English abstract).
Lu, X., Yu, H., Ying, M., Zhao, B., Zhang, S., Lin, L., et al. (2021). Western North Pacific Tropical Cyclone Database Created by the China Meteorological Administration. Adv. Atmos. Sci. 38 (4), 690–699. doi:10.1007/s00376-020-0211-7
Rantanen, M., Räisänen, J., Sinclair, V. A., Lento, J., and Järvinen, H. (2020). The Extratropical Transition of Hurricane Ophelia (2017) as Diagnosed with a Generalized omega Equation and Vorticity Equation. Tellus A: Dynamic Meteorology and Oceanography 72 (1), 1–26. doi:10.1080/16000870.2020.1721215
Ren, F. M., and Yang, H. (2019). An Overview of Advances in Typhoon Rainfall and its Forecasting Researches in China during the Past 70 Years and Future Prospects. Torrential Rain and Disasters 38 (5), 526–540. (in Chinese with English abstract).
Ren, F., Wang, Y., Wang, X., and Li, W. (2007). Estimating Tropical Cyclone Precipitation from Station Observations. Adv. Atmos. Sci. 24, 700–711. doi:10.1007/s00376-007-0700-y
Wu, C.-C. (2013). Typhoon Morakot: Key Findings from the Journal TAO for Improving Prediction of Extreme rains at Landfall. Bull. Amer. Meteorol. Soc. 94, 155–160. doi:10.1175/BAMS-D-11-00155.1
Xia, J., Wang, H. Y., Gan, Y. Y., and Zhang, L. P. (2019). Research Progress in Forecasting Methods of Rainstorm and Flood Disaster in China. Torrential Rain and Disasters 38, 416–421. (in Chinese with English abstract). doi:10.3969/j.issn.1004-9045.2019.05.003
Yang, D. S., Liu, Y. B., and Liu, S. G. (1983). Dynamic Meteorology. Beijing: China Meteorological Press, 423. (in Chinese).
Ying, M., Zhang, W., Yu, H., Lu, X. Q., Feng, J. X., Fan, Y. X., et al. (2014). An Overview of the China Meteorological Administration Tropical Cyclone Database. J. Atmos. Ocean. Technol. 31, 287–301. doi:10.1175/JTECH-D-12-00119.1
Yu, Z., Chen, Y. J., Ebert, B., Davidson, N., Xiao, Y., Yu, H., et al. (2020). Benchmark Rainfall Verification of Landfall Tropical Cyclone Forecasts by Operational ACCESS-TC over China. Meteorol. Appl. 27, e1842. doi:10.1002/met.1842
Zhao, D., Yu, Y., and Chen, L. (2021). Impact of the Monsoonal Surge on Extreme Rainfall of Landfalling Tropical Cyclones. Adv. Atmos. Sci., 38(5), 771–784. doi:10.1007/s00376-021-0281-1
Keywords: extreme rainfall, tropical cyclones, monsoon surge, maintenance, lagging
Citation: Zhao D, Chen L and Yu Y (2021) Monsoon Surges Enhance Extreme Rainfall by Maintaining the Circulation of Landfalling Tropical Cyclones and Slowing Down Their Movement. Front. Earth Sci. 9:717447. doi: 10.3389/feart.2021.717447
Received: 31 May 2021; Accepted: 11 August 2021;
Published: 23 August 2021.
Edited by:
Qingqing Li, Nanjing University of Information Science and Technology, ChinaReviewed by:
Mingyu Bi, Nanjing University of Information Science and Technology, ChinaQingyuan Liu, Chinese Academy of Meteorological Sciences, China
Copyright © 2021 Zhao, Chen and Yu. This is an open-access article distributed under the terms of the Creative Commons Attribution License (CC BY). The use, distribution or reproduction in other forums is permitted, provided the original author(s) and the copyright owner(s) are credited and that the original publication in this journal is cited, in accordance with accepted academic practice. No use, distribution or reproduction is permitted which does not comply with these terms.
*Correspondence: Lianshou Chen, Y2hlbmxzQGNtYS5nb3YuY24=