- 1Department of Geology, Faculty of Science, Chulalongkorn University, Bangkok, Thailand
- 2Geoscience Program, Mahidol University Kanchanaburi Campus, Kanchanaburi, Thailand
- 3Research Program of Toxic Substance Management in the Mining Industry Center of Excellence on Hazardous Substance Management (HSM), Chulalongkorn University, Bangkok, Thailand
- 4Research Unit of Green Mining (GMM), Chulalongkorn University, Bangkok, Thailand
The lower Khwae Hanuman sub-basin in Thailand suffers from water shortage during each dry season. As such, groundwater resources are an additional freshwater source in this region, in particular for cultivating activities. Thus, an understanding of the volume of groundwater recharge into the saturated zone is required. The objective of the study is to assess the groundwater recharge potential (GRP) using the weighted overlay analysis method by geographic information system (GIS) and finally checking the reliability of GRP map using observed specific capacity carried out by the Department of Groundwater Resources (DGR). The geological and hydrogeological features that affect groundwater potential are the lithology, land use, lineaments, drainage, slope, and soil. The weighting and rating of these six influencing factors were determined by assessing the interrelationship of the main and minor influences of each factor based on several literature reviews, followed by a weighted overlay analysis with GIS, in association with groundwater recharge. The GRP can be classified in descending order: high, moderate, low, and very low, where about 33.9 km2 (2.26% of the total area of 1,500 km2) had high recharge potentiality, located at the center of the area. Only 12.8% of the total precipitation (271.75 million m3/y or approximately 181.2 mm) infiltrated the groundwater aquifer, while the rest was lost by either surface runoff or evapotranspiration. Based on GRP sensitivity analysis index, lithology was the most efficient influencing factor in GRP mapping. Most groundwater wells (>96% or 369 wells) were classified into the classes of low and moderated, which agree to the GRP zones. The results of calculating the area under the curve (AUC) of the receiver operating characteristic (ROC) curve were 86.0 percent, with relatively good predictive accuracy. The stable baseflow analysis would be used to confirm the amount of GRP by weighting overlay technique. Therefore, the GRP method can be applied in other areas, particular in similar hydrogeological characteristics. The first-hand recharge potential map and groundwater recharge information in this area can be used to establish an effective groundwater exploration program for agricultural activities; it is also used to appropriate sustainable yields from each groundwater basin to provide groundwater over the long-term, without negatively impacting the environment and without affecting the groundwater balance as it has recharge in the rainy seasons, which can use groundwater sustainably. It is in line with the sustainable development goals (SDGs) in goal number six of the UN.
Introduction
Water is an essential resource for agriculture. In Thailand, surface water is the main source of agricultural irrigation. In the dry season (February–May), agriculturists face a water shortage problem due to increased temperature, which results in a high rate of evaporation and low rainfall levels decrease, so groundwater becomes an essential additional freshwater resource. Surface water interacts reciprocally with the groundwater, whereas surface water levels decrease as do groundwater levels decrease. If there is enough water recharge to the groundwater aquifers, it would help reduce the water shortage problem.
Groundwater recharge is defined as infiltrated water flow through the unsaturated zone into the groundwater zone below the saturated surface (Freeze and Cherry, 1979). Water recharge occurs when it meets the groundwater level and infiltrates the aquifer and thus becomes trapped there. Factors affecting groundwater recharge include rainfall volume, characteristic of streams or rivers, fracture of rocks and porosity of soils, slope, evaporation rate, rock type, and land use. This study aimed to determine the groundwater recharge potential (GRP) by the geographic information system (GIS) to determine six contributing influencing factors: lithology, land use, lineaments, drainage, slope, and soil. Weighting and rating of these influencing factors will be developed from a combination of the principal and minor impact on the potential for groundwater recharge in LKH sub-basin, Thailand. A number of studies on GRP used remote sensing and GIS, along with some different aspects: the geology, geomorphology, lineaments, drainage, land use, slope, and topography. Several studies were applied to assess recharge potential mapping by the weighted overlay analysis (Yeh et al., 2009; Adham et al., 2010; Gupta and Srivastava, 2010; Abdalla, 2012; Magesh et al., 2012; Mukherjee et al., 2012; Nag and Ghosh, 2013; Patil and Mohite, 2014; Chotpantarat et al., 2014; Deepa et al., 2016; Selvam et al., 2016; Senanayake et al., 2016). In some studies, the analytical hierarchy process (Saaty, 1980) were used for GRP mapping (Lee et al., 2012; Rahmati et al., 2015). However, most previous studies have not validated and conducted the sensitivity analysis of GRP maps, which found that some studies quantitatively investigated the recharge of water into groundwater aquifers (Adham et al., 2010; Deepa et al., 2016; Selvam et al., 2016). Other research has examined the validity of GRP maps using the vertical electrical sounding (VES) techniques (Abdalla, 2012) and comparing GRP maps with yield data techniques (Mukherjee et al., 2012; Konkul et al., 2014; Rahmati et al., 2015). Moreover, the receiver operating characteristic (ROC) technique was also used to check the accuracy of the GRP map (Rahmati et al., 2015). Some studies have also suggested methods for the validation of GRP maps, including additional validation with field data (Adham et al., 2010; Magesh et al., 2012), pumping tests in areas with high GRP (Abdalla, 2012), isotope follow-up techniques (Yeh et al., 2009), and stable baseflow (SBF) techniques (Senanayake et al., 2016). The SBF technique was applied to assess groundwater recharge in mountainous basins at the Wu River watershed, Taiwan (Yeh et al., 2014), which is an interesting method and could be used in this study due to the similar geographical features of the study area. But the above studies did not mention the sensitivity analysis of the influencing factors.
The study of the GRP map was to assess the areas of surface water that can infiltrate into the groundwater aquifer. It studies the factors affecting the infiltration of water by the weighted overlay analysis process, which is widely studied, especially in Asia (Yeh et al., 2009; Adham et al., 2010; Gupta and Srivastava, 2010; Abdalla, 2012; Magesh et al., 2012; Mukherjee et al., 2012; Lee et al., 2012; Nag and Ghosh, 2013; Patil and Mohite, 2014; Chotpantarat et al., 2014; Rahmati et al., 2015; Deepa et al., 2016; Selvam et al., 2016; Senanayake et al., 2016). Weighted overlay analysis was applied, based on the sum of the weight (W) values multiplied by the rate (R) values of each factor. This method can be applied to other areas, but appropriate influencing factors must be properly used. The current study followed that of Selvam et al. (2016), since their study area was similar in terms of topography, geology, and rainfall amount, which results in the recharge of groundwater. Furthermore, the study of Yeh et al. (2009) found that the lithology to reduce uncertainty in defining lineaments and drainage factors was critical. In this study, lithology was assigned as the major influencing factor.
The benefits of GRP mapping from the work studied above can be summarized into three aspects: to identify groundwater well drilling locations (Chotpantarat et al., 2014; Patil and Mohite, 2014; Selvam et al., 2016), to plan groundwater resource surveys (Adham et al., 2010; Abdalla, 2012; Rahmati et al., 2015), and to serve as a database for sustainable water management (Lee et al., 2012; Magesh et al., 2012; Deepa et al., 2016; Senanayake et al., 2016). We will use the results of this study as information to support the project of groundwater surveys in agriculture and sustainable water management services in the study area in accordance with the Sustainable Development Goals (SDGs) of the UN.
The lower Khwae Hanuman (LKH) sub-basin is one of the areas that suffers from a surface water shortage problem in the dry season, which must be resolved. The initial solution is to pump groundwater to replace surface water but more serious problems may occur if intensive pumping without the proper groundwater management. An understanding of the amount of water recharge to the groundwater aquifer could create optimal conditions for future water management and benefit people in the area. The study area has a water shortage problem from industrial estates, agricultural activities, and residential consumption, especially in the dry season (DGR, 2008). In the future, water demand should increase (DGR, 2008) due to the increase of industry and other populations. The Khwae Hanuman sub-basin is a tributary of the Prachin Buri Basin and the origin of rivers in the eastern part of Thailand, such as the Bang Pakong River, the main one. Thus, groundwater recharge must be studied to evaluate the GRP map to increase groundwater resources in order to mitigate water shortage problems.
Even we did not determine the weight of different effective factors, but we selected the proper weight and important parameters using different validation techniques, including sensitivity analysis as follows. We have studied the relevant research above and applied various techniques in our study. In this study, we created a GRP map in different groundwater potential zones, and calculated the amount of recharged water to the groundwater aquifer. Then, we verified the accuracy and reliability of GRP maps by comparing with specific capacity of pumping wells (SPC) and the ROC analysis (Rahmati et al., 2015). As for the amount of recharged water to the groundwater aquifer, we used the SBF technique for validation (Yeh et al., 2014). Importantly, we also analyzed the sensitivity of influencing factors affecting GRP, which revealed the influencing factors being not similar to the previous studies.
In this study, we used a weighted overlay analysis and generated a GRP map by selecting influencing factors related to groundwater supplementation from previous studies, we selected the six most commonly used influencing factors: lithology, lineaments, density, drainage density, slope, and land use. The sensitivity of all six influencing factors was studied by a map-removal sensitivity analysis technique and validated the GRP maps by comparing them with specific capacity values and the receiver operating characteristic (ROC) analysis. Finally, water management guidelines are studied according to Sustainable Development Goals (SDGs).
Materials and Methods
Description of the Study Area
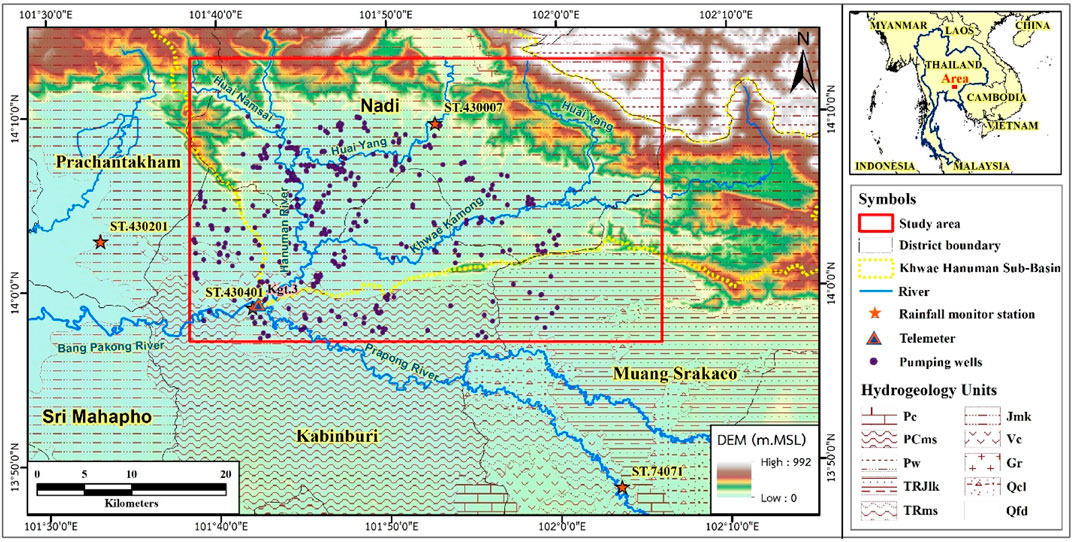
The study area is the LKH sub-basin (Figure 1), part of the Prachin Buri Basin, which covers the Nadi and Kabinburi Districts, Prachin Buri Province. The area is about 1,500 km2, bounded by longitudes 101o 38′ 15.86″ to 102o 6′ 13.37″ E and latitudes 13o 57′ 7.19″ to 14o 13’ 2.64” N. On the north side, the topography is high mountains (the Khao Yai and Tub Lan National Parks), and is the origin of rivers in this area. The center of the study area consists of plains, with many rivers and sub-rivers, including the Khwae Hanuman, Prapong, Huai Sai Noi, Huai Sai Yai, Huai Prayathan, and Huai Samong Rivers. On the south side, the outlet of the surface water is located and is also the confluence of the Hanuman and Prapong rivers. The mean annual rainfall from 1977 to 2006 was 1,415.37 mm/y (Thailand Meteorological Department, TMD). There are four rainfall monitor stations, found in the fairly uniform topography and distributed in study areas: Nadi station (St.430007 at 101o 52′ 49.97″ E, 14o 09′ 28.97″ N), Kabinburi station (St.430401 at 101o 42′ 00.00″ E, 13o 59′ 00.00″ N), Prachin Buri station (St.430201 at 101o 22′ 00.00″ E, 14o 03′ 00.00″ N), and Muang Sakaeo station (St.74071 at 102o 03′ 35.00″ E, 13o 48′ 29.00″ N), There are 383 pumping wells (collected from the DGR, 2019) distributed in study areas and 1 streamflow station (Kgt.3 at 101o 42′ 19.40″ E, 13o 59′ 12.10″ N) established by the Royal Irrigation Department (RID, 2016), shown in Figure 1. The rainy season of Thailand generally occurs mid-May to mid-October and the monthly rainfall data of the study area is shown in Table 1. The major geological features, determined from geologic maps of a 1:50,000 scale obtained from the DMR are sandstone, siltstone, and conglomeratic sandstone. From the 1:100,000 scale hydrogeological map of DGR (2001), more than 70 percent of the groundwater aquifer of the study area are located in the Jurassic middle Khorat (Jmk) aquifers (Figure 1), consisting mainly of sandstone and siltstone ranging from 30 to 60 m deep from the ground surface. Groundwater is found in fractures of this aquifer, but the fracture is not fully connected, therefore providing less groundwater (2–10 m3/h).
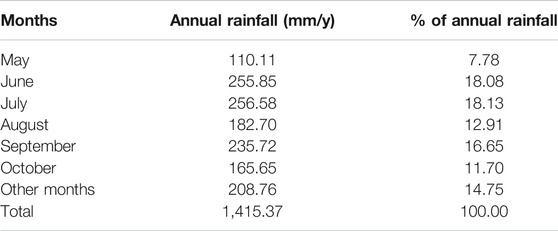
TABLE 1. The monthly rainfall during the rainy seasons (from May to October) of the study area (information from TMD, 1977–2006).
Factors Affecting GRP
In the study of articles on the assessment of GRP map by weighted overlay analysis in different areas including Bangladesh (Adham et al., 2010), Egypt (Abdalla, 2012), India (Gupta and Srivastava, 2010; Magesh et al., 2012; Mukherjee et al., 2012; Nag and Ghosh, 2013; Patil and Mohite, 2014; Deepa et al., 2016; Selvam et al., 2016), Iran (Rahmati et al., 2015), Korea (Lee et al., 2012), Taiwan (Yeh et al., 2009), Thailand (Chotpantarat et al., 2014; Konkul et al., 2014), and Sri Lanka (Senanayake et al., 2016). It was found that the factors affecting the infiltration were similar and different (Table 2) including land use, lineaments, drainage, slope, soil, lithology, geology, geomorphology, topography/digital elevation model (DEM), and rainfall. We then compared the percentages of influencing factors influencing water infiltration from the above studies, it was found that more than 50% of the influencing factors used in the study were lineaments density (100%), drainage density (86%), land use (79%), slope (79%), lithology (57%), and soil (50%). Therefore, the above six influencing factors were selected for this study. This factor was linked to the hydraulic properties of unconsolidated and consolidated aquifers, investigated by the Department of Groundwater Resources (DGR) in the study area. This renders the recharge potential map more reliable. The weight overlay analysis method is recognized to successfully assess the potential area of groundwater recharge, and can further analyze influencing surface water and groundwater management.
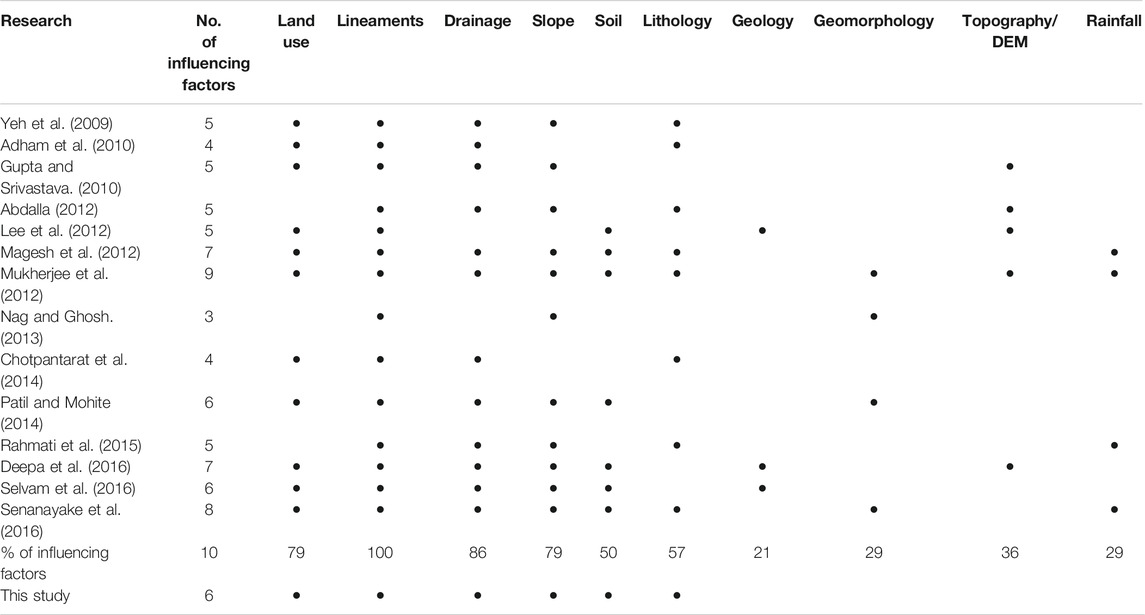
TABLE 2. Lists of various major studies from different parts of the world based on GIS techniques for estimating GRP.
Lithology: Su (2000) and Shaban et al. (2006) showed that rock fractures have a direct relationship to recharge, in which each stone has a different water body; the rate of water recharge is equal. According to O’Leary et al. (1976), the groundwater recharge is notably affected, depending upon various types of rock exposed at the Earth’s surface (outcrop). Some investigations ignored this factor, having used other physical characteristics associated with secondary porosity instead, such as lineaments and drainage (El-Baz and Himida, 1995).
Slope gradient: the slope gradient is a dominating factor that influences the infiltration rate of rainfall (Selvam et al., 2014; Deepa et al., 2016). At higher, steeper slopes, the volume of groundwater recharge is lower, as the water rapidly flows over the surface and has insufficient time to infiltrate the saturated zone, while the flatter plain areas can drain the overflow water, and enhance the groundwater recharge.
Drainage density: based on Ramingwong (2003), landform and drainage characteristics are related to their hydrogeology and hydrology, given that drainage water may be water recharge or discharge. The drainage density defines the potential of the groundwater recharge area (Yeh et al., 2009), where drainage networks are based on lithology, yielding a significant infiltration rate index. Low drainage density has a high void ratio, indicating high potential for groundwater recharge (Murthy, 2000; Kumar et al., 2007).
The length of drainage density, Dd (km−1) is derived from the total drainage length, divided by each intersecting area (Greenbaum, 1985), using Eq. 1;
where
Lineament density: O’Leary et al. (1976) proposed that lineaments are simple, with complex linear properties of various geological structures: for example, faults, joints, cleavage, and open fractures. According to Kumar et al. (2007) and Selvam et al. (2014), in a hard rock landscape, the lineaments represent the fault and fracture zones that result in increased secondary porosity and permeability. As such, lineaments are good indicators of groundwater recharge, and are generally referred to as a remote sensing analysis of fractures or structures (Yeh et al., 2009). The length of the lineaments’ density, Ld (km−1) is derived from the total lineament length per unit area, as in Eq. 2;
where
Land use: land uses are important influencing factors in groundwater recharge (Chotpantarat and Boonkaewwan, 2018). Leduc et al. (2001) found that one of its main contributions affects the volume of groundwater recharge into the aquifer as related to the changes in land utilization. The study of Patil and Mohite. (2014) and Shaban et al. (2006) and concluded there were three main routes of vegetation cover affecting groundwater recharge.
Soil: soil is a significant influencing factor in groundwater recharge and runoff (Murthy, 2000) as it is the medium through which water must penetrate to get into the water table. The water-holding capacity and permeability of the soil become correlated parameters, depending on soil types. Soil types are a more important influencing factor in determining groundwater recharge in agricultural areas. However, soils play an important role in promoting or inhibiting groundwater recharge, as well as assessing groundwater quality (Lillesand and Kiefer, 1987; Chotpantarat et al., 2011; Baghapour et al., 2014; Masipan et al., 2016; Selvam et al., 2016).
Datasets
The lithology data from the 1:50,000 scale geological maps of the Department of Mineral Resources or DMR (2007) and the 1:100,000 scale hydrogeological maps of the DGR (2001); this pertains to Prachin Buri and Sa Kaeo Provinces, which reveal the study area is composed of sandstone, siltstone, and conglomeratic sandstone of the middle Khorat group, with units of sedimentary rock, such as alluvial and fluvial deposits. Some areas are composed of limestone in the Saraburi group. This converges from the study of Selvam et al. (2016) since they focused on a geological map, but did not include the hydrogeological characteristics for consideration. This study assigned percolation values of lithological units, based on the infiltration rate. The lithological weighting and rating of rock units in the study area were classified as sediment or sedimentary, metamorphic, and igneous rocks. The porosities of sedimentary rocks generally range from 10 to 30%, depending upon the secondary porosity caused from fractures. Moreover, well sorted and little cemented with well-fractured sandstone formation has very high porosity of 30% while crystalline rocks, including igneous rocks and metamorphic rocks generally have the lowest primary porosity because they occur at depth and interlocking crystals, but porosity is in the form of fractures (secondary porosity) (Davis, 1969). Therefore, in this study area, sedimentary rocks are considered to have the highest potential for groundwater recharge, due to high porosity and permeability, while igneous rocks are considered to have the lowest groundwater potential, due to low porosity and permeability.
The slope is represented as a percentage, based on the Digital Elevation Model (DEM) raster information (90 × 90 m resolution), developed by the Royal Thai Survey Department or RTSD (2008), which were analyzed together with the 1:50,000 scale topographic map (RISD, 2001). Slope gradient values were calculated by the opposite angle (rise), divided by the adjacent corner (run) and multiplied by 100. The slope is classified as six degrees of its gradient, as per the work of Selvam et al. (2016). If the slope is greater than 5o, the precipitation rapidly runs off, but does not easily store water. If the slope is 0–1o (the plains), the precipitation infiltrates the saturated zone.
For the assessment of the drainage density is determined by stream data, from the Department of Water Resources or DWR (2010) together with the 1:50,000 scale topographic map (RISD, 2001). The dendritic drainage pattern is distributed in the northern area of this study. Most of the drainage density map ranges from 0 to 3 m−1, signifying a high recharge potential. The assessment of the lineaments’ density is based on structural geological map obtained by interpreting 1:50,000 scale aerial photographs by the DMR (2010). Lineament is the linear geomorphic feature that appears on the Earth’s surface. The lineament density in this study was interpreted from the structural geological map of DMR (2010) together with aerial photographic of DMR (2010). In aerial photographs, many non-geological linear features such as roads and land use can be found causing errors in linear characterization. Therefore, this study focused on linear data from the structural geological maps rather than aerial photographs. When complete data is prepared, then take these data into the kernel density analysis process by ArcGIS software. The lineaments of the sub-basin are distributed upstream, with a high lineament-length density of approximately 1.2–2.0 km−1, for a high recharge potential with increased porosity and permeability.
The land use data in this study are based on the 1:50,000 scale land use map from the Land Development Department or LDD (2002). The main land use was cultivated land and was then forest. The water body area has a high recharge potential, because the water is present at all times. The soil data in this study was based on the 1:50,000 scale soil map from the LDD (2010), most of the high porosity (Brassington, 1988) and hydraulic conductivity (Fetter, 2001) sediments, such as fine sand, silt, and gravel, covers area approximately 90% of the area, while coverage area of the low hydraulic conductivity sediment, clay, is less than 10% of the area (Figure 5F). The weighting and rating of soil were classified as three types, again using the method of Selvam et al. (2016). In this study area, soils with high water-holding capacity consisted of fine sandy silt and silty sand, which were mainly located at the central part of the study area.
Methodology
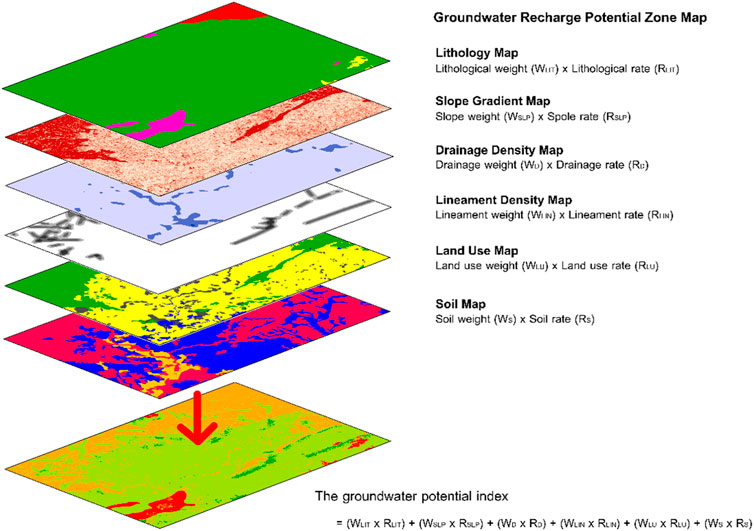
The data get integrated within the GIS. The distribution of the GRP zones is represented as a potential map, shown as a flowchart in Figure 2.
The distribution of GRP zones is divided into five periods (UN, 1967), including very high, high, medium, low, and very low, comparing to the rainfall is 45–50% (0.475 ratio), 30–35% (0.325 ratio), 10–20% (0.150 ratio), 5–10% (0.075 ratio), and less than 5% (0.025 ratio), respectively.
Although many researchers used the GIS process to determine GRP (Shaban et al., 2006; Yeh et al., 2009; Adham et al., 2010; Patil and Mohite, 2014; Chotpantarat et al., 2014; Deepa et al., 2016; Selvam et al., 2016), the map has not been evaluated in the Khwae Hanuman sub-basin at the mountains on the north side. In this study, different weights and rates of the influencing factors under several conditions were evaluated on the basis of the physical properties of the LKH sub-basin, for lithology, drainage density, lineament density, and land use. Other researchers (Magesh et al., 2012; Mukherjee et al., 2012; Patil and Mohite, 2014; Deepa et al., 2016; Selvam et al., 2016; Senanayake et al., 2016) used slope and soil factors for groundwater recharge, which was added to this study. Most previous studies have used a weighted overlay analysis method that determines the weight and relative rate of influencing factors. In other words, the influencing factor in the research was more weighted than the less influencing factor, which was also done in this study. The weight value refers to the priority of influencing factor on groundwater recharge, ranging from the highest to the lowest value. The weight depend on the suitability and ability to groundwater recharge for each influencing factor. The analysis of weighting for each influencing parameter are based on a process in Figure 3 and Table 3 (Yeh et al., 2009; Adham et al., 2010; Chotpantarat et al., 2014; Deepa et al., 2016; Selvam et al., 2016). Finally, the total weight of each factor is the weight affecting on the high weight of recharge potential. The high weight value appears to be more important for groundwater recharge; for example, lithologic factors can be separated as a sandstone factors, which has a higher weight than granite rock and a higher porosity percentage. Thus, groundwater flows through sandstone better than granite rock. This study determined the relative rate value of each factor in Table 3. The weight and relative rate of the six influencing factors on groundwater recharge were categorized based on their values.
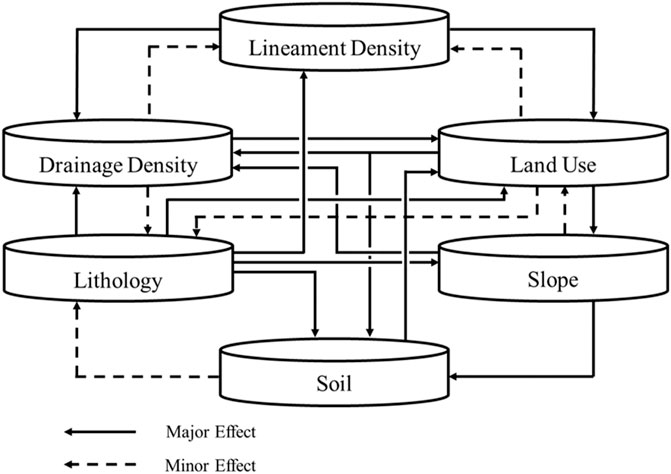
FIGURE 3. Interaction of factors that affect the recharge property; modified from Selvam et al. (2016).
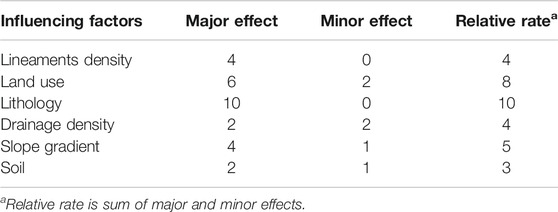
TABLE 3. The process of determining the relative rate of each factor (modified from Selvam et al., 2016).
The weighted overlay analysis of the influencing factors associated with the recharge is important in the construction of the GRP map, depending on the importance of the influencing factors. Figure 3 shows the correlation of influencing factors, whereas factors being scored of 2 or 1, depending on the major effect or minor effect between each influencing factor. A major effect was equal to 2 points while having a minor effect of 1 point. The cumulative weight of both the major and minor effects was the calculation of relative rates, for example, lithology was the most influencing factor with five major effects: land-use, drainage, lineament, slope, and soil (Figure 3), therefore, it had a relative rate of 10 (2 + 2 + 2 + 2 + 2), which similar to Selvam et al. (2016) as shown in Table 3.
The lithology map ranged from low to high, depending on the type of sandstone, siltstone, shale, and limestone. The land use map was analyzed based on water bodies, cultivated lands, forests, and settlements with different values of water infiltration, but with values ranging from good to very high. The lineament density map ranged from low to high, where a high value indicated very high recharge potential, although a low density did not indicate low recharge potential. The drainage density map ranged from moderate to high, where low drainage density corresponded to a high recharge potential zone. The soil map ranged from low to high, where high soil value was defined as high permeability, with high recharge. The slope map ranged from very low to very high.
The relative rating was related to the volume of groundwater recharge influencing factors, as it refers to other factors affecting groundwater recharge in the aquifer, where the interrelationship was determined through major and minor effects (Selvam et al., 2016), the proposed relative rates of all influencing factors were reclassified and classified for subfactors.
Spatial analysis was used to integrate the GIS multilayer system to achieve the GRP map. Once the GRP map is completed, the spatial recharge potential is calculated to lead to an estimate of the amount of water recharged in the area, which can be easily calculated by applying the UN (UN, 1967). Finally, the volume of water that could infiltrate the groundwater aquifers was calculated using Eq. 3 (Shaban et al., 2006; Adham et al., 2010; Deepa et al., 2016);
where V is the recharged water volume (L3/T), P is the precipitated volume (L3/T) calculated from the annual rainfall, multiplied by the size of the study area, RR is recharge ratio (the ratio of potential for groundwater recharge to the groundwater aquifer) and percentage of recharge area is spatial recharge potential ratio from study results (GRP map). The volume of recharged water was calculated as the percentage of groundwater potential maps, derived from the six weighted influencing factors that affect groundwater recharge, as mentioned earlier. The SBF technique (Yeh et al., 2014) was conducted to compare the groundwater recharge obtained from the recharged water volume calculation.
River flows are divided into two groups: surface flow and subsurface flow (Sophocleous, 2002; Choi et al., 2018). Baseflow refers to the flow rate of groundwater to surface water, and baseflow generally correlates with geologic reservoir properties (Eckhardt, 2008; Hong et al., 2015; Lee et al., 2018). The separation of baseflow involves simple groundwater budgets for small basins, the infiltration rate is calculated from Eq. 4 as follows (Cherkauer and Ansari, 2005):
where I is the infiltration rate (L/T); GWin is the amount of water inflow (L/T); Qbf is the groundwater discharge to the stream (L/T); GWout is the amount of water outflow (L/T); ET is the evapotranspiration (L/T); NP is the net pump of groundwater by people (L/T); ΔS is the change in water storage (L), and t is the time of change in water storage (T).
If a watershed can be selected provided that the values of GWin, GWout, NP, ΔS/t are equal to 0, and if groundwater recharge is defined as net recharge (I − ET), then Eq. 4 is reduced to
Weight Overlay Analysis and Recharge Water Volumes
An overlay analysis map is a decision-making tool for the multi-criteria comprehension of complex problems. The overlay analysis process (Figure 4) is used to determine the rate and the weight of each factor, and the results of each factor are shown in Figure 5. All thematic maps allocated with their weighted rating were converted into raster format and generated by a weighted overlay analysis.
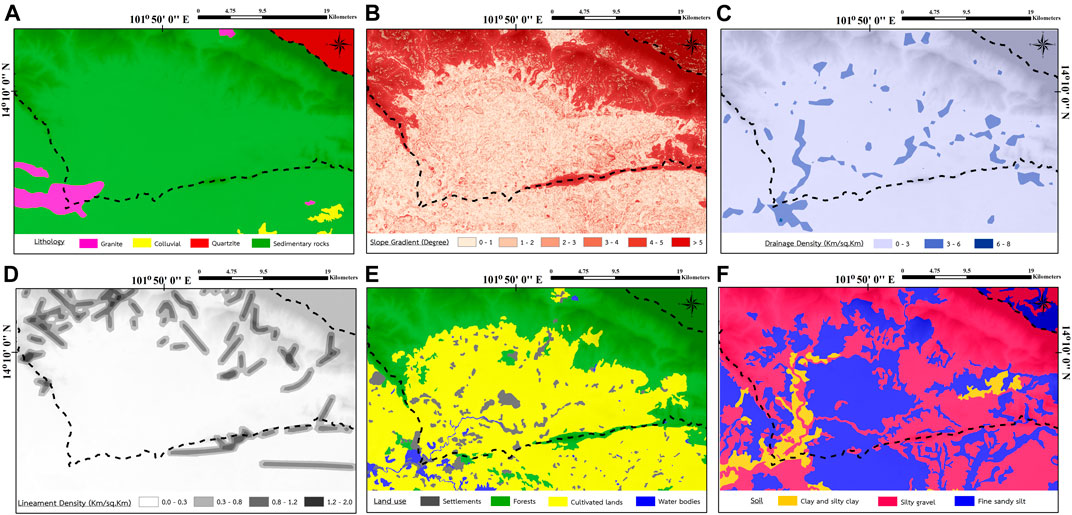
FIGURE 5. Factors affecting the GRP of the LKM sub-basin, Prachin Buri Province, Thailand: (A) Lithology map, (B) Slope gradient map, (C) Drainage density map, (D) Lineaments’ density map, (E) Land use map, and (F) Soils map.
Each individual recharge potential factor can contribute to a different degree in the process (or groundwater recharge in the subsurface environment). Determination of the rating was related to volume of GRP factors. The six influencing factors were plotted over a range, from very low to very high, where very high rate was assigned a rate of 10 and very low rate was assigned a rate of 1. All influencing factors were integrated to obtain the recharge potential map. An association between the two factors was assigned a rate of 2.0, while a minor association was assigned a rate of 1.0. Lithology had a major association with all five influencing factors (e.g., lineaments’ density, drainage density, slope gradient, soil, and land use), so the evaluated rate was 10.0. The process for determining the rate of each factor is shown in Table 3. The rated values for the lithological factor were highest, as they were directly related to other soil factors: the soil’s physical properties are different from weathering processes and parent materials. The high mountainous areas affect the slope factor, as well as geological factors.
The polygon area was applied to assess the rate of each individual factor for groundwater recharge, based on the six characteristics in the current study area. The relative rate of each corresponding recharge potential factor is shown in Table 3, where they were integrated, with the obtained total weighting assessment obtaining the recharge potential factor (Khawlie, 1986; Shaban et al., 2006). The Groundwater Potential Index (GPI) was calculated from Eq. 6 (Selvam et al., 2016),
where; WLIT is the weighted value of the lithological factor; RLIT is the rate of the lithological factor; WSLP is the weighted value of the slope factor; RSLP is the rate of the slope factor; WD is the weighted value of the drainage density factor; RD is the rate of the drainage density factor; WLIN is the weighted value of the lineaments’ factor; RLIN is the rate of the lineaments’ factor; WLU is the weighted value of land use factor; RLU is the rate of land use factor; WS is the weighted value of the soil factor; RS is the rate of the soil factor.
The results from Eq. 6 were then used to calculate the percentage of recharge potential factors (RP), following Selvam et al. (2016) by Eq. 7;
where W is the weight and R is the rate. The weight and rate are combined by Eq. 7 to assess the percentage of the capacity potential of water. RP values of each influencing factor are shown in Table 4: the recharge potential zone map was created (Figure 6), and the recharged water volume (V) was determined with Eq. 3.
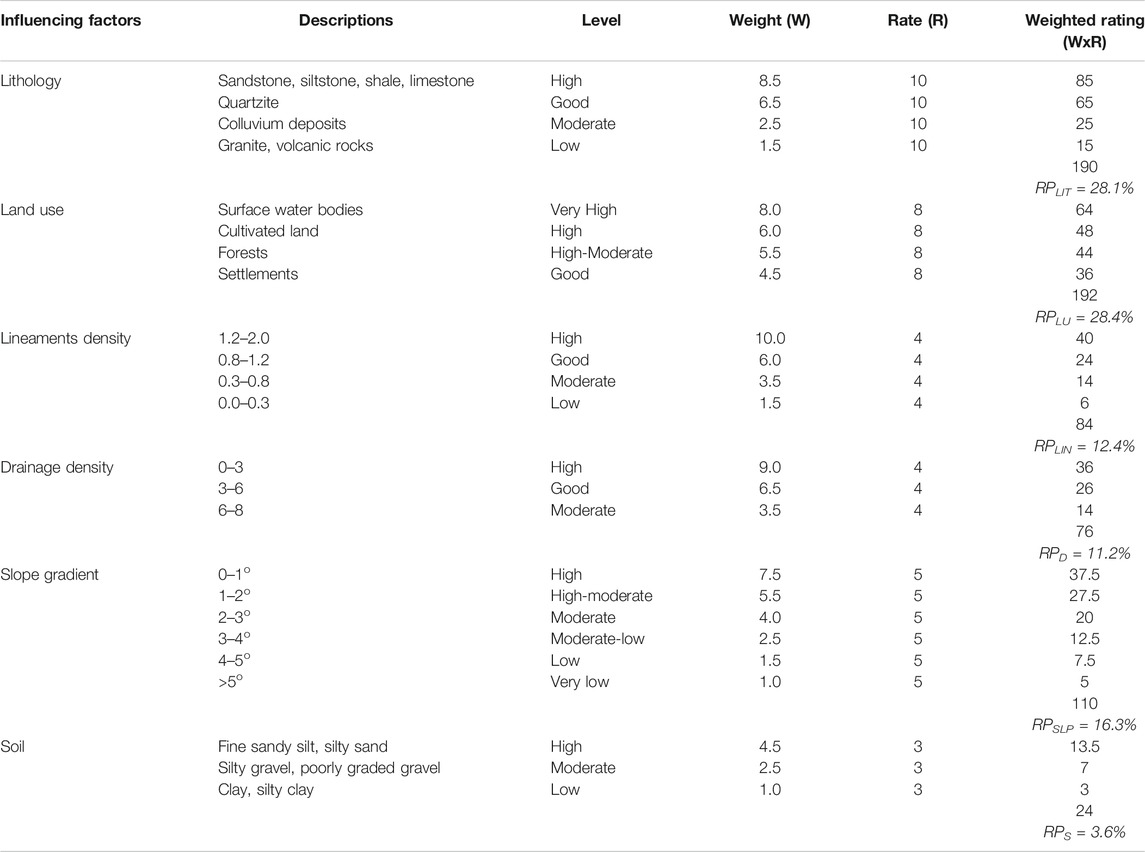
TABLE 4. Weights and rates of the recharge potential influencing factors (modified from Selvam et al., 2016).
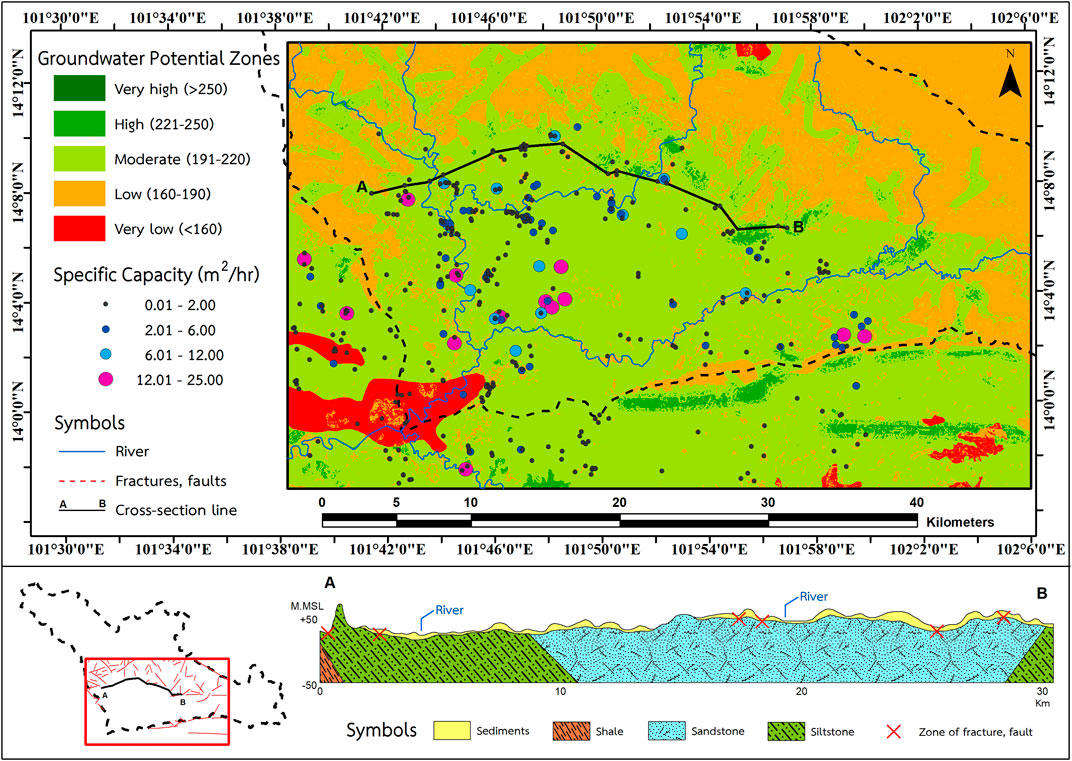
The GRP zone was divided into five classes: very high, high, moderate, low, and very low, based on the analysis of six influencing factors of GRP. The high GRP zone was concentrated in the central plains, due to distribution of the lithology, slope gradient, and agricultural land, with high infiltration ability. The density of drainage resulted in the stream-flow infiltrate of the groundwater aquifer. Also, the density of lineament on top of the study area allowed water to recharge into the aquifer.
Sensitivity Analysis
Sensitivity analysis is an analysis of the influence of the rate and weight of each factor related to the GRP, so a sensitivity analysis can determine which influencing factors are important to a GRP map. In this study, the sensitivity analysis was performed using a map-removal sensitivity analysis (Lodwick, et al., 1990; Fenta et al., 2015), where one influencing factor was removed and the remaining influencing factors were calculated using the weighted overlay analysis. The sensitivity analysis by the map-removal method follows Eq. 8;
where S is the index of sensitivity analysis involved in removing one influencing factor associated with the GRP map. G is the GRP index calculated using all influencing factors related to GRP whereas G′ is the GRP index calculated by the exclusion of one of the influencing factors associated with the GRP where Nf and Nf’ were the number of influencing factors to overlay for calculating G and G′, respectively.
Accuracy Assessment
The validation of GRP maps in this study was based on a comparison between GRP maps and the specific capacity (SPC) of well obtained in the field (Mukherjee et al., 2012; Rahmati et al., 2015). SPC is defined the groundwater potential, can be pumped for each pumping well. A well with a high SPC is a well that can provide a large volume of groundwater (Ramingwong, 2003). The SPC value can be calculated from the groundwater yield (Q) divided by the drawdown (DD). Therefore, this study uses SPC data to verify the reliability of the GRP map. The idea of validation of this study is that a well with a high SPC of pumping wells will have a lot of groundwater; on the other hand, if the pumping wells have a low SPC, it will have less groundwater potential. Therefore, the pumping wells with high SPC should be located in a high potential area, indicating that the GRP map is highly accurate. The results obtained from the validation of the GRP map were presented in the percentage comparing to 383 pumping wells obtained from DGR (2018) in the study area.
The ROC curve is a graphical representation of the comparison between false-positive rates (X-axis) and positive values (Y-axis) for every possible cutoff value, the area under the curve (AUC) shows the accuracy of the prediction system (Mohammady et al., 2012; Rahmati et al., 2015). In this study, another ROC technique was used to validate the GRP map using SPC data of 383 pumping wells from DGR.
The SBF technique was used to assess groundwater recharge at the mountain basin level, by separating the baseflow from the total streamflow to obtain amount of groundwater recharge. This technique has the advantage of integrating groundwater recharge across the basin without a hydrogeological model (Yeh et al., 2014). In this study, we applied the SBF technique to validate the amount of groundwater recharge to the groundwater aquifer using the weighted overlay technique and the calculation from Eq. 3. This average groundwater recharge was based on monthly streamflow data of the river station Kgt.3 from 1977 to 2006 (RID, 2021). In this study, streamflow data during the dry season (Nov.–Apr.) were chosen to avoid excessive rainfall during the rainy season.
Results
The present study used a classification of six influencing factors (lithology, slope, drainage, lineaments, soil, and land use) with different levels of effect on the water recharge potential (Figure 5) and the effect of each factor used a different method for evaluation. Weighting the effect of each factor revealed lithology has the most influential impact. The description of each factor ranged from very high to very low, all integrated to obtain the recharge potential map.
The GRP zone map (Figure 6) was described by the five levels of potential recharge areas in descending order: very high, high, moderate, low, and very low, with occupied areas of 0.00 km2 (0.00%), 33.88 km2 (2.3%), 971.73 km2 (64.8%), 442.15 km2 (29.5%), and 52.23 km2 (3.5%), respectively. The highest area was categorized by a moderate recharge potential zone that occupied 64.8% of the whole area. In comparison to the UN (UN, 1967), the values of the recharge potential are obvious in the GRP map, with these levels characterized in Table 5. However, the amount of recharged water (V) in this area was performed by a basic estimation of recharge rates from Eq. 3. The annual rainfall was 1,415.37 mm/y, the precipitated volume (P) of this area is around 2,123.06 million m3/y, yielding a recharged water volume of 271.75 million m3/y (approximately 181.2 mm). This indicates that only 12.8% of the precipitated water in the area was recharged into the groundwater, the rest being lost due to evapotranspiration or surface runoff. The calculated of the amount of recharged water (V) is determined from Eq. 3 as follow:

TABLE 5. Recharge potential categories and area of recharge potential according to UN (1967).
From collecting data and studying the amount of streamflow during the dry season (Nov.-Apr.) of 1977–2006, it was found that the average amount of streamflow was about 245.0 million m3/y, which is approximately 163.4 mm (RID, 2021).
The result of sensitivity analysis of the GRP map (Table 6) found that the high sensitivity index when was remove the lithology factor from the weighted overlay analysis (average of the sensitivity index = 4.76%) due to the high determination of the relative rate of the lithology factor (Table 3). The moderately sensitive factors were lineament density and soils with an average change index of 2.54 and 2.37%, respectively. The less sensitive factors include the slope gradient, land use, and drainage density with an average index of sensitivity analysis of 0.32, 1.32, and 1.29%, respectively.
Therefore, the validity of the GRP map was checked against the specific capacity of the 383 pumping wells (collected from the DGR, 2018) is shown in Table 7, It was found that the GRP area was consistent with the specific capacity data, which derived from the maximum pumping rate (Qmax) divided by drawdown (DD) of each individual well. There are four classes of specific capacity as follows: very low (3.40%), low (10.18%), medium (86.16%) and high (0.26%). Most groundwater wells (>96%) with average specific capacity of 0.78 m2/h and 1.86 m2/h categorized into the classes of low and moderated, which agree to the map showing the GRP zones.
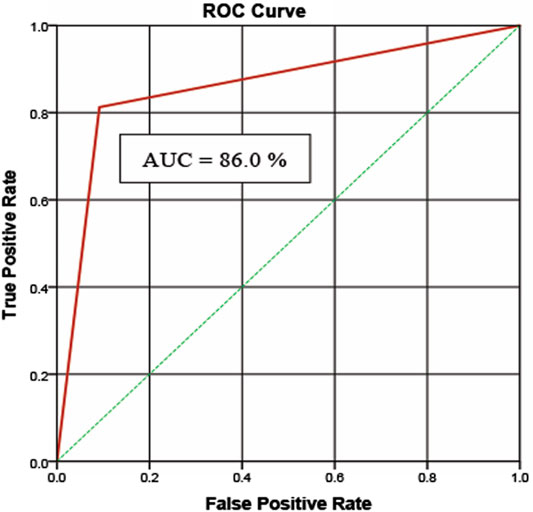
For validation with the ROC technique by comparing the existing SPC data with the GRP maps obtained from the study results. Figure 7 shows the ROC curve showed that in the GRP map using the weighted overlay technique, the AUC value was 0.860, corresponding to a prediction accuracy of 86.0 percent.
Discussions
As comparing the results to the 1:100,000 scale hydrogeological map of the DGR (2001), most of the area of moderate GRP was found in the Jmk aquifer (sandstone and siltstone), due to the discontinue fractures in the aquifers.
The assessment approach for evaluating GRP, using GIS in this study, should be applied in other areas with similar physical characteristics; however, geological characteristics of the selected area should be less complicated to allow for a straightforward rate setting of the corresponding recharge potential factors. To test the accuracy of the predicted recharge potential map, secondary data must be checked in conjunction with field data, where the factors affecting GRP will be integrated with other information, such as geomorphology, evapotranspiration, specific yield of groundwater, and transmissivity. The study should be performed with a numerical model, yet the information in this study must also be updated, as secondary data for constructing the GRP map is not recent. A reliable recharge map needs more current information, when it is available.
Groundwater recharge may be overestimated when baseflow separation for streamflow is applied in mountainous areas (Chen and Lee, 2003; Lee et al., 2006). To avoid this problem, we considered the amount of streamflow during the dry season, the average groundwater recharge over 30 years (from 1977 to 2006) is approximately 245.04 million m3/y (∼163.4 mm), with a standard deviation (SD) of 96.90 mm. Comparing with the amount of groundwater recharge to the aquifer from the weighted overlay method and the calculation in Eq. 3, the amount of recharge into the groundwater aquifer was approximately 271.75 million m3/y (or 181.2 mm), which had a slightly higher annual groundwater recharge value than that of SBF technique, but it appeared to be statistically acceptable. Therefore, the estimation of groundwater recharge by the SBF technique may help to confirm the result of the weighted overlay and calculation technique in this area.
The GRP sensitivity analysis index, lithology was the most efficient factor in GRP mapping (average of 4.76%), which lithology factor has a high sensitivity analysis index due to the high relative rate determination. In the case of soil factor that has a very low relative rate (Table 3), but found to be moderate sensitivity (Table 6) because the study area was found to be fine sand with high water permeability, hydraulic conductivity (Fetter, 2001) and porosity (Brassington, 1988), which can be found in more than 55% of the area (Figure 5F). The cause of the abundance of fine sand sediments is the weathering and erosion of the Jurassic era sandstone on the north side of the area (data from the DMR, 2001). From Table 4, it is found that fine sand has the highest weight of the soil factor when multiplied with the relative rate and then makes a higher weighted rating value. This has a significant effect on the GRP map. Finally, when calculating the sensitivity by a map-removal sensitivity analysis technique, it was found that the soil factor sensitivity index of the GRP map was moderate.
The validity of the GRP map was found that the GRP area was consistent with the specific capacity data. Most groundwater wells with an average specific capacity of the classes of low and moderated, which agree with the map showing the GRP zones. However, the high recharge area was inconclusive due to insufficient specific yield and drawdown data. Furthermore, some locations of the study area found that the GRP was low to very low zones, but it was able to pump up in large amounts of groundwater (high specific capacity) since they are affected by the structural geology such as fault line. Therefore, this might be the limitation of this technique in some complex geological characteristics since the fault and/or fractures underneath the ground surface can behave as groundwater storage and have high permeability, resulting in large amounts of groundwater flowing into the groundwater wells nearby (Figure 6).
Validation is the most important process in map modeling, if there is no validation of the model will be of no scientific importance (Chang-Jo and Andrea, 2003). Figure 7 shows the ROC curve of the GRP map using the weighted overlay technique and corresponds to a prediction accuracy of 86.0 percent. Thus, in this study, the GRP map is reliable and acceptable accuracy. It was also concluded that the weighted overlay technique method could be used as a simple tool for assessing GRP.
Based on the final results, we can plan to manage the water shortage problem in the study area during the dry season (DGR, 2008) by defining groundwater pumping areas in the moderate to high GRP area, which is approximately 1,005 km2 (61%). The recharge potential area can be calculated for the amount of groundwater that can be used, according to the application of the UN formula (UN, 1967). It is estimated that there are approximately 222 million m3/y (82%), which can be pumped without affecting the natural groundwater balance as it has recharge to the groundwater aquifer in the rainy seasons. It is in line with the sustainable development goals (SDGs) in goal number six of the UN, ensure availability and sustainable management of water and sanitation for all, which has goals related to water efficiency and solving water shortages.
Conclusion
In this region, the fracture sandstone and siltstone have moderate GRP, but the groundwater recharge is about 181.2 mm when the dry season water reserve is approximately 272 million m3/y. Therefore, this area has enough water to meet the agricultural needs during the dry season. In addition, the southern area of the study area (outlet of LKH sub-basin) has low infiltration GRP, but this area has not faced drought problems in the dry season since the area is located in the confluence of 2 rivers (Figure 1), thus mainly supporting water for agricultural activities.
The purpose of this study was to use GIS techniques to create a GRP map using the GIS weighted overlay assessment technique. The weighted overlay techniques are used to combine factors related to groundwater recharge. The weighted overlay technique is one of the powerful tools for combining different datasets from different data sources. This technique is suitable for mapping GRP in the LKH sub-basin area using six influencing factors: lithology, lineaments, density, drainage density, slope, land use, and soil.
The present study was an approach to the quantitative assessment of GRP, with the help of GIS in the LKH sub-basin areas, Prachin Buri Province. An integrated GRP map was prepared and classified with six weighted influencing factors (lithology, lineaments, density, drainage density, slope, land use, and soil). By calculating weights and rates of each factor, the GRP zones were obtained. The main influencing factor was lithology (10.0 rate) and the second was land use (8.0 rate). The study area was found to have high potential groundwater recharge, located in the southern region. Specifically, about 33.9 km2 (2.3% of the study area) had high recharge potential, but about 1,466.1 km2 (97.7% of the area) had a very low to moderate recharge potential zone, with 971.7 km2 (64.8% of the area) having only a moderate recharge potential zone. In addition, 12.8% of total precipitated water (271.75 million m3/y or approximately 181.2 mm) infiltrated the groundwater aquifer, while the rest was lost from surface runoff or evapotranspiration.
Comparison to the results of the study of the amount of GRP using the SBF technique and the weighting overlay technique. It was found that the amount of groundwater recharge from these two methods appear to be similar. However, since the GRP is related to infiltration, the weighted configuration may be more accurate if the infiltration rate and hydraulic conductivity of each factor can be measured in the laboratory or in the field.
The validation of GRP maps showed that the weighted overlay technique of study area and generate GRP maps with fairly good accuracy. Therefore, based on the results of this study and the accuracy of the GRP maps obtained, it can be concluded that the weighted overlay technique is beneficial for the rapid assessment of GRP and can be applied in other fields.
In addition to the method of creating a GRP map obtained from the work studied above, the another method to study the groundwater recharge using isotopic study in the terrace topographic area (Yeh et al., 2009), could be applied for the further study of GRP. For more reliability of the GRP map, it is recommended that the weight values of the effective factors affecting GRP could be introduced by the principal components analysis (PCA) analysis.
The GRP map was congruent with the specific capacity data and can be useful for water management in the future. It provides groundwater recharge information to explore cultivating activities, and may prescribe sufficient pumping rates for long-term sustainable use, without impacting the subsurface environment. The results of this study will focus on substantially increase water-use efficiency across all sectors and ensure sustainable withdrawals and supply of freshwater to address water scarcity and substantially reduce the number of people suffering from water scarcity by 2031, which is the fourth subsection of goal 6, it can also maintain the balance of groundwater in the area.
Data Availability Statement
The raw data supporting the conclusion of this article will be made available by the authors, without undue reservation.
Author Contributions
Conceptualization, SC; methodology, NK; software, NK; validation, NK and SC; formal analysis, NK; investigation, NK and SC; resources, SC; data curation, NK and SC; writing—original draft preparation, NK; writing—review and editing, SC; visualization, NK; supervision, SC; project administration, SC; funding acquisition, SC. All authors have read and agreed to the published version of the manuscript.
Funding
This research was funded by the 90th Year Chulalongkorn University Scholarship, the Grant for the National Research Council of Thailand (NRCT): NRCT5-RSA63001-06, TSRI Fund (CU_FRB640001_01_21_6), and partially supported by the Ratchadaphisek Sompoch Endowment Fund (2021) Chulalongkorn University (764002-ENV).
Conflict of Interest
The authors declare that the research was conducted in the absence of any commercial or financial relationships that could be construed as a potential conflict of interest.
Publisher’s Note
All claims expressed in this article are solely those of the authors and do not necessarily represent those of their affiliated organizations, or those of the publisher, the editors and the reviewers. Any product that may be evaluated in this article, or claim that may be made by its manufacturer, is not guaranteed or endorsed by the publisher.
Acknowledgments
The authors thank the various organizations for providing the data and information for this study; Wiboon Kaentao for advice on the classification of soils; Wisut Chunnet for provision and guidance on the use of the ArcGIS program, and GIS software licensing from faculty of environment and resource studies, Mahidol university. We would like to express our sincere thanks to the 90th Anniversary of the Chulalongkorn University Fund and thanks the Ratchadaphiseksomphot Endowment Fund, Chulalongkorn University for the Research Unit. We are grateful for the thorough reviews by Editor and reviewers. Their valuable comments significantly improved the earlier draft to this article.
References
Abdalla, F. (2012). Mapping of Groundwater Prospective Zones Using Remote Sensing and GIS Techniques: a Case Study from the Central Eastern Desert, Egypt. J. Afr. Earth Sci. 70, 8–17. doi:10.1016/j.jafrearsci.2012.05.003
Adham, M. I., Jahan, C. S., Mazumder, Q. H., Hossain, M. M. A., and Haque, A.-M. (2010). Study on Groundwater Recharge Potentiality of Barind Tract, Rajshahi District, Bangladesh Using GIS and Remote Sensing Technique. J. Geol. Soc. India 75 (2), 432–438. doi:10.1007/s12594-010-0039-3
Baghapour, M. A., Talebbeydokhti, N., Tabatabaee, S. H., and Nobandegani, F. A. (2014). Assessment of Groundwater Nitrate Pollution and Determination of Groundwater Protection Zones Using DRASTIC and Composite DRASTIC (CD) Models: The Case of Shiraz Unconfined Aquifer. J. Health Sci. Surveill. Syst. 2 (2), 54–65.
Brassington, R. (1988). Field Hydrogeology. Milton Keynes, England: Geological Society of London Professional Handbook, Open University Press.
Chang-Jo, F. C., and Andrea, G. F. (2003). Validation of Spatial Prediction Models for Landslide Hazard Mapping. Nat. Hazards 30, 451–472. doi:10.1023/b:nhaz.0000007172.62651.2b
Chen, W.-P., and Lee, C.-H. (2003). Estimating Ground-Water Recharge from Streamflow Records. Environ. Geology. 44, 257–265. doi:10.1007/s00254-002-0753-2
Cherkauer, D. S., and Ansari, S. A. (2005). Estimating Ground Water Recharge from Topography, Hydrogeology, and Land Cover. Ground Water 43, 102–112. doi:10.1111/j.1745-6584.2005.tb02289.x
Choi, B., Kang, H., and Lee, W. H. (2018). Baseflow Contribution to Streamflow and Aquatic Habitats Using Physical Habitat Simulations. Water J. 10, 1–17. doi:10.3390/w10101304
Chotpantarat, S., and Boonkaewwan, S. (2018). Impacts of Land-Use Changes on Watershed Discharge and Water Quality in a Large Intensive Agricultural Area in Thailand. Hydrol. Sci. J. 63 (9), 1386–1407. doi:10.1080/02626667.2018.1506128
Chotpantarat, S., Konkul, J., Boonkaewwan, S., and Thitimakorn, T. (2014). Groundwater Recharge Potential Using GIS Around the Land Development Facilities of Chulalongkorn University at Kaeng Khoi District, Saraburi Province, Thailand. Appl. Environ. Res. 37 (2), 75–83. doi:10.35762/aer.2015.37.2.6
Chotpantarat, S., Limpakanwech, C., and Sutthirat, C. (2011). Effect of Soil Water Characteristic Curves on Simulation of Nitrate Vertical Transport in a Thai Agricultural Soil. Sustain. Environ. Res. 21 (3), 187–193. doi:10.1016/j.serj.2016.04.005
Davis, S. N. (1969). in Porosity and Permeability of Natural Materials: Flow through Porous Media. Editor R. J.M. De Wiest (New York, United States: Academic Press), 54–89.
Deepa, S., Venkateswaran, S., Ayyandurai, R., Kannan, R., and Vijay Prabhu, M. (2016). Groundwater Recharge Potential Zones Mapping in Upper Manimuktha Sub basin Vellar River Tamil Nadu India Using GIS and Remote Sensing Techniques. Model. Earth Syst. Environ. 2, 137. doi:10.1007/s40808-016-0192-9
DGR (2008). Improvement of Groundwater Map at Provincial Project, Scale 1: 4,000, Prachin Buri Province. Bangkok, Thailand: Jirangrat Co Ltd.
Dinesh Kumar, P. K., Gopinath, G., and Seralathan, P. (2007). Application of Remote Sensing and GIS for the Demarcation of Groundwater Potential Zones of a River basin in Kerala, Southwest Coast of India. Int. J. Remote Sensing 28 (24), 5583–5601. doi:10.1080/01431160601086050
Eckhardt, K. (2008). A Comparison of Baseflow Indices, Which Were Calculated with Seven Different Baseflow Separation Methods. J. Hydrol. 352, 168–173. doi:10.1016/j.jhydrol.2008.01.005
El-Baz, F., and Himida, I. (1995). Groundwater Potential of the Sinai Peninsula. Egypt, Project Summery; AID: Cairo, Egypt.
Fenta, A. A., Kifle, A., Gebreyohannes, T., and Hailu, G. (2015). Spatial Analysis of Groundwater Potential Using Remote Sensing and GIS-Based Multi-Criteria Evaluation in Raya Valley, Northern Ethiopia. Hydrogeol J. 23, 195–206. doi:10.1007/s10040-014-1198-x
Fetter, C. W. (2001). Applied Hydrogeology. 4th ed. Upper Saddle River, New Jersey, United States: Prentice-Hall.
Freeze, R. A., and Cherry, J. A. (1979). Groundwater. Englewood Cliffs, New Jersey, United States: Prentice-Hall.
Greenbaum, D. (1985). Review of Remote Sensing Applications to Groundwater Exploration in Basement and Regolith. Br. Geol. Surv. Rep. OD 85, 36. doi:10.1201/b15625-15
Gupta, M., and Srivastava, P. K. (2010). Integrating GIS and Remote Sensing for Identification of Groundwater Potential Zones in the Hilly Terrain of Pavagarh, Gujarat, India. Water Int. 35 (2), 233–245. doi:10.1080/02508061003664419
Hong, J., Lim, K. J., Lim, K. J., Shin, Y., and Jung, Y. (2015). Quantifying Contribution of Direct Runoff and Baseflow to Rivers in Han River System, South Korea. J. Korea Water Resour. Assoc. 48, 309–319. doi:10.3741/jkwra.2015.48.4.309
Khawlie, M. (1986). Land-use Planning for the Development of a Disrupted Urban center: Beirut Lebanon. Int. J. Dev. Tech. 4, 267–281.
Konkul, J., Rojborwornwittaya, W., and Chotpantarat, S. (2014). Hydrogeologic Characteristics and Groundwater Potentiality Mapping Using Potential Surface Analysis in the Huay Sai Area, Phetchaburi Province, Thailand. Geosci. J. 18 (1), 89–103. doi:10.1007/s12303-013-0047-6
Leduc, C., Favreau, G., and Schroeter, P. (2001). Long-term Rise in a Sahelian Water-Table: the Continental Terminal in South-West Niger. J. Hydrol. 243, 43–54. doi:10.1016/s0022-1694(00)00403-0
Lee, C.-H., Chen, W.-P., and Lee, R.-H. (2006). Estimation of Groundwater Recharge Using Water Balance Coupled with Base-Flow-Record Estimation and Stable-Base-Flow Analysis. Environ. Geol. 51, 73–82. doi:10.1007/s00254-006-0305-2
Lee, J., Kim, J., Jang, W., Lim, K., and Engel, B. (2018). Assessment of Baseflow Estimates Considering Recession Characteristics in SWAT. Water 10, 371. doi:10.3390/w10040371
Lee, S., Kim, Y.-S., and Oh, H.-J. (2012). Application of a Weights-Of-Evidence Method and GIS to Regional Groundwater Productivity Potential Mapping. J. Environ. Manag. 96 (1), 91–105. doi:10.1016/j.jenvman.2011.09.016
Lillesand, T., and Kiefer, R. W. (1987). Remote Sensing and Image Interpretation. 7th ed. New York, United States: Wiley, 191–205.
Lodwick, W. A., Monson, W., and Svoboda, L. (1990). Attribute Error and Sensitivity Analysis of Map Operations in Geographical Informations Systems: Suitability Analysis. Int. J. geographical Inf. Syst. 4 (4), 413–428. doi:10.1080/02693799008941556
Magesh, N. S., Chandrasekar, N., and Soundranayagam, J. P. (2012). Delineation of Groundwater Potential Zones in Theni District, Tamil Nadu, Using Remote Sensing, GIS and MIF Techniques. Geosci. Front. 3 (2), 189–196. doi:10.1016/j.gsf.2011.10.007
Masipan, T., Chotpantarat, S., and Boonkaewwan, S. (2016). Experimental and Modelling Investigations of Tracer Transport in Variably Saturated Agricultural Soil of Thailand: Column Study. Sustain. Environ. Res. 26, 97–101. doi:10.1016/j.serj.2016.04.005
Mohammady, M., Pourghasemi, H. R., and Pradhan, B. (2012). Landslide Susceptibility Mapping at Golestan Province, Iran: A Comparison between Frequency Ratio, Dempster-Shafer, and Weights-Of-Evidence Models. J. Asian Earth Sci. 61, 221–236. doi:10.1016/j.jseaes.2012.10.005
Mukherjee, P., Singh, C. K., and Mukherjee, S. (2012). Delineation of Groundwater Potential Zones in Arid Region of India-A Remote Sensing and GIS Approach. Water Resour. Manage. 26 (9), 2643–2672. doi:10.1007/s11269-012-0038-9
Murthy, K. S. R. (2000). Ground Water Potential in a Semi-arid Region of Andhra Pradesh - a Geographical Information System Approach. Int. J. Remote Sensing 21, 1867–1884. doi:10.1080/014311600209788
Nag, S. K., and Ghosh, P. (2013). Delineation of Groundwater Potential Zone in Chhatna Block, Bankura District, West Bengal, India Using Remote Sensing and GIS Techniques. Environ. Earth Sci. 70 (5), 2115–2127. doi:10.1007/s12665-012-1713-0
O’Leary, D. W., Friedman, J. D., and Pohn, H. A. (1976). Lineaments, Linear, Lineations: Some Proposed New Standards for Old Terms. Geol. Soc. America 87, 1463–1469. doi:10.1130/0016-7606(1976)87<1463:LLLSPN>2.0.CO;2
Patil, S. G., and Mohite, N. M. (2014). Identification of Groundwater Recharge Potential Zones for a Watershed Using Remote Sensing and GIS. Int. J. Geomatics Geosciences 4 (3), 485–498.
Rahmati, O., Nazari Samani, A., Mahdavi, M., Pourghasemi, H. R., and Zeinivand, H. (2015). Groundwater Potential Mapping at Kurdistan Region of Iran Using Analytic Hierarchy Process and GIS. Arab J. Geosci. 8 (9), 7059–7071. doi:10.1007/s12517-014-1668-4
Saaty, T. L. (1980). The Analytic Hierarchy Process. New York, United States: McGraw-Hill Education.
Selvam, S., Dar, F. A., Magesh, N. S., Singaraja, C., Venkatramanan, S., and Chung, S. Y. (2016). Application of Remote Sensing and GIS for Delineating Groundwater Recharge Potential Zones of Kovilpatti Municipality, Tamil Nadu Using IF Technique. Earth Sci. Inform. 9, 137–150. doi:10.1007/s12145-015-0242-2
Selvam, S., Magesh, N. S., Sivasubramanian, P., Soundranayagam, J. P., Manimaran, G., and Seshunarayana, T. (2014). Deciphering of Groundwater Potential Zones in Tuticorin, Tamil Nadu, Using Remote Sensing and GIS Techniques. J. Geol. Soc. India 84, 597–608. doi:10.1007/s12594-014-0167-2
Senanayake, I. P., Dissanayake, D. M. D. O. K., Mayadunna, B. B., and Weerasekera, W. L. (2016). An Approach to Delineate Groundwater Recharge Potential Sites in Ambalantota, Sri Lanka Using GIS Techniques. Geosci. Front. 7 (1), 115–124. doi:10.1016/j.gsf.2015.03.002
Shaban, A., Khawlie, M., and Abdallah, C. (2006). Use of Remote Sensing and GIS to Determine Recharge Potential Zones: the Case of Occidental Lebanon. Hydrogeol J. 14 (4), 433–443. doi:10.1007/s10040-005-0437-6
Sophocleous, M. (2002). Interactions between Groundwater and Surface Water: The State of the Science. Hydrogeology J. 10, 52–67. doi:10.1007/s10040-001-0170-8
Su, Z. (2000). Remote Sensing of Land Use and Vegetation for Mesoscale Hydrological Studies. Int. J. Remote Sensing 21, 213–233. doi:10.1080/014311600210803
UN (1967). Hydrogeologic map of Lebanon: Carte hydrogelogique du Liban au 1/100000 me. Beirut, Lebanon: UN.
Yeh, H.-F., Lee, C.-H., Hsu, K.-C., and Chang, P.-H. (2009). GIS for the Assessment of the Groundwater Recharge Potential Zone. Environ. Geol. 58, 185–195. doi:10.1007/s00254-008-1504-9
Keywords: groundwater recharge potential, weighted overlay analysis, lower Khwae Hanuman, stable baseflow analysis, sensitivity analysis, Thailand
Citation: Kaewdum N and Chotpantarat S (2021) Mapping Potential Zones for Groundwater Recharge Using a GIS Technique in the Lower Khwae Hanuman Sub-Basin Area, Prachin Buri Province, Thailand. Front. Earth Sci. 9:717313. doi: 10.3389/feart.2021.717313
Received: 30 May 2021; Accepted: 26 August 2021;
Published: 21 September 2021.
Edited by:
Venkatesh Merwade, Purdue University, United StatesReviewed by:
Huaiwei Sun, Huazhong University of Science and Technology, ChinaHaibo Yang, Zhengzhou University, China
Carlos De Mello, Universidade Federal de Lavras, Brazil
Copyright © 2021 Kaewdum and Chotpantarat. This is an open-access article distributed under the terms of the Creative Commons Attribution License (CC BY). The use, distribution or reproduction in other forums is permitted, provided the original author(s) and the copyright owner(s) are credited and that the original publication in this journal is cited, in accordance with accepted academic practice. No use, distribution or reproduction is permitted which does not comply with these terms.
*Correspondence: Srilert Chotpantarat, U3JpbGVydC5DQGNodWxhLmFjLnRo
 Narongsak Kaewdum1,2
 Srilert Chotpantarat