
94% of researchers rate our articles as excellent or good
Learn more about the work of our research integrity team to safeguard the quality of each article we publish.
Find out more
ORIGINAL RESEARCH article
Front. Earth Sci., 29 July 2021
Sec. Atmospheric Science
Volume 9 - 2021 | https://doi.org/10.3389/feart.2021.715012
This article is part of the Research TopicLandfalling Tropical Cyclones: Physical Processes, Forecasting and ImpactsView all 26 articles
 Nannan Qin1,2,3
 Liguang Wu1,2*
Tropical cyclone (TC) rapid intensification (RI) is usually accompanied by a rapid eyewall contraction, followed by a slow contraction, and then a nearly steady eyewall. However, this study shows that Hurricane Helene (2006) exhibited an eyewall expansion during its 30-h rapid intensification period. The possible environmental influence on the eyewall expansion during the RI of Helene is examined. It is found that the synoptic-scale circulations led to additional low-level inflows and upper-level outflows that may play an important role in the eyewall expansion during the RI of Helene. Examination of the divergence of the absolute angular momentum flux (AAMF) associated with the environmental circulation suggests that the synoptic-scale atmospheric circulation played an important role in the eyewall expansion during the RI of Helene. In the lower and middle troposphere, the synoptic-scale cross-equatorial flow, which was enhanced by the Helene-induced wave train, led to the horizontal convergence of absolute angular momentum flux, while the TC-trough interaction and the related outflow in the upper troposphere resulted in the divergence of AAMF. The environment-induced low-level convergence and upper-level divergence of AAMF were superimposed on the secondary circulation of Helene and may be important to the eyewall expansion during the RI by accelerating the tangential wind outside of the eyewall. This study suggests that RI can occur with an eyewall expansion.
The improvement of tropical cyclone (TC) intensity forecast is lagging far behind the improvement of the TC track forecast (Kaplan and DeMaria 2003; Rogers et al., 2006; Rogers et al., 2013; Huang et al., 2021), especially when TCs undergo rapid intensification (RI), which is defined by Kaplan and DeMaria (2003) as an intensification rate of not less than 15.4 m s−1 (24 h) −1 in the maximum surface wind (VMAX). It has been found that TC intensification is accompanied by the contraction of the eyewall and radius of maximum wind (RMW) (Willoughby et al., 1982; Hack and Schubert 1986; Willoughby 1990; Willoughby and Rahn 2004; Knaff and Zehr 2007; Rogers 2010). Modeling and observational studies further indicate that the TC intensification process is accompanied by a rapid contraction of the RMW, followed by a slow contraction, and then a nearly steady stage (Hill and Lackmann 2009; Vigh 2010; Kieu 2012; Chen and Zhang 2013; Wang and Wang 2014; Qin et al., 2018). Based on the analysis of a 25-years dataset, Qin et al. (2016) indicated that nearly 60% of RI events exhibited a steady RMW phenomenon, that is, the RMW stops contracting but keeps nearly constant. So far, it is not known whether the RI can occur with the expansion of the TC eyewall.
Early theoretical and observational studies proposed that diabatic heating that maximizes within the RMW will lead to the contraction of the eyewall because the maximum tendency of the tangential wind is located inside the RMW (Shapiro and Willoughby 1982; Willoughby et al., 1982; Hack and Schubert 1986). Based on a kinematic model, Kieu (2012) suggested that the inward momentum transport contributes to the RMW contraction by intensifying tangential wind further inward, while the frictional dissipation prevents the RMW from contracting in the boundary layer. Qin et al. (2018)obtained similar conclusions to Kieu (2012), in which the radial momentum advection indeed contributes to the RMW contraction, while the frictional diffusion leads to the cessation of the RMW within the boundary layer. Above the boundary layer, Qin et al. (2018) also emphasized that the vertical momentum advection promotes the RMW contraction by amplifying tangential wind, while the radial momentum advection inhibits the RMW contraction by inhibiting the tangential wind. The RMW contraction rate is also sensitive to the tangential wind profile. Stern et al. (2015) proposed that an increase in the sharpness of the tangential wind profile prevents the RMW from contracting, while the negative gradient of tangential wind tendency with the maximum inside of the RMW is favorable for RMW contraction. In consideration of the tangential wind tendency, Li et al. (2019) proposed that the radial gradient of the tangential wind tendency and the radial curvature of the tangential wind are influenced by the tangential wind budget terms. Therefore, factors that can change the tangential wind tendency will affect the RMW changes. Since an enlarging RMW generally occurs during the weakening stage of TCs, the expansion of the eyewall and RMW during the RI stage has not been discussed in previous studies.
Environmental factors favorable for RI have been revealed, including weaker vertical wind shear (VWS), warmer sea surface temperature (SST), higher oceanic heat content, higher relative humidity in the low-to mid-troposphere, and the external forcing from upper-level systems (Gray 1968; Holliday and Thompson 1979; Chen and Gray 1985; Kaplan and DeMaria 2003; Kaplan et al., 2010; Shieh et al., 2013; Chen et al., 2015). The environmental factors also do impact on TC size changes. Hill and Lackmann (2009) found that high relative humidity around the environment favors the outer rainband formation and the increase of TC size. Xu and Wang (2010) demonstrated that the surface entropy flux outside the eyewall contributes to the enhancement of the outer rainbands and thus affects the TC size. The TC intensity and size changes are associated with the radial transport of the absolute angular momentum (AAM). Montgomery and Smith (2011) emphasized that the tangential wind above the boundary layer intensifies by the inward transport of the material conservation of the AAM. Within the boundary layer, the amplifying tangential wind results from the convergence of the AAM with a minimal loss of frictional momentum diffusion. By examining the changes of the radius of the 34-kt (1 kt = 0.514 m s−1) wind (R17) in TC, Chan and Chan (2013) emphasized that TC size (R17) is positively related to the import of the low-level AAM, i.e., the increasing low-level AAM import increases the TC size. However, the influences of the AAM transport induced separately by the environment and by the TC itself on the intensity and size changes are not discussed.
In this study, we show that Hurricane Helene (2006) experienced an expansion of the eyewall and RMW during its RI stage based on observational analysis. The environmental factors responsible for the eyewall expansion during the RI of Helene are discussed. The data and analysis methods used are described in Data and Methods section. Overview of Hurricane Helene section gives a brief overview of the intensity and size evolution of Hurricane Helene (2006). Environmental Influences on the Eyewall Expansion of Helene section identifies possible environmental influences by diagnosing the divergence of the AAM flux (AAMFD) in terms of the low-frequency and synoptic-scale wind fields, respectively, followed by a summary in Summary Section.
The environmental wind field, temperature, and relative humidity are based on the National Centers for Environmental Prediction (NCEP) Climate Forecast System Reanalysis (CFSR) data (Saha et al., 2010), which are available at 37 vertical levels from 1,000 hPa up to 1 hPa with the grid spacing of
The 3-h brightness temperature with the horizontal spatial resolution of
The hurricane information, including the central position (latitude and longitude) and intensities including the 1-min sustained maximum winds (VMAX) and the minimum central pressure (PMIN) at 6-h intervals, is from the revised Atlantic hurricane dataset conducted by the National Hurricane Center (NHC). The extended best-track (EBT) dataset (Demuth et al., 2006) at 6-h intervals is used for the size parameters of Hurricane Helene (2006), including the RMW, the R17, the radii of the 50 kt wind (R26), 64 kt wind (R33) and the outer closed isobar (ROCI). The radii parameters in EBT dataset are provided in four quadrants, i.e., the northeast, southeast, northwest, and southwest quadrants. The radii used in this study is calculated by averaging the radii from these four quadrants with the requirement that no undefined values are included.
Hurricane Helene (2006) can be traced back to a tropical wave near the coast of Africa in early September. This tropical wave developed into a tropical depression by 1200 UTC 12 September. The tropical depression intensified into Tropical Storm Helene in an easterly shear environment by 0000 UTC 14 September. Around 1200 UTC 16 September, Helene strengthened to a hurricane. During the subsequent few days (from September 16–19), Helene moved northwestward affected by the subtropical high system that was located to the northeast of Helene (Figure 1A). Helene experienced an RI period from 0000 UTC 17 to 0600 UTC 18, September, with its VMAX (PMIN) increasing (deepening) from 36 m s−1 (983 hPa) to the peak intensity of 54 m s−1 (955 hPa) (Figure 1B). During this period, SST was around 27–28°C (Figure 1A), which is favorable for TC intensification (Holliday and Thompson, 1979). The magnitude of VWS, which is calculated using the 1,000-km area-averaged wind between 200 hPa and 850 hPa, was below 7 m s−1 during the RI period of Helene. This weak VWS favors for the RI of Helene since strong VWS tends to weaken the TC intensity through the injection of dry and low entropy air (Frank and Ritchie 2001; Tang and Emanuel 2010). We examined the evolution of environmental potential vorticity around Helene (not shown) and found that strong environmental potential vorticity anomalies approached Helene from the northwest with a radial distance of less than 500 km from 1800 UTC 17 to 0600 UTC 18. The interaction of environmental potential vorticity anomalies with TC circulation may contribute to the intensification of Helene according to the finding by other studies (Molinari et al., 1995; Hanley et al., 2001). After that, Helene weakened and dissipated at 0000 UTC 28 September when it moved over the cold ocean.
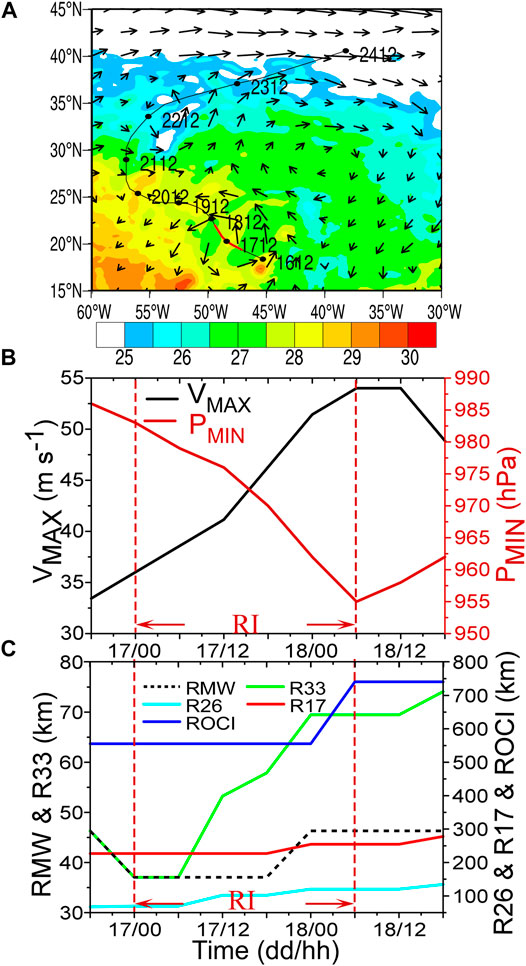
FIGURE 1. (A) Best track (black contour) of Hurricane Helene from 1200 UTC 16 to 1200 UTC Sep 24, 2006 superimposed with the sea surface temperature (shaded, oC) at 0000 UTC 17 and the 500-hPa wind vector (m s−1) at 1200 UTC Sep 17, 2006. Time series of (B) the maximum sustained surface wind (VMAX, black solid contour, m s−1) and the minimum sea-level pressure (PMIN, red contour, hPa) from the National Hurricane Center (NHC) dataset, and (C) the radii of the VMAX (RMW, black dashed lines, km), 34 kt wind (R17, red solid line, km), 50 kt wind (R26, cyan line, km) and 64 kt wind (R33, green line, km) from 1800 UTC 16 to 1,800 UTC Sep 18, 2006. The red solid line in (A) and red dashed lines in (B, C) indicate the RI period.
The size changes of Helene are examined in Figure 1C. Before the RI onset, the intensifying Helene was featured with a contracting RMW. Then, the RMW kept steady from 0000 UTC 17 to 1800 UTC 17 and increased from around 37 km at 1800 UTC 17 to about 46 km at 0000 UTC 18. After that, the RMW of 46 km was maintained till 1800 UTC 18. Meanwhile, the R33, R26, R17, and the ROCI also were enlarged during the RI. These changes in the eyewall and RMW were also reflected in the cloud features (Figure 2). The convection indicated by the satellite brightness temperature exhibited an expanding eye. The NOAA aircraft was flown into Helene during 17–20 September. The near-surface wind observed by the Airborne Doppler radar is shown in Figure 3 at the closest time when the eyewall expansion occurred. Around 1800 UTC 17, the maximum near-surface wind of over 55 m s−1 was located to the northeast-east of TC with a radius of about 43 km, while the maximum wind to the southwest of the TC was located around a radius of 35 km. The averaged radius was about 39 km around 1800 UTC 17, close to the RMW shown in Figure 1C. Unfortunately, no aircraft data were available for the period from 0000 UTC 18 to 1700 UTC 18. We show the wind at another time in Figure 3B for these reasons: 1) the EBT data show that the RMW kept steady from 0000 UTC18 to 1800 UTC 18; 2) the intensity at 1800 UTC 18 was similar to that at 0000 UTC 18; 3) there was aircraft observation around 1800 UTC 18. Figure 3B shows that the maximum wind was located at a radius of about 60 km to the northwest of Helene. The maximum wind to the southeast of Helene is hard to be recognized in Figure 3B. But the radius of the southeastern maximum wind was about 35 km when we check the observed wind structure near 1900 UTC 18. The observed wind structure presented that the eyewall was expanded from about 39 km to about 48 km. Therefore, the intensity and RMW changes are not simply negatively correlated, which is consistent with other studies (Qin et al., 2016; Kieu 2012; Knaff et al., 2015; Xu and Wang 2015, 2018). Although TC intensities are significantly underestimated and the RMW is systematically overestimated in the reanalysis data (Hodges et al., 2018), the eyewall expansion is also present in the CFSR data. The surface wind and the azimuthal-mean RMW obtained from the CFSR data are shown in Figure 4. It is noted that the azimuthal-mean RMW in the CFSR data increased from 150 to 200 km from 1800 UTC 17 to 0000 UTC 18, which confirmed the eyewall expansion shown in Figures 1–3.
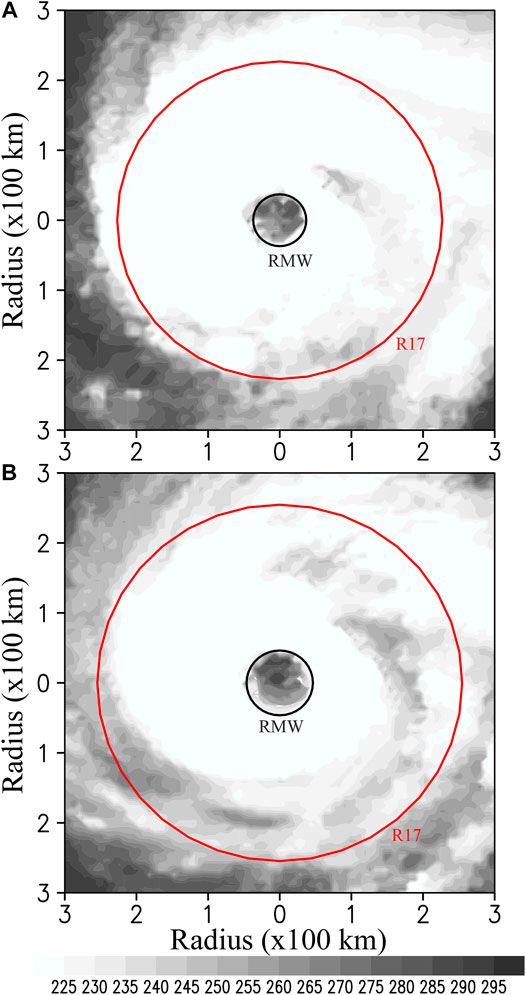
FIGURE 2. Horizontal distribution of the infrared brightness temperature (shaded, K) from NOAA FCDR at (A) 1800 UTC Sep 17, 2006 and (B) 0000 UTC Sep 18, 2006. The black and red circles indicate the RMW and the radius of the 34-kt wind (R17).
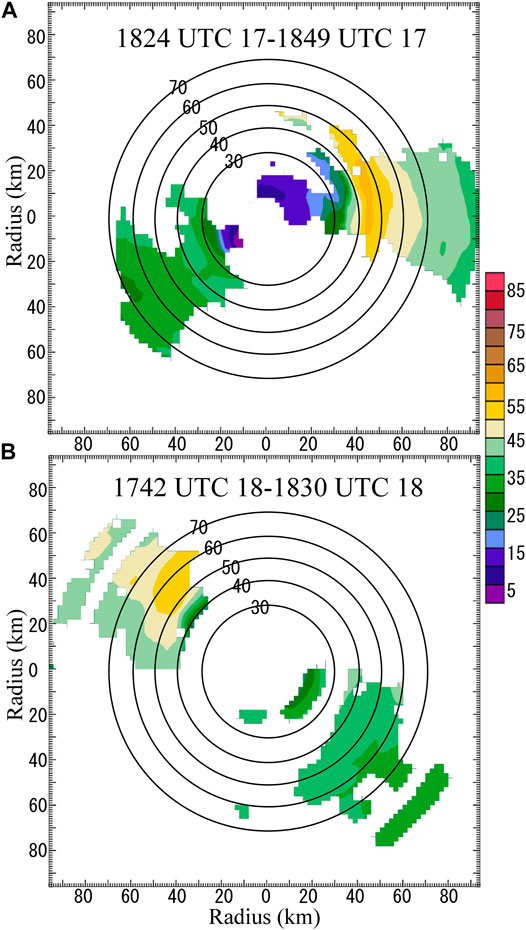
FIGURE 3. Horizontal distribution of the 0.5-km wind (shaded, m s−1) from the NOAA 42 Airborne Doppler radar for (A) 1824–1849 UTC Sep 17, 2006 and (B) 1742–1830 UTC Sep 18, 2006. Black circles indicate the radii from 30 to 70 km referring to the TC center. The figure is adapted from https://www.aoml.noaa.gov/hrd/Storm_pages/helene2006/radar.html.
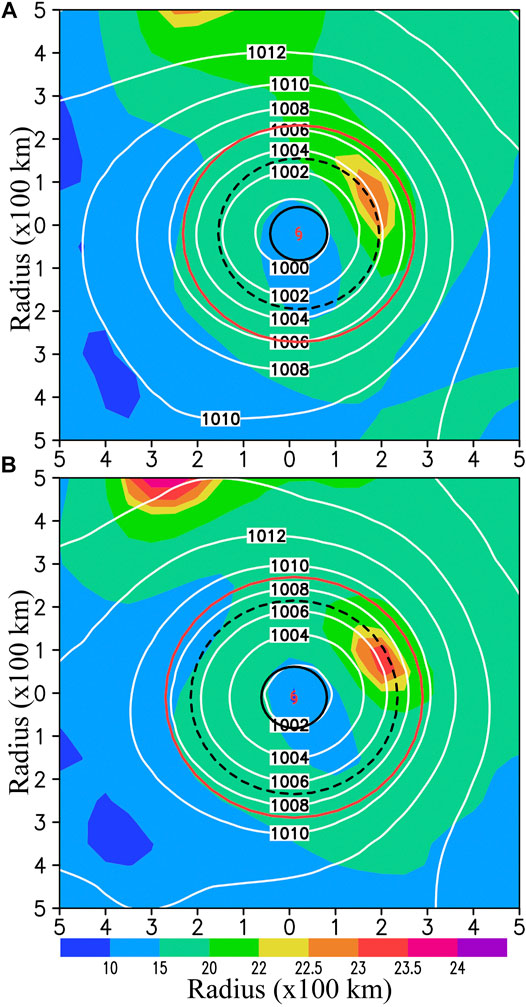
FIGURE 4. Horizontal distribution of the surface wind (at the 10-m height, m s−1) and the sea level pressure (white contours, hPa) obtained from CFSR at (A) 1800 UTC Sep 17, 2006 and (B) 0000 UTC Sep 18, 2006. The black and red circles indicate the RMW and the radius of the 34-kt wind (R17) in the best track data, while the black dashed circle is the azimuthal-mean RMW in the CFSR data.
Since the conservation of AAM is generally a constrain for mature TCs, the AAM transport can be used to understand the changes in TC intensity and size (Merrill 1984; Liu and Chan 2002; Montgomery and Smith 2011; Chan and Chan 2013). The AAM in the cylindrical coordinate
where r is the radius to the TC center; f is the Coriolis parameter;
where
The first term on the right-hand side (RHS) of Eq. 3 is the contribution from the low-frequency component (AAMFDL). The second term is the contribution from the synoptic-scale component (AAMFDH). The third term represents the divergence of the synoptic-scale AAMF by the low-frequency radial wind (AAMFLtH), while the last term is the divergence of the low-frequency AAMF by the synoptic-scale radial wind (AAMFHtL). After taking the azimuthal mean indicated by the overbars, Eq. 3 can be written as
Note that the eddy terms are included in Eq. 4. Figure 5 shows the radius-height structures of azimuthal-averaged AAMFD, AAMFDL, AAMFDH, AAMFDLtH, AAMFDHtL, the sum of the four terms on the RHS of Eq. 4, and the related inflows and outflows at the selected time. We can find that the sum of the four terms on the RHS is close to the total AAMFD (cf. Figures 5A,B). In the lower troposphere, the convergence of AAMF is dominant inside of the radius of 600 km, with the maxima located around the radius of 500 km, which is associated with low-level inflows. The convergence of AAMF also occurred with inflows at the middle levels (between 700 hPa and 300 hPa). In the upper troposphere, the divergence of AAMF occurred with the maximum core appearing near 175 hPa where the strong outflow (>6 m s−1) was located. The convergence of AAMF at low and middle levels tended to intensify the storm especially outside of the eyewall (Shapiro and Willoughby 1982; Montgomery and Smith 2011).
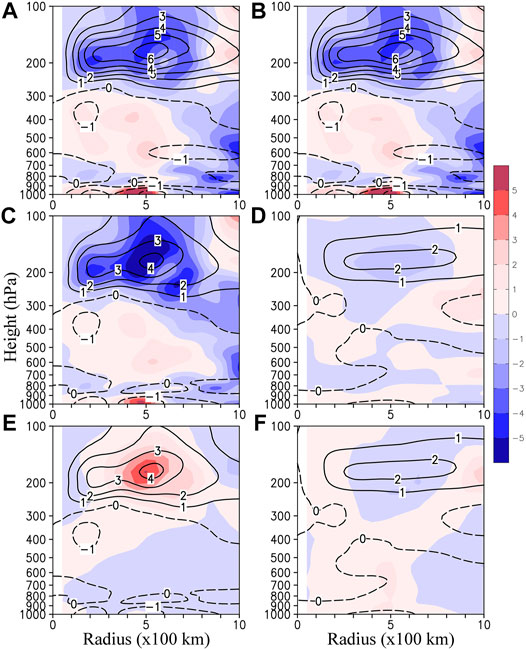
FIGURE 5. Radius-height cross-sections of the azimuthal-mean horizontal flux divergence of AAM (AAMFD, shaded, 105 m3 s−1 h−1) and radial wind (contours, m s−1, solid and dashed lines are for outflow and inflow, respectively) at 1800 UTC Sep 17, 2006 (A) total AAMFD and radial wind (B) sum of the RHS AAMFD terms of Eq. 4 and total radial wind (C) AAMFD and radial wind associated with the synoptic-scale circulation (D) AAMFD and radial wind associated with the low-frequency circulation (E) the divergence of low-frequency AAM flux by the radial wind associated with the synoptic-scale circulation, and (F) the divergence of synoptic-scale AAM flux by the radial wind associated with the low-frequency circulation.
The low- and middle-level convergence of AAMF and the upper-level divergence of AAMF were mainly caused by the synoptic-scale circulation (Figure 5C) since the AAMFD caused by the low-frequency circulation was substantially small (Figure 5D and Figure 5F), and the divergence of the low-frequency AAMF caused by the synoptic-scale inflows (AAMFHtL, Figure 5E) performed almost oppositely to the structure of the total AAMFD. The AAMF transports were associated with the environmental inflows and outflows, which were superimposed on the secondary circulation of Helene and contributed to the intensification of Helene especially outside of the eyewall (Shapiro and Willoughby 1982). The environmental inflows/outflows were closely related to the synoptic-scale rather than the low-frequency circulation, suggesting that the synoptic-scale circulation played an important role in enlarging the RMW by changing the AAMFD during the RI period of Helene.
Figure 6 shows the radius-time distribution of the azimuthally averaged AAMFD integrated over low levels. During the RI period of Helene, the low-level convergence of AAMF maintains within the radius of 650 km (Figure 6A), which is mainly caused by the synoptic-scale circulation compared to that from the low-frequency circulation (Figures 6B,C). The maximum positive AAMFD is located at radii of 400–500 km, supporting that the intensification of the tangential wind outside the eyewall is persistent during the RI stage.
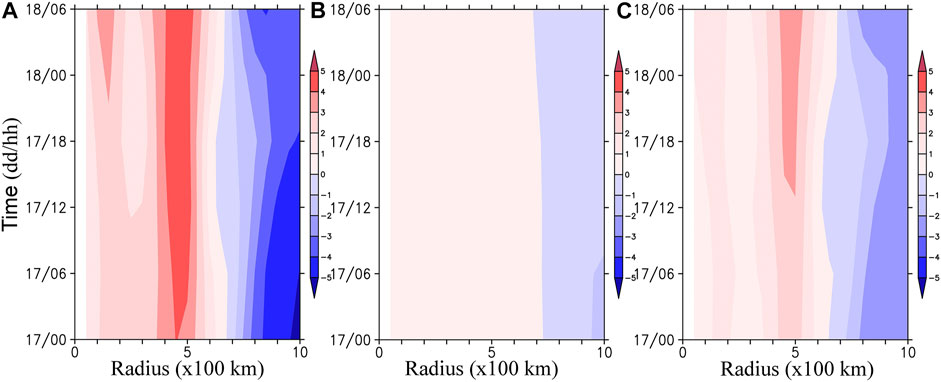
FIGURE 6. Time-radius cross-section of the azimuthal-mean integrated divergence of the AAM flux (AAMFD, shaded, 105 m3 s−1 h−1) over low levels (averaged from 1,000 hPa to 900 hPa) during the RI period of Helene (A) total AAMFD (B) AAMFD associated with the low-frequency circulation, and (C) AAMFD associated with the synoptic-scale circulation.
In order to investigate how the environmental circulation affected the convergence of AAMF in the lower troposphere, we examine the horizontal distribution of the 900-hPa total, synoptic-scale and low-frequency wind fields, as well as the related AAMFD in Figure 7. In the lower troposphere, Hurricane Helene was located to the south of the subtropical high, which was split into two parts with one over the eastern North Atlantic and the other near the Caribbean Sea (Figure 7A). While the eastern part of the subtropical high can be seen in the synoptic-scale wind field (Figure 7C), Figure 7B indicates that the two parts of the subtropical high are clear in the low-frequency wind field. The splitting of the subtropical high was coincident with the northward movement of Hurricane Gordon (marked by “C” in Figure 7C), which formed 2 days earlier than Helene. It is suggested that the northward movement of Helene was mainly affected by the eastern part of the subtropical high (Figure 1A).
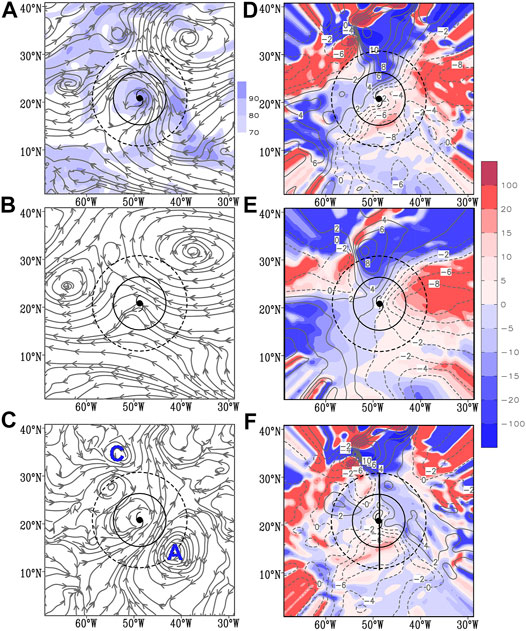
FIGURE 7. (A, B, C) Streamlines with the shading in (A) indicating the relative humidity averaged from 850 hPa to 700 hPa and (D, E, F) the divergence of the environmental AAM flux (AAMFD, shaded, 106 m3 s−2) superimposed with the radial flow [contours, solid (dashed) lines indicating the outflow (inflow) at 2 m s−1 intervals] (A, D) for the total field after removing the TC vortex (B, E) for low-frequency, and (C, F) for the synoptic-scale field at 900 hPa at 1800 UTC Sep 17, 2006. “A” and “C” in blue color in (C) indicate the synoptic-scale anticyclonic circulation and Hurricane Gordon. The black line in (F) denotes the location for the vertical cross-section in Figure 9. The black solid and dashed circles indicate the radius of the outer closed isobar (ROCI, with a radius of 555 km) and R = 1,000 km.
In the 900-hPa wind field on the synoptic scale (Figure 7C), a pronounced feature is an anticyclonic circulation to the southeast of Helene. The strong anticyclone was centered near 14°N, with a horizontal scale of about 2000 km. Thus, the cross-equatorial flow to the west of the anticyclone was extended to the circulation of Helene, which led to the inflow of over 6 m s−1 located to the south of Helene (Figure 7F). This synoptic-scale anticyclonic circulation was further examined in Figure 8 by showing the horizontal streamline before the formation of the tropical depression, prior to RI, and during the RI of Helene. It is noted that a synoptic-scale cross-equatorial flow existed between the longitude of 40°W and 55°W far before the formation of Hurricane Helene (Figure 8A). Prior to and during the RI of Helene, alternating regions of anticyclonic and cyclonic circulation appeared along the TC track in a northwest-southeast direction (Figures 8B,C), which is likely induced by the TC activity and called the Rossby train as proposed by previous studies (Carr and Elsberry 1995; Holland 1995; Wu et al., 2013b; Wu and Duan 2015). Of importance is that the anticyclonic circulation to the southeast of Helene strengthened during the RI of the eyewall expansion stage (Figure 8B). This enhanced anticyclonic circulation might be caused by the interaction of the TC-induced Rossby train with the tropical wave. Therefore, the synoptic-scale cross-equatorial flow to the west of the anticyclone was enhanced and extended to the circulation of Helene introducing the convergence of AAMF.
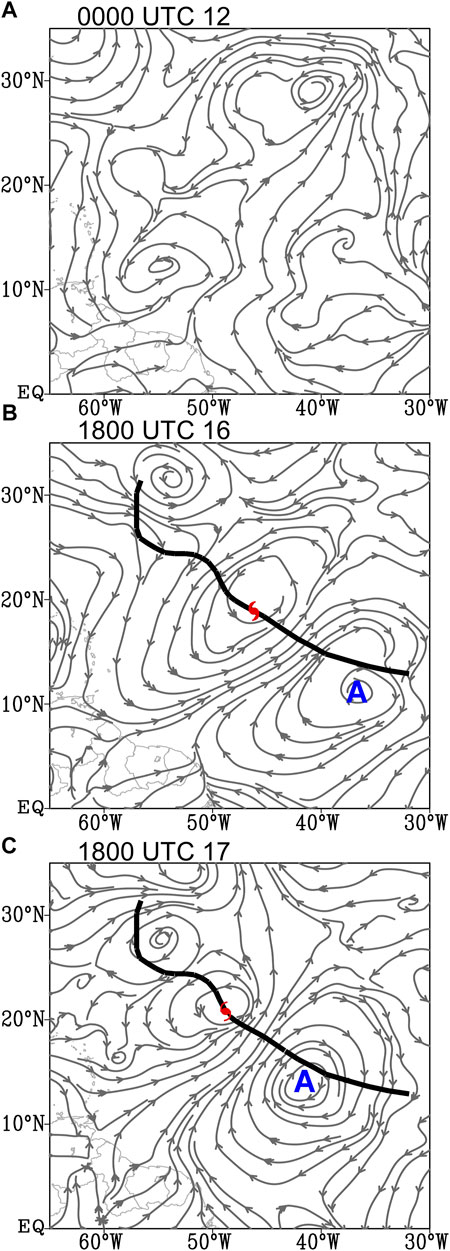
FIGURE 8. 900-hPa streamline for the synoptic-scale field at (A) 0000 UTC 12 (B) 1800 UTC 16 and (C) 1800 UTC Sep 17, 2006. The thick black solid line indicates the track of Helene from 0000 UTC 14 to 0000 UTC Sep 22, 2006. The red symbol indicates the TC position at the selected times. The letter “A” in blue color represents the anticyclonic circulation.
The low-level convergence of the AAMF was related to the synoptic-scale circulation. Figure 7D shows that the low-level convergence of the AAMF prevailed in the southeast semicircle, while the divergence of the AAMF prevailed in the northwest semicircle within a radius of 1,000 km except for a small area with the convergence of the AAMF in the northwest of Helene. Specifically, the cross-equatorial flow from the synoptic-scale wind field played an important role in transporting AAM inward to the southern area of Helene (Figure 7F). On the other hand, the low-level convergence of the AAMF in the northwest semicircle of Helene was generally caused by the low-frequency flow (cf., Figure 7D and Figure 7E). Since the convergence of the AAMF associated with the synoptic-scale wind field compensates for the low-level divergence of the AAMF, there was the net convergence of the AAMF after the azimuthal averaging (Figure 5A), suggesting that the synoptic-scale circulation influenced the intensity and size changes of Helene by changing the convergence of the AAMF.
The synoptic-scale anticyclonic circulation is also important to the middle-level convergence of the AAMF, which determines the intensification of the middle-level wind of Helene, especially outside the eyewall since the AAM is materially conserved (Shapiro and Willoughby 1982; Montgomery and Smith 2011). Figure 9 shows the 600-hPa wind field and AAMFD, and their synoptic-scale and the low-frequency components. As discussed in The Low-Level Synoptic-Scale Wind Field Associated with the AAMFD section, the pattern of the middle-level wind field was similar to the low-level wind structure. The strong cross-equatorial flow to the southeast of Helene was closely related to the synoptic-scale anticyclonic circulation (Figure 9C). As a result, the inflow induced by the synoptic-scale circulation was maximized to the south of Helene, which agrees with the convergence of AAMF at middle levels (Figures 9D,F). Without consideration of the friction diffusion, the convergence of AAMF at middle levels tended to intensify the storm especially outside of the eyewall where the maximum convergence of AAMF was located.
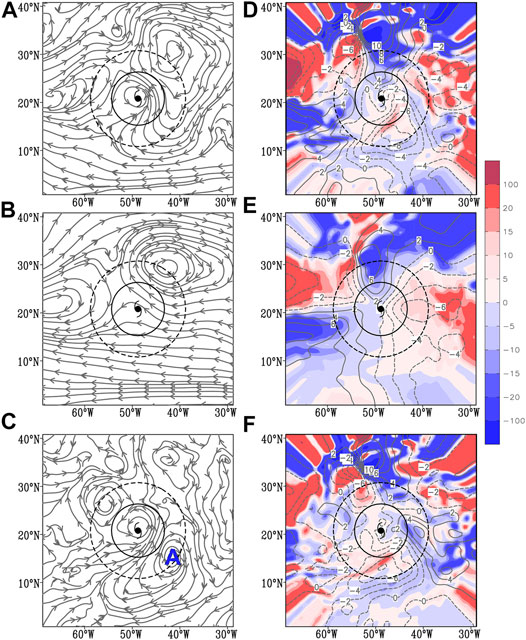
FIGURE 9. As in Figure 7 but for 600 hPa.
The vertical structures of the inflow/outflow induced by the synoptic-scale circulation are examined in Figure 10. It is confirmed that the inflow to the south of Helene was stronger than that to the north of Helene below the layer of 500 hPa. The low-to middle-level inflow prevailed and maintained during the RI with the expansion of the eyewall. Note that the maximum inflow was located near the radius of 600 km, which influenced the location of the maximum convergence of AAMF (Figures 7F,9F) that contributed to the intensification of the tangential wind outside of the eyewall.
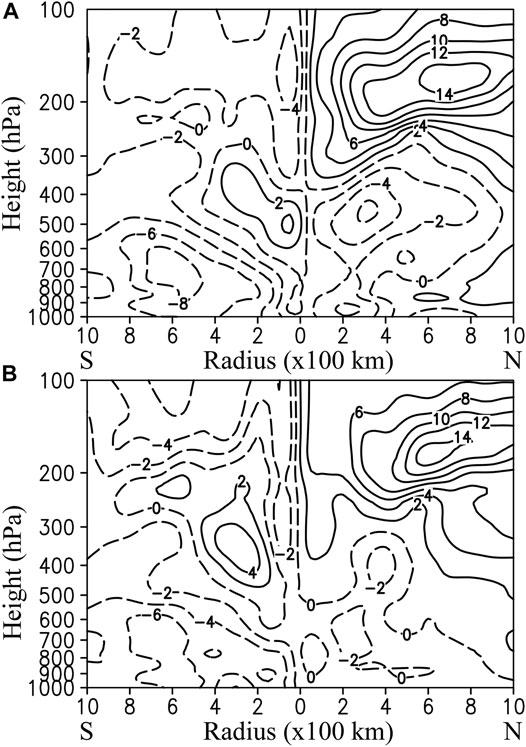
FIGURE 10. Vertical cross-section of the magnitude of inflows (m s−1, dashed) and outflows (m s−1, solid) associated with the synoptic-scale circulation from south to north at (A) 1800 UTC Sep 17, 2006 and (B) 0600 UTC Sep 18, 2006.
In the upper troposphere, Helene was located to the south of the westerly trough before the RI onset (Figures 11A,B). The TC-trough interaction can be measured by the eddy flux convergence of relative angular momentum (EFC, DeMaria et al., 1993; Molinari et al., 1995; Chen et al., 2015; Qiu et al., 2020). Following DeMaria et al. (1993), EFC is defined as
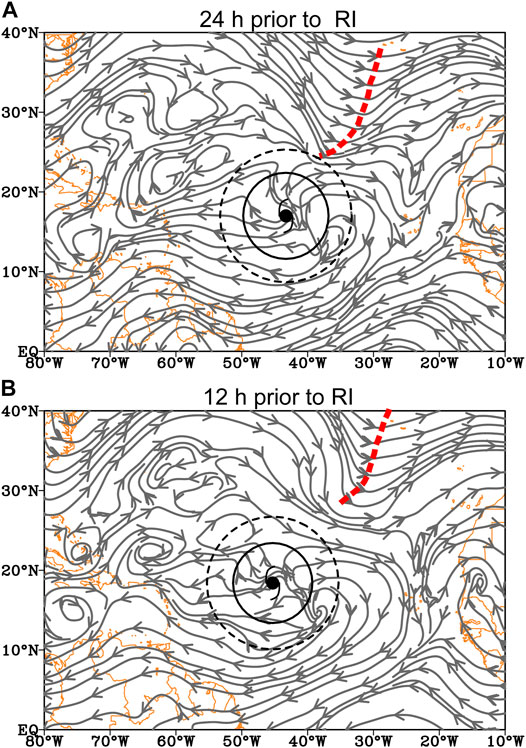
FIGURE 11. Streamline at 200 hPa for the total field after removing the TC vortex (A) 24 h and (B) 12 h prior to RI. The black solid circle indicates the radius of the outer closed isobar (ROCI) of 650 and 600 km for (A) and (B), respectively. The black dashed circle denotes R = 1,000 km. The red dashed lines denote the westerly trough.
During the RI period, a synoptic-scale circulation contributed to the intense northeastward outflow and the outward transport of AAM at upper levels, which intensified the secondary circulation as well as the intensity of Helene. Figure 12 shows the horizontal distributions of the upper-level wind field and the AAMFD of Helene. The upper-level outflow with a value over 12 m s−1 was located to the north-northeast of Helene (Figure 12D). This outflow was largely induced by the synoptic-scale circulation, which was found in Figure 12C as a synoptic-scale cyclonic circulation that was located to the northwest of Helene. The synoptic-scale cyclonic circulation was associated with a westerly trough that was seen in Figure 13. During the RI period with the eyewall expansion, the westerly trough moved eastward and became closer to Helene, leading to a cyclonic circulation to the northwest quadrant of Helene. Thus, the upper-level outflow was enhanced with the maximum outflow core located around the radius of 500 km, which favors TC intensification especially outside of the eyewall.
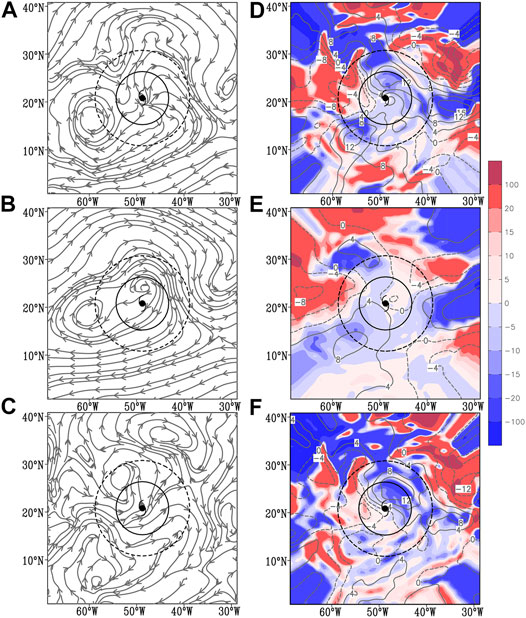
FIGURE 12. As in Figure 7 but for 200 hPa.
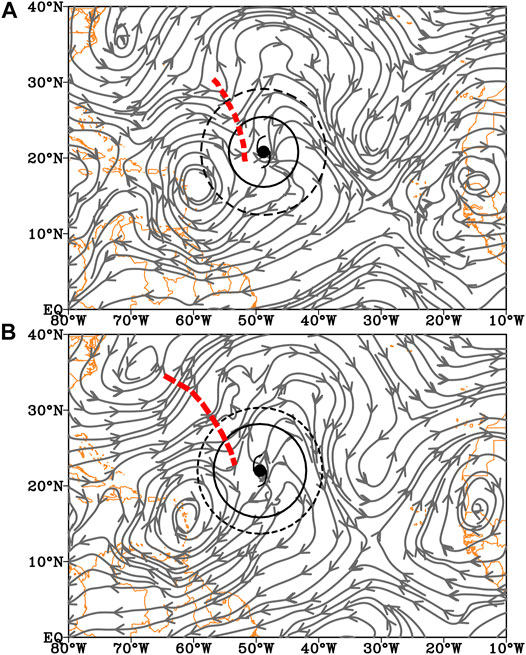
FIGURE 13. As in Figure 11 but for the RI period at (A) 1800 UTC 17 and (B) 0600 UTC Sep. 18, 2006. The black solid circle indicates the radius of the outer closed isobar (ROCI) of 556 and 740 km for (A) and (B), respectively. The black dashed circle denotes R = 1,000 km. The red dashed lines denote the westerly trough.
The upper-level divergence of AAMF that was influenced by the synoptic-scale circulation is further examined by showing the horizontal distribution of the AAMFD in Figure 12F. In agreement with the upper-level outflow, the divergence of AAMF was located to the northeast of Helene. Moreover, the upper-level divergence of AAMF was maximized at a similar radius as the maxima of the upper-level outflow within a radius of 1,000 km. The outflow prevailed and maintained in the upper troposphere during the eyewall expansion stage, which was a manifestation of the divergence of AAMF and the TC size expansion. While the low-frequency circulation presented a divergent wind field at upper levels, the divergence of AAMF associated with the low-frequency circulation was relatively weak (Figures 5, 11), suggesting that the synoptic-scale circulation determined the divergence of AAMF.
Hurricane Helene (2006) experienced a 30-h RI under favorable environmental conditions, including the warm SST, high low-level humidity, weak large-scale VWS, and the upper-level TC-trough interaction. Under the environmental influence, Helene intensified rapidly with an expansion of the eyewall, suggesting that the intensity and inner-core size changes are not negatively correlated.
This study reveals that the synoptic-scale atmospheric circulation was likely responsible for the eyewall expansion during the RI of Helene through the environmental influences on the AAM transport. In the low and middle troposphere, the cross-equatorial flow associated with a synoptic-scale anticyclonic circulation was enhanced due to the intensifying TC and/or its interaction with the tropical wave. The enhanced inflow penetrated the Helene circulation and caused the convergence of AAMF, accelerating the tangential wind outside of the eyewall. In the upper troposphere, the divergence of AAMF was enhanced by a synoptic-scale cyclonic circulation associated with a westerly trough located to the northwest of Helene. Consequently, the environmental influences led to the low-level convergence and upper-level divergence of AAMF, which was superimposed on the secondary circulation of Helene, likely being important to the eyewall expansion during the RI of Helene.
In this study, for the first time we show that the RI can occur with the eyewall expansion. Hurricane Helene (2006) is such a case. The increase of the RMW of Helene is found in both the best-track data and the CFSR data, although the RMW is systematically overestimated in the CFSR data. Note that the expansion in Helene was also indicated in R33, R26, R17, and the ROCI. It is suggested that a TC can indeed experience the eyewall expansion during its RI. As a first step, we investigated the possible influences of the environmental flows on the phenomena of the size expansion using the CFSR data. The environmental influences are important to the eyewall expansion but more work in terms of the high-resolution simulation is necessary to understand the inner-core dynamics on the eyewall expansion for RI cases.
The original contributions presented in the study are included in the article/supplementary material, further inquiries can be directed to the corresponding author.
LW designed research. NQ conceptualized the analysis and wrote the manuscript. All authors were involved in helpful discussions and contributions to the manuscript.
This work was jointly supported by the National Natural Science Foundation of China (41730961, 41675051, 41675009, 42075072, 41905001, 42005007), the Postdoctoral Science Foundation of China (2019M661342), the National Key R&D Program of China (2019YFC1510201), the Natural Science Foundation of Jiangsu Province (BK20201505), the Open Research Program of the State Key Laboratory of Severe Weather (2019LASW-A02), and the Open Grants of the State Key Laboratory of Severe Weather (2021LASW-B11).
The authors declare that the research was conducted in the absence of any commercial or financial relationships that could be construed as a potential conflict of interest.
All claims expressed in this article are solely those of the authors and do not necessarily represent those of their affiliated organizations, or those of the publisher, the editors and the reviewers. Any product that may be evaluated in this article, or claim that may be made by its manufacturer, is not guaranteed or endorsed by the publisher.
Carr, L. E., and Elsberry, R. L. (1995). Monsoonal Interactions Leading to Sudden Tropical Cyclone Track Changes. Mon. Wea. Rev. 123, 265–290. doi:10.1175/1520-0493(1995)123<0265:MILTST>2.0.CO;2
Chan, K. T. F., and Chan, J. C. L. (2013). Angular Momentum Transports and Synoptic Flow Patterns Associated with Tropical Cyclone Size Change. Mon. Wea. Rev. 141, 3985–4007. doi:10.1175/MWR-D-12-00204.1
Chen, H., and Zhang, D.-L. (2013). On the Rapid Intensification of Hurricane Wilma (2005). Part II: Convective Bursts and the Upper-Level Warm Core. J. Atmos. Sci. 70, 146–162. doi:10.1175/JAS-D-12-062.1
Chen, L., and Gray, W. M. (1985). “Global View of the Upper Level Outflow Patterns Associated with Tropical Cyclone Intensity Change during FGGE,” in Dept. Of Atmospheric Science Paper 392 (Colorado state: Colorado State University), 126.
Chen, X., Wang, Y., and Zhao, K. (2015). Synoptic Flow Patterns and Large-Scale Characteristics Associated with Rapidly Intensifying Tropical Cyclones in the South China Sea. Mon. Weather Rev. 143, 64–87. doi:10.1175/MWR-D-13-00338.1
DeMaria, M., Baik, J.-J., and Kaplan, J. (1993). Upper-level Eddy Angular Momentum Fluxes and Tropical Cyclone Intensity Change. J. Atmos. Sci. 50, 1133–1147. doi:10.1175/1520-0469(1993)050<1133:ULEAMF>2.0.CO;2
Demuth, J. L., DeMaria, M., and Knaff, J. A. (2006). Improvement of Advanced Microwave Sounding Unit Tropical Cyclone Intensity and Size Estimation Algorithms. J. Appl. Meteorol. Climatol. 45, 1573–1581. doi:10.1175/JAM2429.1
Duchon, C. E. (1979). Lanczos Filtering in One and Two Dimensions. J. Appl. Meteorol. Climatol. 18, 1016–1022. doi:10.1175/1520-0450(1979)018<1016:LFIOAT>2.0.CO;2
Frank, W. M., and Ritchie, E. A. (2001). Effects of Vertical Wind Shear on the Intensity and Structure of Numerically Simulated Hurricanes. Mon. Wea. Rev. 129, 2249–2269. doi:10.1175/1520-0493(2001)129<2249:EOVWSO>2.0.CO;2
Gray, M. W. (1968). Global View of the Origin of Tropical Disturbances and Storms. Mon. Weather Rev. 96, 669–700. doi:10.1175/1520-0493(1968)096<0669:GVOTOO>2.0.CO;2
Hack, J. J., and Schubert, W. H. (1986). Nonlinear Response of Atmospheric Vortices to Heating by Organized Cumulus Convection. J. Atmos. Sci. 43, 1559–1573. doi:10.1175/1520-0469(1986)043<1559:NROAVT>2.0.CO;2
Hanley, D. D., Molinari, J., and Keyser, D. (2001). A Composite Study of the Interactions between Tropical Cyclones and Upper Tropospheric Troughs. Mon. Weather Rev. 129, 2570–2584. doi:10.1175/1520-0493(2001)129<2570:ACSOTI>2.0.CO;2
Hill, K. A., and Lackmann, G. M. (2009). Influence of Environmental Humidity on Tropical Cyclone Size. Mon. Wea. Rev. 137, 3294–3315. doi:10.1175/2009MWR2679.1
Hodges, K., Cobb, A., and Vidale, P. L. (2017). How Well Are Tropical Cyclones Represented in Reanalysis Datasets? J. Clim. 30, 5243–5264. doi:10.1175/JCLI-D-16-0557.1
Holland, G. J. (1995). Scale Interaction in the Western Pacific Monsoon. Meteorl. Atmos. Phys. 56, 57–79. doi:10.1007/BF01022521
Holliday, C. R., and Thompson, A. H. (1979). Climatological Characteristics of Rapidly Intensifying Typhoons. Mon. Wea. Rev. 107, 1022–1034. doi:10.1175/1520-0493(1979)107<1022:ccorit>2.0.co;2
Huang, X., Peng, X., Fei, J., Cheng, X., Ding, J., and Yu, D. (2021). Evaluation and Error Analysis of Official Tropical Cyclone Intensity Forecasts during 2005-2018 for the Western North Pacific. J. Meteorol. Soc. Jpn. 99, 139–163. doi:10.2151/jmsj.2021-008
Kaplan, J., DeMaria, M., and Knaff, J. A. (2010). A Revised Tropical Cyclone Rapid Intensification index for the Atlantic and Eastern North Pacific Basins. Wea. Forecast. 25, 220–241. doi:10.1175/2009WAF2222280.1
Kaplan, J., and DeMaria, M. (2003). Lager-scale Characteristics of Rapidly Intensifying Tropical Cyclones in the north Atlantic basin. Wea. Forecast. 18, 1093–1108. doi:10.1175/1520-0434(2003)018<1093:LCORIT>2.0.CO;2
Kieu, C. Q. (2012). An Investigation into the Contraction of the hurricane Radius of Maximum Wind. Meteorol. Atmos. Phys. 115, 47–56. doi:10.1007/s00703-011-0171-7
Knaff, J. A., Longmore, S. P., DeMaria, R. T., and Molenar, D. A. (2015). Improved Tropical-Cyclone Flight-Level Wind Estimates Using Routine Infrared Satellite Reconnaissance. J. Appl. Meteorol. Climatol. 54, 463–478. doi:10.1175/JAMC-D-14-0112.1
Knaff, J. A., and Zehr, R. M. (2007). Reexamination of Tropical Cyclone Wind-Pressure Relationships. Wea. Forecast. 22, 71–88. doi:10.1175/WAF965.1
Knapp, K. R., Ansari, S., Bain, C. L., Bourassa, M. A., Dickinson, M. J., Funk, C., et al. (2011). Globally Gridded Satellite Observations for Climate Studies. Bull. Amer. Meteorol. Soc. 92, 893–907. doi:10.1175/2011BAMS3039.1
Kurihara, Y., Bender, M. A., and Ross, R. J. (1993). An Initialization Scheme of hurricane Models by Vortex Specification. Mon. Wea. Rev. 121, 2030–2045. doi:10.1175/1520-0493(1993)121<2030:AISOHM>2.0.CO;2
Kurihara, Y., Bender, M. A., Tuleya, R. E., and Ross, R. J. (1995). Improvements in the GFDL hurricane Prediction System. Mon. Wea. Rev. 123, 2791–2801. doi:10.1175/1520-0493(1995)123<2791:IITGHP>2.0.CO;2
Li, Y., Wang, Y., and Lin, Y. (2019). Revisiting the Dynamics of Eyewall Contraction of Tropical Cyclones. J. Atmos. Sci. 76, 3229–3245. doi:10.1175/JAS-D-19-0076.1
Liang, J., Wu, L., Gu, G., and Liu, Q. (2016). Rapid Weakening of Typhoon Chan-Hom (2015) in a Monsoon Gyre. J. Geophys. Res. Atmos. 121, 9508–9520. doi:10.1002/2016JD025214
Liang, J., Wu, L., and Gu, G. (2018). Rapid Weakening of Tropical Cyclones in Monsoon Gyres over the Tropical Western North Pacific. J. Clim. 31, 1015–1028. doi:10.1175/JCLI-D-16-0784.1
Liu, K. S., and Chan, J. C. L. (2002). Synoptic Flow Patterns Associated with Small and Large Tropical Cyclones over the Western North Pacific. Mon. Wea. Rev. 130, 2134–2142. doi:10.1175/1520-0493(2002)130<2134:SFPAWS>2.0.CO;2
Merrill, R. T. (1984). A Comparison of Large and Small Tropical Cyclones. Mon. Wea. Rev. 112, 1408–1418. doi:10.1175/1520-0493(1984)112<1408:ACOLAS>2.0.CO;2
Molinari, J., Skubis, S., and Vollaro, D. (1995). External Influences on hurricane Intensity. Part III: Potential Vorticity Structure. J. Atmos. Sci. 52, 3593–3606. doi:10.1175/1520-0469(1995)052<3593:EIOHIP>2.0.CO;2
Montgomery, M. T., and Smith, R. (2011). Paradigms for Tropical-Cyclone Intensification. Q. J. R. Meteorol. Soc. 137, 1–31. doi:10.1002/qj.000
Qin, N., Zhang, D.-L., and Li, Y. (2016). A Statistical Analysis of Steady Eyewall Sizes Associated with Rapidly Intensifying Hurricanes. Wea. Forecast. 31, 737–742. doi:10.1175/waf-d-16-0016.1
Qin, N., Zhang, D. L., Miller, W., and Kieu, C. Q. (2018). On the Rapid Intensification of Hurricane Wilma (2005). Part IV: Inner‐core Dynamics during the Steady Radius of Maximum Wind Stage. Q.J.R. Meteorol. Soc. 144, 2508–2523. doi:10.1002/qj.3339
Qiu, W., Wu, L., and Ren, F. (2020). Monsoonal Influences on Offshore Rapid Intensification of Landfalling Typhoons in a Sheared Environment over the South China Sea. Wea. Forecast. 35, 623–634. doi:10.1175/WAF-D-19-0134.1
Rogers, R., Aberson, S., Aksoy, A., Annane, B., Black, M., Cione, J., et al. (2013). NOAA'S Hurricane Intensity Forecasting Experiment: A Progress Report. Bull. Amer. Meteorol. Soc. 94, 859–882. doi:10.1175/BAMS-D-12-00089.1
Rogers, R., Aberson, S., Black, M., Black, P., Cione, J., Dodge, P., et al. (2006). The Intensity Forecasting Experiment: A NOAA Multiyear Field Program for Improving Tropical Cyclone Intensity Forecasts. Bull. Amer. Meteorol. Soc. 87, 1523–1538. doi:10.1175/BAMS-87-11-1523
Rogers, R. (2010). Convective-scale Structure and Evolution during a High-Resolution Simulation of Tropical Cyclone Rapid Intensification. J. Atmos. Sci. 67, 44–70. doi:10.1175/2009JAS3122.1
Saha, S., Moorthi, S., Pan, H.-L., Wu, X., Wang, J., Nadiga, S., et al. (2010). The NCEP Climate Forecast System Reanalysis. Bull. Amer. Meteorol. Soc. 91, 1015–1058. doi:10.1175/2010BAMS3001.1
Shapiro, L. J., and Willoughby, H. E. (1982). The Response of Balanced Hurricanes to Local Sources of Heat and Momentum. J. Atmos. Sci. 39, 378–394. doi:10.1175/1520-0469(1982)039<0378:TROBHT>2.0.CO;2
Shieh, O. H., Fiorino, M., Kucas, M. E., and Wang, B. (2013). Extreme Rapid Intensification of Typhoon Vicente (2012) in the South China Sea. Wea. Forecast. 28, 1578–1587. doi:10.1175/WAF-D-13-00076.1
Stern, D. P., Vigh, J. L., Nolan, D. S., and Zhang, F. (2015). Revisiting the Relationship between Eyewall Contraction and Intensification. J. Atmos. Sci. 72, 1283–1306. doi:10.1175/JAS-D-14-0261.1
Tang, B., and Emanuel, K. (2010). Midlevel Ventilation's Constraint on Tropical Cyclone Intensity. J. Atmos. Sci. 67, 1817–1830. doi:10.1175/2010JAS3318.1
Vigh, J. L. (2010). Formation of the hurricane Eye. Ph.D. dissertation. Colorado state: Colorado State University, 378, 473–498pp. [Available online at http://www.ral.ucar.edu/staff/jvigh/documents/vigh2010_dissertation_corrected_color_hyperlinks.pdf]
Wang, H., and Wang, Y. (2014). A Numerical Study of Typhoon Megi (2010). Part I: Rapid Intensification. Mon. Wea. Rev. 142, 29–48. doi:10.1175/MWR-D-13-00070.1
Willoughby, H. E., Clos, J. A., and Shoreibah, M. G. (1982). Concentric Eye walls, Secondary Wind Maxima, and the Evolution of the hurricane Vortex. J. Atmos. Sci. 39, 395–411. doi:10.1175/1520-0469(1982)039<0395:CEWSWM>2.0.CO;2
Willoughby, H. E., and Rahn, M. E. (2004). Parametric Representation of the Primary Hurricane Vortex. Part I: Observations and Evaluation of the Holland (1980) Model. Mon. Wea. Rev. 132, 3033–3048. doi:10.1175/MWR2831.1
Willoughby, H. E. (1990). Temporal Changes of the Primary Circulation in Tropical Cyclones. J. Atmos. Sci. 47, 242–264. doi:10.1175/1520-0469(1990)047<0242:TCOTPC>2.0.CO;2
Wu, L., and Duan, J. (2015). Extended Simulation of Tropical Cyclone Formation in the Western North Pacific Monsoon Trough. J. Atmos. Sci. 72, 4469–4485. doi:10.1175/JAS-D-14-0375.1
Wu, L., Liang, J., and Wu, C.-C. (2011). Monsoonal Influence on Typhoon Morakot (2009). Part I: Observational Analysis. J. Atmos. Sci. 68, 2208–2221. doi:10.1175/2011JAS3730.1
Wu, L., Ni, Z., Duan, J., and Zong, H. (2013a). Sudden Tropical Cyclone Track Changes over the Western North Pacific: A Composite Study. Mon. Wea. Rev. 141, 2597–2610. doi:10.1175/MWR-D-12-00224.1
Wu, L., Zong, H., and Liang, J. (2013b). Observational Analysis of Tropical Cyclone Formation Associated with Monsoon Gyres. J. Atmos. Sci. 70, 1023–1034. doi:10.1175/JAS-D-12-0117.1
Xu, J., and Wang, Y. (2015). A Statistical Analysis on the Dependence of Tropical Cyclone Intensification Rate on the Storm Intensity and Size in the North Atlantic. Wea. Forecast. 30, 692–701. doi:10.1175/WAF-D-14-00141.1
Xu, J., and Wang, Y. (2018). Dependence of Tropical Cyclone Intensification Rate on Sea Surface Temperature, Storm Intensity, and Size in the Western North Pacific. Forecasting 33, 523–537. doi:10.1175/WAF-D-17-0095.1
Keywords: hurricane, expanding eyewall, rapid intensification, environmental influence, tropical cyclone
Citation: Qin N and Wu L (2021) Possible Environmental Influence on Eyewall Expansion During the Rapid Intensification of Hurricane Helene (2006). Front. Earth Sci. 9:715012. doi: 10.3389/feart.2021.715012
Received: 26 May 2021; Accepted: 22 July 2021;
Published: 29 July 2021.
Edited by:
Qingqing Li, Nanjing University of Information Science and Technology, ChinaReviewed by:
Jian-Feng Gu, University of Reading, United KingdomCopyright © 2021 Qin and Wu. This is an open-access article distributed under the terms of the Creative Commons Attribution License (CC BY). The use, distribution or reproduction in other forums is permitted, provided the original author(s) and the copyright owner(s) are credited and that the original publication in this journal is cited, in accordance with accepted academic practice. No use, distribution or reproduction is permitted which does not comply with these terms.
*Correspondence: Liguang Wu, bGlndWFuZ3d1QGZ1ZGFuLmVkdS5jbg==
Disclaimer: All claims expressed in this article are solely those of the authors and do not necessarily represent those of their affiliated organizations, or those of the publisher, the editors and the reviewers. Any product that may be evaluated in this article or claim that may be made by its manufacturer is not guaranteed or endorsed by the publisher.
Research integrity at Frontiers

Learn more about the work of our research integrity team to safeguard the quality of each article we publish.