 Deliang Sun1
 Haijia Wen
94% of researchers rate our articles as excellent or good
Learn more about the work of our research integrity team to safeguard the quality of each article we publish.
Find out more
ORIGINAL RESEARCH article
Front. Earth Sci. , 25 August 2021
Sec. Geohazards and Georisks
Volume 9 - 2021 | https://doi.org/10.3389/feart.2021.713803
This article is part of the Research Topic Spatial Modelling and Failure Analysis of Natural and Engineering Disasters through Data-based Methods View all 42 articles
This study aims to develop a logistic regression model of landslide susceptibility based on GeoDetector for dominant-factor screening and 10-fold cross validation for training sample optimization. First, Fengjie county, a typical mountainous area, was selected as the study area since it experienced 1,522 landslides from 2001 to 2016. Second, 22 factors were selected as the initial conditioning factors, and a geospatial database was established with a grid of 30 m precision. Factor detection of the geographic detector and the stepwise regression method included in logistic regression were used to screen out the dominant factors from the database. Then, based on the sample dataset with a 1:10 ratio of landslides and nonlandslides, 10-fold cross validation was used to select the optimized sample to train the logistic regression model of landslide susceptibility in the study area. Finally, the accuracy and efficiency of the two models before and after screening out the dominant factors were evaluated and compared. The results showed that the total accuracy of the two models was both more than 0.9, and the area under the curve value of the receiver operating characteristic curve was more than 0.8, indicating that the models before and after screening factor both had high reliability and good prediction ability. Besides, the screened factors had an active leading role in the geospatial distribution of the historical landslide, indicating that the screened dominant factors have individual rationality. Improving the geospatial agreement between landslide susceptibility and actual landslide-prone by the screening of dominant factors and the optimization of the training samples, a simple, efficient, and reliable logistic-regression–based landslide susceptibility model can be constructed.
•A hybrid optimal LR model by GeoDetector dominant-factor screening and an optimal sample
•Improved accuracy of the LR-based LSM model by hybrid optimization
•Optimized LSM agreed well with the geospatial distribution of historical and new landslide events
Among many types of geological disasters, such as land subsidence and mudslides, landslides are the most common ones (Abedi Gheshlaghi and Feizizadeh, 2021). Because they are frequent, destructive, and widespread, every country attaches great importance to the monitoring and prevention of landslides (Naemitabar and Zanganeh Asadi, 2021). About two-thirds of China’s area is a mountainous region, where landslides are most prone to occur (Gautam et al., 2021). From 2007 to 2019, it is conservatively estimated that the number of deaths/missing caused by landslides exceeded 7,900, with an average of more than 600 per year. According to statistics from the China Geological Environment Information Site, the economic loss is about 610 million dollars each year.
The evaluation of landslide susceptibility is an important part of the whole process of landslide risk management, which has achieved the effect of preventing and reducing landslide losses (Feizizadeh et al., 2014). With the development of geographic information science (GIS) technology, scholars have actively explored landslide susceptibility mapping (LSM) methods (Li et al., 2019; Zhao et al., 2021). So far, dozens of landslide susceptibility mapping (LSM) methods have been developed, which can be divided into several categories, including statistical methods, expert-based methods, and data mining methods (Kalantar et al., 2018; Ma and Xu, 2019). Huang et al. (2020), Wubalem (2021), Huangfu et al. (2021), and Soma et al. (2019) used semisupervised multiple-layer perceptron, information value, a multiple logistic regression algorithm, frequency ratio (FR), and logistic regression (LR) models to produce LSM. Among these different evaluation methods, the most common and reliable one is logistic regression (Ayalew and Yamagishi, 2005; Kalantar et al., 2018; Shan et al., 2020). Some scholars have discovered that the longitude of LRM can be improved by changing the parameters or models that optimize LRM. Feby et al. (2020) optimized the logistic regression model by spatially integrated evidential belief function. The ROC-AUC value of the optimized model is 0.935, which is more satisfactory than the traditional model. The results of LSM research are not only affected by the selected model but also closely related to the choice of conditioning factors (Xie et al., 2021). Reichenbach et al. (2018) found that a total of 596 conditioning factors were considered in the existing work, with an average of nine condition factors in each model. In the existing research, the selection of condition factors is mostly determined by expert experience, which is very subjective (Bourenane et al., 2015; Morales et al., 2021; Zhao et al., 2021). The current research lacks a general framework to objectively select the condition factors. Therefore, how to screen out dominant factors more objectively and quickly and then build a more stable and reliable model is the focus of current research.
Among the methods for factor screening in existing research, GeoDetector is a very common one (Zhou et al., 2021). Chi et al. (2021) analyzed the influence of specific geographical factors on the spatial distribution of terrestrial mammalian richness using the GeoDetector model. Wang et al. (2021) used GeoDetector to identify spatial relationships among the influencing factors about soil heavy metal As. Sun et al. (2021c) constructed the LSM model in Fengjie County by selected fundamental influencing factors, which are screened by GeoDetector and recursive feature elimination. Although the logistic regression model has a large number of applications in the field of LSM, due to the limitation of the model itself, it has limitations in dealing with a large number of conditioning factors with multicollinearity (Sun et al., 2021b). In addition, in the existing research, there is no article about the combining usage of GeoDetectors and logistic regression.
Based on previous researches, this paper aims to propose an optimized landslide susceptibility evaluation model. This study takes Fengjie County as the study area, systematically considers the formation conditions of the landslide, and selects the conditioning factors as comprehensively as possible when conditions permit. Then, through the combination of GeoDetector and the stepwise regression method, the characteristic disaster conditioning factors are screened. Then, the 10-fold cross-validation method is used to select the best training sample. After training, an optimized logistic regression model of landslide sensitivity is obtained, and finally, the optimized model is evaluated through GIS software in the study area.
Fengjie County of Chongqing, with typical mountainous landforms, is located in the east of the Sichuan Basin, the upper reaches of the Yangtze River (Figure 1). It is the junction of the Dabashan arc fold fault zone and east Sichuan arc concave fold zone, with the sophisticated structural stress field. The range of elevation is 87–2,125 m, which is higher in the terrain in the north than that in the south in general. It is located in the subtropical monsoon climate zone, with an annual average precipitation of 1,132 mm in many years.
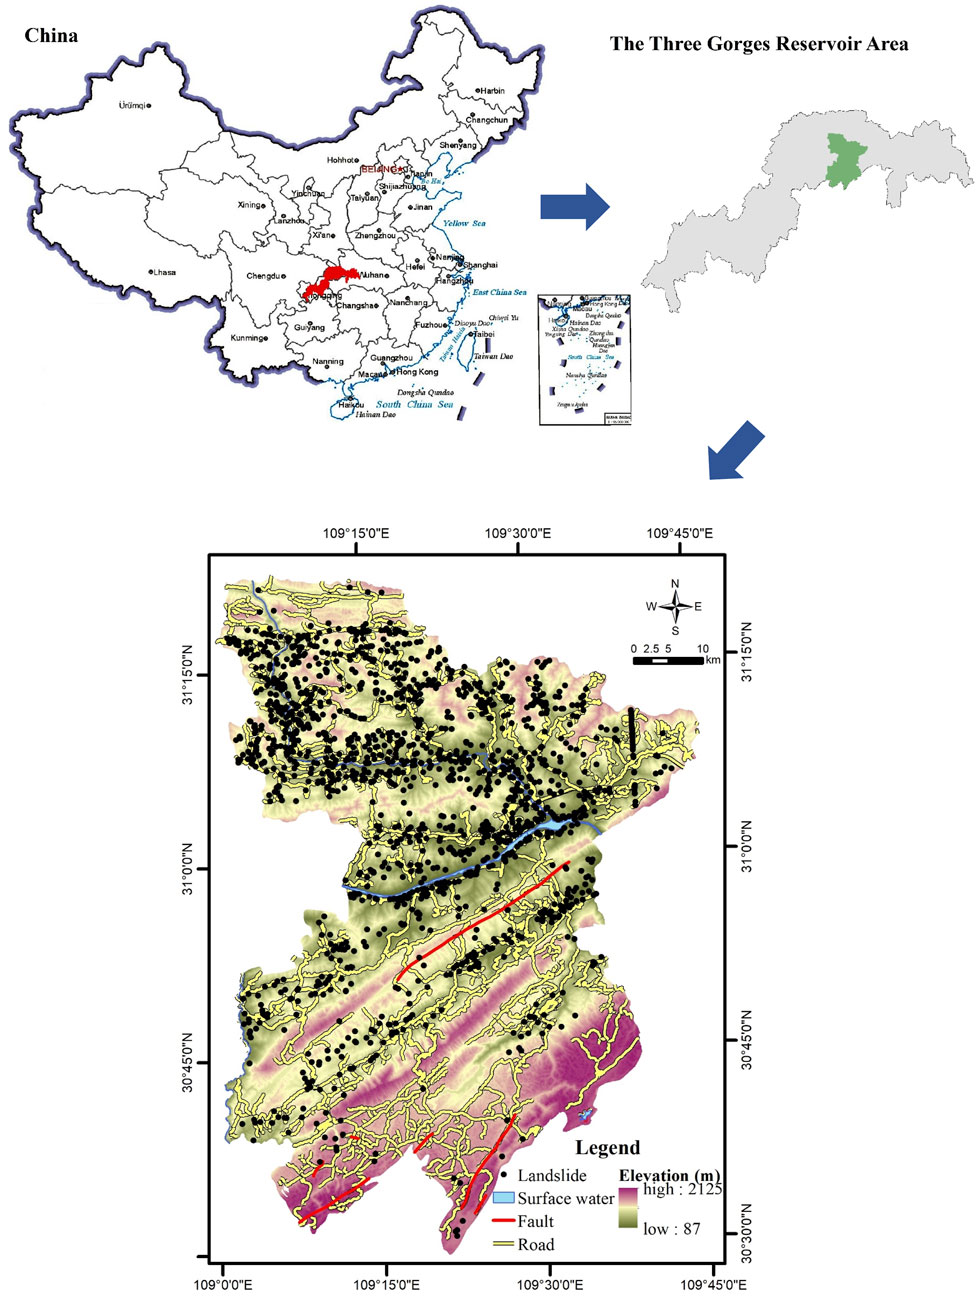
FIGURE 1. Location of the study area.
The data of landslides in Fengjie County were obtained from the Chongqing Geological Environment Monitoring Station. Its attributes contained the landslide name, coordinates, elevation, and time of occurrence. The 1:200,000/1:50,000 geological map of the China Geological Information Library (available online: http://ngac.org.cn/) provides a reference basis for the site investigation of landslides in terms of regional geological environment, geological structure, and stratigraphic lithology. The data of Chongqing points of interest (POI) were obtained using a python program or foot written according to certain rules that can automatically capture World Wide Web information. These activity points are standard for various types of commercial and educational activities that can represent human engineering activities, such as hospitals, primary and secondary schools, business centers, parks and squares, and so on. Also, the time range was consistent with the historical landslides. Other primary data information is shown in Table 1.
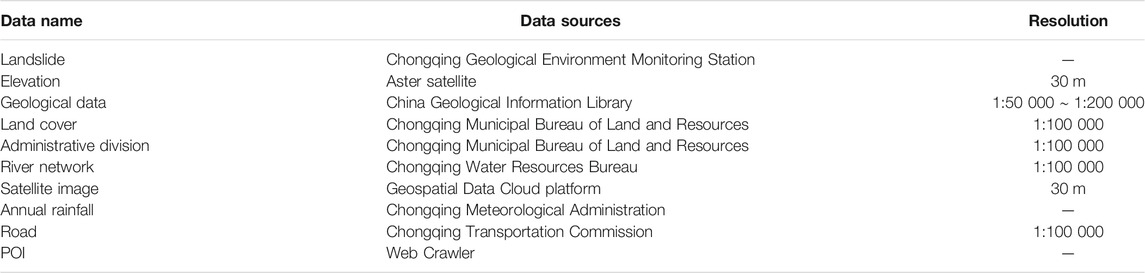
TABLE 1. Data and data sources.
In this study, Fengjie County, a typical mountainous county in the Three Gorges Reservoir area of China, was chosen as a test site to carry out the research. The methodological flowchart is shown in Figure 2. Firstly, we selected 22 factors as the initial conditioning factors for LSM, which were derived from a satellite image, a DEM, geological data including lithology and faults, and other multisource data. Secondly, a geospatial database was established based on all data (including landslides and nonlandslides). By including geographic factor detection into a stepwise logistic regression (LR) procedure, screening out the dominant factors was then performed. Then, 10-fold cross validation was used to select the optimized training sample to generate the LSM in the study area. Then, a stable LR model with dominant factors was applied for higher accuracy and stability. Finally, the accuracy of the two models before and after optimization was evaluated and used for LSM.
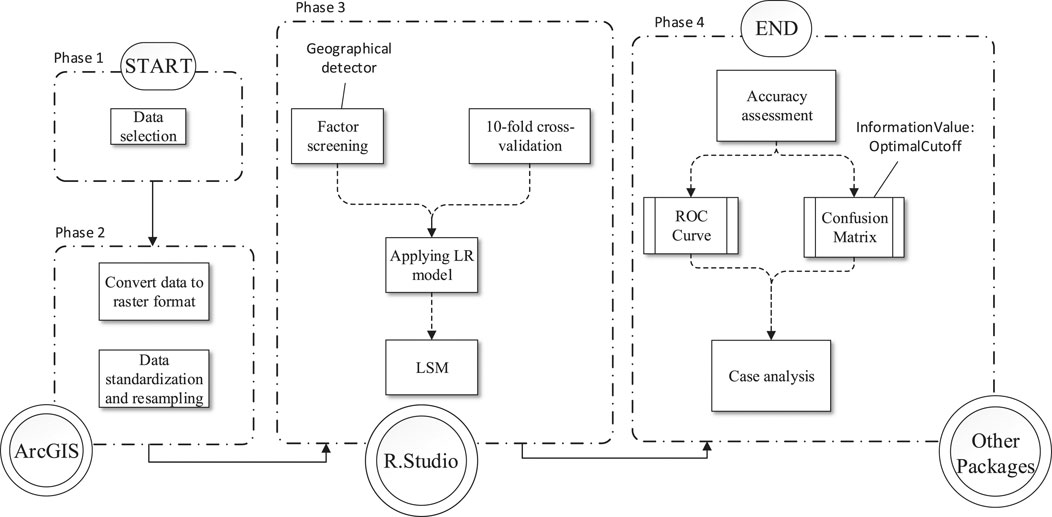
FIGURE 2. Methodological flowchart used in this study.
Logistic regression (LR) is a generalized linear regression analysis method suitable for multivariable control. Different from the general linear regression model, the logical regression model restricts the output value to the interval [0,1] through the sigmoid function. Therefore, f(z), representing the probability of landslide susceptibility, can be expressed by the following equation:
where z = w1x1+ w2x2+…+wMxM + b is a weighted linear combination model. b is a constant number, which is the intercept of a function. wM (M = 1,2,3,…,22) is the correlation coefficient of the function. The independent variable xM (M = 1,2,3,…,22) represents 22 landslide conditioning factors. When the f(z) value is 1, it means that a landslide will surely occur, and when it is 0, it means no landslide will occur (Kalantar et al., 2018).
The LR model includes the stepwise regression method to screen and eliminate the variables, thus eliminating multicollinearity and obtained significant factors. The stepwise regression is of three steps. The first step is introducing variables into the model one by one. Second, an F test is performed after introducing each explanatory variable. The final step is to perform a t-test on the explanatory variables already in the model. Once the newly added explanatory variable causes the previous explanatory variable to be no longer significant, it shall be eliminated to ensure that only essential variables are included in the regression equation before introducing each new variable.
The GeoDetector is a statistical method proposed by Wang in 2010 (Wang et al., 2010), which is used to detect spatial differentiation, revealing its driving force based on four detectors: differentiation and factor detection, interaction detection, risk-area detection, and ecological detection. This method can work both on numerical and qualitative data. In this study, to improving geospatial agreement between landslide and its conditioning factors, the factor detection function was used to screen the landslide dominant factor.
The general assumption of landslide factors screening using the GeoDetector can be expressed as follows: if a conditioning factor controls or contributes to a landslide, the geospatial distribution should be similar to a certain extent between the conditioning factor and the landslide. The similarity between the two is determined by the local and global variance (Luo and Liu, 2018). Let X be a layer of data representing the impact factors (e.g., lithology or slope) of our interests and the binary variable Y quantitatively represent the spatial distribution of the landslide. X needs to be either a category layer (for example, lithology) or can be transformed into a category zone (for example, a continuous slope can be divided into three areas: gentle, moderate, and steep). Overlaying Y and X layers subdivide Y according to the area of X.
If the factor X is related to Y, then Y will exhibit a spatial distribution similar to that of X. In the perfect case, factor X thoroughly explains the pattern of Y, the value of Y is uniform in each region of X, and the spatial variance of Y in all regions is 0. In reality, the degree of spatial correspondence between X and Y is measured by the degree of interpretation of factor X, which is defined as
where m = 1,…, S is the layering of variable Y or factor X, that is, classification or partition; Nm and N are the layer m and the number of units in the whole area; and
10-fold cross validation, used to test the accuracy of the algorithm, is a common test method. The dataset was divided into ten parts, nine of which were used as training data and one as test data in turn.
The correct rate (or error rate) will be obtained for each test. The average value of the accuracy of the results 10 times is used as the estimation of the accuracy of the algorithm. Generally, multiple 10-fold cross validations (for example, 10-fold cross validation) are needed, and then, the average value is calculated as the estimation of the accuracy of the algorithm.
The landslide’s occurrence is affected by both the internal geographical environmental factors and external disturbance environmental factors (Tsangaratos et al., 2017). The internal factors include topographic and geological conditions, while the external factors include human engineering activities, rainfall, and reservoir water level changes. Based on comprehensive consideration of various factors and the actual conditions of the study area, 22 factors were selected as the initial conditioning factors including topography (elevation, slope, degree of relief, aspect, slope position, landforms, curvature, profile curvature, plan curvature, terrain roughness index (TRI), topographic wetness index (TWI), sediment transport index (STI), and stream power index (SPI)), geology (lithology, distance from fault, and combination reclassification of the stratum dip direction and slope aspect (CRDS)), environmental conditions (normalized vegetation index (NDVI), distance from hydrographic net, annual average rainfall, and land cover), and human activities (distance from roads and POI kernel density). All the 22 conditioning factors mentioned above were used to create the geospatial database with GIS software (Sun et al., 2021c).
Here, slope, degree of relief, aspect, slope position, landforms, curvature, profile curvature, plan curvature, terrain roughness index (TRI) (Althuwaynee et al., 2014), topographic wetness index (TWI) (Yilmaz 2009; Hong et al., 2016), sediment transport index (STI) (Pourghasemi et al., 2012), and stream power index (SPI) (Moore and Wilson, 1992) were based on the processing of the DEM with 30 m resolution. Lithology and faults were extracted by geological maps with scales of 1:50,000–1:200,000. The distances from faults, hydrographic nets, and roads were generated after buffering the faults, river networks, and roads, respectively. The selection of buffer distance was based on field surveys, imagery resolution, and previous research (Xie et al., 2018; Sun et al., 2021a). CRDS (Sun et al., 2021b) was generated by subtraction and reclassification of aspect and tendency. NDVI was calculated using landsat8 OLI data with a resolution of 30 m. Annual average rainfall was generated by the spatial interpolation method from the original data. POI kernel density was generated by kernel density calculation of POI point data, which refers to any nongeographical meaningful points on the map (Sun et al., 2021b).
Moreover, to reduce the disadvantageous effects on the model caused by data discretization, reclassification was performed for the 13 continuous variables, including elevation, slope, degree of relief, curvature, profile curvature, plan curvature, TRI, TWI, STI, SPI, NDVI, annual average rainfall, and POI kernel density. Here, based on research experiences, the reclassification threshold value of each factor obtained by the natural breakpoint method was followed to slightly adjust by counting the number of historical landslide points under each category to agree with the actual situation as much as possible. The other nine factors, which were originally classified, could directly be processed. A classification scheme used was established for each continuous factor. To sum up, a spatial database of landslide conditioning factors after reclassification was constructed in a 30 m resolution grid cell. The thematic map of landslide influencing factors is shown in Figure 3.
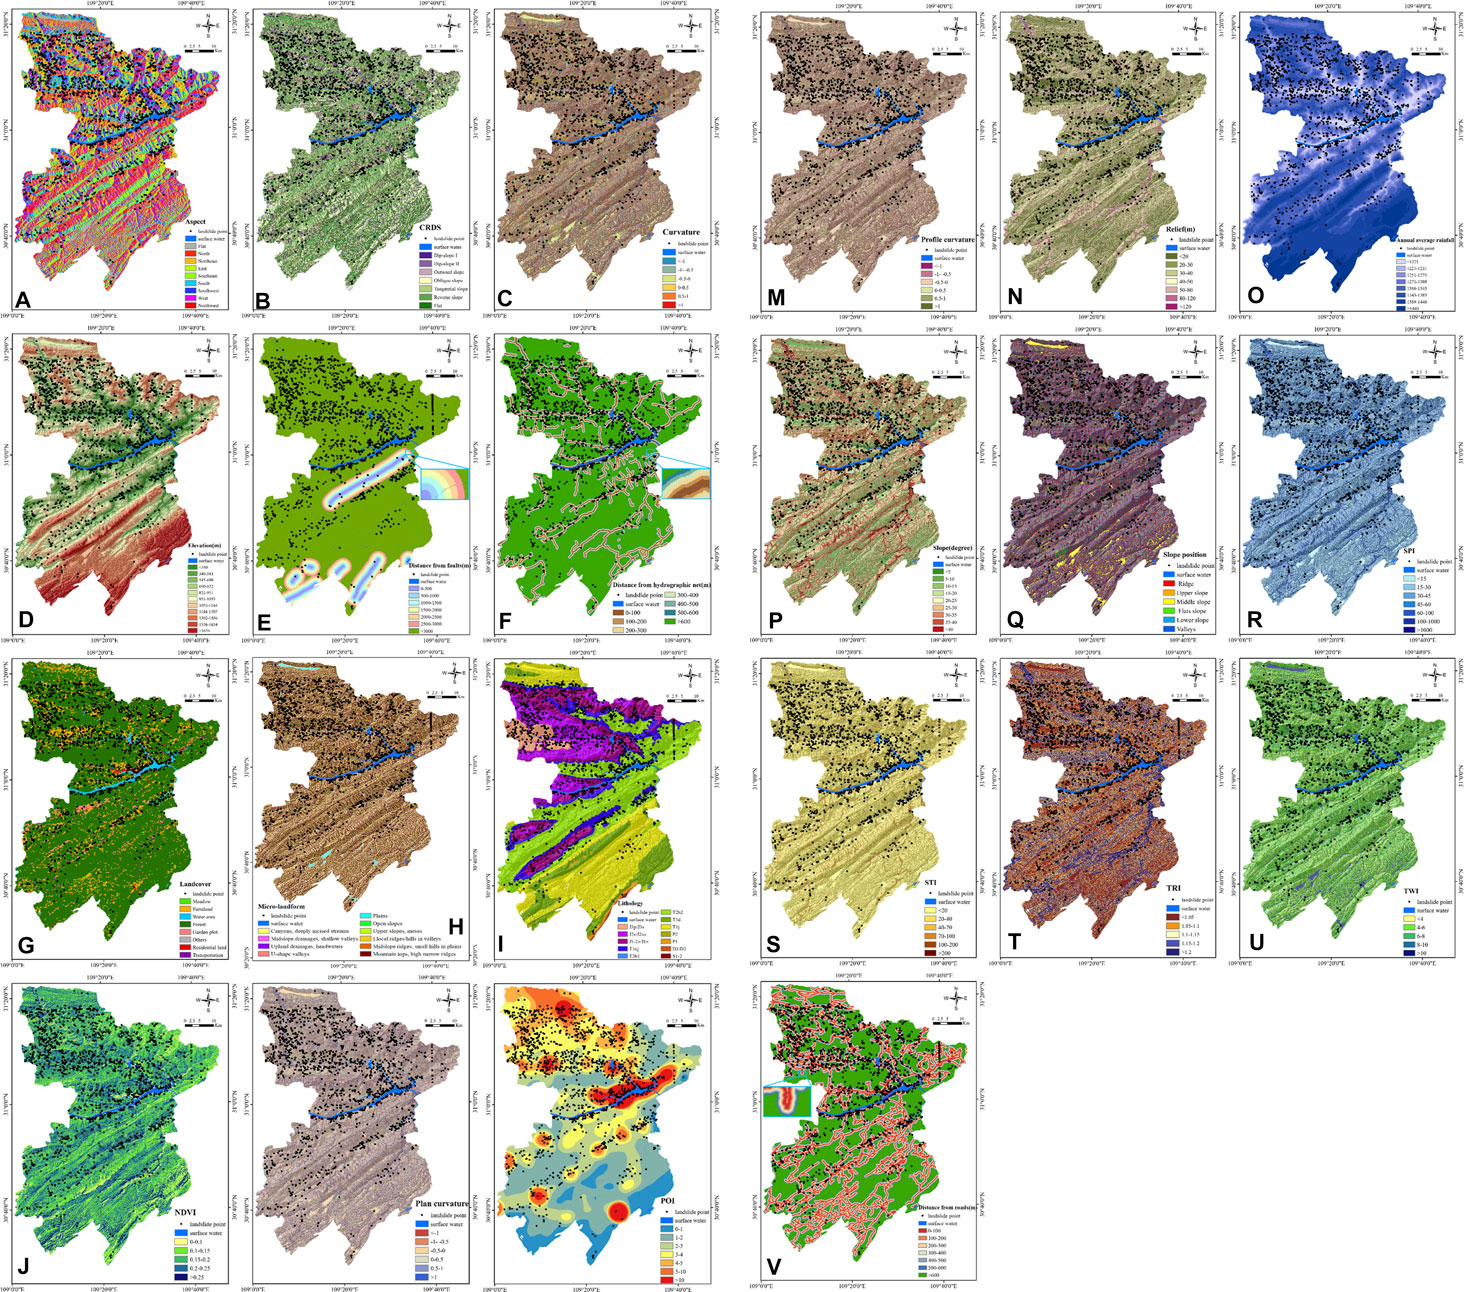
FIGURE 3. Thematic map of landslide influencing factors: (A) aspect; (B) CRDS; (C) curvature; (D) elevation; (E) distance from faults; (F) distance from hydrographic net; (G) landcover; (H) microlandform; (I) lithology; (J) NDVI; (K) plan curvature; (L) POI; (M) profile curvature; (N) relief; (O) annual average rainfall; (P) slope; (Q) slope position; (R) SPI; (S) STI; (T) TRI; (U) TWI; and (V) distance from roads.
To reduce the affection of the logistic regression model by factor data discreteness, all the 22 factors after reclassification were normalized to [0,1] by the following equation:
where X* is the normalized data; X is the original data; Xmin is the minimum value of data; and Xmax is the maximum value of data.
In the study, landslide cells (positive cells) and no-landslide cells (negative cells) made up all datasets. Landslide cells consisted of 1,522 historical landslide events, each of which was regarded as a single cell. Because of the geometric effect, all landslide cells were excluded by setting a 500 m buffer zone for all the 1,522 landslide points, and the remaining areas were regarded as the no-landslide areas (Xie et al., 2018). Researchers have different opinions on the ratio between landslide and nonlandslide cells, but the most widely used ratios are 1: 1, 1: 5, and 1:10 between landslide and no-landslide cells, and the last ratio of 1:10 was selected by this study after many experiments. 15,220 nonlandslide cells were randomly extracted from the no-landslide area.
The process of preliminary training: according to a 7: 3 ratio, all sample datasets were divided into a training dataset (11,720) and a test dataset (5,022). The training dataset was used for LR model training, and the test dataset was used for testing.
1) The stepwise regression method included in the LR: 22 initial conditioning factors were subjected to stepwise regression training of the LRa model (ordinary model). The conditioning factors were introduced into the equation one by one. All conditioning factors in the equation were tested one by one, and the insignificant conditioning factors were removed from the equation one by one. In the final equation, some conditioning factors that had a significant influence on the Y value of the landslide remained, and others that had no significant influence on the Y value of the landslide were omitted. Also, 11 factors were preliminarily selected by passing the test of the significance level of 0.05, which are topographic (elevation, degree of relief, slope, SRI, and SPI), geological conditions (lithology, distance from fault, and CRDS), environmental conditions (land cover), and human activities (distance from roads and POI kernel density).
2) The factor detection method of the GeoDetector: based on the R language, we used the GeoDetector to detect all datasets, including 22 initial conditioning factors. The results are shown in Table 2. The p value represents the significance level, and the q value represents the explanatory factor power, i.e., the influence degree of conditioning factors on the landslide. We found that SPI and STI failed the significance test (p > 0.05). Therefore, we eliminated these two nonsignificant and least explanatory factors directly. The remaining 20 factors passed the significance test (p = 0.000) and can be so in subsequent experiments.
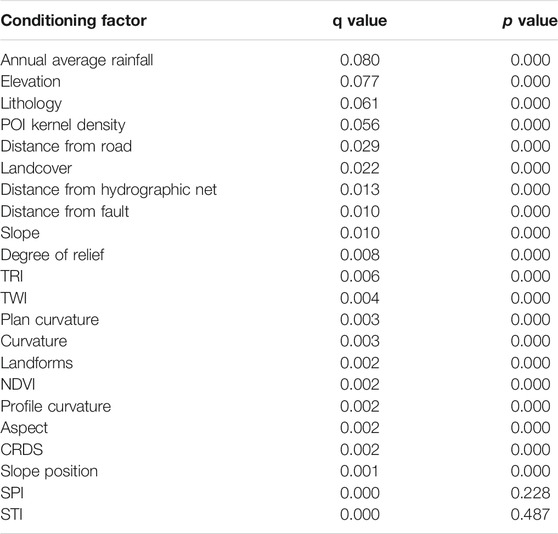
TABLE 2. Factor detector results.
Figure 4 shows the factor detection results of the significant factors in descending order of q value. In conjunction with Table 2, we found that the annual average rainfall and elevation were two important control factors for the spatial differentiation of Y values of landslides. Their q values (the ability to explain factors) were all greater than 0.075. The q values of the topographical conditions (except elevation), part of geological conditions (distance from fault, CRDS), and environmental conditions (NDVI) were less than or equal to 0.01. From the slope of the curve in Figure 4, the slope after distance from fault is almost 0, which means that the following 13 factors explain the spatial differentiation of landslides very little and can be ignored and eliminated directly. Therefore, the seven dominant factors (annual average rainfall, elevation, lithology, POI kernel density, distance from road, land cover, and distance from hydrographic net) were selected and placed in the LRb model (the model optimized by the GeoDetector). Moreover, we use these seven factors for stepwise regression training included in LR. All factors were retained, which means the dominant factors screened by the GeoDetector had vast differences from each other.
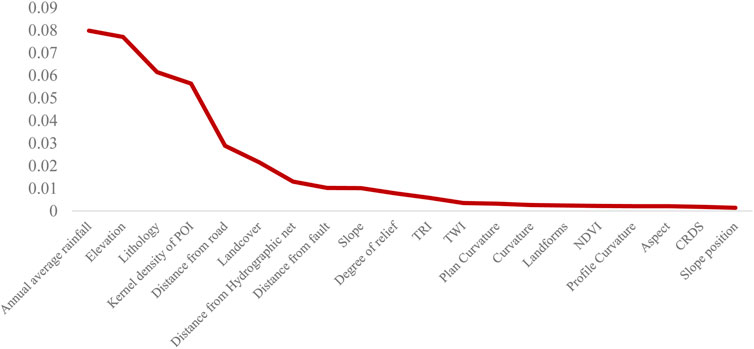
FIGURE 4. Factor detector results.
To reduce the influence of a single sampling on results, the 10-fold cross-validation method was used to select the training sample and test sample. The 10-fold cross-validation method divided the sample dataset (1,522 positive cells and 15,220 negative cells) into ten disjoint subsets randomly and averagely. One subset was tested each time, and the rest subsets were used for model training.
Based on the R language, we build two LR models of whether to use the GeoDetector (LRa was not used and LRb was used). Table 3 shows the accuracy of the 10-fold cross validation of the two models. The average accuracy of the training dataset and test dataset of the LRa model was 0.908 and 0.910, while the average accuracy of both the training dataset and test dataset of the LRb model was 0.910. Thus, from the average accuracy, we found that the model using the GeoDetector to screen dominant factors can maintain high accuracy and high stability. For the test dataset, the accuracy of sample No.1 (0.916) of the LRa model and sample No.4 (0.929) of the LRb model was relatively higher. Therefore, we decided to use the two samples as the optimal training samples to get the final models (LRao and LRbo), which were based on dominant-factor screening and the optimal training samples.
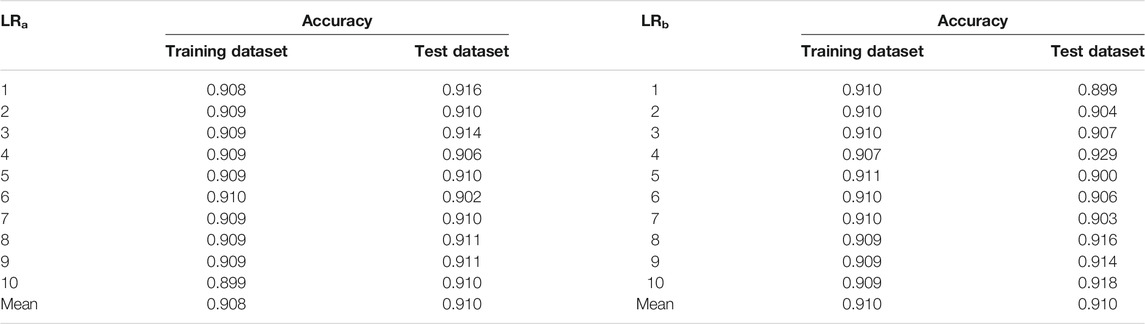
TABLE 3. The accuracy of 10-fold cross validation of the two models.
The two final models (LRao and LRbo) were different. Specifically, the former is an LR model that only performed a stepwise regression on 22 initial conditioning factors to remove insignificant factors, while the latter used the GeoDetector to screen out seven dominant factors first and then performed stepwise regression. The correlation coefficients and function intercept values of the factors of the two final models are shown in Tables 4, 5.
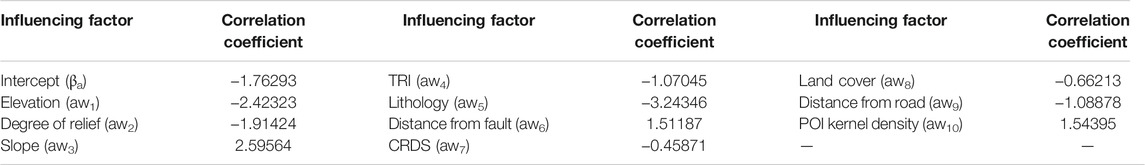
TABLE 4. The correlation coefficients and function intercept values of LRao.
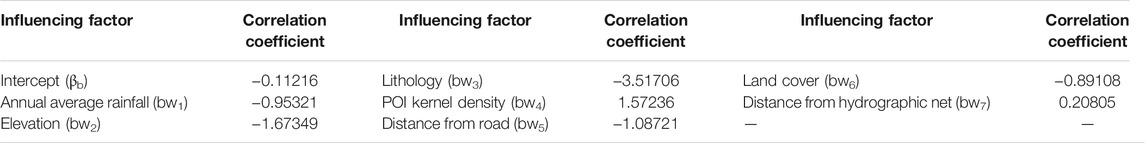
TABLE 5. The correlation coefficients and function intercept values of LRbo.
Finally, the two linear models are shown as follows:
Any landslide susceptibility assessment will have no scientific significance without validation, so it is necessary to evaluate the validity of the models used. The landslide is prone to a typical binary classification problem, and the confusion matrix can be used to analyze the accuracy further. Instances are divided into positive and negative categories. That is to say, if the sample point is a landslide, it is positive, and if the sample point is a nonlandslide, it is negative. We predicted that four situations will occur in results: 1) an instance status is “landslide” and also predicted as “landslide,” recorded as True Positive (TP); 2) “nonlandslide” but predicted as “landslide,” recorded as False Positive (FP); 3) an instance status “nonlandslide” and predicted as “nonlandslide,” and it is recorded as True Negative (TN); and 4) “landslide” but predicted as “nonlandslide,” recorded as False Negative class (FN). Furthermore, we used the “OptimalCutoff” function of the “InformationValue” package of R language to find the optimal threshold for partitioning the prediction results of the model. If the predicted value is greater than the threshold, a landslide will occur. Otherwise, the landslide will not occur.
Based on the confusion matrix, Receiver Operating Characteristic (ROC) curves and Area Under the Curve (AUC) values are commonly used to comprehensively test and evaluate model accuracy (Naghibi and Moradi Dashtpagerdi, 2016). When the AUC value is more significant than 0.5 and the closer it is to 1, the higher the accuracy of the model prediction.
The optimal thresholds of LRao and LRbo models were very similar, which were 0.534 and 0.592 (Table 6). The accuracy, precision, and recall of the LRao and the LRbo were almost the same. The total accuracy of the two models had little difference, which was 0.911 and 0.910, respectively. Nevertheless, the accuracy of landslide and nonlandslide of the LRao model (nonlandslide: 0.914; landslide 0.611) was slightly higher than that of the LRbo model (nonlandslide: 0.911; landslide 0.595). The two models had extremely high recall rates for nonlandslide, and the LRao (0.996) is slightly lower than the LRbo (0.998). However, for landslides, the recall rate was lower, and the LRao (0.065) was slightly higher than the LRbo (0.031). The difference between the two models was insignificant, and both had exceptional reliability.
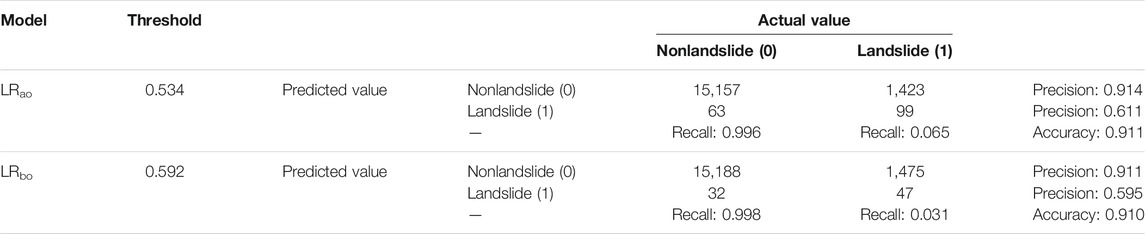
TABLE 6. Confusion matrix between observed and predicted values under optimal threshold conditions for LRao and LRbo models.
The AUC values of the ROC curves of the training dataset of the two models were 0.843 and 0.835, the test dataset were 0.834 and 0.840, and all datasets were 0.842 and 0.835 (Figure 5), indicating that the LR model before and after optimization in this study both had high reliability and good prediction ability.
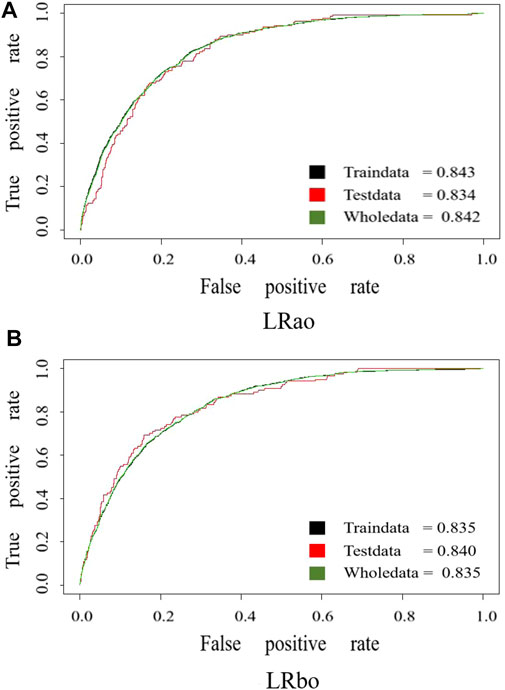
FIGURE 5. ROC curve of the LRao and the LRbo models.
Compared with the LRao, the LRbo (the optimized model) had absolute stability and high accuracy. So, we applied the LRbo to the entire case study area for LSM. Expert empirical methods and dynamic setting threshold methods were used to select the appropriate division-level threshold. The selection of the optimal threshold should minimize the density of historical landslides in the low-susceptibility region and maximize the density of historical landslides in the high-susceptibility region. After repeated trials and errors, five susceptibility levels were finally divided (very-low–susceptibility region with p < 0.05 vs. low-susceptibility region with 0.05 ≤ P < 0.10 vs. moderate-susceptibility region with 0.10 ≤ P< 0.17 vs. high-susceptibility region with 0.17 ≤ P < 0.28 vs. very-high–susceptibility region with p>=0.28) (Figure 6). It shows the very-low– and low-susceptibility regions were concentrated in the south and southeast of Fengjie County. Meanwhile, the high- and very-high–susceptibility regions, which agreed with the geospatial of the historical landslides prone to occurring, were concentrated on both sides of the Yangtze River and its tributaries, mainly in the northern and central parts of Fengjie County.
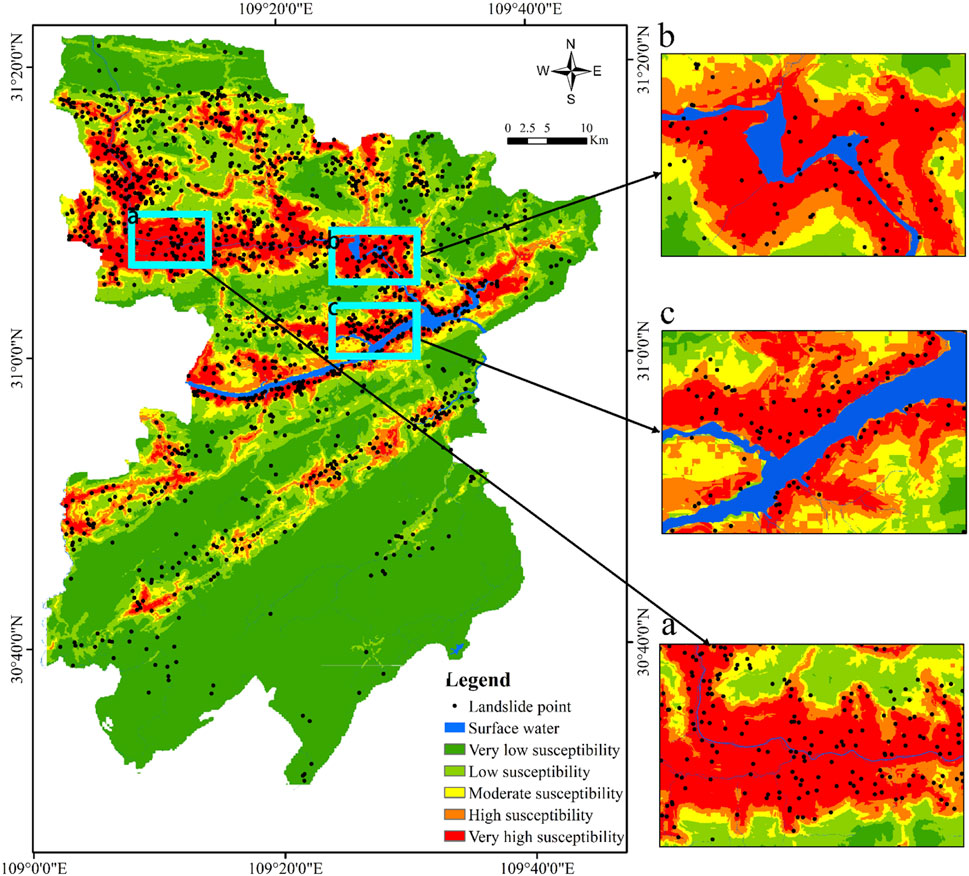
FIGURE 6. Landslide susceptibility mapping based on the LRbo model vs. the geospatial distribution of historical landslides.
Table 7 is the statistical result of landslide susceptibility at different levels. The proportion of historical landslides increased gradually with the increase of the susceptibility level, and the density of landslides was positively correlated with the susceptibility level. The area of very-low– and low-susceptibility regions accounted for 65.43% of the total area of the study area, while the number of historical landslides only accounted for 23.85% of the total landslides; the area of very-high– and high-susceptibility regions accounted for 20.51% of the total area, while the number of historical landslides accounted for 57.42% of the total landslides. This also shows the agreement of the geospatial between the high-susceptibility regions and the historical landslides occurred.
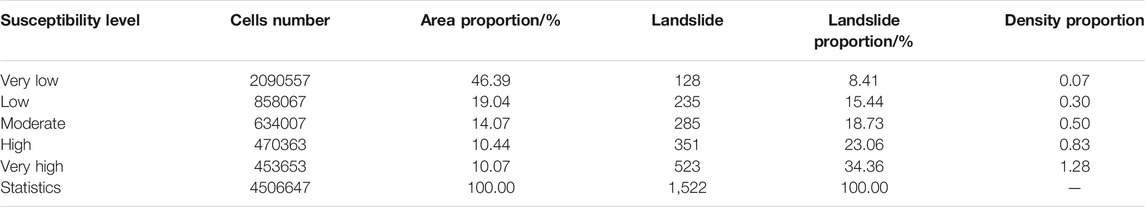
TABLE 7. Statistical results of landslide susceptibility in different levels.
The historical landslide data used in this study were from 2001 to 2016. To verify the LSM results further, we also collected 61 new landslide data in the study area in 2017. All the new landslides were triggered by rainfall, which means that the main factor inducing landslides is rainfall in this study area. The geospatial distribution of the new landslides was overlaid to the LSM (Figure 7), and Table 7 shows the details including the location susceptibility level of all the new landslide events. 65% of the new landslide events were located in the high- and very-high–susceptibility regions, and 10% were in the moderate-susceptibility region in general. For case study purposes, we analyzed three typical landslides: Qulongxiaoxue landslide, Sujiawan landslide, and Tianjiadawu landslide. Qulongxiaoxue landslide was a medium-sized landslide, which was the largest of all new landslides, covering an affected area of 28.179 m2. Although the area and volume of the Sujiawan landslide were not significant, the number of people affected and the number of threats were second. Tianjiadawu landslide was a medium-sized landslide that occurred in northwestern Fengjie County in October 2017. These three landslides were located in the high-susceptibility region, indicating that the LSM has a good geospatial agreement with the actual landslide events and the model had a good prediction ability.
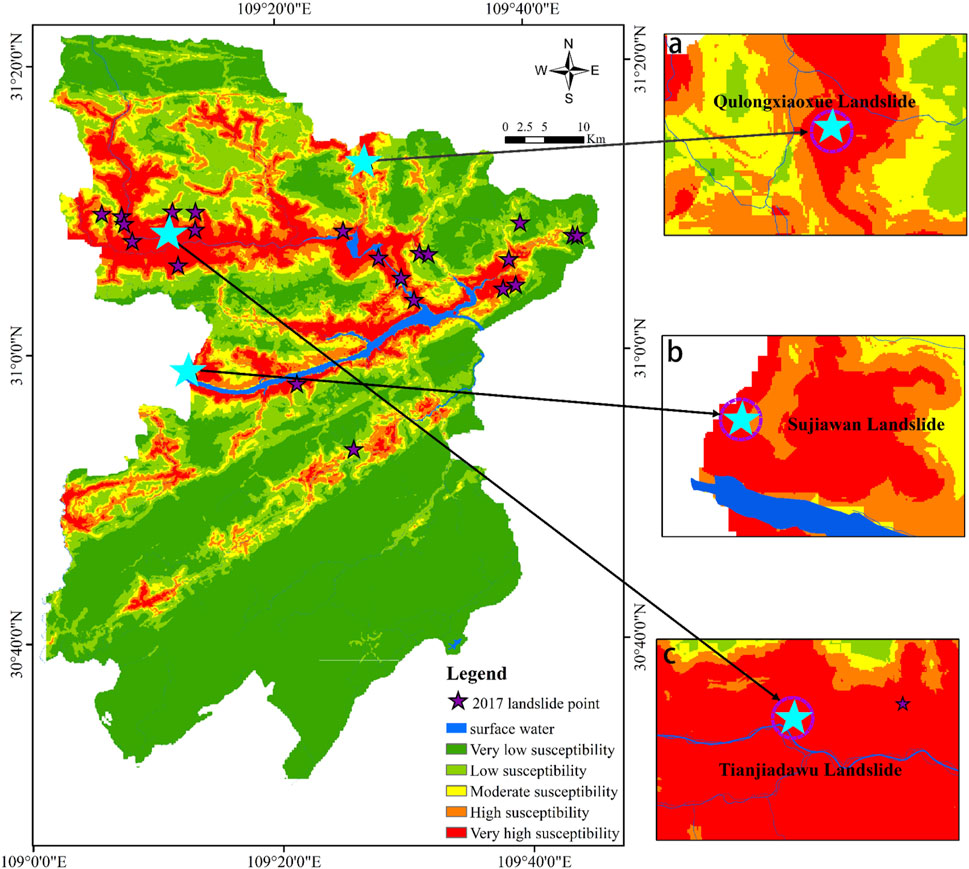
FIGURE 7. Landslide susceptibility mapping based on the LRbo model vs. the geospatial distribution of new landslides.
Comparing the results of factor screening of the two models (Figure 8), there are 10 main factors retained by the LRao model after stepwise regression. However, there are seven main factors retained by the LRbo model after GeoDetector and stepwise regression. Through comparative analysis, it is found that the same main factors retained both by the LRao model and the LRbo model include elevation, lithology, land cover, distance from roads, and POI kernel density. Among them, elevation and lithology represent the inoculation factors of landslides, which largely determine the stability of local slopes (Sivakumar and Ghosh, 2021; Tang et al., 2021). In the same way, the materials covered by the ground affect the slope surface, such as runoff and the accumulation of materials on the slope surface. Distance from roads and POI kernel density represent trigger factors caused by human activities. The abovementioned two factors change the natural stress on the originally stable slope, causing cracks inside the slope. Finally, that leads to landslides. Therefore, the dominant factors selected by stepwise regression and GeoDetector are quite reasonable and referential.
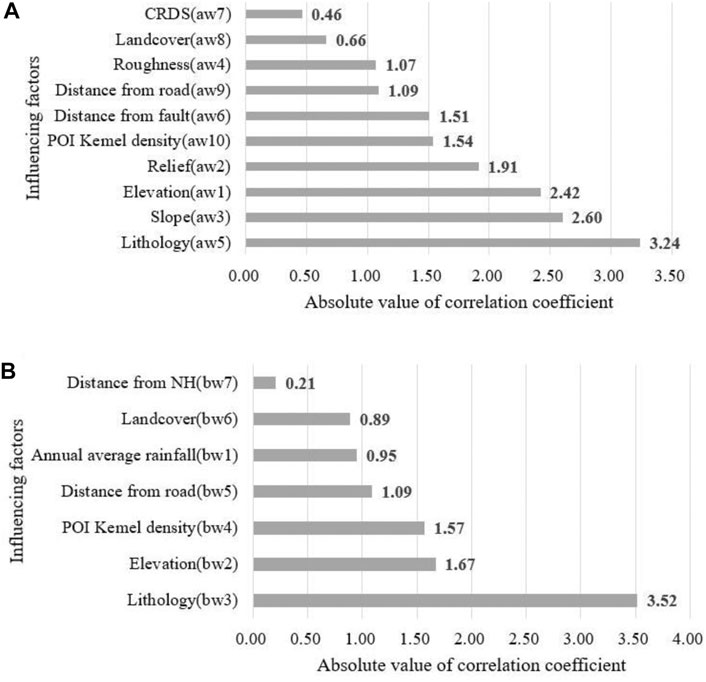
FIGURE 8. Ranking chart of the absolute value of the correlation coefficient of conditioning factors: (A) LRao model; (B) LRbo model.
In addition to the five common factors in the LRao model, another five main influencing factors are also retained including the degree of relief, slope, TRI, distance from the fault, and CRDS. These factors are all related to the incubation conditions of the landslide and describe the development environment of the landslide itself. While there are still two main conditioning factors that remained in the LRbo model except for the five same ones, they are the distance from the hydrographic net and annual average rainfall. In river valleys, high and steep slopes are usually formed under the erosion action of water currents, where the resistance ability of the slopes will be further reduced. Rainfall is one of the factors that cannot be ignored that affects and controls landslides. Throughout the world, judging from the reasons for many landslides (Fan et al., 2020; Yang et al., 2020; Van Tien et al., 2021a; Van Tien et al., 2021), the LRbo model retains some important trigger factors which are not retained by the LRao model. Although the relationship between landslides and faults cannot be ignored (Wang et al., 2021), most landslides are induced by rainfall in the study area, which does not have a strong relationship with faults. So, it is better not to retain the fault factor. Taken together, the dominant factor retained by the LRao model is not as strong as the explanatory power of the LRbo model. The LRbo model eliminates unreasonable factors based on the LRao model and retains a more dominant factor.
From the factor screening results of the LRbo model, four aspects have an important influence on the landslide, including topography, geological conditions, environmental conditions, and human activities. There are dominant factors in these four aspects, so in future research, these dominant factors can be considered as the research focus, while nondominant factors can be selectively excluded from the factor framework to reduce the workload. Meanwhile, there is an interaction between factors, which may increase or weaken the impact of a single factor on landslides. For example, if a slope is composed of permeable rock and impermeable rock, a water barrier will form naturally, and under the action of rainfall, the probability of landslide will be much higher than that of a slope composed of a single lithology. Therefore, the interaction between factors will be further studied in the follow-up work.
In this study, by taking a typical landslide-prone area as an example of application analysis, an optimized LR-based LSM model was proposed by using comprehensive methods of the GeoDetector, stepwise regression, and 10-fold cross validation, which improved the geospatial agreement between landslide susceptibility and actual landslide-prone.
1) The accuracy of the confusion matrix of the two models (LRao and LRbo) based on dominant-factor screening and optimal training sample was both more than 0.9. The AUC values of the ROC curves were significantly more than 0.8. The models had great prediction ability and high reliability no matter when tested before or after the screening factor.
2) The LRbo model based on the GeoDetector screening factor used only seven dominant factors but achieved the same prediction accuracy as the LRao model constructed with 20 factors. Moreover, the conditioning factors were more reasonable and stable than the LRao model. Based on the optimized LR model, the LSM in this study was in good agreement with the spatial distribution of historical landslides. Most of the new landslides in 2017 were in high-susceptibility regions. All show that the method proposed in this study using the GeoDetector, stepwise regression, and 10-fold cross validation is feasible and reliable.
3) The seven dominant factors, including elevation, lithology, distance from hydrographic net, annual average rainfall, land cover, distance from roads, and POI kernel density, covered four types of conditions of topographical, geological, environmental, and human activities, screened from 22 initial factors by the GeoDetector, indicating that each type has a dominant factor at least, which is more important than other factors of the same type.
The raw data supporting the conclusion of this article will be made available by the authors, without undue reservation.
This paper represents a result of collaborative teamwork. HW conceived the method, designed and conducted the test and analysis, and reviewed and edited the manuscript; DS wrote the manuscript and conducted the test analysis; and JX and DW wrote the manuscript. YZ and JZ collected data and participated in the analysis. All authors gave final approval for publication.
This work was supported by the National Key Research and Development Program of China (Grant No. 2018YFC1505501) and the Fundamental Research Funds for the Central Universities (Grant No. 2021CDJKYJH036).
The authors declare that the research was conducted in the absence of any commercial or financial relationships that could be construed as a potential conflict of interest.
All claims expressed in this article are solely those of the authors and do not necessarily represent those of their affiliated organizations or those of the publisher, the editors, and the reviewers. Any product that may be evaluated in this article, or claim that may be made by its manufacturer, is not guaranteed or endorsed by the publisher.
The authors would like to express their gratitude to the Chongqing Meteorological Administration, Chongqing Institute of Geology, and Mineral Resources for offering valuable research data.
Abedi Gheshlaghi, H., and Feizizadeh, B. (2021). GIS-Based Ensemble Modelling of Fuzzy System and Bivariate Statistics as a Tool to Improve the Accuracy of Landslide Susceptibility Mapping. Nat. Hazards 107, 1981–2014.
Althuwaynee, O. F., Pradhan, B., Park, H.-J., and Lee, J. H. (2014). A novel ensemble bivariate statistical evidential belief function with knowledge-based analytical hierarchy process and multivariate statistical logistic regression for landslide susceptibility mapping. Catena 114, 21–36. doi:10.1016/j.catena.2013.10.011
Ayalew, L., and Yamagishi, H. (2005). The application of GIS-based logistic regression for landslide susceptibility mapping in the Kakuda-Yahiko Mountains, Central Japan. Geomorphology 65, 15–31. doi:10.1016/j.geomorph.2004.06.010
Bourenane, H., Bouhadad, Y., Guettouche, M. S., and Braham, M. (2015). GIS-based landslide susceptibility zonation using bivariate statistical and expert approaches in the city of Constantine (Northeast Algeria). Bull. Eng. Geol. Environ. 74, 337–355. doi:10.1007/s10064-014-0616-6
Chi, Y., Qian, T., Sheng, C., Xi, C., and Wang, J. (2021). Analysis of Differences in the Spatial Distribution among Terrestrial Mammals Using Geodetector-A Case Study of China. Ijgi 10, 21. doi:10.3390/ijgi10010021
Fan, X., Tang, J., Tian, S., and Jiang, Y. (2020). Rainfall-induced rapid and long-runout catastrophic landslide on July 23, 2019 in Shuicheng, Guizhou, China. Landslides 17, 2161–2171. doi:10.1007/s10346-020-01454-y
Feby, B., Achu, A. L., Jimnisha, K., Ayisha, V. A., and Reghunath, R. (2020). Landslide susceptibility modelling using integrated evidential belief function based logistic regression method: A study from Southern Western Ghats, India. Remote Sensing Appl. Soc. Environ., 20.
Feizizadeh, B., Shadman Roodposhti, M., Jankowski, P., and Blaschke, T. (2014). A GIS-Based Extended Fuzzy Multi-Criteria Evaluation for Landslide Susceptibility Mapping. Comput. Geosci. 73, 208–221.
Gautam, P., Kubota, T., Sapkota, L., and Shinohara, Y. (2021). Landslide susceptibility mapping with GIS in high mountain area of Nepal: a comparison of four methods. Environ. Earth Sci. 80, 359–377. doi:10.1007/s12665-021-09650-2
Hong, H., Naghibi, S. A., Pourghasemi, H. R., and Pradhan, B. (2016). GIS-based landslide spatial modeling in Ganzhou city, China. Arab J. Geosci. 9 (2), 1–26. doi:10.1007/s12517-015-2094-y
Huang, F., Cao, Z., Jiang, S.-H., Zhou, C., Huang, J., and Guo, Z. (2020). Landslide susceptibility prediction based on a semi-supervised multiple-layer perceptron model. Landslides 17, 2919–2930. doi:10.1007/s10346-020-01473-9
Huangfu, W., Wu, W., Zhou, X., Lin, Z., Zhang, G., Chen, R., et al. (2021). Landslide Geo-Hazard Risk Mapping Using Logistic Regression Modeling in Guixi, Jiangxi, China. Sustainability 13, 4830. doi:10.3390/su13094830
Kalantar, B., Pradhan, B., Naghibi, S. A., Motevalli, A., and Mansor, S. (2018). Assessment of the effects of training data selection on the landslide susceptibility mapping: a comparison between support vector machine (SVM), logistic regression (LR) and artificial neural networks (ANN). Geomatics, Nat. Hazards Risk 9 (1), 49–69. doi:10.1080/19475705.2017.1407368
Li, D., Huang, F., Yan, L., and Cao, Z. (2019). Landslide Susceptibility Prediction Using Particle-Swarm-Optimized Multilayer Perceptron: Comparisons with Multilayer-Perceptron-Only, BP Neural Network, and Information Value Models. Appl. Sci. 9, 3664. doi:10.3390/app9183664
Luo, W., and Liu, C.-C. (2018). Innovative landslide susceptibility mapping supported by geomorphon and geographical detector methods. Landslides 15, 465–474. doi:10.1007/s10346-017-0893-9
Ma, S., and Xu, C. (2019). Applicability of Two Newmark Models in the Assessment of Coseismic Landslide Hazard and Estimation of Slope-Failure Probability: An Example of the 2008 Wenchuan Mw 7.9 Earthquake Affected Area. J. Earth Sci. 30, 1020–1030. doi:10.1007/s12583-019-0874-0
Moore, I. D., and Wilson, J. P. (1992). Length-slope factors for the revised universal soil loss equation: simplified method of estimation. J. Soil Water Conserv 47 (5), 423–428.
Morales, B., Lizama, E., Somos-Valenzuela, M., and Lillio, M. F. (2021). A comparative machine learning approach to identify landslide triggering factors in northern Chilean Patagonia. Landslides 18, 2767–2784. doi:10.1007/s10346-021-01675-9
Naemitabar, M., and Zanganeh Asadi, M. (2021). Landslide zonation and assessment of Farizi watershed in northeastern Iran using data mining techniques. Nat. Hazards 108, 2423–2453. doi:10.1007/s11069-021-04805-7
Naghibi, S. A., and Dashtpagerdi, M. M. (2017). Evaluation of Four Supervised Learning Methods for Groundwater Spring Potential Mapping in Khalkhal Region (Iran) Using GIS-Based Features. Hydrogeol. J. 25 (1), 169–189.
Pourghasemi, H. R., Mohammady, M., and Pradhan, B. (2012). Landslide susceptibility mapping using index of entropy and conditional probability models in GIS: Safarood Basin, Iran. Catena 97, 71–84. doi:10.1016/j.catena.2012.05.005
Reichenbach, P., Rossi, M., Malamud, B. D., Mihir, M., and Guzzetti, F. (2018). A review of statistically-based landslide susceptibility models. Earth-Science Rev. 180, 60–91. doi:10.1016/j.earscirev.2018.03.001
Shan, Y., Chen, S., and Zhong, Q. (2020). Rapid prediction of landslide dam stability using the logistic regression method. Landslides 17, 2931–2956. doi:10.1007/s10346-020-01414-6
Sivakumar, R., and Ghosh, S. (2021). Assessment of the influence of physical and seismotectonic parameters on landslide occurrence: an integrated geoinformatic approach. Nat. Hazards 108, 2765–2811. doi:10.1007/s11069-021-04800-y
Soma, A. S., Kubota, T., and Aditian, A. (2019). Comparative Study of Land Use Change and Landslide Susceptibility Using Frequency Ratio, Certainty Factor, and Logistic Regression in Upper Area of Ujung-Loe Watersheds South Sulawesi Indonesia. Ijece 11, 103–115. doi:10.13101/ijece.11.103
Sun, D., Shi, S., Wen, H., Xu, J., Zhou, X., and Wu, J. (2021c). A hybrid optimization method of factor screening predicated on GeoDetector and Random Forest for Landslide Susceptibility Mapping. Geomorphology 379, 107623. doi:10.1016/j.geomorph.2021.107623
Sun, D., Wen, H., Zhang, Y., and Xue, M. (2021b). An optimal sample selection-based logistic regression model of slope physical resistance against rainfall-induced landslide. Nat. Hazards 105 (2), 1255–1279. doi:10.1007/s11069-020-04353-6
Sun, D., Xu, J., Wen, H., and Wang, D. (2021a). Assessment of landslide susceptibility mapping based on Bayesian hyperparameter optimization: A comparison between logistic regression and random forest. Eng. Geology. 281 (2021), 105972. doi:10.1016/j.enggeo.2020.105972
Tang, R.-X., Yan, E.-C., Wen, T., Yin, X.-M., and Tang, W. (2021). Comparison of Logistic Regression, Information Value, and Comprehensive Evaluating Model for Landslide Susceptibility Mapping. Sustainability 13, 3803. doi:10.3390/su13073803
Tsangaratos, P., Ilia, I., Hong, H., Chen, W., and Xu, C. (2017). Applying information theory and GIS-based quantitative methods to produce landslide susceptibility maps in Nancheng County, China. Landslides 14, 1091–1111. doi:10.1007/s10346-016-0769-4
Van Tien, P., Luong, L. H., Duc, D. M., Trinh, P. T., Quynh, D. T., Lan, N. C., et al. (2021). Rainfall-induced catastrophic landslide in Quang Tri Province: the deadliest single landslide event in Vietnam in 2020. Landslides 18, 2323–2327. doi:10.1007/s10346-021-01664-y
Van Tien, P., Trinh, P. T., Luong, L. H., Nhat, L. M., Duc, D. M., Hieu, T. T., et al. (2021a). The October 13, 2020, deadly rapid landslide triggered by heavy rainfall in Phong Dien, Thua Thien Hue, Vietnam. Landslides 18, 2329–2333. doi:10.1007/s10346-021-01663-z
Wang, D., Hao, M., Chen, S., Meng, Z., Jiang, D., and Ding, F. (2021). Assessment of landslide susceptibility and risk factors in China. Nat. Hazards 108, 3045–3059. doi:10.1007/s11069-021-04812-8
Wang, J. F., Li, X. H., Christakos, G., Liao, Y. L., Zhang, T., Gu, X., et al. (2010). Geographical Detectors‐Based Health Risk Assessment and its Application in the Neural Tube Defects Study of the Heshun Region, China. Int. J. Geographical Inf. Sci. 24 (1), 107–127. doi:10.1080/13658810802443457
Wubalem, A. (2021). Landslide susceptibility mapping using statistical methods in Uatzau catchment area, northwestern Ethiopia. Geoenvironmental Disasters 8. doi:10.1186/s40677-020-00170-y
Xie, P., Wen, H., Ma, C., Baise, L. G., and Zhang, J. (2018). Application and comparison of Logistic regression model and Neural network model in earthquake-induced landslides susceptibility mapping at mountainous region, China. Geomatics, Nat. Hazards Risk 9 (1), 501–523. doi:10.1080/19475705.2018.1451399
Xie, W., Li, X., Jian, W., Yang, Y., Liu, H., Robledo, L. F., et al. (2021). A Novel Hybrid Method for Landslide Susceptibility Mapping-Based GeoDetector and Machine Learning Cluster: A Case of Xiaojin County, China. Ijgi 10, 93. doi:10.3390/ijgi10020093
Yang, H., Yang, T., Zhang, S., Zhao, F., Hu, K., and Jiang, Y. (2020). Rainfall-induced landslides and debris flows in Mengdong Town, Yunnan Province, China. Landslides 17, 931–941. doi:10.1007/s10346-019-01336-y
Yilmaz, I. (2009). A case study from Koyulhisar (Sivas-Turkey) for landslide susceptibility mapping by artificial neural networks. Bull. Eng. Geol. Environ. 68 (3), 297–306. doi:10.1007/s10064-009-0185-2
Zhao, Z., Liu, Z. Y., and Xu, C. (2021). Slope Unit-Based Landslide Susceptibility Mapping Using Certainty Factor, Support Vector Machine, Random Forest, CF-SVM and CF-RF Models. Front. Earth Sci. 9. doi:10.3389/feart.2021.589630
Keywords: landslide susceptibility, GeoDetector, dominant-factor screening, logistic regression, 10-fold cross validation
Citation: Sun D, Wen H, Xu J, Zhang Y, Wang D and Zhang J (2021) Improving Geospatial Agreement by Hybrid Optimization in Logistic Regression-Based Landslide Susceptibility Modelling. Front. Earth Sci. 9:713803. doi: 10.3389/feart.2021.713803
Received: 24 May 2021; Accepted: 28 July 2021;
Published: 25 August 2021.
Edited by:
Faming Huang, Nanchang University, ChinaCopyright © 2021 Sun, Wen, Xu, Zhang, Wang and Zhang. This is an open-access article distributed under the terms of the Creative Commons Attribution License (CC BY). The use, distribution or reproduction in other forums is permitted, provided the original author(s) and the copyright owner(s) are credited and that the original publication in this journal is cited, in accordance with accepted academic practice. No use, distribution or reproduction is permitted which does not comply with these terms.
*Correspondence: Haijia Wen, amh3QGNxdS5lZHUuY24=
Disclaimer: All claims expressed in this article are solely those of the authors and do not necessarily represent those of their affiliated organizations, or those of the publisher, the editors and the reviewers. Any product that may be evaluated in this article or claim that may be made by its manufacturer is not guaranteed or endorsed by the publisher.
Research integrity at Frontiers
Learn more about the work of our research integrity team to safeguard the quality of each article we publish.