
94% of researchers rate our articles as excellent or good
Learn more about the work of our research integrity team to safeguard the quality of each article we publish.
Find out more
ORIGINAL RESEARCH article
Front. Earth Sci. , 11 November 2021
Sec. Cryospheric Sciences
Volume 9 - 2021 | https://doi.org/10.3389/feart.2021.713498
 Avirmed Dashtseren1*
 Khurelbaatar Temuujin1Sebastian Westermann2Altangerel Batbold3Yondon Amarbayasgalan1Dorjgotov Battogtokh1
Mongolia is one of the most sensitive regions to climate change, located in the transition of several natural and permafrost zones. Long-term trends in air freezing and thawing indices can therefore enhance our understanding of climate change. This study focuses on changes of the spatiotemporal patterns in air freezing and thawing indices over Mongolia from 1960 to 2020, using observations at 30 meteorological stations. Our results shows that the freezing index ranges from −945.5 to −4,793.6°C day, while the thawing index ranges from 1,164.4 to 4,021.3°C day over Mongolia, and their spatial patterns clearly link to the latitude and altitude. During the study period, the trend in the thawing index (14.4°C-day per year) was larger than the trend in the freezing index (up to −10.1°C-day per year), which results in the net increase of air temperature by 2.4°C across Mongolia. Overall, the increase in the thawing index was larger in the low latitudes and altitudes (e.g., the Gobi-desert, steppes, the Great lake depression and major river valleys) than in high latitudes and altitudes (mountain regions), while it was the opposite for the freezing index. The highest values for both thawing index and freezing index (i.e. the least negative values) have occurred during the last 2 decades. As the trends in the freezing and thawing indices and mean annual air temperature confirm intensive climate warming, increased permafrost degradation and shallower seasonally frozen ground are expected throughout Mongolia.
Permafrost is an important component in mid and high-latitude regions, as well as high altitude environments. It is defined as ground (soil or rock and included ice and organic material) that remains at or below 0°C for at least two consecutive year (Van Everdingen, 1998; French, 2007). The permafrost area accounts for approximately 15% of the exposed land surface in the northern Hemisphere (Obu et al., 2019). In total, the northern circumpolar region contains approximately 1,300 gigatonnes (Gt) of carbon, nearly twice as much carbon than in the atmosphere (Hugelius et al., 2014). Permafrost degradation can alter ecosystems, possibly leading to the release of CO2 and CH4 which could amplify climate warming in a positive feedback (e.g. Schaefer et al., 2014). Therefore, there is an urgent need to better understand the future development of permafrost and frozen ground. Freezing and thawing indices are useful variables for mapping and predicting permafrost and seasonally frozen ground distribution (Nelson and Outcalt, 1987; Guo and Wang, 2017; Shi et al., 2019), evaluating active layer thickness (Nelson et al., 1998; Zhang et al., 2005), as well as indicators for climate warming (Luo et al., 2014). Several previous studies analyzed changes in freezing and thawing indices in the northern hemisphere. Their results showed decreases in the freezing index and increases in the thawing index in high latitude and high-altitude regions (Frauenfeld et al., 2007; Luo et al., 2014; Peng et al., 2019; Shi et al., 2019).
Mongolia is located in one of the fastest warming regions in the world (IPCC, 2013), with air temperatures increased by 2.4°C during the last 60 years, approximately three times higher than the global mean (IPCC, 2013; MARCC, 2014). The ecozone changes from the Siberian boreal forest region in northern Mongolia to steppes in central and the Gobi-desert in southern Mongolia. These transitions roughly correspond to a change from discontinuous to sporadic permafrost, and finally to seasonally frozen ground areas (Dashtseren et al., 2014). Furthermore, Mongolia has distinct topography conditions with a large spatial variation in altitude. The transitions in eco- and permafrost zones are highly sensitive to climate change and land use (Dulamsuren et al., 2011; Sun et al., 2015; Ishikawa et al., 2018; Klinge et al., 2020; Dashtseren, 2021) which makes Mongolia well-suited as model region for environmental research applications.
Natural resources, e.g. vegetation, surface water, and groundwater, are a main factor for livestock in Mongolia. Approximately 20 percent of Mongolian families sustain themselves as herders, with over seventy million livestock in total (NSOM, 2020). The density of herders and population is generally higher in permafrost regions than in regions without permafrost, probably due to a higher ecosystem productivity. In Mongolia, permafrost directly sustains the inhabitants and herders because it produces locally wet soil conditions, and river discharge originates entirely from the high mountains and northern territory where permafrost and forest occur extensively (Dashtseren et al., 2014; Ishikawa et al., 2018). Therefore, understanding the impact of climate change on permafrost and the different ecozones is essential to establish sustainable land use management. In some regions of Mongolia, climate change and its effects on permafrost have clearly been documented (Sharkhuu et al., 2007; Sharkhuu et al., 2008; Zhao et al., 2010; Ishikawa et al., 2012; Jambaljav, 2017; Dashtseren, 2021).
Wu et al. (2011) described surface freezing and thawing indices at 20 meteorological stations in Mongolia from 1987 to 2006, but a full picture of long-term spatiotemporal changes of air freezing and thawing indices over Mongolia is still lacking. One the other hand, an impression of spatial temperature patterns due topography and heterogeneity cannot be obtained from sparsely distributed observational data (Gerelchuluun and Ahn, 2014). This study describes variations and trends in air freezing and thawing indices over the Mongolian territory using observed air temperature from 30 stations since 1960, in conjunction with the CRU TS 4.03 gridded air temperature data.
The present study covers all of Mongolia, which is a landlocked country on the Asian continent with an area of 1.565 million square kilometres and an average altitude of 1,580 m a.s.l. (Tsegmid, 1969). The north, northwest, and center of Mongolia feature high mountain regions such as the Altai, Khangai, Khuvsgul, and Khentii, while the east and central parts comprise vast steppe region and the southern part is dominated by the Gobi-desert (Figure 1). Forests exist on almost all slopes in the Khuvsgul Mountains, but are usually restricted to north-facing slopes in the Khangai and Khentii. Permafrost exists in about two-thirds of the country, with continuous permafrost in the northern parts and high-altitude regions, surrounded by zones of discontinuous, sporadic, and isolated permafrost (Jambaljav, 2017; Ishikawa et al., 2018). In other areas of the country, seasonally frozen ground develops. The climate of Mongolia is characterized by long, cold winters and dry, hot summers leading to strong annual temperature fluctuations with sharply defined seasons (MARCC, 2014; Nandintsetseg et al., 2007). The mean annual air temperature (MAAT) ranges from −1.0°C to −6.5°C in the high altitudes of the Altai, Khangai, Khuvsgul, and Khentii mountains (generally featuring permafrost) and from −1.0 to 8.0°C in the Great Lake depression, the steppe region and the Gobi-desert with seasonal frozen ground regions (MARCC, 2014; Ishikawa et al., 2018). The annual precipitation varies between 50 and 100 mm in the Gobi-desert, 100–250 mm in the steppe regions, and 300–400 mm in the Altai, Khangai, Khentii, and Khuvsgul mountainous (Nandintsetseg et al., 2007; Ishikawa et al., 2018).
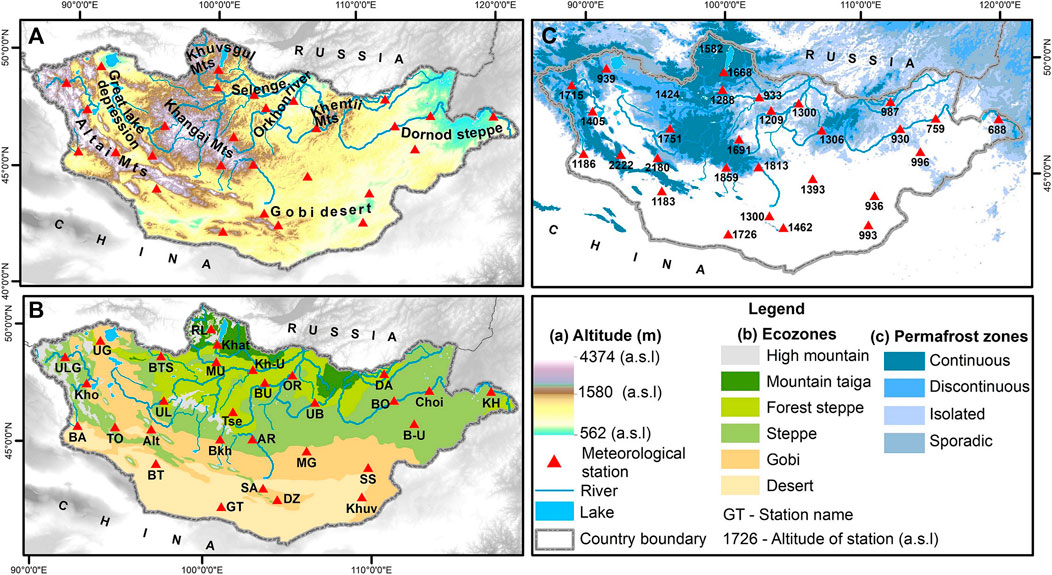
FIGURE 1. (A) Digital elevation map depicted from the Shuttle Radar Topography Mission (SRTM-DEM) with a 30 m resolution. (B) Ecozones of Mongolia based on Doljin and Yembuu (2021), (C) Permafrost distribution around Mongolia based on Obu et al. (2019).
At present, 135 meteorological stations across Mongolia conduct regular observations of general meteorological conditions eight times daily in accordance with the World Meteorological Organization standards (MARCC, 2014). These stations belong to the Information and Research Institute of Meteorology, Hydrology and Environment of Mongolia (IRIMHEM), which conducts monitoring and provides climate services for Mongolia. From these stations, we selected 30 meteorological stations with long-term climate data sets, which are distributed throughout all typical eco- and permafrost zones in Mongolia, with elevations ranging from 688 m a.s.l. at the KH station to 2,222 m a.s.l. at the TO station (Figure 1). These two stations are also located in the warmest and coldest regions of Mongolia, respectively.
There are two types of freezing and thawing indices, one using air and the other using ground surface temperature, respectively. In both cases, the number of degree-days below and above 0°C is accumulated (Van Everdingen, 1998; Frauenfeld et al., 2007; Wu et al., 2011). In the present study, we investigate air temperature freezing and thawing indices, which can be estimated from both daily and monthly temperatures (Frauenfeld et al., 2007; Wu et al., 2011). The thawing index is calculated as the sum of degree days above 0°C from the beginning to the end of the year, and the freezing index as the sum of degree days below 0°C from the first of July of the current year to the end of June of the following year.
Daily average air temperatures were obtained from the IRIMHEM, which are measured at the standard height of 2 m at 30 meteorological stations (Figure 1). We chose the entire period between January 1, 1960 and December 31, 2020 for the study, but not all stations have a continuous record for the study period, with the shortest measurement time being 40 years at Choi station (Тable 1). In addition, we use air temperatures from the CRU TS 4.03 climate data set (https://crudata.uea.ac.uk/cru/data/hrg/cru_ts_4.03/observation.v4.03/) to illustrate the spatial variations of freezing and thawing indices over Mongolia. The data set has a resolution 0.5o × 0.5o and extends from 1901 to 2019 for monthly averages. CRU TS 4.03 is often used for regional and global trend analysis (Harris et al., 2020). We selected the period from 1960 to 2019 for the CRU data, which is almost the same period as the observation data, allowing us to compare both data sets. Several studies have calculated freezing and thawing indices based on monthly average temperate, using the following equations (Frauenfeld et al., 2007; Wu et al., 2011; Peng et al., 2019; Shi et al., 2019)
where
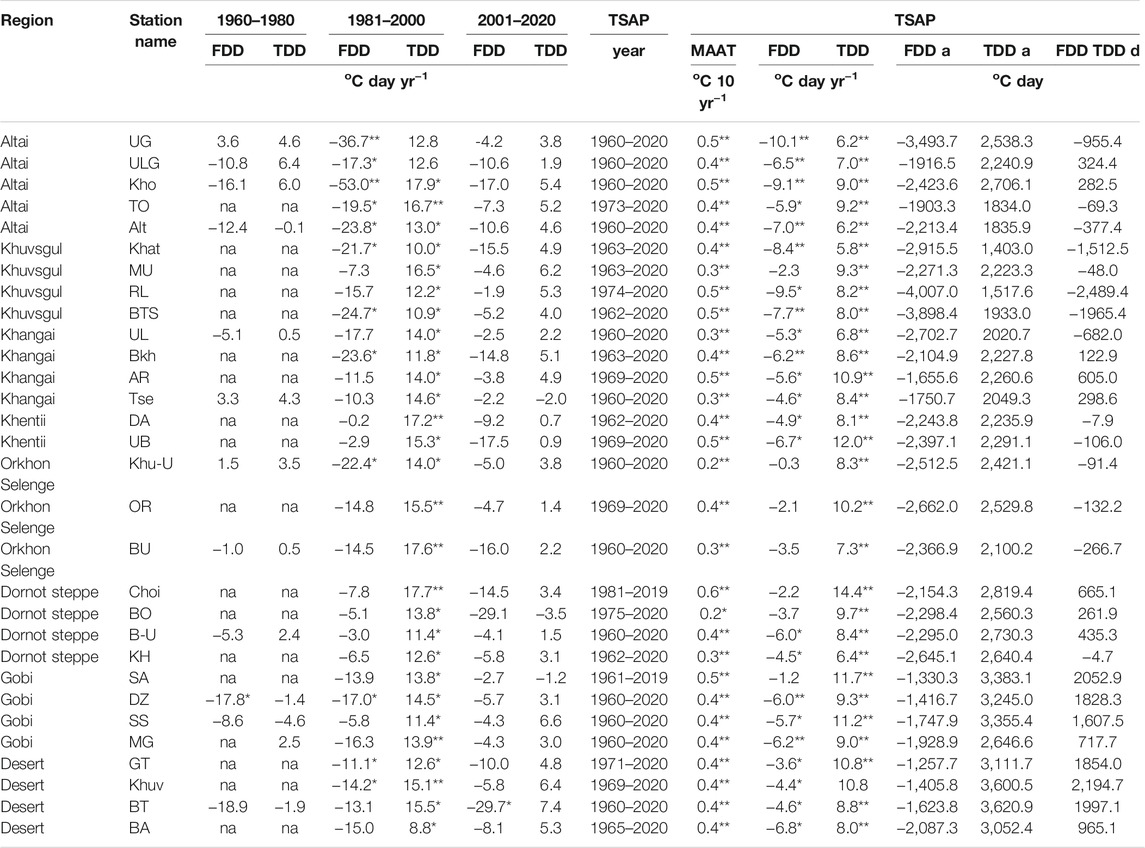
TABLE 1. Trends in freezing and thawing indices at the 30 meteorological stations during the different periods. TSAP: time series available period; na: non-available data. FDD a and TDD a are the average of freezing degree day and thawing degree day during the TSAP, MAAT is mean annual air temperature, while DFF TDD d is the difference between freezing degree day and thawing degree day. The symbols */** indicate in that p < 0.05 is referred as statistically significant and p < 0.001 as statistically highly significant, respectively.
The CRU data were validated with the observed data at meteorological stations using the Pearson correlation coefficient statistical method. The pearson correlation coefficient is calculated as follows:
where
Figure 2 shows the temporal variability of MAAT with its range and trend from 1960 to 2020 at the stations. During the study period, MAAT over observation stations ranged from 7.8°C at BH station to −9.2°C at RL station. The lowest MAATs were mainly found in northern, western Mongolia, and high-altitude regions. In contrast, the highest MAATs appeared in southern and eastern Mongolia, where the steppe region and the Gobi-desert ecozones are located. In general, the MAAT decreases with increasing latitude and elevation. The significant decreases in MAATs were accounted at all stations with different trends, which range from 0.2°C decade−1 to 0.6°C decade−1. Values above 0.4°C decade−1 account for 76 percent of total trends and above 0.5°C decade−1 for 26 percent of total trends (Table 1). As shown in Figure 2, the long-term average trend of MAATs from all stations can be split in three distinct stages. From 1960 to 1980, MAAT increased by approximately 0.1°C decade−1, while a more significant increase in MAAT occurred during the second stage (1981–2000) with about 0.8°C decade−1. The third stage had the trend of 0.4°C decade−1 from 2001 to 2020, which is almost the same as the long-term trend from 1960 to 2020. In addition, the result implies that the air temperature across the stations warmed by 2.4°C from 1960 to 2020, which was also found in a previous study (MARCC, 2014).
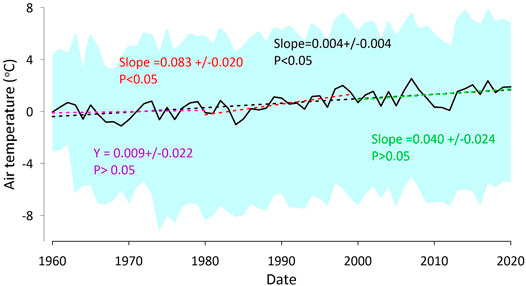
FIGURE 2. MAAT with the trend from 1960 to 2020 based on 30 stations across Mongolia. The plot includes the range of MAAT (cyan, shaded), the linear trend from 1960 to 1980 (purple dash line), the linear trend from 1981 to 2000 (red dash line), the linear trend from 2001 to 2020 (green dash line), and the linear trend from 1960 to 2020 (black dash line). The statistic information is related to the same-coloured time.
To assess the spatiotemporal variations in freezing and thawing indices, we divided the Mongolian territory in eight sub-regions. According to Figures 3, 4, freezing and thawing indices at 30 meteorological stations across Mongolia show significant changes in their spatial patterns and temporal trends. During the study period, the freezing index ranged from −945.5°C day at GT in the desert zone to −4,793.6°C day at RL in the Khuvsgul mountains, with a mean of −2,253.8°C day from the 30 stations. In general, there was an evident reduction in the freezing index from 1960 to 2020, despite the strong interannual variability (Figure 3 and Table 1). The results show that the decrease of the freezing index (i.e. to less positive values) at the all stations were higher during 1981–2000 than during 2001–2020 and 1960–1980, respectively. The long-term trend of the freezing index was more than −5.9°C day yr−1 in the Altai mountains, −2.3°C day yr−1 in the Khuvsgul mountains, −4.6°C day yr−1 in the Khangai mountains, −0.3°C day yr−1 in the Orkhon and Selenge rivers, −4.9°C day yr−1 in the Khentii mountains, −1.2°C day yr−1 in the Dornod steppe and Gobi zone, and more than −3.6°C day yr−1 in the Desert zone, respectively. In most cases, the trends in the freezing index increased with altitude in the Khuvgul, Khangai, and Khentii mountains.
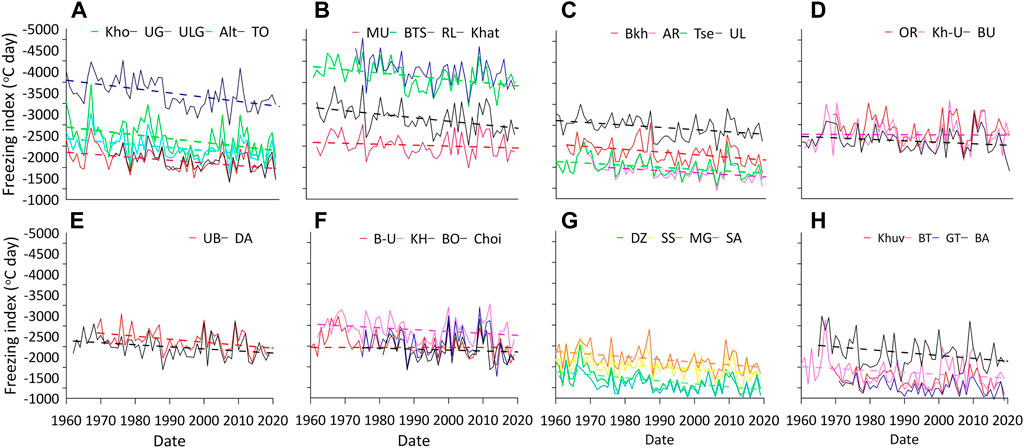
FIGURE 3. Freezing index for 30 meteorological stations: (A) Altai mountains, (B) Khuvsgul Mountains, (C) Khangai mountains, (D) Orkhon and Selenge river valleys, (E) Khentii mountains, (F) Dornod steppe, (G) Gobi zone, and (H) Desert zone, respectively. The dashed lines show the linear trends, with colors matching the time series.
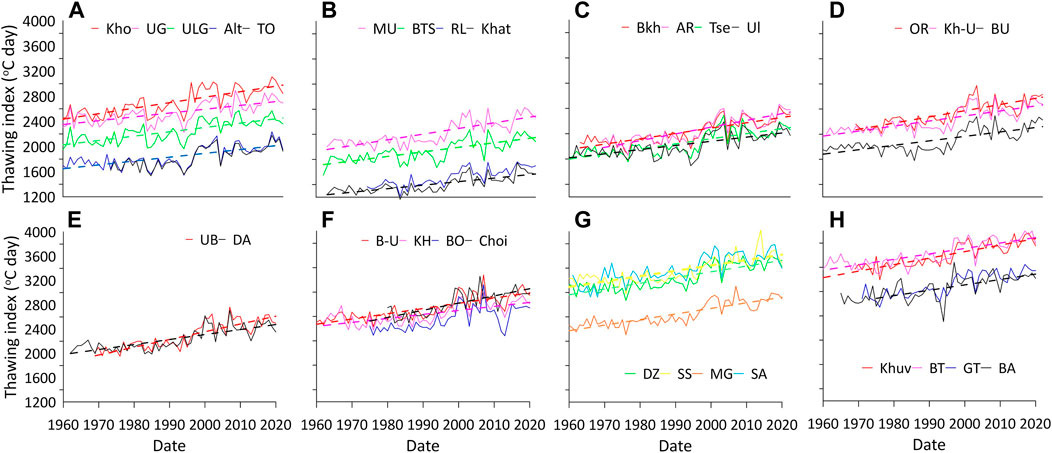
FIGURE 4. Thawing index for 30 meteorological stations: (A) Altai mountains, (B) Khuvsgul Mountains, (C) Khangai mountains, (D) Orkhon and Selenge river valleys, (E) Khentii mountains, (F) Dornod steppe, (G) Gobi zone, and (H) Desert zone, respectively. The dashed lines show the linear trends, with colors matching the time series.
However, the increase in freezing index is not clearly related to the altitude in the Altai mountains as well as Gobi-desert and steppe zones (Table 1). Especially within mountain areas, trends in the freezing index can be variable due to the considerable extent and variations in altitude. For example, the Altai mountains span several latitudes and comprise a range of ecozones (Figure 1), which can produce locally different climate conditions which likely lead different temporal patterns. The same is true for the Gobi-desert and steppe zones. On the other hand, the Khuvsgul, Khentii and Khangai mountains span a smaller latitudinal range and consist of fewer ecozones (Figure 1).
During the study period, thawing indices from the 30 station showed variations from 1,164.4°C day at Khat in the Khuvsgul mountains to 4,021.3°C day at Khuv in Desert zone, with an average of 2,507.7°C day. Similar to the freezing index, the increase in thawing index was strongest between 1981 and 2000 at all stations (>8.8°C day yr−1), while it was smaller in both 2001–2020 and 1960–1980 (Figure 4; Table 1).
For a few stations, thawing indices even decreased during the periods 2001–2020 and 1960–1980, e.g. −4.6°C day yr−1 at SS from 1960 to 1980 and −2.0°C day yr−1 at Tse from 2001 to 2020. However, the long-term trend is clearly positive, exceeding 6.2°C day yr−1 in the Altai mountains, 5.8°C day yr−1 in the Khuvsgul mountains, 6.8°C day yr−1 in the Khangai mountains, 7.3°C day yr−1 in the Orkhon and Selenge rivers, 8.1°C day yr−1 in the Khentii mountains, 6.4°C day yr−1 in the Dornod steppe, 9.3°C day yr−1 in the Gobi zone and 8.0°C day yr−1 in the desert zone, respectively (Table 1). Our results indicate that the increase in the thawing index is generally smaller for subregions located at lower altitudes. However, there is no clear correlation between the trends in the thawing index and altitudes in the subregions, which could be due to the high spatial variability of local climate conditions not sufficiently represented by the available stations.
Freezing and thawing indices are key indicator to characterize spatiotemporal patterns of climate conditions. As shown in Table 1, latitude and altitude naturally explain a large part of the differences between freezing and thawing indices. The absolute values of the freezing index exceed the thawing index in the northern and mountainous parts of Mongolia (coincident with occurrence of permafrost), while the opposite is true in the southern or steppes parts of Mongolia, where mainly seasonally frozen ground occurs. The sums of freezing and thawing indices range from -2,489.4°C day at RL in the Khuvsgul mountains to 2,197.4°C day at GT in the desert zone. In the central parts of Mongolia and low altitudes in northern parts, freezing and thawing indices largely balance each other.
To assess the performance of the CRU data in reproducing freezing and thawing indices in Mongolia, we compared them to observations from six stations (Alt, BKh, UL, MG, AR, and B-U), which are located close to the center of a CRU grid cell (1.6–12.6 km, Table 2). The comparison period is the same as shown the observation period in Table 1. The results show statistical relationship (p values < 0.0001), with the correlation coefficient between 0.79 and 0.88 for the freezing index, and between 0.76 and 0.91 for the thawing index, although MAE and RMSE have relatively large values (Figures 5A,B). This indicates that the CRU data can describe the spatiotemporal variations over Mongolia reasonably well. However, at the high latitudes and altitudes, the CRU data show slightly lower thawing and freezing indices than the observations, while it was the opposite for the low latitudes and altitudes. Since only 13 stations have complete data covering the study period, they were used to test the trend of the CRU data. Figure 5C compares the trends of indices from the CRU data and observations at 13 stations. It shows that there is acceptability good agreement, with the Pearson correlation coefficients 0.77 for the thawing index and 0.73 for the freezing index. Therefore, the CRU data can be used to quantify the spatial patterns of both the absolute values and the trends of freezing and thawing indices over Mongolia (using kriging interpolation, Figure 6).
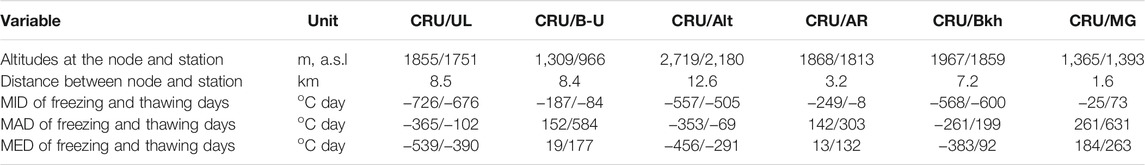
TABLE 2. Difference in selected variables between the node (i.e. grid center) and meteorological stations at the six comparison sites. Note: MID = minimum difference; MAD = maximum difference; MED = mean difference. The slash represents the CRU data in front and the station in behind.
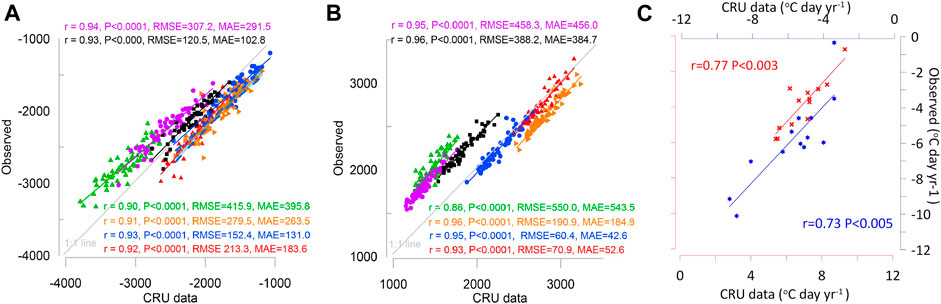
FIGURE 5. Comparison between CRU data and observed data at the six sites (A) for freezing index and (B) thawing index. Note: The pink, black, green, orange, blue, and red colours in (A,B) represent the Alt, BKh, UL, MG, AR, and B-U regions, respectively. For comparison, the closest meteorological station to the center of the CRU grid cell has been selected. The comparison period is the same as shown the observation period in Table 1. (C) Linear regression between trends of freezing index (blue colour) and thawing index (red colour) from observation and CRU data. For the comparison, trends were calculated between 1960 and 2019 at 13 stations which have full observations from 1960 to 2020 as shown in Table 1, with CRU grid cells selected as in (A,B).
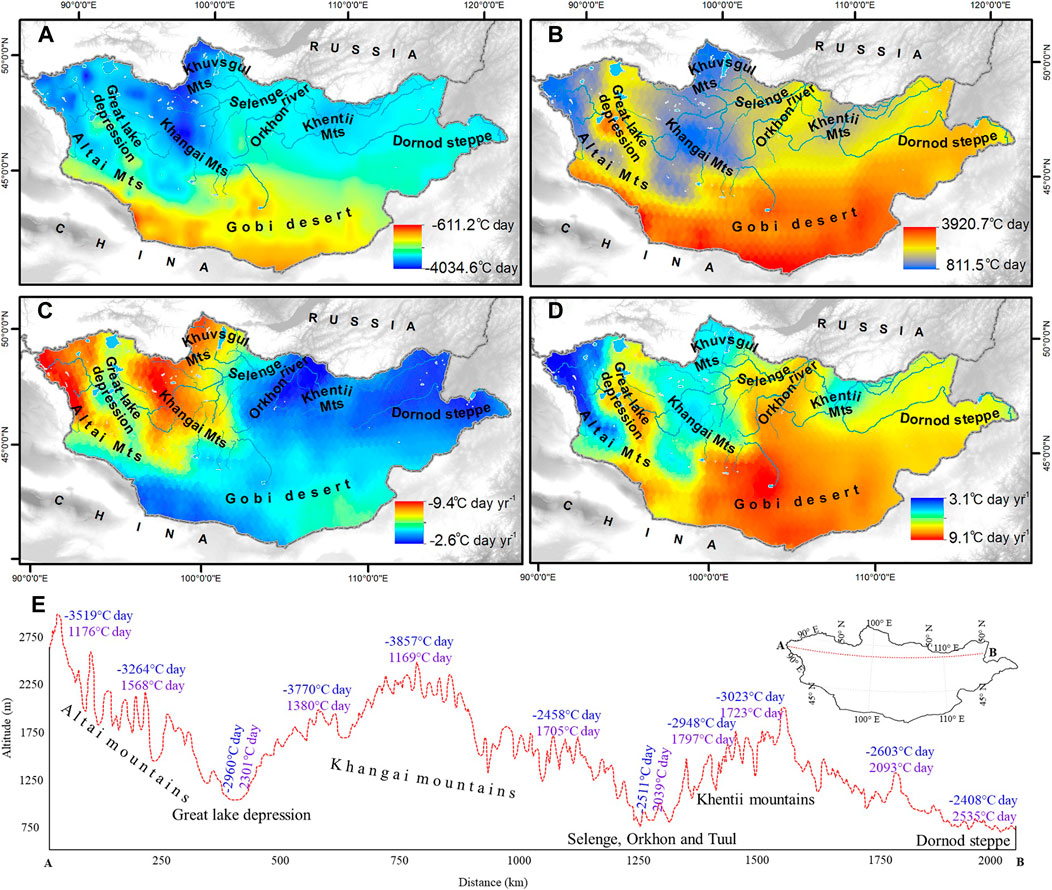
FIGURE 6. Spatial distribution of the long-term (1960–2018) freezing index (A), thawing index (B), freezing index trend (C), and thawing index trend (D). (E) East-West transect through Mongolia with freezing index (blue) and thawing index (red). Elevations in m a.s.l.
As shown in Figures 6A,B,E, the averages of the freezing and thawing indices over Mongolia from 1960 to 2019 show strong variations with both latitude and altitude. The long-term average freezing index varied from −611.2 to −4,034.6°C day in Mongolia, with lower negative values towards to the south. The four most negative freezing indices were found at high altitudes in the Altai, Khuvsgul, Khangai, and Khentii mountain regions, where the freezing index was lower than −3000°C day (Figure 6A) concurrent with continuous permafrost (Obu et al., 2019). In the Dornod steppe, the freezing index usually ranged from −1800 to −2400°C day, and similar values are also found at low altitudes near the confluence of the Selenge, Orkhon, and Tuul rivers, despite being located in the northern part of Mongolia. This shows the important role of altitude in addition to latitude. Smaller absolute values of the freezing index occur in the Gobi-desert, not exceeding −2000°C day, where only seasonal frozen ground occurs (Figure 6A).
The thawing index over Mongolia ranges from 811.5 to 3,920.7°C day, and the spatial pattern is strongly correlated with the freezing index (Figure 6B). The highest thawing indices are found in the Gobi-desert with values exceeding 3000°C day, while the lowest values are found at high altitudes in the Altai, Khuvsgul, Khangai, and Khentii mountain regions. In the steppes and the Great lake depression, the thawing index varies from 2100 to 3000°C day. Around at the confluence of the Selenge, Orkhon, and Tuul rivers, the thawing indices range from 1800 to 2000°C day (Figure 6B).
From 1960 to 2019, the declining trend of freezing indices ranged from −2.6 to −9.4°C day yr−1 over Mongolia (Figures 6C,D). The west and north parts of Mongolia with high altitudes featured the largest decrease in freezing index (>7.0°C day yr−1), whereas the lowest trends (<4.0°C day yr−1) are found around the confluence of the Orkhon, Selenge and Tuul rivers, in the northern parts of the Dornod steppe and some regions of Desert zone, as well as in the Khentii mountains where the trend of freezing index approximately varied from −3.5 to −4.0°C day yr−1. (Figure 6C). Thawing indices increased by 3.1–9.1°C day yr−1 from 1960 to 2019 (Figure 6D). With >7.0°C day yr−1, the largest increases occurred in the Gobi-desert, steppes, Great lake depression, and around the confluence of the Selenge, Orkhon, and Tuul rivers. The lowest trends (<4.0°C day yr−1) are found in the Altai mountains, while the trends are higher in the other mountain ranges (Khangai, Khuvsgul and Khentii). Overall, the thawing index trends of the CRU data have similar spatial patterns as the observations.
Climate change has changed land surface temperature regimes in many regions of the world (IPCC, 2013), causing unequalled shifts in freezing and thawing degree days from local to regional scales (Frauenfeld et al., 2007; Wu et al., 2011; Luo et al., 2014; Peng et al., 2019; Shi et al., 2019). Inner East Asia, including Mongolia, is one of the hotspots with the strongest warming since the second half of the 20th century, which for example has dramatically increase the frequency of heat waves (Erdenebat and Sato, 2016; Zhang et al., 2020). A few previous studies have evaluated freezing and thawing indices over Mongolia, partly also using CRU data and field observations. For instance, according to a large-scale study based on the gridded temperature data from 1901 to 2015, Mongolia experienced more pronounced decreases in the freezing index (and increases in thawing index) than Alaska, Russia, Canada and the Tibetan Plateau (Shi et al., 2019). A local scale study based on ground surface temperatures from 20 sites in Mongolia showed that the surface thawing indices increased statistically significant by 29°C-day per year, but no significant trends in the surface freezing indices were observed during 1987–2005 (Wu et al., 2011).
The present study evaluates the long-term patterns and trends in air freezing and thawing index over Mongolia for 20 years intervals, using in-situ observations of air temperature and gridded CRU data. The maximum values for both indices have been recorded in the most recent 20 years (Figures 3, 4), which is evidence of the long-term warming. In agreement with previous studies (Wu et al., 2011; Shi et al., 2019), our results suggest that the decrease of the freezing index and increase of the thawing index in Mongolia are particularly noticeable since the beginning of the 1980s and 1990s. In this study, we not only analyzed the spatial distribution of freezing and thawing indices over Mongolia, but also the variations of their trends in time. In particular, the highest trends in both freezing and thawing indices occurred during 1981–2000, with maximum trends reaching −53.0°C -day per year for the freezing and 17.9°C -day per year for the thawing index (Kho station, Table 1), which is significantly more than in the former and latter 20 years periods. The maximum values for both indices have been recorded in the most recent 20 years (Figures 3, 4), which is evidence of the long-term warming. A similar result was noted by Hu et al. (2021), who found that the warming rate was considerably higher from 1980 to 1995 than that from 1996 to 2018 in permafrost regions in the Northern Hemisphere. Furthermore, the most intensive warming around Mongolia has occurred in the 1980s, 1990s, and 2000s, in line with global average temperature increases over the past century due to anthropogenic greenhouse gases emissions (IPCC, 2013). In addition, regional climate conditions could be important to explain changes in near surface temperature in Mongolia, in particular the atmospheric circulation influenced by the intensity of the central Siberian High and the pronounced warming in the Arctic (Gong and Ho, 2002; Erdenebat and Sato, 2016; Cohen et al., 2020). Finally, differences in freezing and thawing indices are likely influenced by local environmental factors, such as hydrology, soil texture, vegetation, snow cover, topography, solar radiation, surface cover, and surface energy balance (Smith and Riseborough, 2002; Romanovsky et al., 2007; Dashtseren et al., 2014; Hu et al., 2021).
The long-term trends generally show that the thawing index is changing faster than the freezing index in Mongolia (Table 1). At the 30 stations in Mongolia, the long-term trends in freezing indices varied from 0.3°C-day per year to 10.1°C -day per year with an average of 5.4°C-day per year (Table 1), which is higher than the estimates by Shi et al. (2019) for Mongolia (3.7°C -day per year for 1988–2015) and by Peng et al. (2019) (1.6°C -day per year) for China, while a similar trend (5.4°C-day per year for 1980–2018) was found in transitional permafrost regions, where Mongolia is located (Hu et al., 2021). The differences to these studies can likely be explained by the more extensive data set analyzed for this study. The long-term trends in thawing indices at the stations were found to be between 5.8°C-day per year and 14.4°C-day per year, with a mean of 8.9°C-day per year (Table 1). Similar magnitudes have been found over Mongolia after 1990 (Shi et al., 2019), but also here the trends are higher than in Alaska, Russia, Canada, the Tibetan Plateau, China and transitional permafrost regions (Peng et al., 2019; Shi et al., 2019; Hu et al., 2021). In addition, a comparison between our study and Wu et al. (2011) reveals that the changes in air thawing and freezing indices are probably lower than those in the ground surface indices. As both changes in air and surface indices affect the ground thermal regime, the duration of ground thawing is likely increased compared to the period of ground freezing over Mongolia.
The analysis of the CRU data is associated with uncertainties, related to the use of mean monthly temperature data to compute thawing and freezing indices (Shi et al., 2019; Harris et al., 2020), and to the spatial resolution of the gridded data set. Figure 5 shows that there is an offset between the long-term values of the indices computed from the CRU and observations for some of the stations. In many cases, these differences could be explained by the different altitudes of the CRU grid cells and the meteorological stations. For example, at the UL, AL and B-Kh stations, the CRU data are associated with lower altitudes as the observations, while CRU altitudes were higher for B-U, AR and MG (Table 2). Furthermore, the spatial distance between the CRU node and the station could play a role for the match between the two data sets. Despite the clear differences in the absolute values for some stations, the CRU data and the meteorological stations displayed similar temporal trends for both the freezing and thawing indices (Figure 4C). This suggests that the spatial patterns of the trends across Mongolia (Figures 5C,D) is in agreement with the observational data at selected points. Moreover, the CRU data provide a coarse-scale picture over Mongolia, while the station data are also affected by local trends.
The results from this study indicate that the decrease in the freezing index is usually higher in mountain regions and the north of Mongolia featuring permafrost, compared to steppes and the Gobi-desert dominated by seasonally frozen ground. The opposite occurred for the thawing index. As reported in MARCC (2014), the air temperature has increased strongly in the mountainous regions, more than in the Gobi-desert and steppes regions. For regional comparison, a study within permafrost regions in the Northern Hemisphere revealed that the trends in hawing and freezing indices were highest in high altitude regions compared to high altitude and transitional regions (Hu et al., 2021).
The decrease of the freezing index and increase in the thawing index over Mongolia has likely led to permafrost thawing and the formation of taliks, which has been recorded at the southern permafrost boundary in Mongolia (Ishikawa et al., 2018). Even where permafrost is still stable, increases in the thawing index could lead to deepening of the active layer, which has widely occurred in Mongolia (Sharkhuu et al., 2007; Sharkhuu et al., 2008; Zhao et al., 2010; Jambaljav, 2017; Dashtseren, 2021). Meanwhile, the permafrost in the Khuvsgul region is degrading more rapidly than in the Khangai and Khentii mountains in agreement with the strong changes in thawing/freezing index in these regions (Jambaljav, 2017; Dashtseren, 2021). In addition, the changes of the freezing and thawing index can lead to recessions of glaciers in the Altai, Khangai and Khuvsgul mountains, which have been described in several studies (e.g., Baast, 1998; Kamp and Pan, 2015; Orkhonselenge, 2017; Pan et al., 2018). Furthermore, ongoing and further projected changes of the freezing index (Peng et al., 2019) also lead to shallower freezing depths for seasonally frozen ground in the steppe and Gobi-desert of Mongolia, which might affect local ecosystems.
In this study, we investigate changes in freezing and thawing indices over Mongolia based on the observed data from 30 selected meteorological stations, as well as gridded CRU data which reproduce observed trends well. The latitude and altitude play the dominant roles in the spatial patterns of freezing and thawing indices over Mongolia. The long-term freezing and thawing indices the stations varies from −945.5 to −4,793.6°C day and 1,164.4 to 4,021.3°C day, respectively. Both indices and MAAT have shown warming trends. MAAT has warmed by 2.4°C, across Mongolia. Which is the higher than the global mean. The recorded trends in the freezing and thawing indices are large compared other regions in the Northern Hemisphere. In Mongolia, the freezing index has decreased with the range from −0.3°C-day per year to −10.1°C-day per year, while the thawing index has increased between 5.8°C-day per year and 14.4°C-day per year. During the last 2 decades, the highest values for both the thawing index and the freezing index (i.e. the least negative values) have occurred. However, the largest changes of thawing and freezing indices occurred between 1981 and 2000. Overall, the increase in the thawing index in the steppe and Gobi-desert is higher than that in the mountain and northern parts of Mongolia, where the strongest trends in the freezing index was recorded. The changes in the freezing and thawing indices reflect the multi-decadal warming trend, which can enhance the degradation of permafrost and reduce the thickness of the seasonally frozen ground, thus affecting ecosystems and land use in Mongolia. While this study provides detailed information on large-scale changes over Mongolia, the role of local environmental effects on the freezing and thawing indices need to be further studied to fully understand the impact on ecosystems and livelihoods.
Publicly available datasets were analyzed in this study. This data can be found here: It is free to use air temperatures from the CRU TS 4.23 climate data set https://crudata.uea.ac.uk/cru/data/hrg/cru_ts_4.03/observation.v4.03/. Regarding the air temperature data IRIMHEM, it is not open for the public.
AD and SW contributed and wrote the main conceptual ideas. AD and KT prepared the results figures. AB and DB provided climate data. YA analysed the raw data. All authors contributed to the writing and approved the submitted version.
This study was partly supported by Permafrost4Life “Permafrost ecosystems entangled with human life in Mongolia- evaluating the impact of land use change in a warming climate” from the Research Council of Norway (Project No. 301639). Additional funding was provided by the European Space Agency through the ESA Permafrost CCI project (https://climate.esa.int/en/projects/permafrost/).
The authors declare that the research was conducted in the absence of any commercial or financial relationships that could be construed as a potential conflict of interest.
All claims expressed in this article are solely those of the authors and do not necessarily represent those of their affiliated organizations, or those of the publisher, the editors and the reviewers. Any product that may be evaluated in this article, or claim that may be made by its manufacturer, is not guaranteed or endorsed by the publisher.
We would like to thank the Climatic Research Unit at the University of East Anglia, which provided the CRU DATA.
Baast, P. (1998). Modern Glacier and Hydrology of Mongolia Ulaanbaatar: National University of Mongolia Press.
Cohen, J., Zhang, X., Francis, J., Jung, T., Kwok, R., Overland, J., et al. (2020). Divergent Consensuses on Arctic Amplification Influence on Midlatitude Severe winter Weather. Nat. Clim. Chang. 10 (1), 20–29. doi:10.1038/s41558-019-0662-y
Dashtseren, A., Ishikawa, M., Iijima, Y., and Jambaljav, Y. (2014). Temperature Regimes of the Active Layer and Seasonally Frozen Ground under a forest-steppe Mosaic, Mongolia. Permafrost Periglac. Process. 25 (4), 295–306. doi:10.1002/ppp.1824
Dashtseren, A. (2021). “Permafrost in Mongolia,” in The Physical Geography of Mongolia. Editor B. Yembuu (Cham: Springer), 218. doi:10.1007/978-3-030-61434-8_7
Doljin, D., and Yembuu, B. (2021). “Division of the Physiographic and Natural Regions in Mongolia,” in Geography of the Physical Environment. Editor B Yembuu (Cham: Springer), 177–193. doi:10.1007/978-3-030-61434-8_10
Dulamsuren, C., Hauck, M., Leuschner, H. H., and Leuschner, C. (2011). Climate Response of Tree-Ring Width in Larix Sibirica Growing in the Drought-Stressed forest-steppe Ecotone of Northern Mongolia. Ann. For. Sci. 68 (2), 275–282. doi:10.1007/s13595-011-0043-9
Erdenebat, E., and Sato, T. (2016). Recent Increase in Heat Wave Frequency Around Mongolia: Role of Atmospheric Forcing and Possible Influence of Soil Moisture Deficit. Atmos. Sci. Lett. 17, 135–140. doi:10.1002/asl.616
Frauenfeld, O. W., Zhang, T., and Mccreight, J. L. (2007). Northern Hemisphere Freezing/thawing index Variations over the Twentieth century. Int. J. Climatol. 27, 47–63. doi:10.1002/joc.1372
French, H. M. (2007). The Periglacial Environment (Issue 2). Chichester: John Wiley & Sons Ltd, The Atrium, Southern Gate.
Gerelchuluun, B., and Ahn, J. B. (2014). Air Temperature Distribution over Mongolia Using Dynamical Downscaling and Statistical Correction. Int. J. Climatol. 34 (7), 2464–2476. doi:10.1002/joc.3853
Gong, D.-Y., and Ho, C.-H. (2002). The Siberian High and Climate Change over Middle to High Latitude Asia. Theor. Appl. Climatology 72 (1–2), 1–9. doi:10.1007/s007040200008
Guo, D., and Wang, H. (2017). Simulated Historical (1901-2010) Changes in the Permafrost Extent and Active Layer Thickness in the Northern Hemisphere. J. Geophys. Res. Atmos. 122 (22), 12285–12295. doi:10.1002/2017JD027691
Harris, I., Osborn, T. J., Jones, P., and Lister, D. (2020). Version 4 of the CRU TS Monthly High-Resolution Gridded Multivariate Climate Dataset. Sci. Data 7 (1), 1–18. doi:10.1038/s41597-020-0453-3
Hu, G., Zhao, L., Wu, T., Wu, X., Park, H., Fedorov, A., et al. (2021). Spatiotemporal Variations and Regional Differences in Air Temperature in the Permafrost Regions in the Northern Hemisphere during 1980-2018. Sci. Total Environ. 791, 148358. doi:10.1016/j.scitotenv.2021.148358
Hugelius, G., Strauss, J., Zubrzycki, S., Harden, J. W., Schuur, E. A. G., Ping, C.-L., et al. (2014). Estimated Stocks of Circumpolar Permafrost Carbon with Quantified Uncertainty Ranges and Identified Data Gaps. Biogeosciences 11 (23), 6573–6593. doi:10.5194/bg-11-6573-2014
IPCC (2013). Climate Change 2013: The Physical Science Basis. Contribution of Working Group I to the Fifth Assessment Report of the Intergovernmental Panel on Climate Change, Cambridge, UK: Cambridge University Press.
Ishikawa, M., Jamvaljav, Y., Dashtseren, A., Sharkhuu, N., Davaa, G., Iijima, Y., et al. (2018). Thermal States, Responsiveness and Degradation of Marginal Permafrost in Mongolia. Permafrost and Periglac Process 29 (4), 271–282. doi:10.1002/ppp.1990
Ishikawa, M., Sharkhuu, N., Jambaljav, Y., Davaa, G., Yoshikawa, K., and Ohata, T. (2012). Thermal State of Mongolian Permafrost. Proceedings of the 10th Internation Conference on Permafrost, Salekhard, Russia, June 25‐29, 2010.
Jambaljav, Y. (2017). in Permafrost Distribution and its Change in Mongolia. Editor D. Dashjamts (Tokyo: Colourfull LLC).
Kamp, U., and Pan, C. G. (2015). Inventory of Glaciers in Mongolia, Derived from Landsat Imagery from 1989 to 2011. Geografiska Annaler: Ser. A, Phys. Geogr. 97 (4), 653–669. doi:10.1111/geoa.12105
Klinge, M., Dulamsuren, C., Schneider, F., Erasmi, S., Hauck, M., Bayarsaikhan, U., et al. (2020). Modelled Potential forest Area in the forest-steppe of central Mongolia Is about Three Times of Actual forest Area. Biogeosciences Discuss. March, 1–37. doi:10.5194/bg-2020-13
Luo, D., Jin, H., Jin, R., Yang, X., and Lü, L. (2014). Spatiotemporal Variations of Climate Warming in Northern Northeast China as Indicated by Freezing and Thawing Indices. Quat. Int. 349, 187–195. doi:10.1016/j.quaint.2014.06.064
MARCC (2014). Mongolia Second Assessment Report on Climate Change 2014. Ulaanbaatar: Ministry of Environment and Green Development of Mongolia.
Nandintsetseg, B., Greene, J. S., and Goulden, C. E. (2007). Trends in Extreme Daily Precipitation and Temperature Near lake Hövsgöl, Mongolia. Int. J. Climatol. 27 (3), 341–347. doi:10.1002/joc.1404
Nelson, F. E., Hinkel, K. M., Shiklomanov, N. I., Mueller, G. R., Miller, L. L., and Walker, D. A. (1998). Active-layer Thickness in north central Alaska: Systematic Sampling, Scale, and Spatial Autocorrelation. J. Geophys. Res. 103 (D22), 28963–28973. doi:10.1029/98JD00534
Nelson, F. E., and Outcalt, S. I. (1987). A Computational Method for Prediction and Regionalization of Permafrost. Arctic Alpine Res. 19 (3), 279–288. doi:10.2307/1551363
NSOM (2020). National Statistical Office of Mongolia. Available at: https://www.1212.mn/.
Obu, J., Westermann, S., Bartsch, A., Berdnikov, N., Christiansen, H. H., Dashtseren, A., et al. (2019). Northern Hemisphere Permafrost Map Based on TTOP Modelling for 2000-2016 at 1 Km2 Scale. Earth-Science Rev. 193 (March), 299–316. doi:10.1016/j.earscirev.2019.04.023
Orkhonselenge, A. (2016). Glacial Geomorphology of Mt. Munkh Saridag in the Khuvsgul Mountain Range, Northern Mongolia. geomorphologie 22, 389–398. doi:10.4000/geomorphologie.11596
Pan, C. G., Pope, A., Kamp, U., Dashtseren, A., Walther, M., and Syromyatina, M. V. (2018). Glacier Recession in the Altai Mountains of Mongolia in 1990-2016. Geografiska Annaler: Ser. A, Phys. Geogr. 100 (2), 185–203. doi:10.1080/04353676.2017.1407560
Peng, X., Zhang, T., Liu, Y., and Luo, J. (2019). Past and Projected Freezing/thawing Indices in the Northern Hemisphere. J. Appl. Meteorology Climatology 58 (3), 495–510. doi:10.1175/JAMC-D-18-0266.1
Romanovsky, V. E., Sazonova, T. S., Balobaev, V. T., Shender, N. I., and Sergueev, D. O. (2007). Past and Recent Changes in Air and Permafrost Temperatures in Eastern Siberia. Glob. Planet. Change 56 (3–4), 399–413. doi:10.1016/j.gloplacha.2006.07.022
Schaefer, K., Lantuit, H., Romanovsky, V. E., Schuur, E. A. G., and Witt, R. (2014). The Impact of the Permafrost Carbon Feedback on Global Climate. Environ. Res. Lett. 9 (8), 085003. doi:10.1088/1748-9326/9/8/085003
Sharkhuu, A., Sharkhuu, N., Etzelmüller, B., Heggem, E. S. F., Nelson, F. E., Shiklomanov, N. I., et al. (2007). Permafrost Monitoring in the Hovsgol Mountain Region, Mongolia. J. Geophys. Res. 112 (2), 1–11. doi:10.1029/2006JF000543
Sharkhuu, N., Anarmaa, S., Romanovsky, V. E., Yoshikawa, K., Nelson, F. E., and Shiklomanov, N. . (2008). Thermal State of Permafrost in Mongolia. Proceedings of the 9th International Conference on Permafrost, Alaska, USA, June 28-July 3 2008.
Shi, Y., Niu, F., Lin, Z., and Luo, J. (2019). Freezing/thawing index Variations over the Circum-Arctic from 1901 to 2015 and the Permafrost Extent. Sci. Total Environ. 660, 1294–1305. doi:10.1016/j.scitotenv.2019.01.121
Smith, M. W., and Riseborough, D. W. (2002). Climate and the Limits of Permafrost: A Zonal Analysis. Permafrost Periglac. Process. 13 (1), 1–15. doi:10.1002/ppp.410
Sun, Z., Wang, Q., Xiao, Q., Batkhishig, O., and Watanabe, M. (2015). Diverse Responses of Remotely Sensed Grassland Phenology to Interannual Climate Variability over Frozen Ground Regions in Mongolia. Remote Sensing 7 (1), 360–377. doi:10.3390/rs70100360
Van Everdingen, R. O. (1998). Multi-language Glossary of Permafrost and Related Ground-Ice Terms. 2005. Calgary: Arctic Institute of North America Press, 159. Available at: https://globalcryospherewatch.org/reference/glossary_docs/Glossary_of_Permafrost_and_Ground-Ice_IPA_2005.pdf.
Wu, T., Wang, Q., Zhao, L., Batkhishig, O., and Watanabe, M. (2011). Observed Trends in Surface Freezing/thawing index over the Period 1987-2005 in Mongolia. Cold Regions Sci. Tech. 69 (1), 105–111. doi:10.1016/j.coldregions.2011.07.003
Zhang, P., Jeong, J.-H., Yoon, J.-H., Kim, H., Wang, S.-Y. S., Linderholm, H. W., et al. (2020). Abrupt Shift to Hotter and Drier Climate over Inner East Asia beyond the Tipping point. Science 370 (6520), 1095–1099. doi:10.1126/science.abb3368
Zhang, T., Frauenfeld, O. W., Serreze, M. C., Etringer, A., Oelke, C., McCreight, J., et al. (2005). Spatial and Temporal Variability in Active Layer Thickness over the Russian Arctic Drainage basin. J. Geophys. Res. 110 (16), 1–14. doi:10.1029/2004JD005642
Keywords: freezing index, thawing index, transition zones, climate warming, Mongolia
Citation: Dashtseren A, Temuujin K, Westermann S, Batbold A, Amarbayasgalan Y and Battogtokh D (2021) Spatial and Temporal Variations of Freezing and Thawing Indices From 1960 to 2020 in Mongolia. Front. Earth Sci. 9:713498. doi: 10.3389/feart.2021.713498
Received: 23 May 2021; Accepted: 22 October 2021;
Published: 11 November 2021.
Edited by:
Qingbai Wu, Northwest Institute of Eco-Environment and Resources (CAS), ChinaReviewed by:
Guo Donglin, Zhan Kezhen—Nansen International Research Center, Institute of Atmospheric Physics (CAS), ChinaCopyright © 2021 Dashtseren, Temuujin, Westermann, Batbold, Amarbayasgalan and Battogtokh. This is an open-access article distributed under the terms of the Creative Commons Attribution License (CC BY). The use, distribution or reproduction in other forums is permitted, provided the original author(s) and the copyright owner(s) are credited and that the original publication in this journal is cited, in accordance with accepted academic practice. No use, distribution or reproduction is permitted which does not comply with these terms.
*Correspondence: Avirmed Dashtseren, ZGFzaHRzZXJlbmFAbWFzLmFjLm1u
Disclaimer: All claims expressed in this article are solely those of the authors and do not necessarily represent those of their affiliated organizations, or those of the publisher, the editors and the reviewers. Any product that may be evaluated in this article or claim that may be made by its manufacturer is not guaranteed or endorsed by the publisher.
Research integrity at Frontiers
Learn more about the work of our research integrity team to safeguard the quality of each article we publish.