 Peter L. Moore
94% of researchers rate our articles as excellent or good
Learn more about the work of our research integrity team to safeguard the quality of each article we publish.
Find out more
ORIGINAL RESEARCH article
Front. Earth Sci. , 27 July 2021
Sec. Cryospheric Sciences
Volume 9 - 2021 | https://doi.org/10.3389/feart.2021.710131
This article is part of the Research Topic Debris-Covered Glaciers: Formation, Governing Processes, Present Status and Future Directions View all 20 articles
Supraglacial debris does not remain fixed atop ablating ice, but can move across the ice surface as supraglacial topography evolves. This active debris movement (distinct from passive movement due to underlying ice motion) affects landform genesis as well as the rate and spatial distribution of ablation. While observations of debris transport across evolving supraglacial topography are abundant, models of these coupled processes over timescales of decades and longer are few. Here I adapt a numerical model of coupled ablation and downslope debris transport to simulate the evolution of an idealized debris-covered glacier on the timescale of complete de-icing. The model includes ablation that depends on supraglacial debris thickness and a hillslope-scale debris transport function that scales non-linearly with slope angle. Ice thickness and debris distribution evolve with model time, allowing complete simulation of de-icing and landform construction in an idealized glacier test-section. The model produces supraglacial relief that leads to topographic inversions consistent with conceptual models of hummocky landform genesis. Model results indicate that the relief of the glacier surface and postglacial hummocks depend on the relationship between characteristic timescales for ablation and debris transport, which is defined as an index of debris mobility. When debris mobility is high, topographic inversions are rapid and supraglacial and postglacial relief are subdued. When debris mobility is low, more pronounced supraglacial relief is produced, but postglacial relief remains subdued. An intermediate mobility appears to optimize both postglacial relief and the rate of de-icingcompared with both highly-mobile and immobile debris. This enhancement of de-icing due to debris mobility could contribute to the observed anomalous rates of ablation in some debris-covered glaciers.
Hummocky moraine landscapes are widespread along the margins of ancient ice sheets. A leading hypothesis for the origin of hummocky moraine invokes supraglacial debris movement during wastage of debris-covered ice (Sharp, 1949; Eyles, 1979; Clayton et al., 2008; Schomacker, 2008). According to this hypothesis, basins on the ice surface collect debris while inter-basin ridges shed debris. Once the ice is gone, thick debris from the supraglacial basins becomes hills, while areas of thin debris from surrounding ridgetops become swales and wetlands. This conversion of hills to basins during deglaciation is often called topographic inversion. At a 103–105 m scale, hummocky moraine tracts often exhibit characteristic hummock wavelength and height (Johnson and Clayton, 2005). These characteristics must reflect the physical processes that shed or concentrate debris on an ablating, debris-covered ice surface.
Supraglacial debris not only serves as the medium for construction of distinct postglacial landforms, but also modifies ablation of the underlying glaciers. While thin (less than a few centimeters) or discontinuous debris cover can enhance melt rates compared with debris-free ice, thicker debris typically reduces ablation rates (Østrem, 1959; Nakawo and Young, 1981). The relationship between debris thickness and ablation rate is usually strong where ablation is dominated by downwasting, wherein heat for melting is transferred to the ice primarily by conduction through the debris layer. However, backwasting of ice cliffs, thermokarst-like melting from ponded and flowing supraglacial (and possibly subglacial) meltwater, and bottom melting can also contribute to ice mass loss to varying degrees (Driscoll, 1980; Schomacker, 2008; Thompson et al., 2016).
As recent climate warming has caused widespread glacier thinning and retreat, an increasing fraction of earth’s glacier area is becoming debris-covered (Scherler et al., 2018), and this fraction is expected to grow in the near future (Herreid and Pellicciotti, 2020). While many studies have sought to simulate the physics of ablation on subannual timescales and local spatial scales in debris-covered glaciers, these models still perform inconsistently when scaled up to regional glacier mass balance assessments (e.g., Kääb et al., 2012). The difficulty may stem from inadequate accounting of unobserved processes such as changing extent of ponded (Thompson et al., 2016) or subsurface meltwater (Benn et al., 2017), ice dynamics (Banerjee, 2017), or elevation lapse rates (Vincent et al., 2016). However, debris mobilization can also influence the distribution of high- and low-ablation-rate areas through time, a phenomenon that has yet to be explored in detail (cf. Nicholson et al., 2018). This paper explores some of the consequences of supraglacial debris mobility for the patterns and rates of ice ablation and debris distribution over multi-annual and longer timescales.
That supraglacial debris moves across underlying ice as the ice ablates is widely appreciated, particularly among glacial geomorphologists and sedimentologists seeking to explain the origins of ancient glacial landforms (Gravenor, 1955; Clayton, 1964; Reid, 1970; Wright, 1980; Hambrey, 1984; Attig et al., 1989; Johnson et al., 1995; Hambrey, 1997; Ham and Attig, 2001; Andersson, 2008; Krüger et al., 2010). Note that this refers to debris transport relative to underlying ice rather than passive transport atop actively-moving ice. A small but important body of work explores supraglacial debris movement processes and phenomena.
Though early descriptions of shallow slope failure and meltwater transport of supraglacial debris are abundant (Russell, 1893; Gilbert, 1904; Tarr and Martin, 1914; Sharp, 1949), not until the middle of the 20th century did researchers begin to explore the physics of debris movement (Sharp, 1949; Boulton, 1967). Although these authors discussed ideas about thresholds for debris movement and textural clues to transport mechanisms, formal mechanical descriptions of debris movement only emerged in the 1970s (Boulton and Paul, 1976; Lawson, 1979, 1982; Paul and Eyles, 1990). These authors recognized supraglacial debris flows of varying degrees of fluidity and sought explanations from frozen-ground engineering literature for failure thresholds and rates of movement. These discussions highlighted the role of meltwater pore pressure developed through “thaw consolidation” of supraglacial debris, which was reported to govern the rate and style of mass movement and the resulting sediment properties (Lawson, 1982) but was difficult to implement in practical models (Moore, 2018). Much more recently, Moore (2018) reframed the description of thresholds for debris destabilization in terms of material properties that are more readily quantified, and incorporated terrain attributes that allow prediction of the spatial distribution of unstable debris and zones of likely surface runoff. Observed relationships between supraglacial topography and debris thickness (Nicholson et al., 2018) and transient change in debris thickness across an evolving glacier surface (Westoby et al., 2020) are broadly consistent with expected areas of debris destabilization. The stability model stops short, however, of predicting debris transport rates or deposition, and this remains an area of future research need.
Rapid mass movement and glaciofluvial transport are not the only mechanisms of downslope debris movement. Individual supraglacial debris particles have been observed to migrate relatively slowly across underlying ice in either the downslope or sunward direction (Fryxell, 1933). This typically occurs when the melt reduction beneath a particle causes it to become perched on a pedestal of ice relative to the surrounding ablating surface—features like this capped with large boulders are often referred to as a “boulder tables.” As the pedestal height grows and/or the girth diminishes, the particle slides or topples from the pedestal to a new position where the process may begin again. The net result over repeated cycles is a relatively slow motion that some have termed “topple-walk.” Fryxell (1933) found on Teton Glacier, United States, that most of the motion occurred in the downslope direction, though for gently sloping ice surfaces (< 12
A recent study by Fyffe et al. (2020) explored topple-walk transport and related phenomena using high-resolution repeat imagery on Miage Glacier, Italy. The authors documented particle transport in areas of partial debris cover on the order of a few centimeters per day down slopes ranging from 5° to 30°. In the same areas, ablation proceeded at 3–6 cm per day, suggesting that downslope debris movement in this setting is of the same order of magnitude as ablation rate. This study largely confirmed the slope and particle-size dependence of debris flux by the topple-walk mechanism, but additionally documented slope-dependent creep in areas of complete debris cover at smaller (less than 1 cm/day) but still significant rates. Details of the creep mechanism were not investigated, but the process was an important component of the total debris flux across the ice surface.
In other terrestrial settings, creep of hillslope materials is caused by a variety of stochastic disturbances, both biotic and abiotic, which tend to slowly and intermittently displace particles downslope at rates that are sensitive to slope angle and slope curvature (Heimsath et al., 2002; Roering, 2004; Pawlik and Šamonil, 2018). Abiotic disturbances from these regimes that also act in supraglacial settings include wetting/drying cycles, freezing/thawing cycles and snow loading, among many others. Thus, while the physical processes responsible for topple-walk creep may not be sustained where supraglacial debris thickness exceeds a few clast diameters, several creep-inducing processes can be expected to be active. This remains an issue in need of further investigation.
In debris-covered glacier settings, it is important to realize that sub-debris ablation by downwasting requires debris to “settle” under the influence of gravity and perhaps an additional seepage force related to the evacuation of meltwater (Moore, 2018). Even if the circumstances of this seepage are not sufficient to surpass the stability thresholds described by Moore (2018), some downslope displacement may still occur. Much like the particle re-arrangements caused by acoustic vibrations introduced in some laboratory hillslope creep experiments (Roering et al., 2001), it is reasonable to hypothesize that the combined settling and seepage processes in supraglacial debris should promote net downslope transport that scales with slope angle (Furbish et al., 2009) and ablation rate (Houssais et al., 2021). This, too, requires future study. Nevertheless, it appears justified to proceed with a heuristic description of slow downslope debris transport until a more rigorous description, grounded in observation or theory, becomes available.
Evolution of debris distribution on debris-covered glaciers has been modeled in two different ways. At the scale of a full valley glacier, landsliding, debris emergence, melt-out, and passive supraglacial transport has been described by models seeking to explain. debris cover effects on glacier extent and moraine position (Shulmeister et al., 2009; Vacco et al., 2010; Anderson and Anderson, 2016; Anderson et al., 2018) or debris cover effects on mass balance and runoff (Rowan et al., 2015). In most of these models, debris is passively transported within or atop dynamic ice. A second type of model focuses on local-scale transport of debris across the ice surface as surface relief evolves through differential melting. This approach requires a description of active debris transport relative to the underlying ice, where any ice dynamics (and passive downglacier ice and debris transport) is treated separately. The local-scale coupling of ablation and debris transport in these types of models creates a complex pattern of evolving supraglacial relief that can govern both the spatial patterns of debris accumulation and the rate of ablation of the underlying ice. The present study builds on this latter type of model, so I review some key examples of this approach here.
Anderson (2000) investigated how the width and topographic expression of medial moraines evolves as one moves downglacier from their englacial debris source near the glacier equilibrium line. Ablation under debris was approximated by an exponential decay function with increasing debris thickness, neglecting the small-thickness ablation enhancement characteristic of some Østrem curves. Spatial variation in debris cover thickness led with time to creation of relief on the glacier surface. Anderson then reasoned that debris was transported across the ablating ice surface by the topple-walk mechanism, with the probability distribution of toppling steps becoming larger and more downslope with increasing slope angle. He therefore reasoned that this process could be described more generally with a slope-dependent flux of the form
Following in part from Anderson, Fowler and Mayer (2017) explored the origins of “ice sails,” which are ridges or pinnacles of debris-free ice on the order of
A recent study by Mölg et al. (2020) explored the evolution of debris cover originating from medial moraines similar to those described in Anderson (2000). They constructed a model similar to that of Anderson (2000) except with a hyperbolic function of debris thickness describing sub-debris melt (Anderson and Anderson, 2016). The authors used this model to help explain both the evolution of supraglacial relief with downglacier position and the influence of that relief on supraglacial and subglacial meltwater drainage. They show that the results compare favorably with the topographic features of Zmuttgletscher in the Swiss Alps. They further link the development of ice cliffs, which contribute disproportionately to ablation in some debris-covered areas, to meltwater concentration in the troughs between moraine ridges.
The studies reviewed above demonstrate the power of simple models coupling ablation and debris redistribution to improve our understanding of surface features of debris-covered glaciers. Each of these studies, however, is focused on reproducing the features of a particular glacier (Anderson, 2000; Mölg et al., 2020) or generating a particular feature (Fowler and Mayer, 2017). None explores the range of features and patterns that emerge as model parameters vary, nor do they carry simulations to complete de-icing (de-icing is used here to refer to the long-term wastage of an ice volume of interest, independent of process or glacier dynamics). Thus, many process-form relationships remain unexplored, particularly on the longer timescales relevant to landform genesis.
In this paper, I combine some aspects of these prior studies to simulate the coupled processes of sub-debris ablation and debris transport in downwasting debris-covered glaciers. Attention is focused on the influence of initial conditions and parameter values on the coupled dynamics and consequent distribution of debris on the ice-free landscape at the end of simulations. Generality and simplicity is favored over detail and complexity in order to highlight the relationships that most strongly impact the morphological result.
Ablation rate
where
When melt releases debris from debris-bearing ice, the resulting debris production
where
Differential melt produces relief on the debris-covered ice surface and debris transport can take place by the various processes reviewed above. For the purposes of this analysis, transport is assumed to take place in one horizontal dimension
where as before
A general form of nonlinear transport is used here to simulate the contributions of both slow creep and rapid mass movements to downslope debris flux. Transport rate thus increases sharply as the slope
Here,
where
A 1D explicit finite difference model was constructed in MATLAB using Eqs 1–5 to explore the evolution of supraglacial topography and debris re-distribution, as well as the resulting patterns of debris accumulation following complete de-icing. A conservative finite-difference scheme adapted from Perron (2011) was used in which melt and debris production were computed at nodes, while slope and debris flux were computed at midpoints between nodes. The ablation and debris transport problems were each treated in one spatial dimension, where ablation caused adjustment of the ice surface vertically (
The behavior of the model was investigated within two idealized domain types: 1) a rectangular glacier cross-section with one or more vertical englacial debris bands; and 2) a rectangular section with no englacial debris but a supraglacial debris blanket of non-uniform initial thickness (Figure 1). No-flux conditions were enforced on the left and right boundaries for both domain types, representing either barriers to transport there or a mirror-image (periodic) domain. Domain sizes and aspect ratios were varied along with parameter values to explore impacts on ablation and debris accumulation patterns. For simplicity, all parameter values were held constant during a given simulation, but varied among simulations. Parameter definitions and ranges of values used in simulations are given in Table 1.
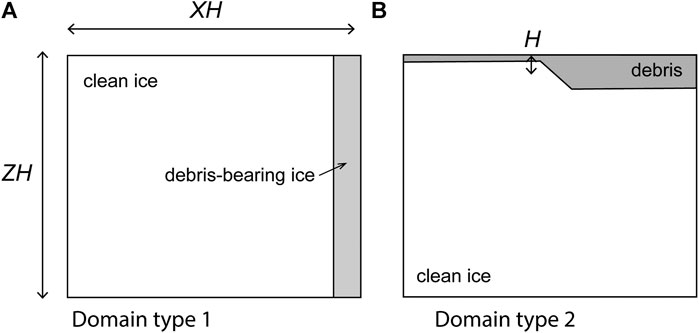
FIGURE 1. Schematic illustration of the simplified model domains used in this study. Both types of domains represent vertical cross-sections through a glacier and have dimensions scaled to the mean supraglacial debris thickness
TABLE 1. Parameter definitions, units, and simulated values for model quantities. Single values are given for quantities that were not varied, while ranges are given for those parameters varied experimentally. Note that
Domain type 1 was first used to validate model results by comparison with results of Anderson (2000), and then to explore the effects of varying initial conditions (e.g., domain geometry and debris mobility) and physical properties on supraglacial relief and debris distribution during and after melt. In all domain 1 simulations, the englacial debris sources were arbitrarily defined to be 10 m wide. In most of these, a single debris band was located along the right-hand boundary of the domain as illustrated in Figure 1A. However, a few simulations were conducted with multiple englacial debris bands in the interior of the domain to explore the interactions between sources. Domain type 2, representing debris originating from events like landslides that don’t produce continuous debris sources with glacier depth, was used to further explore the effects of initial conditions and physical properties on long term melt rates and changes in debris thickness distribution. In all of the domain 2 simulations presented here, initial debris thickness ranged from 0.1 to 1.1 m, with an arithmetic mean initial thickness of 0.6 m. A smooth ramp in debris thickness spanning 10 nodes accommodated the transition between thick and thin debris ensuring that initial debris thickness gradients did not exceed 0.1. In each domain type, geometry, and parameter values were varied over reasonable ranges to explore consequences for de-icing rates and surface relief. Ranges of parameter values considered are presented in Table 1.
The relationships between characteristic rates of transport and melt are expected to determine how supraglacial relief evolves with time, and therefore whether debris thickness evolves toward uniform thickness or growing non-uniformity. To explore this with more generality, the length dimensions can be scaled by a characteristic length of this system. With this in mind, results are compared across model runs using scaled spatial variables normalized to the arithmetic mean debris thickness
Assuming that melt occurs by conduction through supraglacial debris only, the timescale
Since each characteristic timescale is the reciprocal of a characteristic speed,
While this simple model cannot reasonably represent the full range of behaviors exhibited in supraglacial debris, it can nevertheless be used to explore the impacts of varying parameter values on surface relief and de-icing time relative to that assuming a constant static debris thickness. The results highlight the influence of debris mobility on differential ablation, surface relief, and landform genesis in debris covered glacier settings.
Simulations with medial moraines (domain type 1) were broadly consistent with prior model experiments (Anderson, 2000; Mölg et al., 2020). Figure 2 summarizes two simulations with different domain lengths
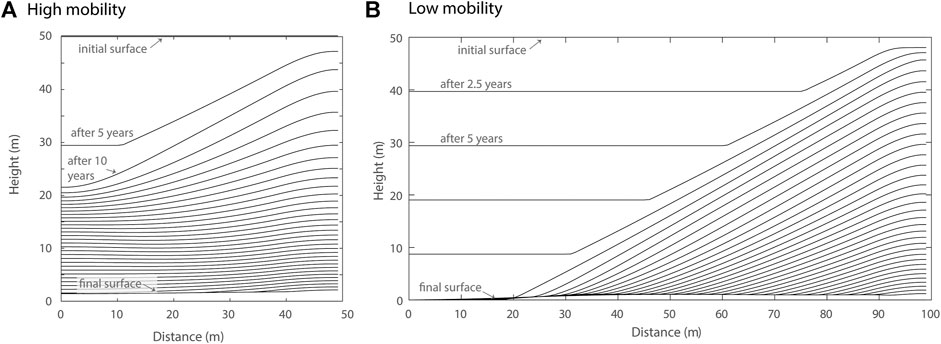
FIGURE 2. Glacier surface isochrones from simulations in domain type 1 with debris-band width 10 m, debris concentration
In Figure 2A, the debris sources are relatively close together (
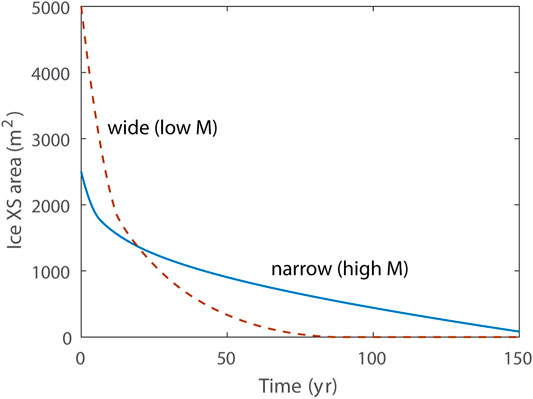
FIGURE 3. De-icing histories for the two simulations shown in Figure 2. The quantity of ice remaining is represented by the cross-sectional area of ice, since ablation rate and ice lowering are non-uniform across the domain. Solid blue line corresponds to de-icing from Figure 2A, and dashed red line to Figure 2B.
As noted in Anderson (2000), the flanks of growing medial moraine ridges quickly evolve to a nearly constant slope just sufficient to deliver downslope the debris produced by ablation at the debris band, beneath the moraine crest. Steady moraine slopes ranged from 0.35 to 0.6 (approximately 20°–30°) for high to low-mobility cases, respectively. Simulations reported here are consistent with the importance of debris supply rate (ablation rate or debris concentration) and mobility in governing the steady-state moraine-flank slope. As supply rate increases or diffusivity decreases, the slope steepens. The effect of steepening moraine-flank slopes is similar to that of increasing moraine spacing, leading to narrower moraine ridges that permit debris-free de-icing to proceed longer.
Results of several simulations with domain type 1 suggest that the postglacial moraine relief, quantified as the interquartile range of debris thickness normalized to mean debris thickness (IQRnorm), is small in most cases. This is consistent with field observations that indicate poor preservation potential for linear englacial or supraglacial features like medial moraines (Evans, 2009). Even so, the results shown here indicate that relief is greatest in settings with intermediate mobility index
The position of single, sustained englacial debris sources fixes the location of topographic highs, and consequently also the intervening lows where debris collects. However, when multiple bands interact, as illustrated in the three-band simulation in Figure 4 (with bands at 100, 200, and 300 m), greater debris accumulation in topographic lows receiving debris from multiple bands suppresses ice lowering there, flattening those areas in order to shed debris to remaining topographic lows. While each band initially produces a distinct moraine ridge (like the isochron highlighted in blue), the eventual merging of ridges and suppression of melt between them leads to a convex glacier cross-section (highlighted in red). The glacier surface becomes peaked at the middle band position and steepens beyond the adjacent bands in order to deliver their added debris flux toward the lateral margins.
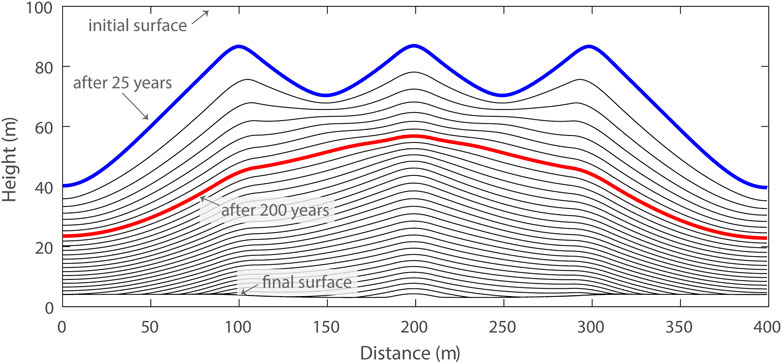
FIGURE 4. Glacier surface isochrones at 25 years intervals from a 400-m wide, 100-m thick type 1 domain simulation with three debris bands centered at 100, 200, and 300 m distance. Band width was 10 m in each case. All other parameters were the same as the simulation shown in Figure 2. Blue and red isochrones highlight the differences between early surface evolution (blue) when each debris band has a prominent, separate medial moraine ridge, and later (red) when moraine ridges have merged and the ice surface has organized to shed debris to the lateral ice margins.
Interesting patterns emerge in simulations in domain type 2 as well. Here, instead of a sustained englacial debris source, all debris in the system is prescribed as a non-uniform supraglacial debris blanket in the initial conditions, akin to a rockfall or landslide deposit. Figure 5 compares two simulations with the same initial conditions (debris thickness 1.1 m on the right half, 0.1 m on the left half) but different parameter values manifesting as different degrees of debris mobility. In the high-mobility case of panel (A), differential melt initially lowers the surface on the left-hand side of the domain where thin debris suppresses ablation less. Highly mobile debris quickly descends the resulting surface slope from right to left, accumulating on the left and suppressing ablation there. The slope reverses twice more before de-icing is complete, at which time debris is nearly uniformly distributed across the domain (IQRnorm = 0.18). In Figure 5 panel (B), debris mobility is lower and greater relief (and a steeper slope) develops before significant transport takes place. Transport is sufficiently slow in this case that the left side of the domain is almost completely ice-free before significant debris accumulation occurs there. Subsequent debris transport accumulates much of the debris to the left side of the domain, where it remains as a higher-relief (IQRnorm = 1.19) postglacial mound following a single episode of topographic inversion.
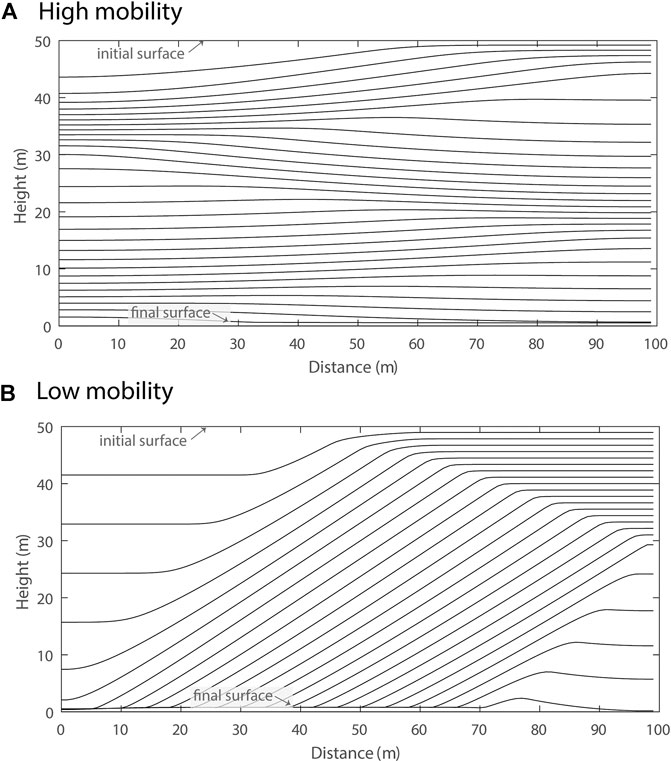
FIGURE 5. Glacier surface isochrones (5 years interval) from simulations in domain type 2 with debris blanket ranging from 0.1 m thick on the left side to 1.1 m on the right. The simulations are classified as low- and high-mobility based on differences in debris transport parameter
Figure 6 illustrates the effects of debris mobility on the ablation history for the simulation in Figure 5B. The heavy blue line shows the loss of ice cross-sectional area (or volume per unit distance normal to the study plane) as a function of simulation time. Also shown is the steady melt predicted for the same amount of debris cover if it were static and distributed uniformly over the ice surface (black dash-dot pattern line). Finally, the dashed red line shows the expected melt history if the debris was arranged according to the initial conditions of Figure 5B but was unable to move laterally within the domain. The simulated duration of deicing is significantly shorter for mobile debris than for either of the other immobile-debris cases. Although the initial simulated area loss rate for mobile debris is intermediate between the immobile end-member cases, the mobile debris shedding from areas that experience periods of melt suppression ensures that ice throughout the domain is subject to periods of reduced melt suppression under thinned debris.
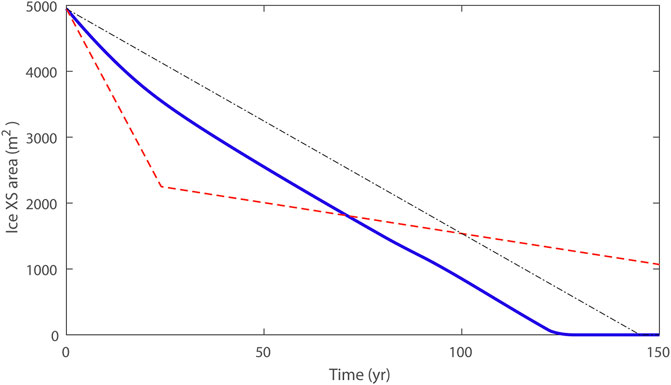
FIGURE 6. De-icing history for the domain type 2 simulation shown in Figure 5B (blue) compared with immobile debris of the same initial thickness distribution (red dashed) and uniform thickness
The effect of debris mobility on total de-icing time and postglacial moraine relief in ten domain type 2 simulations is shown in Figure 7. De-icing time (the time required to ablate all ice from the model domain) is normalized to the time required to remove all ice under a static, uniform debris layer of thickness
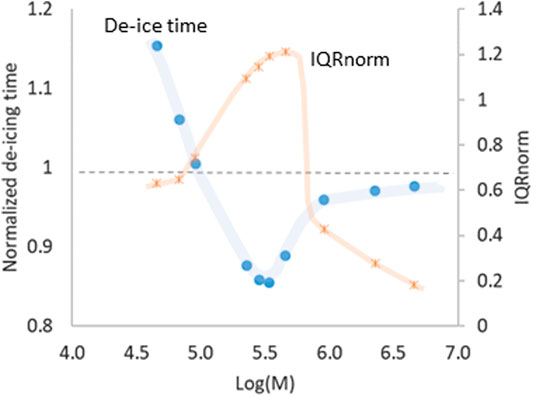
FIGURE 7. De-icing time and postglacial moraine relief as a function of debris mobility for ten simulations in type two domains spanning two orders of magnitude in
Postglacial moraine relief is also affected by debris mobility (orange symbols in Figure 7). Much like the effective de-icing rate, postglacial relief is greatest for debris of intermediate mobility. Highly-mobile debris tends to become distributed more evenly across the model domain, leading to smaller differences in debris thickness. Low-mobility (but still mobile) debris doesn’t homogenize like highly-mobile debris, but produces somewhat lower relief. However, it should be noted that immobile non-uniform debris with the same initial distribution as in Figure 5 would retain an IQRnorm of 1.65, suggesting a more complex pattern of relief generation for vanishing mobility.
The model explored here greatly simplifies the physics of coupled melt and debris transport, and omits many phenomena known to be important in real debris-covered glacier settings. Even so, the simulations highlight relationships that likely contribute in real settings to ablation rates and debris accumulation patterns. A key objective was to examine the effects of debris mobility on relief and debris accumulation patterns on downwasting ice. Simulation types representing debris release from englacial debris bands and supraglacial debris deposits allowed examination of ablation-debris transport feedbacks in two end-member scenarios common to today’s debris-covered valley glaciers.
Results of simulations in type 1 domains are broadly consistent with observations of medial moraine emergence from englacial debris concentrations. Medial moraine ridges grow in relief and width as melt releases englacial debris that subsequently suppresses melt in the underlying ice. The relief thereby created promotes downslope movement of debris down the broadening medial moraine slopes by mechanisms that remain poorly understood, but that may include topple-walk mechanisms in thin debris covers. Indeed, sustaining expansion of medial moraine ridges requires a mechanism for slow transport of debris down slopes that are usually too gentle to produce rapid mass-wasting. The required transport rate should be governed by the rate of debris supply from upslope debris melt-out. While these phenomena remain poorly documented in real field settings, (Fyffe et al., 2020) described melt-season expansion of debris-covered moraine slopes over adjacent dirty ice areas where the debris wasn’t evacuated by supraglacial streams.
Model results indicate that debris mobility, characterized here by
Domain type 2 simulations allowed additional exploration of the influence of initial conditions and debris mobility parameters on supraglacial relief and de-icing rate. High-mobility debris rapidly responds to relief production by differential melt, maintaining relatively small surface slopes, and low relief. The ice surface in these cases evolves through several reversals of topography and results in debris thickness distributions that approach uniform. Lower-mobility debris reduces the number of topographic reversals until only one reversal occurs, manifesting as complete topographic inversion.
An optimal geometry for rapid de-icing appears to exist for these simulations as well, and it may coincide with the conditions that produce a single complete topographic inversion. This arises when the debris mobility is just sufficient to allow nearly complete de-icing under thin debris before the wave of downslope-transported debris thickens debris and suppresses melt there. Not only is postglacial moraine relief greatest under these conditions, but de-icing rate is as much as 15% faster than it would be if the debris thickness was uniform. This relative acceleration of melt is presumably due to the redistribution of melt-suppressing debris to areas where ice has already been removed, as well as the nonlinearity of the sub-debris ablation function.
The extent to which debris mobility modifies time-integrated de-icing rates is likely underestimated in the present model for at least two reasons. First, retaining finite debris thicknesses is important for numerical stability in the model formulation used here. Therefore, debris thickness in the model remained at least 15–20 cm even on steeply-dipping slopes once they were covered with debris. In reality, areas of thinner debris (and therefore higher ablation rate) are under-represented in the model. A second reason to expect greater impacts from mobile debris than shown here is the neglect of the thin-debris enhancement of ablation that is sometimes documented. Since the sub-debris melt model employed here omits any such enhancement, allowance for this melt-enhancement effect when debris is thin would further elevate ablation rates on slopes steep enough to shed debris.
Another key element missing from the simulations presented here and in other published model studies is the removal of debris from the supraglacial setting by meltwater. Many recent observations highlight the importance of meltwater in maintaining high relief and steep slopes on debris-covered glaciers (e.g., Fyffe et al., 2020; Mölg et al., 2020). If meltwater removes mobile debris from the base of a debris-covered slope, accumulation and melt-suppression are inhibited there and the existing relief can be maintained or enhanced. This stands in contrast, however, to the phenomenon of topographic inversion, which is also widely documented in debris-covered glacier settings. Thus, further research is required to explore the conditions under which meltwater streams can allow topographic relief to persist on debris-covered glaciers, and where it may be unable to prevent topographic inversion.
Because the model simulations described here were idealized one-dimensional experiments, the results don’t readily compare with particular field settings. Surface topography on debris-covered glaciers and ice-free supraglacial landsystems is very much two- (or three-) dimensional, and a more sophisticated 2D model would be required to generate meaningful comparisons. Even so, some of the patterns observed here can help to inform interpretations of process-landform relationships. The length-scales used in the domain set-up (∼102 m) are generally consistent with those observed in topographic features of modern debris-covered valley glaciers (Bartlett et al., 2020), and for simulations that produced significant postglacial relief, moraine ridges are similarly spaced. This spacing is also consistent with some observed hummocky moraine tracts (albeit in only one dimension) (Johnson and Clayton, 2005), and is inherited from the prescribed spacing of debris source non-uniformity. Even so, simulations with high mobility or extremely-low mobility yielded very little postglacial topographic relief, which is consistent with past studies of controlled moraines (Evans, 2009). Thus, an interesting consequence is that supraglacial debris re-distribution can both create and destroy relief in de-glacial and postglacial settings, depending upon mobility.
Debris mobility on debris-covered glaciers can take the form of rapid mass movements, fluid-assisted flows, or slow creep. This movement is not only essential for genesis of key landforms in the so-called supraglacial landsystem (Johnson and Clayton, 2005), but affects the magnitude and spatial distribution of ablation. The model simulations presented here examine relationships between measures of debris mobility, sub-debris ablation and the spatial distribution and redistribution of debris during and following de-icing. Among the key findings are that debris mobility can hasten ice mass loss compared to immobile debris, and that an optimum mobility exists where de-icing rate is greatest and postglacial moraine relief is high. This optimal mobility is related to the initial distribution of debris sources and the ice thickness to be melted. These results have implications for the practice of projecting mass balance in areas of debris cover, where predictions of mass loss often assume static debris or debris with minimal spatial variation in thickness. The results also inform interpretations of process-form relationships in supraglacial landsystems. Greater insights will, however, require a better understanding of the processes of slow downslope debris transport in supraglacial settings and the variables that govern them.
The original contributions presented in the study are included in the article/Supplementary Material, further inquiries can be directed to the corresponding author.
PM is responsible for all aspects of this paper.
This study was funded by the U.S. National Science Foundation under grant EAR-1225880.
The authors declares that the research was conducted in the absence of any commercial or financial relationships that could be construed as a potential conflict of interest.
All claims expressed in this article are solely those of the authors and do not necessarily represent those of their affiliated organizations, or those of the publisher, the editors and the reviewers. Any product that may be evaluated in this article, or claim that may be made by its manufacturer, is not guaranteed or endorsed by the publisher.
The author gratefully acknowledges the editor and two reviewers for their suggestions, which improved the clarity of this manuscript.
The Supplementary Material for this article can be found online at: https://www.frontiersin.org/articles/10.3389/feart.2021.710131/full#supplementary-material
Anderson, L. S., and Anderson, R. S. (2016). Modeling Debris-Covered Glaciers: Response to Steady Debris Deposition. The Cryosphere 10, 1105–1124. doi:10.5194/tc-10-1105-2016
Anderson, R. S. (2000). A Model of Ablation-Dominated Medial Moraines and the Generation of Debris-Mantled Glacier Snouts. J. Glaciol. 46, 459–469. doi:10.3189/172756500781833025
Anderson, R. S., Anderson, L. S., Armstrong, W. H., Rossi, M. W., and Crump, S. E. (2018). Glaciation of alpine Valleys: The Glacier - Debris-Covered Glacier - Rock Glacier Continuum. Geomorphology 311, 127–142. doi:10.1016/j.geomorph.2018.03.015
Andersson, G. (2008). Genesis of Hummocky Moraine in the Bolmen Area, Southwestern Sweden. Boreas 27, 55–67. doi:10.1111/j.1502-3885.1998.tb00867.x
Attig, J. W., Mickelson, D. M., and Clayton, L. (1989). Late Wisconsin Landform Distribution and Glacier-Bed Conditions in Wisconsin. Sediment. Geology. 62, 399–405. doi:10.1016/0037-0738(89)90128-0
Banerjee, A. (2017). Brief Communication: Thinning of Debris-Covered and Debris-free Glaciers in a Warming Climate. The Cryosphere 11, 133–138. doi:10.5194/tc-11-133-2017
Bartlett, O. T., Ng, F. S. L., and Rowan, A. V. (2020). Morphology and Evolution of Supraglacial Hummocks on Debris-Covered Himalayan Glaciers. Earth Surf. Process. Landforms 46, 525–539. doi:10.1002/esp.5043
Benn, D. I., Thompson, S., Gulley, J., Mertes, J., Luckman, A., and Nicholson, L. (2017). Structure and Evolution of the Drainage System of a Himalayan Debris-Covered Glacier, and its Relationship with Patterns of Mass Loss. The Cryosphere 11, 2247–2264. doi:10.5194/tc-11-2247-2017
Boulton, G. S., and Paul, M. A. (1976). The Influence of Genetic Processes on Some Geotechnical Properties of Glacial Tills. Q. J. Eng. Geology. Hydrogeology 9, 159–194. doi:10.1144/GSL.QJEG.1976.009.03.03
Boulton, G. S. (1967). The Development of a Complex Supraglacial Moraine at the Margin of Sørbreen, Ny Friesland, Vestspitsbergen. J. Glaciol. 6, 717–735. doi:10.3189/s0022143000019961
Clayton, L., Attig, J. W., Ham, N. R., Johnson, M. D., Jennings, C. E., and Syverson, K. M. (2008). Ice-walled-lake plains: Implications for the Origin of Hummocky Glacial Topography in Middle North America. Geomorphology 97, 237–248. doi:10.1016/j.geomorph.2007.02.045
Clayton, L. (1964). Karst Topography on Stagnant Glaciers. J. Glaciol. 5, 107–112. doi:10.3189/s0022143000028628
Dietrich, W., Bellugi, D., and Sklar, L. (2003). Geomorphic Transport Laws for Predicting Landscape Form and Dynamics. Geophysical 135, 1–30. doi:10.1029/135GM09
Driscoll, F. G. (1980). Formation of the Neoglacial Surge Moraines of the Klutlan Glacier, Yukon Territory, Canada. Quat. Res. 14, 19–30. doi:10.1016/0033-5894(80)90004-6
Evans, D. J. A. (2009). Controlled Moraines: Origins, Characteristics and Palaeoglaciological Implications. Quat. Sci. Rev. 28, 183–208. doi:10.1016/j.quascirev.2008.10.024
Eyles, N. (1979). Facies of Supraglacial Sedimentation on Icelandic and Alpine Temperate Glaciers. Can. J. Earth Sci. 16, 1341–1361. doi:10.1139/e79-121
Fowler, A. C., and Mayer, C. (2017). The Formation of Ice Sails. Geophys. Astrophysical Fluid Dyn. 111, 411–428. doi:10.1080/03091929.2017.1370092
Fryxell, F. (1933). The Migration of Superglacial Boulders. J. Geology. 41, 737–747. doi:10.1086/624093
Furbish, D. J., Haff, P. K., Dietrich, W. E., and Heimsath, A. M. (2009). Statistical Description of Slope-dependent Soil Transport and the Diffusion-like Coefficient. J. Geophys. Res. 114, F00A05. doi:10.1029/2009JF001267
Fyffe, C. L., Woodget, A. S., Kirkbride, M. P., Deline, P., Westoby, M. J., and Brock, B. W. (2020). Processes at the Margins of Supraglacial Debris Cover: Quantifying Dirty Ice Ablation and Debris Redistribution. Earth Surf. Process. Landforms 45, 2272–2290. doi:10.1002/esp.4879
Gravenor, C. P. (1955). The Origin and Significance of Prairie mounds [alberta]. Am. J. Sci. 253, 475–481. doi:10.2475/ajs.253.8.475
Ham, N. R., and Attig, J. W. (2001). Minor End Moraines of the Wisconsin Valley Lobe, north-central Wisconsin, USA. Boreas 30, 31–41. doi:10.1080/030094801300062266
Hambrey, M. J., Huddart, D., Bennett, M. R., and Glasser, N. F. (1997). Genesis of 'hummocky Moraines' by Thrusting in Glacier Ice: Evidence from Svalbard and Britain. J. Geol. Soc. 154, 623–632. doi:10.1144/gsjgs.154.4.0623
Hambrey, M. J. (1984). Sedimentary Processes and Buried Ice Phenomena in the Pro-glacial Areas of Spitsbergen Glaciers. J. Glaciol 30.
Heimsath, A. M., Chappell, J., Spooner, N. a., and Questiaux, D. G. (2002). Creeping Soil. Geol. 30, 111. doi:10.1130/0091-7613(2002)030<0111:cs>2.0.co;2
Herreid, S., and Pellicciotti, F. (2020). The State of Rock Debris Covering Earth's Glaciers. Nat. Geosci. 13, 621–627. doi:10.1038/s41561-020-0615-0
Houssais, M., Maldarelli, C., and Morris, J. F. (2021). Athermal Sediment Creep Triggered by Porous Flow. Phys. Rev. Fluids 6, L012301. doi:10.1103/PhysRevFluids.6.L012301
Johnson, M. D., and Clayton, L. (2005). “Supraglacial Landsystems in lowland Terrain,” in Glacial Landsystems. Editor D. J. A. Evans (Arnold), 228–258.
Johnson, M. D., Mickelson, D. M., Clayton, L., and Attig, J. W. (1995). Composition and Genesis of Glacial Hummocks, Western Wisconsin, USA. Boreas 24, 97–116. doi:10.1111/j.1502-3885.1995.tb00630.x
Kääb, A., Berthier, E., Nuth, C., Gardelle, J., and Arnaud, Y. (2012). Contrasting Patterns of Early Twenty-First-century Glacier Mass Change in the Himalayas. Nature 488, 495–498. doi:10.1038/nature11324
Krüger, J., Kjær, K. H., and Schomacker, A. (2010). “Dead-Ice Environments: A Landsystems Model for a Debris-Charged, Stagnant Lowland Glacier Margin, Kötlujökull,” in Developments in Quaternary Sciences. Editors A. Schomacker, J. Krüger, and K. H. Kjær (Elsevier), 105–126. doi:10.1016/S1571-0866(09)01307-4
Lawson, D. E. (1982). Mobilization, Movement and Deposition of Active Subaerial Sediment Flows, Matanuska Glacier, Alaska. J. Geology. 90, 279–300. doi:10.1086/628680
Lawson, D. E. (1979). Semdimentological Analysis of the Western Terminus Region of the Matanuska Glacier, Alaska (No. CRREL-79-9). Hanover, NH: Cold Regions Research and Engineering Lab.
Mölg, N., Ferguson, J., Bolch, T., and Vieli, A. (2020). On the Influence of Debris Cover on Glacier Morphology: How High-Relief Structures Evolve from Smooth Surfaces. Geomorphology 357, 107092. doi:10.1016/j.geomorph.2020.107092
Moore, P. L. (2018). Stability of Supraglacial Debris. Earth Surf. Process. Landforms 43, 285–297. doi:10.1002/esp.4244
Nakawo, M., and Young, G. J. (1981). Field Experiments to Determine the Effect of a Debris Layer on Ablation of Glacier Ice. Ann. Glaciol. 2, 85–91. doi:10.3189/172756481794352432
Nicholson, L., and Benn, D. I. (2006). Calculating Ice Melt beneath a Debris Layer Using Meteorological Data. J. Glaciol. 52, 463–470. doi:10.3189/172756506781828584
Nicholson, L. I., McCarthy, M., Pritchard, H., and Willis, I. (2018). Supraglacial Debris Thickness Variability: Impact on Ablation and Relation to Terrain Properties. Cryosph. Discuss. 12, 1–30. doi:10.5194/tc-2018-83
östrem, G. (1959). Ice Melting under a Thin Layer of Moraine, and the Existence of Ice Cores in Moraine Ridges. Geografiska Annaler 41, 228–230. doi:10.1080/20014422.1959.11907953
Paul, M. A., and Eyles, N. (1990). Constraints on the Preservation of Diamict Facies (Melt-out Tills) at the Margins of Stagnant Glaciers. Quat. Sci. Rev. 9, 51–69. doi:10.1016/0277-3791(90)90004-T
Pawlik, Ł., and Šamonil, P. (2018). Soil Creep: The Driving Factors, Evidence and Significance for Biogeomorphic and Pedogenic Domains and Systems - A Critical Literature Review. Earth-Science Rev. 178, 257–278. doi:10.1016/j.earscirev.2018.01.008
Perron, J. T. (2011). Numerical Methods for Nonlinear Hillslope Transport Laws. J. Geophys. Res. 116, 2021. doi:10.1029/2010JF001801
Reid, J. R. (1970). Geomorphology and Glacial Geology of the Martin River Glacier, Alaska. Arctic 23, 213–296. doi:10.14430/arctic3181
Roering, J. J., Kirchner, J. W., Sklar, L. S., and Dietrich, W. E. (2001). Hillslope Evolution by Nonlinear Creep and Landsliding: An Experimental Study. Geol. 29, 143–146. doi:10.1130/0091-7613(2001)029<0143:hebnca>2.0.co;2
Roering, J. J. (2004). Soil Creep and Convex-Upward Velocity Profiles: Theoretical and Experimental Investigation of Disturbance-Driven Sediment Transport on Hillslopes. Earth Surf. Process. Landforms 29, 1597–1612. doi:10.1002/esp.1112
Rowan, A. V., Egholm, D. L., Quincey, D. J., and Glasser, N. F. (2015). Modelling the Feedbacks between Mass Balance, Ice Flow and Debris Transport to Predict the Response to Climate Change of Debris-Covered Glaciers in the Himalaya. Earth Planet. Sci. Lett. 430, 427–438. doi:10.1016/j.epsl.2015.09.004
Rowan, A. V., Nicholson, L. I., Quincey, D. J., Gibson, M. J., Irvine-Fynn, T. D. L., Watson, C. S., et al. (2021). Seasonally Stable Temperature Gradients through Supraglacial Debris in the Everest Region of Nepal, Central Himalaya. J. Glaciol. 67, 170–181. doi:10.1017/jog.2020.100
Scherler, D., Wulf, H., and Gorelick, N. (2018). Global Assessment of Supraglacial Debris-Cover Extents. Geophys. Res. Lett. 45, 11798–11805. doi:10.1029/2018GL080158
Schomacker, A. (2008). What Controls Dead-Ice Melting under Different Climate Conditions? A Discussion. Earth-Science Rev. 90, 103–113. doi:10.1016/j.earscirev.2008.08.003
Sharp, R. P. (1949). Studies of Superglacial Debris on valley Glaciers. Am. J. Sci. 247, 289–315. doi:10.2475/ajs.247.5.289
Shulmeister, J., Davies, T. R., Evans, D. J. A., Hyatt, O. M., and Tovar, D. S. (2009). Catastrophic Landslides, Glacier Behaviour and Moraine Formation - A View from an Active Plate Margin. Quat. Sci. Rev. 28, 1085–1096. doi:10.1016/j.quascirev.2008.11.015
Tarr, R., and Martin, L. (1914). Alaskan Glacier Studies of the National Geographic Society in the Yakutat Bay, Prince William Sound and Lower Copper River Regions. Palala Press, 750.
Thompson, S., Benn, D. I., Mertes, J., and Luckman, A. (2016). Stagnation and Mass Loss on a Himalayan Debris-Covered Glacier: Processes, Patterns and Rates. J. Glaciol. 62, 467–485. doi:10.1017/jog.2016.37
Vacco, D. A., Alley, R. B., and Pollard, D. (2010). Glacial advance and Stagnation Caused by Rock Avalanches. Earth Planet. Sci. Lett. 294, 123–130. doi:10.1016/j.epsl.2010.03.019
Vincent, C., Wagnon, P., Shea, J., and Immerzeel, W. (2016). Reduced Melt on Debris-Covered Glaciers: Investigations from Changri Nup Glacier. Nepal.
Westoby, M. J., Rounce, D. R., Shaw, T. E., Fyffe, C. L., Moore, P. L., Stewart, R. L., et al. (2020). Geomorphological Evolution of a Debris-Covered Glacier Surface. Earth Surf. Process. Landforms 45, 3431–3448. doi:10.1002/esp.4973
Keywords: debris covered glacier, ablation, hummocky moraine, debris transport, hillslope diffusion
Citation: Moore PL (2021) Numerical Simulation of Supraglacial Debris Mobility: Implications for Ablation and Landform Genesis. Front. Earth Sci. 9:710131. doi: 10.3389/feart.2021.710131
Received: 15 May 2021; Accepted: 30 June 2021;
Published: 27 July 2021.
Edited by:
Koji Fujita, Nagoya University, JapanReviewed by:
Christoph Mayer, Bavarian Academy of Sciences and Humanities, GermanyCopyright © 2021 Moore. This is an open-access article distributed under the terms of the Creative Commons Attribution License (CC BY). The use, distribution or reproduction in other forums is permitted, provided the original author(s) and the copyright owner(s) are credited and that the original publication in this journal is cited, in accordance with accepted academic practice. No use, distribution or reproduction is permitted which does not comply with these terms
*Correspondence: Peter L. Moore, cG1vb3JlQGlhc3RhdGUuZWR1
Disclaimer: All claims expressed in this article are solely those of the authors and do not necessarily represent those of their affiliated organizations, or those of the publisher, the editors and the reviewers. Any product that may be evaluated in this article or claim that may be made by its manufacturer is not guaranteed or endorsed by the publisher.
Research integrity at Frontiers
Learn more about the work of our research integrity team to safeguard the quality of each article we publish.