 Guoan Yin
 Jing Luo
 Fujun Niu
 Minghao Liu
94% of researchers rate our articles as excellent or good
Learn more about the work of our research integrity team to safeguard the quality of each article we publish.
Find out more
ORIGINAL RESEARCH article
Front. Earth Sci., 19 July 2021
Sec. Cryospheric Sciences
Volume 9 - 2021 | https://doi.org/10.3389/feart.2021.708630
This article is part of the Research TopicEcological Impacts of Degrading PermafrostView all 19 articles
Although the thermal regime and degradation of permafrost on the Qinghai-Tibet Plateau (QTP) have been widely documented, little information exists regarding the island permafrost in the area. Ground temperatures were therefore measured for 8 years (2013–2020) at a permafrost island and at two contrasting sites in the Xidatan region to elucidate the permafrost in this area. Results indicate that the ground temperatures in the island permafrost were markedly higher than those at the same depth in the nearby marginal permafrost and the interior continuous permafrost. In addition, a distinct increasing trend was observed in the ground temperature of the island permafrost over the past 8 years, and warming was signficanty faster in the deep soil than in the topsoil, indicating a bottom–up degradation pattern in the island permafrost. Moreover, due to the persistent increase in the thickness of the active-layer and the decrease in the depth of permafrost table, the permafrost island abruptly disappeared in 2018, which may be attributed to the anomalously high air temperatures that occurred in 2016 and 2017. The results of this study may provide references for understanding of the thermal regime and degradation process of island permafrost on the QTP.
The global degradation of permafrost has been confirmed by field measurements of the ground tempertures (Biskaborn et al., 2019). This degradation is the result of persistent increases in air temperature, which are likely to continue in the future decades (Serreze et al., 2000; Chadburn et al., 2017; Peng et al., 2018). The permafrost on the Qinghai-Tibet Plateau (QTP) is particularly sensitive to climate change and has undergone noticeable warming over the past several decades (Cheng and Wu, 2007; Ran et al., 2018; Xu et al., 2017; Zhao et al., 2020). Marginal and island permafrost is generally characterized by high ground temperatures and shallow depths. Several studies have pointed out that these types of permafrost degrade more quickly than continuous or discontinuous permafrost (Liu and Chen, 2000; Wu et al., 2005; Jin et al., 2006). The distribution and changes associated with marginal and island permafrost are generally considered important; however, the presence and thermal regimes of permafrost are also strongly affected by local conditions, such as topography, vegetation, and hydrologic factors, which cannot easily be estimated or mapped by the traditional simulation models that are used in the interior permafrost regions of the QTP (Cheng, 1984; Zhao et al., 2007; Zou et al., 2016). Several studies focusing on the variation and thermal regimes of the marginal permafrost of the QTP have recently been conducted (Luo et al., 2018; Liu et al., 2020), but investigations characterizing the island permafrost are still limited. A comprehensive investigation of the thermal state of island permafrost is, therefore, essential for a full evaluation of the degradation and changes occurring in the permafrost on the QTP.
The Xidatan region is located within the northern limit of the continuous permafrost on the QTP. The first investigation of the permafrost distribution in this region was conducted via borehole drilling and geophysical methods in 1975, and two permafrost islands were found on the west side of the Xidatan basin during this survey (Nan et al., 2003). Using ground penetrating radar (GPR) and borehole validation, the second reported investigation of the permafrost distribution in this region was accomplished in September 2012 (Luo et al., 2018). The results of the second investigation revealed that one of the permafrost islands observed in 1975 had disappeared, whereas the other one was still present; however, the area of the island had significantly decreased over the last four decades. Although the above studies have demonstrated the marked degradation of the island permafrost on the QTP, the specific variation and degradation pattern of the island permafrost and the mechanism by which it responds to climate changes are still unknown. Long-term field observation data are, therefore, required to clarify these issues.
In 2012, ground temperature monitoring boreholes were set up in the island permafrost and two contrasting regions in Xidatan. Using air temperature observations and ground temperature measurements taken between 2013 and 2020, the variation process and the ground thermal regime of the island permafrost can be detailed. The primary goals of this study are to 1) characterize the thermal regime of the island permafrost in the Xidatan region, 2) evaluate the variation process of the island permafrost and examine the differences between marginal and continuous permafrost, and 3) clarify the pattern by which island permafrost degrades and provide information about its response to climate change.
The Xidatan region is a down-faulted valley that is located on the northern side of the Eastern Kunlun Mountains, approximately 120 km southwest of Golmud (Figure 1). Some major transport arteries such as the Qinghai-Tibet Highway (QTH) and the Qinghai-Tibet Railway pass through this valley. The elevation in this region ranges from 4,000 m in the east to 5,700 m in the west. Except for the surrounding mountainous, the topographic relief in the majority of this region is minimal, with slopes lower than 5° accounting for more than 90% of the area (Yue et al., 2013). Several glaciers that are distributed on the northern slope of Kunlun Mountain form glacial runoffs in the region. The spatial heterogeneity of the surface conditions in this region mainly include flood land, alluvial fans, and alpine steppe. The vegetation is mainly sparse alpine grassland with numerous bare areas. According to observations taken at the meteorological station in the study area, the annual accumulated precipitation has been relatively stable over the last 10 years, with an average of 393 mm (±45 mm standard deviation) (Liu et al., 2020). Xidatan region is the northern boundary of the permafrost for the QTP (Luo et al., 2018). Isolated permafrost exists in this region (Figure 1) and is undergoing degradation (Luo et al., 2018).

FIGURE1. Location of the study area and observation sites. The map of the permafrost distribution in Xidatan was revised from Luo et al. (2018).
Three 15 m-deep boreholes were drilled at site A (a permafrost island that is isolated from the continuous permafrost), site B (marginal to the continuous permafrost), and site C (within the interior of the continuous permafrost). Site A lies approximately 2 km from site C, and the relative difference in elavation at the two sites is almost 20 m. According to the borehole data, the soil in both site A and site B consists of fluvial sand that reaches a thickness of 10 m, which overlies sandy cobble that is 2–4 m thick. The soil profiles in site C are dominantly composed of sand, with some organic matter observed in the top 2.2 m, large amounts of ground ice between 2.2 and 7.0 m, clay from 7.0 to 9.0 m, and weathered mudstone below 9.0 m. Both site A and site B are covered by alpine grassland with a coverage of approxiamtely 40 and 20%, whereas site C is characterized by alpine meadow that covers more than 80% of the surface in this area.
A HOBO Pro v2 (U23-004) logger manufactured by the Onset Computer Corporation, Bourne, MA, United States was used to record the air temperature. The device was installed in a radiation shield near monitoring site C and mounted on a steel pipe at a height of 2.0 m. The logger is accurate to ±0.21°C from 0 to 50°C. Temperatures were recorded at 30 min intervals. The daily mean air temperatures were calculated by averaging the recordes in one day. To assess the changes of the summer and winter temperatures, the thawing degree days (TDDs/°C days, effective temperature sum of the daily temperatures above 0°C) and freezing degree days (FDDs/°C days, effective temperature sum of the daily temperatures below 0°C) were respectively calculated based on the daily temperatures (Frauenfeld et al., 2007).
Thermistor probes linked by cables were used to measure the ground temperature in each borehole, with data acquisition starting in November 2012. The thermistor probe was assembled by the State Key Laboratory of Frozen Soil Engineering, Chinese Academy of Sciences. Each thermistor cable consisted of 25 thermistor sensors at 0.5 m intervals from the surface to a depth of 10 m and at 1 m intervals from 10 to 15 m. A thermistor sensor was placed at a depth of 5 cm (where the impacts of weather and solar radiation can be removed) at each site to measure the ground surface temperature with an accuracy of ±0.05°C. A CR3000 data logger (Campbell Scientific, Edmonton, AB, Canada) with a solar panel capable of recharging a 12 V battery was used to acquire data at each site. Logging was carried out once every 4 h, and data was acquired from November 2012 to December 2020. In addition, the records were timely continuous. The daily, monthly, and mean annual ground temperatures were calculated based on this data.
The depth at which the annual maximum ground temperature drops to 0°C is considered the active layer thickness (ALT). Linear interpolation was used to calculate the depth corresponding to 0°C as the ground temperature was measured at a 0.5 m or 1.0 m intervals, and this depth is regarded as the ALT for the year in which the measurement was made. Similarly, because the ground temperature generally presents a linear trend with increasing depth in permafrost, a linear fitting method was used to determine the depth at which the annual mean temperature was close to 0°C, and this depth is identified as the base of the permafrost.
The depth of the zero annual amplitude (DZAA) is defined as the depth at which the seasonal amplitude of the ground temperature is almost zero. However, in most cases, the approximate DZAA is equivalent to the depth at which the seasonal amplitude is diminished to 0.1°C (Isaksen et al., 2007; Liu et al., 2020). In this study, the DZAA is determined as the depth at which the difference between the maximum and minimum annual ground temperature is less than 0.1°C.
According to the monitoring results from the HOBO device near site C, the mean annual air temperature at a height of 2 m varied from −3.58 to −2.61°C from 2013 to 2020, with a mean value of −3.26°C. The variations in the daily mean air temperature are presented in Figure 2A, with results indicating that there has been a slight increasing trend in the air temperature over the last eight years. In addition, based on the ground temperatures obtained via monitoring during the period 2013–2020, the calculated mean annual ground surface temperatures (at 0.05 m depth) were −1.85, −1.91, and −2.08°C at site A, site B, and site C, with results in a surface offset of 1.41, 1.35, and 1.08°C, respectively, for the three sites. Moreover, the calculated TDDs shown an increasing trend while the FDDs shown a decrasing trend during the period from 2013 to 2020 (Table 1), which futher demonstrated the gradual warming in the study area.
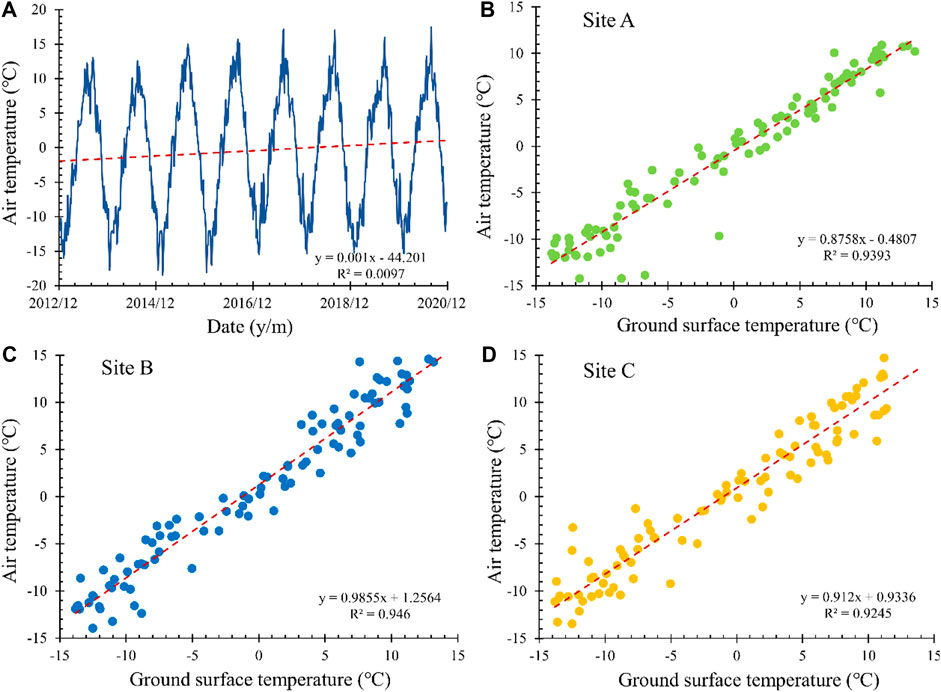
FIGURE 2. Daily mean air temperature at the study site (A), and mean monthly ground surface temperature (0.05 m depth) vs. mean monthly air temperature during the period from December 2012 to November 2020 at (B) Site A, (C) Site B, and (D) Site C. The linear regression coefficients and coefficient of determination (R2) are also shown in this figure.

TABLE 1. Thawing degree days (TDDs/°C days) and freezing degree days (FDDs/°C days in the study area from 2013 to 2020.
The relationship curves between the monthly ground surface temperature at a depth of 0.05 m and monthly air temperatures at a height of 2 m at each site are shown in Figures 2B–D. The results indicate a strong correlation between the ground surface temperature and the air temperature at all sites. The coefficients of determination (R2) at sites A, B, and C are 0.94, 0.95, and 0.92, respectively. Snow cover and ground surface conditions are the two main factors that can influence the thermal conduction between the air and surface. However, lower amounts of snowfall and strong winds can lead to an absence of snow or a short period of snow cover in the study area. Therefore, the differences in the correlation between these three sites may result from differences in the type of ground surface present. The higher correlation in site B can be explained by the fact that this site is nearly vegetation free with gravel of different grain sizes covering the surface. The lower correlation at site C may result from the existence of a significant boundary layer consisting of vegetation and organic material. The considerable vegetation cover and negligible amounts of organic matter in the ground surface layer at the permafrost island area (site A) may result in the moderate correlation observed at this site.
The variations in the annual mean ground temperatures observed within the active layer at depths of 1.0 and 2.0 m are shown in Figure 3. Although the air temperature was nearly the same at the three sites, the ground temperature in the active layer varied significantly, with the mean value in the island permafrost (site A) being markedly higher than that in the marginal permafrost (site B) and the interior continuous permafrost area (site C), which might be attributed to the difference in the ground surface conditions and the thermal regime of the underlying permafrost. The results in Figure 3 also indicate that, except for site C, the ground temperature at different depths of the active layer at site A and site B all appear to follow an increasing trend for the period 2013–2020. In addition, the annual variation in the trend of the ground temperature within the active layer at all three sites is significantly influenced by air temperature, and such influence appeared to decrease with depth.
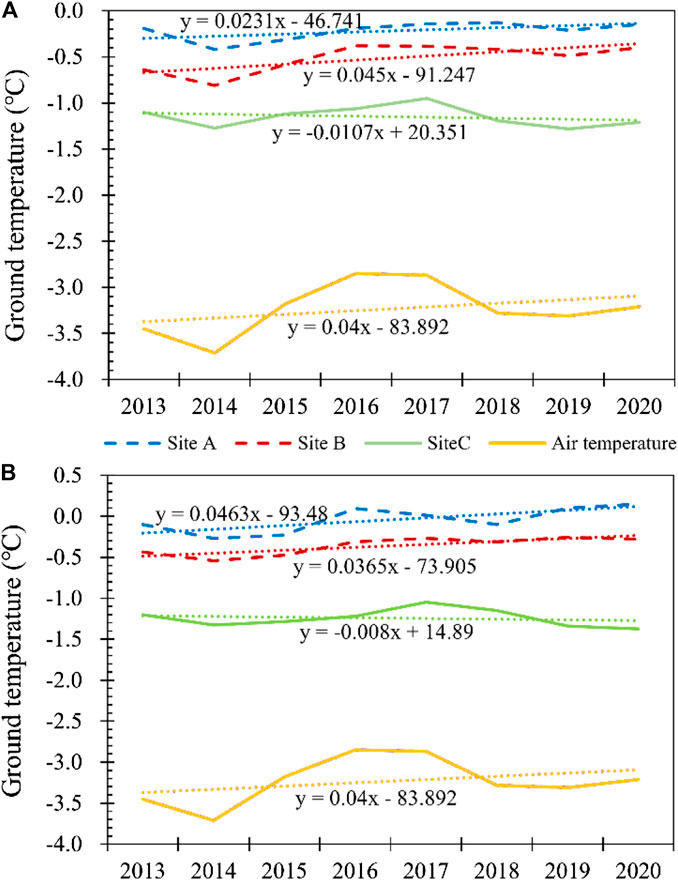
FIGURE 3. Annual mean ground temperatures in the active layer at the three sites from 2013 to 2020. (A) 1.0 m depth, and (B) 2.0 m depth. The annual mean air temperatures during the same period are also shown.
The variations in mean annual ground temperatures near the permafrost table and the DZAA are two important indicators that are usually used to estimate the degradation and the thermal state of permafrost. The monthly and annual mean ground temperatures at depths near the permafrost table (4.0 m at site A, 3.0 m at site B, and 2.5 m at site C) and the DZAA (11.0 m at site A, 13.0 m at site B, and 12 m at site C), based on the ground temperature at each site, are shown in Figure 4 and Table 2.
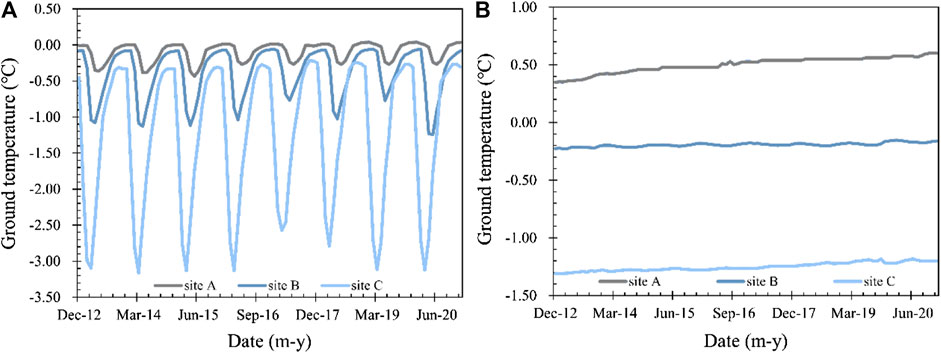
FIGURE 4. Variation in monthly mean ground temperatures near the permafrost table and the depth of zero annual amplitude. (A) Ground temperatures near the permafrost table (site A: 4.0 m, site B: 3.0 m, site C:2.5 m); (B) Ground temperatures at the depth of zero annual amplitude (site A: 11.0 m, site B: 13.0 m, site C:12 m).
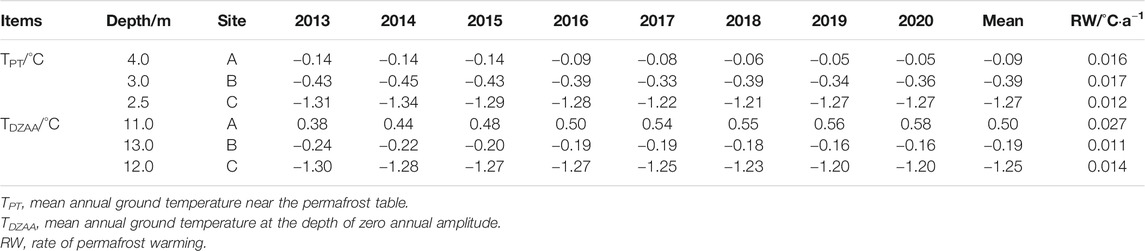
TABLE 2. Annual mean ground temperatures near the permafrost table (site A: 4.0 m, site B: 3.0 m, site C: 2.5 m) and the depth of zero annual amplitude (site A: 11.0 m, site B: 13.0 m, site C:12 m) from 2013 to 2020.
The mean annual ground temperature near the permafrost table is −0.09°C for the island permafrost (site A), which is obviously higher than that observed in the marginal permafrost (site B, −0.39°C) or the interior continuous permafrost (site C, −1.27°C) (Table 2). In addition, the soil near the permafrost table in site A warms at a faster rate than that at site C but at a slower rate than the soil at site B. The reason for the diversity in the warming rate among the three sites may be the low vegetation cover that accelerates the warming process at site B and the high ice content near the permafrost table that absorbs much of the heat produced when the permafrost thaws at site C. The results in Figure 4A indicate that the temperature of the permafrost lying near the permafrost table undergoes obvious seasonal fluctuations in response to changes in the air temperature. The fluctuations were less obvious at site A than at the other two sites, which can be attributed to the much deeper permafrost table. Moreover, the difference in the maximum temperature near the permafrost table at site A, as compared to the other two sites, varied within 0.5°C, whereas the difference in the minimum ground temperature was significantly higher (nearly 3.0°C). Therefore, the high ground temperature in the cold season resulted in the high mean annual ground temperature that was observed near the permafrost table at site A.
The DZAA at site A lies at a depth of approximately 11.0 m, which exceeds the depth of the permafrost base at this site, whereas the DZAA lies within the permafrost at sites B and C. Therefore, the mean annual ground temperature at the DZAA is positive at site A and is noticeably higher than that at sites B and C (Figure 4B, Table 2). Moreover, the long-term variation in the monthly mean ground temperatures in Figure 4 indicates that the soil warmed faster at site A than at the other two sites over eight years. The specific warming rate at site A is 0.027°C a−1, which is nearly twice the rate at sites B and C (Table 2).
A similar pattern is observed in the annual mean ground temperature profiles between 2013 and 2020 for all three sites (Figure 5). The annual mean ground temperature in the island permafrost (site A) showed an increasing trend in the top soil layers (0–2 m) in 2013, after which it decreased with depth between 2 m and 4 m. The annual mean ground temperature from 4 to 15 m in site A noticeably increased with depth. Such patterns in the ground temperature profile indicate a net input of heat from both the top and bottom soil layers and resulted in the degradation of the permafrost in the permafrost island. However, except for the top layer, the annual mean ground temperature at site A was obviously higher in 2020 than it was in 2013, especially the negative temperature at 3–8 m, which increased toward 0°C, accompanied by permafrost degradation, over the eight years.
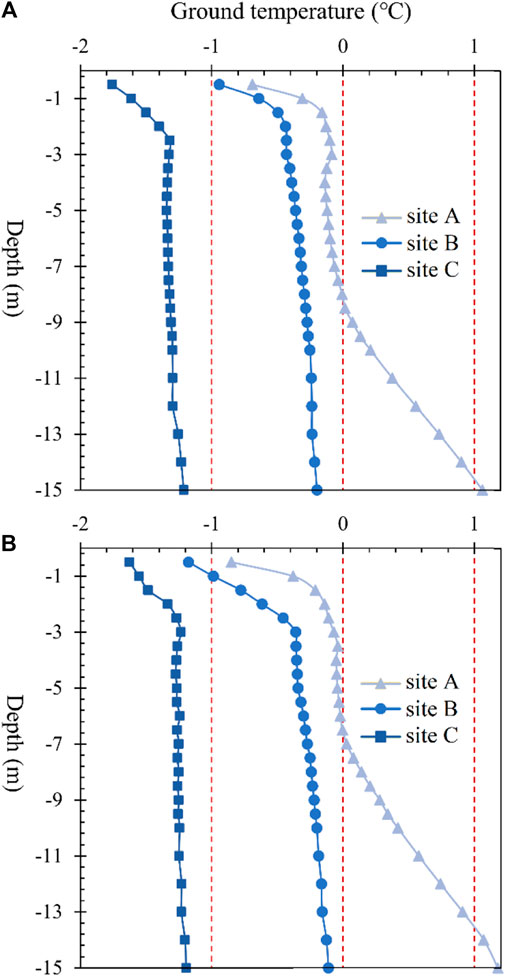
FIGURE 5. Annual mean ground temperature profiles for (A) 2013 at the three sites, and (B) 2020 at the three sites.
The annual mean ground temperatures at site B and site C in the two years 2013 and 2020 all show a markedly increasing trend with depth in the top soil layers (0–3 m) and remain constant or show a slight increase with depth from 3 to 15 m. The annual mean ground temperatures in the upper part of the soil profile were generally lower than those in the lower parts at these two sites, which is indicative of relatively stable permafrost. When comparing the annual mean ground temperature profiles between 2013 and 2020, the deep soil temperatures in site B and site C increased by 0.02–0.08°C from 2013 to 2020, which is significantly lower than the value observed at site A (0.1–0.2°C).
Ground temperature contour maps for depths between 0 and 15 m below the surface at the three sites are shown in Figure 6. The thermal regime of the soil layer in the island permafrost (Site A) has changed significantly over the eight year period (Figure 6A). Although the maximal depth of the 0°C isotherm near the permafrost table in the summer season remained almost unchanged from 2013 to 2017, the location of the 0°C isotherm near the base of the permafrost markedly increased during this period, resulting in the gradual reduction of the area, demonstrating negative ground temperatures. However, this negative ground temperature area disappeared in the warm seasons of 2018–2020, which was accompanied by the disappearance of the permafrost from Site A in the year 2018. In addition, the gradual rise of the 0.5°C isotherm indicated noticeable warming in the deep soil layers at site A, and the rate of warming somewhat increased after the permafrost layer disappeared in 2018. This may be a result of the heat in the warm season after 2018 being fully utilized to heat the deep soil layers rather than being consumed by the hydrothermal phase change associated with the thawing of permafrost.
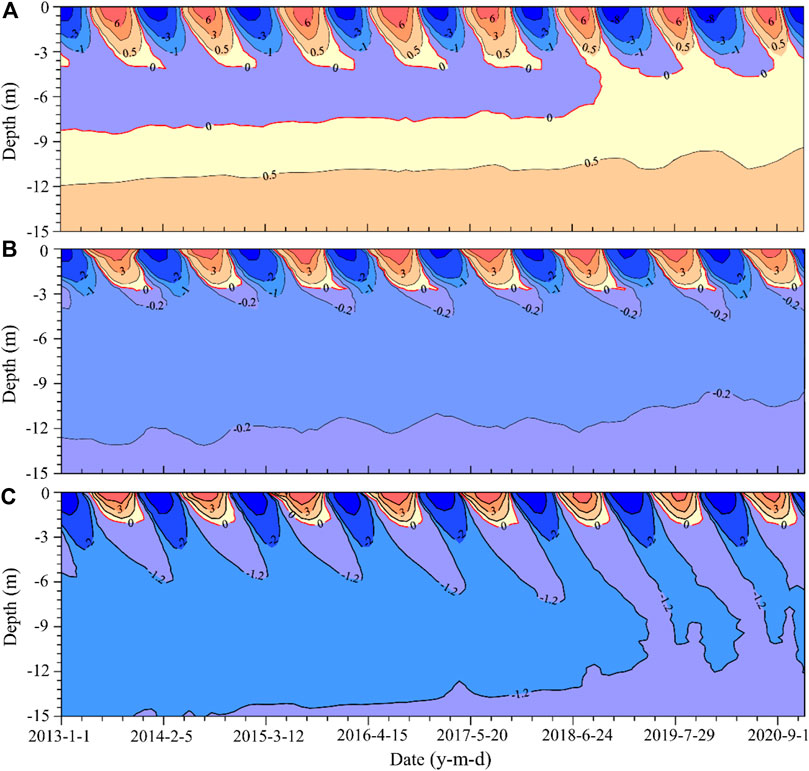
FIGURE 6. Ground temperatures (°C) as a function of time and depth in (A) island permafrost (site A), (B) marginal permafrost (site B), and (C) interior continuous permafrost (site C). Red isolines represent 0°C and the blue areas represent ground temperatures that are lower than 0°C with time and depth.
Permafrost warming also occurred in the marginal permafrost and the interior continuous permafrost during this period, as seen in the ground temperature contour maps in Figures 6B,C. The variation in the 0.2°C isotherm in the marginal permafrost (site B) indicates that the thermal regime of the permafrost at this site is the result of slight warming at the top of the permafrost and more noticeable warming in the deep permafrost. However, clear permafrost warming occurred at both the surface and at depth in the interior continuous permafrost permafrost at site C from 2013 to 2020, especially after 2018.
According to the results of ground temperature monitoring, the ground surface in the study area begins to thaw at the beginning of May and reaches the maximum thaw at the end of August. Therefore, the ALT in this study was determined by linear interpretation from the ground temperature at the end of August at each site. Table 3 shows the calculated ALT for the three sites from 2013 to 2020. The average ALT in the island permafrost (site A) is 4.26 m, which is significantly higher than the value observed in the marginal permafrost (2.95 m) and the interior continuous permafrost (2.38 m). Figure 7A indicates a measurable increasing trend over the last several years at the three sites. The rate of increase at site A is 3.5 cm a−1, which is slightly higher than that at site C and markedly lower than that at site B. In addition, the extremely high air temperature in 2016 meant that the maximum increase in ALT also occurred at all three sites in this year, with the specific increases in ALT from 2015 to 2016 reaching 10 cm at site A, 20 cm at site B, and 11 cm at site C.
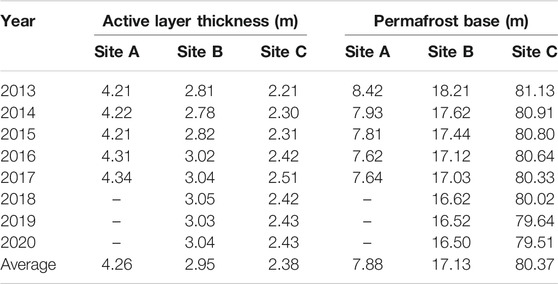
TABLE 3. Thickness of the active layer and the base of the permafrost at the three sites (Site A, Site B, and Site C) from 2013 to 2020. Due to the disappearance of permafrost at site A from 2018, neither the thiclness of the active layer or the depth of the permafrost base are available for the period 2018 to 2020 in the table.
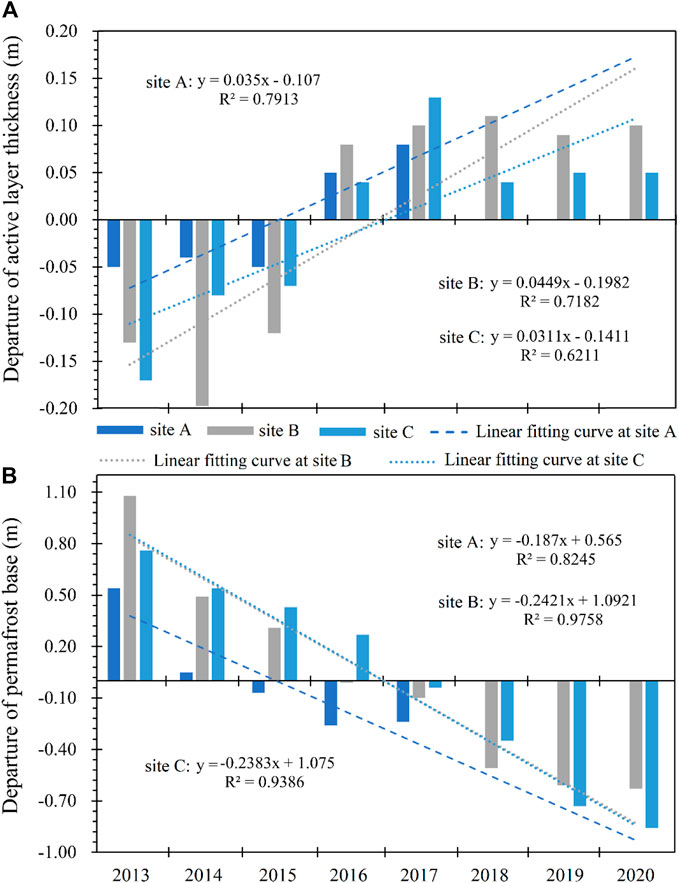
FIGURE 7. Changes in the thickness of the active layer (A) and the depth of the permafrost base (B) at the three sites (Site A, Site B, and Site C) from 2013 to 2020. The linear regression coefficients and coefficient of determination (R2) are shown in figure.
The variation in the depth of the permafrost base at the three sites over the period 2013 to 2017 or 2020 are shown in Table 2 and Figure 7B. The depth of the permafrost base ranged from 8.42 to 7.64 m with an average of 7.88 m in the island permafrost (site A), whereas the mean depths of the permafrost base at sites B and C were 17.13 and 80.37 m, which are considerably deeper than that observed at site A (Table 3). The variation in the depth of the permafrost base is shown in Figure 7B, and the results of this figure show a significant linear decreasing trend in the depth of the permafrost base at all three sites. The decreasing rate of permafrost base was 0.187 m at site A, which is less than that observed at sites B and C.
The above results indicate significant variation in the distribution of the permafrost and the thermal regime among the three sites (island permafrost, marginal permafrost, and the interior continuous permafrost). Possible reasons for these differences include differences in the elevation and the local conditions. Elevation is a key factor that determines the permafrost temperatures on the QTP, and the statistical results from 190 boreholes along the Qinghai-Tibet Highway/Railway revealed that the mean annual permafrost temperature at 15 m depth generally decrease by 0.57°C when elevation increases by 100 m (Wu et al., 2010). However, the maximum difference in the elevation of the island permafrost (site A) and the interior continuous permafrost (site C) is approximately 20 m. Such minor differences in altitude cannot explain the signficant differences observed in the ground temperature, 2.38°C at 15 m depth, and the permafrost depth of approximately 74 m between the two sites. Therefore, besides the influence of elevation, the local conditions could might be the main reason that explain the diversity in the permafrost thermal regime observed between the permafrost island and the other sites.
The results of the GPR profiles in the field investigation together with the borehole verification in 2012 indicate that the lowest elevation at which permafrost occurs is 4,369 m in the Xidatan region (Luo et al., 2018), whereas the elevation of site A (within the island permafrost) of approximately 4,490 m is significantly higher than the lowest permafrost limit in this region. Therefore, the permafrost island as well as the nearby seasonally frozen ground at site A should be susceptible to continuous permafrost if the local conditions do not change. The presence of rivers or running water will exert thermal degradation on the permafrost and may result in the permafrost thawing after a long period. According to our investigation, a seasonal river is located at the north side of site A, and a dried-up channel lies between site A and site B. In addition, the seasonal river has led to the formation of a vast area of banked floodplain in this region. Flooding of the floodplain is beneficial to the input of heat into permafroat (Brosten et al., 2009). Therefore, the thermal influence of the river and the fluvial affected surface conditions are key factors that may have contributed to the significant difference in the distribution of the permafrost and the thermal regime at the three sites. Meanwhile, warm water of the seasonal river can transport laterally or vertically heat into permafrost, leading to the warming and thawing of permafrost beneath and around the river (Zheng et al., 2019). The thermal impacts of groundwater flow on permafrost is often assumed to be negligible on the QTP. However, presence of groundwater flow may enhance permafrost degradation (Mckenzie and Voss, 2013), especially the lateral heat transfer to isolated permafrost bodies (McClymont et al., 2013; Kurylyk et al., 2016; Sjöberg et al., 2016).
Moreover, differences in the vegetation cover might also have significant effects on the permafrost thermal regime. Vegetation can prevent solar radiation from reaching the topsoil; thus, ground surfaces with high vegetation cover on the QTP are generally at lower temperatures than ground surface with sparse vegetation in summer (Jin et al., 2008). In addition, the existence of organic matter beneath the vegetation cover also reduces the thermal conductivity of shallow soil in summer, thereby reducing the amount of heat reaching the deep soil. However, vegetation becomes withered and organic matter is frozen in winter, which provides a channel for cold air to enter the lower soil layers. Therefore, the high coverage of alpine meadow and the layer of considerable organic material at site C might result in the low ground temperature observed in this region as compared to the other two sites. This is a result of the ground surface at both site A and site B being covered only by sparse alpine grassland with gravelly soil in the top layer.
According to the borehole data, the soil layers within the permafrost island are mainly dominated by fluvial deposits, and it can therefore be inferred that the permafrost island formed when the river erosion process weakened or the river courses altered. The permafrost island was discovered in 1972 and existed for more than 40 years until its disappearance in 2018. The surface conditions and hydrological process within and near the permafrost island area have not changed noticeably during the past few decades, especially in the last 10 years. Moreover, the seasonal river at the north side of the permafrost island moved northward by approximately 10 m from 2012 to 2020, according to field observations. Therefore, local conditions may not be the main reason for the degradation and ultimate disappearance of the permafrost island.
The annual mean air temperature and accumulated precipitation recorded at a national weather station (Wudaoliang station) near the Xidatan region is shown in Figure 8A, with results indicating that both the air temperature and the amount of precipitation in the area have noticeably increased over the past 40 years. Recent studies have demonstrated that the occurrence of a wet climate on the QTP can reduce the thermal responses of permafrost to warming, thereby preventing the degradation of permafrost, especially in arid and semiarid zones (Zhang et al., 2021), however, the extreme precipitation events in summer can have a thermal impact on permafrost (Zhu et al., 2017). Meanwhile, persistent climate warming is also the reason for the enhanced permafrost degradation in this region. The monitored air temperatures in Xidatan indicate that the years 2016 and 2017, immediately before the disappearance of the island permafrost, were both anomalously warm years with annual mean air temperatures that were significantly higher than the average over the period 2013 to 2020 (Figure 8B). Such anomalously high air temperatures may have accelerated the phase change in the island permafrost, resulting in the rapidly increasing soil temperature in 2018. Therefore, seasonal climatic changes and extreme events combinatively impact the permfrost thermal dynamics (Marmy et al., 2013).
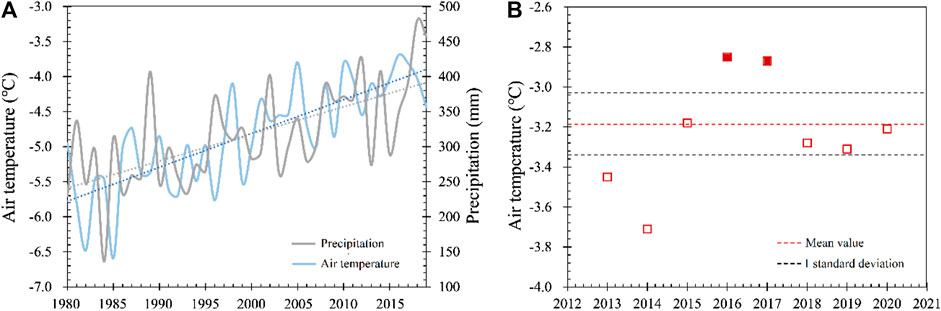
FIGURE 8. Changes in the local climatic conditions over time. (A) Annual mean air temperature and annual accumulated precipitation at Wudaoliang national weather station from 1980 to 2019; (B) Annual mean air temperature in the Xidatan region from 2013 to 2020.
The results in Figure 6 show that the deep soil in the island permafrost warmed more than the top soil, with a specific warming rate of 0.016°C a−1 at 4.0 m depth (near the permafrost table), whereas warming rate is 0.027°C a−1 at a depth of 11.0 m (the DZAA) (Table 1). However, a much smaller difference was observed in the warming rate between the shallow and deep soil in marginal permafrost and interior continuous permafrost than that observed in the island permafrost, especially in the interior continuous permafrost area, which warmed by only 0.002°C a−1. The above analysis indicates that warm island permafrost mainly degrades from bottom to top, which might be attributed to the existence of ground-ice in the top permafrost that obsorbs lots of heat when it melt and the lateral thermal impacts of the season river near the permafrost island.
In addition, when comparing the warming rate of shallow permafrost (6.0 m depth) in the island permafrost with the interior continuous permafrost on the QTP, the warming rate of the island permafrost (0.008°C a−1) is much smaller than that in the other regions of the QTP (Wu et al., 2012). Several studies have confirmed that an increase in the ground temperature of warm permafrost will induce phase change and that a considerable proportion of the heat produed is then absorbed by melting ground ice during this process, resulting in the lower warming rate in warm permafrost (Riseborough, 1990; Romanovsky et al., 2010; Sun et al., 2020). The lower warming rate of the shallow island permafrost can be explained by the above mechanism. Such phenomena have also been also widely reported in many other permafrost regions, such as Northern Europe, southern Siberia, the Mackenzie corridor, and the Tien Shan mountains (Marchenko et al., 2007; Christiansen et al., 2010; Romanovsky et al., 2010; Smith et al., 2010).
A case study of a permafrost island in the Xidatan region was conducted based on ground temperature measurement and air temperature observation to reveal variations in the thermal regime and the degradation process of island permafrost on the QTP with persistent climate warming. According to the results presented herein, the following conclusions can be drawn:
1) Field observation results from 2013 to 2020 indicated that both the ground temperature near the ground surface, within the active layer, near the permafrost table and the DZAA were notably higher in the island permafrost than that in the marginal permafrost and the interior continuous permafrost, which may be attributed to the difference in ground surface conditions and the thermal regime of the underlying permafrost.
2) The patterns of mean ground temperature profiles revealed that a net input of heat from both the top and bottom soil layers resulted in the degradation of the permafrost in the permafrost island. However, the annual mean ground temperatures in the upper permafrost were generally lower than that in the lower areas of marginal permafrost and the interior continuous permafrost, which is indicative of relatively stable permafrost.
3) The ALTs in the island permafrost showed a measurable increasing trend over the past few years, and the average ALT in the island permafrost is significantly higher than the value in the marginal permafrost and the interior continuous permafrost. However, the depth of the permafrost base in the island permafrost showed significant linear decreasing trends from 2013 to 2017, and is shallower than in the depths observed in the marginal permafrost and the interior continuous permafrost.
4) Long-term climate warming has contributed to the persistent degradation of the island permafrost, and the anomalously high air temperatures in 2016 and 2017 accelerated the phase change and resulted in the abrupt disappearance of the permafrost island. In addition, the degradation pattern of the island permafrost is characterized as bottom to top, and the warming rate in the deep soil was obviously higher than that in the topsoil.
The raw data supporting the conclusions of this article will be made available by the authors, without undue reservation.
JL designed the study. GY led the manuscript writing. FN and ZL contributed to data analysis. ML produced the figures.
This research was supported by the Second Tibetan Plateau Scientific Expedition and Research (STEP) program (Grant No. 2019QZKK0905), National Science Foundation of China (Grant Nos. 42071097 and 41801015), and the Youth Innovation Promotion Association of Chinese Academy of Sciences (2020421).
The authors declare that the research was conducted in the absence of any commercial or financial relationships that could be construed as a potential conflict of interest.
We thank the two reviewers for their valuable comments and suggestions that helped to improve the manuscript.
Biskaborn, B. K., Smith, S. L., Noetzli, J., Matthes, H., Vieira, G., Streletskiy, D. A., et al. (2019). Permafrost is Warming at a Global Scale. Nat. Commun. 10, 264. doi:10.1038/s41467-018-08240-4
Brosten, T. R., Bradford, J. H., McNamara, J. P., Gooseff, M. N., Zarnetske, J. P., Bowden, W. B., et al. (2009). Estimating 3D Variation in Active-Layer Thickness Beneath Arctic Streams Using Ground-Penetrating Radar. J. Hydrol. 373, 479–486. doi:10.1016/j.jhydrol.2009.05.011
Chadburn, S. E., Burke, E. J., Cox, P. M., Friedlingstein, P., Hugelius, G., and Westermann, S. (2017). An Observation-Based Constraint on Permafrost Loss as a Function of Global Warming. Nat. Clim Change. 7, 340–344. doi:10.1038/nclimate3262
Cheng, G. D. (1984). Problems on Zonation of High-Altitudinal Permafrost. Acta Geogr. Sin. 39, 185–193. (in Chinese). doi:10.11821/xb198402006
Cheng, G., and Wu, T. (2007). Responses of Permafrost to Climate Change and Their Environmental Significance, Qinghai-Tibet Plateau. J. Geophys. Res. 112, F02S03. doi:10.1029/2006JF000631
Christiansen, H. H., Etzelmüller, B., Isaksen, K., Juliussen, H., Farbrot, H., Humlum, O., et al. (2010). The Thermal State of Permafrost in the Nordic Area During the International Polar Year 2007-2009. Permafrost Periglac. Process 21, 156–181. doi:10.1002/ppp.687
Frauenfeld, O. W., Zhang, T., and Mccreight, J. L. (2007). Northern Hemisphere Freezing/Thawing Index Variations Over the Twentieth Century. Int. J. Climatol. 27, 47–63. doi:10.1002/joc.1372
Isaksen, K., Sollid, J. L., Holmlund, P., and Harris, C. (2007). Recent Warming of Mountain Permafrost in Svalbard and Scandinavia. J. Geophys. Res. 112, F02S04. doi:10.1029/2006JF000522
Jin, H., Sun, L., Wang, S., Ruixia, H., and Shaopeng, Y. (2008). Dual Influences of Local Environmental Variables on the Interior-Eastern Qinghai-Tibet Plateau (I). Vegetation and Snow Cover. J. Glaciol. Geocryol. 30, 535–545.
Jin, H., Zhao, L., Wang, S., and Jin, R. (2006). Thermal Regimes and Degradation Modes of Permafrost Along the Qinghai-Tibet Highway. Sci. China Ser. D. 49, 1170–1183. doi:10.1007/s11430-006-2003-z’
Kurylyk, B. L., Hayashi, M., Quinton, W. L., McKenzie, J. M., and Voss, C. I. (2016). Influence of Vertical and Lateral Heat Transfer on Permafrost Thaw, Peatland Landscape Transition, and Groundwater Flow. Water Resour. Res. 52, 1286–1305. doi:10.1002/2015WR018057
Liu, G., Xie, C., Zhao, L., Xiao, Y., Wu, T., Wang, W., et al. (2020). Permafrost Warming Near the Northern Limit of Permafrost on the Qinghai–Tibetan Plateau During the Period From 2005 to 2017: A Case Study in the Xidatan Area. Permafrost Periglacial Processes 2021, 1–12. doi:10.1002/ppp.2089
Liu, X., and Chen, B. (2000). Climatic Warming in the Tibetan Plateau During Recent Decades. Int. J. Climatol. 20, 1729–1742. doi:10.1002/1097-0088(20001130)20:14<1729::aid-joc556>3.0.co;2-y
Luo, J., Niu, F.-j., Lin, Z.-j., Liu, M.-h., and Yin, G.-a. (2018). Variations in the Northern Permafrost Boundary Over the Last Four Decades in the Xidatan Region, Qinghai-Tibet Plateau. J. Mt. Sci. 15, 765–778. doi:10.1007/s11629-017-4731-2
Marchenko, S. S., Gorbunov, A. P., and Romanovsky, V. E. (2007). Permafrost Warming in the Tien Shan Mountains, Central Asia. Glob. Planet. Change. 56, 311–327. doi:10.1016/j.gloplacha.2006.07.023
Marmy, A., Salzmann, N., Scherler, M., and Hauck, C. (2013). Permafrost Model Sensitivity to Seasonal Climatic Changes and Extreme Events in Mountainous Regions. Environ. Res. Lett. 8, 035048. doi:10.1088/1748-9326/8/3/035048
McClymont, A. F., Hayashi, M., Bentley, L. R., and Christensen, B. S. (2013). Geophysical Imaging and Thermal Modeling of Subsurface Morphology and Thaw Evolution of Discontinuous Permafrost. J. Geophys. Res. Earth Surf. 118, 1826–1837. doi:10.1002/jgrf.20114
Mckenzie, J. M., and Voss, C. I. (2013). Permafrost Thaw in a Nested Groundwater-Flow System. Hydrogeol J. 21, 299–316. doi:10.1007/s10040-012-0942-3
Nan, Z. T., Gao, Z. S., and Li, S. X. (2003). Permafrost Changes in the Northern Limit of Permafrost on the Qinghai-Tibet Plateau in the Last 30 Years. Acta Geogr. Sin. 58, 817–823. (in Chinese). doi:10.11821/xb200306003
Peng, X., Zhang, T., Frauenfeld, O. W., Wang, K., Luo, D., Cao, B., et al. (2018). Spatiotemporal Changes in Active Layer Thickness Under Contemporary and Projected Climate in the Northern Hemisphere. J. Clim. 31 (1), 251–266. doi:10.1175/JCLI-D-16-0721.1
Ran, Y., Li, X., and Cheng, G. (2018). Climate Warming over the Past Half century Has Led to Thermal Degradation of Permafrost on the Qinghai-Tibet Plateau. The Cryosphere. 12, 595–608. doi:10.5194/tc-12-595-2018
Riseborough, D. W. (1990). “Soil Latent Heat as a Filter of the Climate Signal in Permafrost,” in Proceedings of the Fifth Canadian Permafrost Conference (Quebec City, QC: Centre d'études nordiques. Nordicana) 54, 199–205.
Romanovsky, V. E., Drozdov, D. S., Oberman, N. G., Malkova, G. V., Kholodov, A. L., Marchenko, S. S., et al. (2010). Thermal State of Permafrost in Russia. Permafrost Periglac. Process. 21, 136–155. doi:10.1002/ppp.683
Serreze, M. C., Walsh, J. E., Chapin III, F. S., Osterkamp, T., Dyurgerov, M., Romanovsky, V., et al. (2000). Observational Evidence of Recent Change in the Northern High-Latitude Environment. Clim. Change. 46, 159–207. doi:10.1023/a:1005504031923
Sjöberg, Y., Coon, E., K. Sannel, A. B., Pannetier, R., Harp, D., Frampton, A., et al. (2016). Thermal Effects of Groundwater Flow through Subarctic Fens: A Case Study Based on Field Observations and Numerical Modeling. Water Resour. Res. 52, 1591–1606. doi:10.1002/2015WR017571
Smith, S. L., Romanovsky, V. E., Lewkowicz, A. G., Burn, C. R., Allard, M., Clow, G. D., et al. (2010). Thermal State of Permafrost in North America: a Contribution to the International Polar Year. Permafrost Periglac. Process. 21, 117–135. doi:10.1002/ppp.690
Sun, Z., Zhao, L., Hu, G., Qiao, Y., Du, E., Zou, D., et al. (2020). Modeling Permafrost Changes on the Qinghai-Tibetan Plateau From 1966 to 2100: A Case Study From Two Boreholes Along the Qinghai-Tibet Engineering Corridor. Permafrost and Periglac Process. 31, 156–171. doi:10.1002/ppp.2022
Wu, Q., Zhang, T., and Liu, Y. (2010). Permafrost Temperatures and Thickness on the Qinghai-Tibet Plateau. Glob. Planet. Change. 72 (1-2), 32–38. doi:10.1016/j.gloplacha.2010.03.001
Wu, Q., Zhang, T., and Liu, Y. (2012). Thermal State of the Active Layer and Permafrost along the Qinghai-Xizang (Tibet) Railway From 2006 to 2010. The Cryosphere. 6, 607–612. doi:10.5194/tc-6-607-2012
Wu, T., Li, S., Cheng, G., and Nan, Z. (2005). Using Ground-Penetrating Radar to Detect Permafrost Degradation in the Northern Limit of Permafrost on the Tibetan Plateau. Cold Regions Sci. Technology. 41, 211–219. doi:10.1016/j.coldregions.2004.10.006
Xu, X., Zhang, Z., and Wu, Q. (2017). Simulation of Permafrost Changes on the Qinghai-Tibet Plateau, China, Over the Past Three Decades. Int. J. Digital Earth. 10, 522–538. doi:10.1080/17538947.2016.1237571
Yue, G. Y., Zhao, L., Zhao, Y. H., Du, E. J., Wang, Q., Wang, Z. W., et al. (2013). Relationship between soil properties in permafrost active layer and surface vegetation in Xidatan on the Qinghai-Tibetan Plateau. J. Glaciol. Geocryol. 35 (3), 565–573.
Zhang, G., Nan, Z., Zhao, L., Liang, Y., and Cheng, G. (2021). Qinghai-Tibet Plateau Wetting Reduces Permafrost thermal Responses to Climate Warming. Earth Planet. Sci. Lett. 562 (1), 116858. doi:10.1016/j.epsl.2021.116858
Zhao, L., Zou, D., Hu, G., Du, E., Pang, Q., Xiao, Y., et al. (2020). Changing Climate and the Permafrost Environment on the Qinghai–Tibet (Xizang) Plateau. Permafrost Periglac. 31 (3), 396–450. doi:10.1002/ppp.2056
Zhao, S. M., Cheng, W. M., and Chai, H. X. (2007). Research on the Information Extraction Method of Periglacial Geomorphology on the Qinghai-Tibet Plateau Based on Remote Sensing and SRTM: A Case Study of 1:1,000,000 Lhasa Map Sheet H46. Gegraphical Res. 26, 1175–1185. (in Chinese). doi:10.11821/yj2007060012
Zheng, L., Overeem, I., Wang, K., and Clow, G. D. (2019). Changing Arctic River Dynamics Cause Localized Permafrost Thaw. J. Geophys. Res. Earth Surf. 124, 2324–2344. doi:10.1029/2019JF005060
Zhu, X., Wu, T., Li, R., Xie, C., Hu, G., Qin, Y., et al. (2017). Impacts of Summer Extreme Precipitation Events on the Hydrothermal Dynamics of the Active Layer in the Tanggula Permafrost Region on the Qinghai-Tibetan Plateau. J. Geophys. Res. Atmos. 122 (21), 549–611. doi:10.1002/2017JD026736
Keywords: frozen ground, active layer, ground temperature, climate change, permafrost degradation, permafrost warming
Citation: Yin G, Luo J, Niu F, Lin Z and Liu M (2021) Thermal Regime and Variations in the Island Permafrost Near the Northern Permafrost Boundary in Xidatan, Qinghai–Tibet Plateau. Front. Earth Sci. 9:708630. doi: 10.3389/feart.2021.708630
Received: 12 May 2021; Accepted: 23 June 2021;
Published: 19 July 2021.
Edited by:
Sizhong Yang, German Research Centre for Geosciences, Helmholtz Centre Potsdam, GermanyReviewed by:
Liming Jiang, State Key Laboratory of Geodesy and Earthʼs Dynamics, Institute of Geodesy and Geophysics (CAS), ChinaCopyright © 2021 Yin, Luo, Niu, Lin and Liu. This is an open-access article distributed under the terms of the Creative Commons Attribution License (CC BY). The use, distribution or reproduction in other forums is permitted, provided the original author(s) and the copyright owner(s) are credited and that the original publication in this journal is cited, in accordance with accepted academic practice. No use, distribution or reproduction is permitted which does not comply with these terms.
*Correspondence: Jing Luo, bHVvamluZ0BsemIuYWMuY24=
Disclaimer: All claims expressed in this article are solely those of the authors and do not necessarily represent those of their affiliated organizations, or those of the publisher, the editors and the reviewers. Any product that may be evaluated in this article or claim that may be made by its manufacturer is not guaranteed or endorsed by the publisher.
Research integrity at Frontiers
Learn more about the work of our research integrity team to safeguard the quality of each article we publish.