 Hongxiong Xu
 Yuqing Wang
- 1State Key Laboratory of Severe Weather, Chinese Academy of Meteorological Sciences, China Meteorological Administration, Beijing, China
- 2International Pacific Research Center and Department of Atmospheric Sciences, School of Ocean and Earth Science and Technology, University of Hawaii at Manoa, Honolulu, HI, United States
In view of the increasing interest in the explicit simulation of fine-scale features in the tropical cyclone (TC) boundary layer (TCBL), the effects of horizontal grid spacing on a 7–10 h simulation of an idealized TC are examined using the Weather Research and Forecast (ARW-WRF) mesoscale model with one-way moving nests and the nonlinear backscatter with anisotropy (NBA) sub-grid-scale (SGS) scheme. In general, reducing the horizontal grid spacing from 2 km to 500 m tends to produce a stronger TC with lower minimum sea level pressure (MSLP), stronger surface winds, and smaller TC inner core size. However, large eddies cannot be resolved at these grid spacings. In contrast, reducing the horizontal grid spacing from 500 to 166 m and further to 55 m leads to a decrease in TC intensity and an increase in the inner-core TC size. Moreover, although the 166-m grid spacing starts to resolve large eddies in terms of TCBL horizontal rolls and tornado-scale vortex, the use of the finest grid spacing of 55 m tends to produce shorter wavelengths in the turbulent motion and stronger multi-scale turbulence interaction. It is concluded that a grid spacing of sub-100-meters is desirable to produce more detailed and fine-scale structure of TCBL horizontal rolls and tornado-scale vortices, while the relatively coarse sub-kilometer grid spacing (e.g., 500 m) is more cost-effective and feasible for research that is not interested in the turbulence processes and for real-time operational TC forecasting in the near future.
Introduction
Tropical cyclones (TCs) are among the strongest atmospheric vortices in nature, which often bring about heavy rainfall and damaging winds on their paths (Chen and Meng, 2001; Chen et al., 2019), and induce storm surge and other natural disasters in coastal regions when they make landfall (Duan et al., 2020). The accurate forecast of TC track and intensity are important for preparedness for disaster prevention and reduction of damages potentially induced by a coming TC. How to improve the understanding and prediction skill of TC track and intensity has received great attention by both research and operational communities (Chen and Meng, 2001; Wang and Wu, 2004; Emanuel, 2018). Although the forecast of TC track has made remarkable progress in the last 3 decades or so, the research and forecast of TC intensity change are well behind and need to be improved. TC intensity change involves the interaction of multi-scale and nonlinear dynamical/physical processes that are often poorly resolved or parameterized by global and regional models (Wang et al., 2001; Wang and Wu, 2004; Bao et al., 2012; Xu et al., 2013; Bu et al., 2017). The TC planetary boundary layer (TCBL) turbulent processes belong to these crucial physical processes and can significantly influence the intensification and maintenance of a TC by turbulent surface flux and vertical mixing of heat, moisture and momentum (Hill and Lackmann, 2009; Gopalakrishnan et al., 2013; Zhang et al., 2017).
In the numerical model, TCBL turbulent processes are either parameterized, such as those in mesoscale regional and global models, or explicitly represented, such as in large eddy simulations (Zhu, 2008; Rotunno et al., 2009; Wu et al., 2018). These two approaches are different strategies and depend on the model resolution. In mesoscale simulations (>1 km), all turbulent processes are parameterized used the resolved parameters/processes. In LESs (<100 m), large turbulent motions are explicitly resolved, while the subgrid scale, smaller turbulent motions are still parameterized. In general, contributions by the resolved (parameterized) turbulence increase (decrease) with increasing model resolution (Bryan and Morrison, 2011).
Previous studies (Fierro et al., 2009; Gentry and Lackmann, 2010) showed that the simulated TC structure could be greatly affected by the grid spacing (>1 km) in mesoscale models. These studies demonstrated that higher resolution would produce narrower eyewalls, smaller radii of maximum wind speed, higher vertical wind speeds, and more symmetric structure of the eyewall with high-wavenumber asymmetries. They recommended that a grid spacing less than 2 km or 3 km can be used in research or operational forecast models in order to better represent physical processes of rainband and eyewall structures. Fierro et al. (2009) focused on the influence of grid spacing in the range of 1–5 km on TC simulations using the Weather Research and Forecasting (WRF) model with two-way nesting. Their results showed no systematic trend in TC intensity with change in model resolution. However, Gentry and Lackmann (2010) suggested that simulations with higher resolution could significantly reduce the minimum sea level pressure (MSLP) and increase the magnitude of the resolved vertical motion. Although a grid spacing about 1 km starts to partially resolve downdraft and updraft cores in the eyewall, mesoscale models are still unable to explicitly resolve the planetary boundary layer (PBL) turbulent processes (Smith et al., 2012), suggesting that more adequate treatment of turbulent processes is important to better represent the atmospheric state and the TC intensity and structure changes.
The development of computing power and advanced numerical technique have greatly contributed to the efforts of very high-resolution simulations to study the small-scale features in the TCBL. More studies on TCs (Zhu, 2008; Rotunno et al., 2009; Green and Zhang, 2015; Wu et al., 2018; Zhu et al., 2019; Zheng et al., 2020) have run models on sub-kilometer or even sub-100-meters resolutions, by which turbulence can be reasonably resolved. Rotunno et al. (2009) suggested that a model cannot resolve turbulence until reducing the grid spacing to sub-100-meters. The explicitly resolved turbulent mean TC intensity began to decrease with a sharp increase in gusts with sub-100-meters resolutions. Green and Zhang (2015) suggested that the turbulent structure of a TC can exist in hundreds meter simulations (111, 222, and 333 m) with LESs. They attributed this discrepancy to the use of the nonlinear backscatter with anisotropy (NBA) scheme in the newer version of the WRF model as documented by Mirocha et al. (2010). Furthermore, they also found that the scales of turbulent motion vary with model resolution. In TCs, tornado-scale vortices and boundary layer rolls are considered being important fine-scale features of TCBL. It is necessary for a numerical models to have sufficiently high model resolution and adequate parametrization of smaller scales to reasonably represent the two fine-scale features in TCBL (Zhu et al., 2019).
Frequently observed TCBL rolls, can lead to small-scale swath of damage, and are important small-scale features that can affect the turbulent transport/mixing in the TCBL (Wurman and Winslow, 1998; Wurman and Kosiba, 2018). Zhu (2008) configured a nested WRF-LES with the innermost grid spacing of 100 m to simulate the landfall of Hurricane Ivan (2004). They found that the boundary layer rolls play an important role in enhancing exchanges of momentum, heat, and moisture. The resolved turbulence resulted from the boundary layer rolls is considerably underestimated by the current commonly used PBL schemes. Both observations and numerical simulations show that the wavelength of the boundary layer rolls are affected by the TC size. Their wavelengths are only several hundred meters within the radius of maximum wind speed of a TC but can reach 1–2 km outside the eyewall (Foster, 2005; Morrison et al., 2005). Similarly, Gao and Ginis (2014) found that the wavelength and the growth rate of the boundary layer rolls are affected by the PBL height and the magnitude of the sustained wind shear, respectively. Tornado-scale vortices near the eyewall are another small-scale feature of TCBL. Observational analyses (Marks et al., 2008; Zhang et al., 2011a; Wurman and Kosiba, 2018) suggested the existence of tornado-scale vortices prevail in TCBL with maximum vertical vorticity maximum greater than 0.15 s−1 and diameters of 1–2 km. Wu et al. (2018); Wu et al. (2019) simulated tornado-scale vortices using the WRF-LES simulations with grid spacing of 37 m. They found that tornado-scale vortices have significant influences on extreme updrafts and surface wind gusts.
Although depending on the numerical precision of finite-differencing schemes, in general, the grid spacing can marginally resolve about 1/4 of the wavelength of a wave (Grasso, 2000), 1/7 of the wavelength reasonably well (Skamarock, 2004) to match the observed power spectrum, and 1/10 of the wavelength almost completely (Walters, 2000).
TCBL rolls, which have linear shaped coherent structures, are aligned nearly with the background flow direction with the scale ranges from 600 m to 2 km (Wurman and Winslow, 1998; Foster, 2005; Morrison et al., 2005), while tornado-scale vortices are vortices with the scale ranges from 1 to 2 km often embedded within the TC eyewall (Marks et al., 2008; Zhang et al., 2011a; Wurman and Kosiba, 2018). Note that tornado-scale vortices are one of the fine-scale features found near the inner edge of the TC eyewall, and their scales are much larger than tornados (∼200 m; Rotunno, 2013). Based on these criteria, the minimum grid spacing to resolve these two phenomena needs to reach at least 150–500 and 250–500 m, and to completely resolve these phenomena, the minimum grid spacing needs to reach 60–200 m and 100–200 m, respectively. Therefore, it seems that the grid spacing from 500 to 60 m is crucial to resolve the fine-scale structure of TCBL rolls and tornado-scale vortices. However, it is still infeasible to use a grid spacing of sub-hundred meters for either global and regional models for routinely operational forecasts. For example, the grid spacing of the current operational HWRF (Hurricane WRF) model at the National Centers for Environmental Prediction (NCEP) is 1.5 km. Nevertheless, the TC operational forecasting systems and research models at sub-kilometer or even sub-hundred meters will not be achievable soon. Therefore, a study on the influence of model grid spacing from sub-kilometer to sub-hundred meters on TC simulations/predictions can help guide future developments of operational TC forecasting models.
In this study, a high-resolution idealized simulation of a TC is conducted using the WRF-LES model with one-way nesting and a grid spacing varying from kilometers to sub-kilometer to sub-hundred-meters. The following questions will be addressed: 1) do the simulated fine-scale structures of boundary layer rolls and tornado-scale vortices strongly depend on the model grid spacing in the range of sub-kilometer and sub-hundred-meters? and 2) will TC intensity continue to increase and eyewall size of the simulated TC continue to decrease with the increasing model resolution (decreasing the grid spacing), or will a convergence occurs at a certain grid spacing? The rest of the paper is organized as follows. Model and Experimental Setup section briefly describe the model and experimental setup. The results are discussed in Results section. Our main conclusions are drawn in Discussion section.
Model and Experimental Setup
To investigate the effects of horizontal grid spacing on the simulated fine-scale TC structure and intensity, the Advanced Research Weather Research and Forecasting model (Skamarock et al., 2019) version 4.1.5 was used to simulate a TC with the grid spacing varying from kilometers through sub-kilometer to sub-100-meters. The six one-way moving (vortex-following) nested domains (d01–d06) had horizontal grid spacings of 6 km, 2 km, 500 m, 166 m and 55 m, and domain sizes of 311 × 325, 271 × 271, 211 × 211, 721 × 721, 1,501 × 1,501 and 1,501 × 1,501. The model atmosphere was discretized in the vertical with 72 vertical levels from the sea surface to 20 km. In addition to the model horizontal resolution, the vertical resolution in the numerical simulation is also suggested to play an important role in simulating TC intensities and inner-core structures (Zhang and Wang, 2003; Zhang et al., 2015). Despite the importance of vertical resolution, this study used 72 levels in the vertical for all grid spacings because of the limitation of our existing computing resources. To minimize the impact of vertical resolution on the simulated TCBL, we set 19 vertical levels below 1 km height to provide finer resolution in the PBL. This gives the ratio of horizontal and vertical grid spacing around 1.0 in the boundary layer for the finest horizontal grid spacing in this study. Nevertheless, the vertical grid spacing above the boundary layer is relatively larger than the finest horizontal grid spacing and could be reduced in future studies. Note that Rotunno et al. (2009) pointed out that the horizontal grid spacing of 67 m still cannot fully resolve the TCBL turbulence. This seems to suggest that the smallest grid spacing of 55 m used in this study may be still not fine enough to fully resolve the TCBL turbulence. However, it is near the limit of our existing computing resources. Therefore, the horizontal grid spacing of the innermost domain in our simulation will be limited to 55 m, which covers the inner core (in a radius of 41.25 km from the storm center) of the simulated TC.
The model was calculated with a constant sea surface temperature of 301 K on an f-plane at 20°N (with
The following schemes for model physics were used in our simulation. The revised MM5 Monin-Obukhov surface layer scheme, WSM6 microphysics scheme (Hong and Lim, 2006), the Dudhia shortwave radiation scheme (Dudhia, 1989) and the Rapid Radiative Transfer Model (RRTM) for longwave radiation (Mlawer et al., 1997) were selected for all six domains (d01–d06). The Kain–Fritsch cumulus parameterization scheme (Kain, 1993; Kain, 2004) was used only in d01 (18 km). The Yonsei University (YSU) PBL scheme (Hong and Pan, 1996) was applied to d01–d03 and while the large eddy simulation (LES) option was used in the three innermost domains (d04–d06) to allow explicit simulation of the most energetic turbulence at sub-kilometer and sub-100-mters grid spacings. In the LES domains, the sub-grid scale (SGS) turbulence was parameterized by the Nonlinear Backscatter and Anisotropy (NBA) sub-filter-scale (SFS) stress scheme (Mirocha et al., 2010) with diagnostic stress terms (sfs_opt = 1 in WRF namelist).
Results
In this section, we examine the impact of one-way nested domains with different grid spacings on the simulated TC under idealized conditions in terms of the intensity, inner-core size, and overall structure, and fine-scale features in TCBL. Note that since the similar sensitivity of the simulated TC to the grid spacing in the d01–d03 (18–2 km) domains was also conducted and discussed by Fierro et al. (2009) and Gentry and Lackmann (2010), we will focus mainly on the sensitivity of the simulated storm to the grid spacing in the d04–d06 (2 km–55 m) domains. For convenience of discussions, we refer to d03, d04, d05, and d06 domains as the 2-km, 500-m, 166-m, and 55-m domains, respectively.
Intensity and Overall Structure of the Simulated Storm
Figure 1 shows the time series of the TC intensity and inner-core size in terms of the minimum sea level pressure (MSLP), instantaneous 10-m maximum wind speed (Vmax) and the radius of 10-m maximum wind speed (Rmax) for the 10-hour simulation after the initial 24-h model integration/spinup. The TC intensity in the 500-m grid spacing is the lowest MSLP (959.4 hPa), followed by the 166-m (961.1 hPa) and 55-m (960.5 hPa) grid spacings by the end of the 10-h simulation (Figure 1A). The largest increment of TC intensity is between the 2-km and 500-m grid spacings, followed by the second increment from the 500-m to 166-m grid spacings. The simulated TC intensity with the 55-m grid spacing shows little difference from that with the 166-m grid spacing. As the grid spacing increases, the instantaneous Vmax increases significantly, namely by about 36 m s−1 from the 55-m grid spacing to the 2-km grid spacing in the 9.5-h simulation, although the increase in the instantaneous Vmax is not a linear response to the reduction in grid spacing (Figure 1B). Of interest is small fluctuation in the instantaneous Vmax shown with 500-m grid spacing while much stronger fluctuations occur in the 166-m and 55-m grid spacing domains. This seems to suggest that even the 500-m grid spacing may not be able to explicitly resolve the turbulent eddies to any considerable extent. The increase in the instantaneous Vmax from the 2-km grid spacing to the 500-m grid spacing could be mainly attributed to the increase in the simulated TC sustained intensity. However, the large difference in the instantaneous Vmax between the 500-m grid spacing and the 166-m or 55-m grid spacing is systematic and is mainly due to the fact that turbulent eddies can be explicitly resolved in the latter but not in the former. On the other hand, the Rmax shows a general decrease with reducing the grid spacing from 2 km to 500 m but then an increase with further reducing the grid spacing from 500 to 55 m (Figure 1C), namely showing a trend similar to that for the MSLP. To further investigate the sustained surface maximum wind, three LES simulations are averaged to grids with a common grid spacing of 2 km (Figure 1D). Of interest is that the sustained Vmax in 2 km × 2 km box with the YSU PBL scheme shows similar value with 55-m grid spacing. Similar to that in Green and Zhang (2015), the difference of the sustained Vmax among the sub-kilometer grid spacing is also systematic and the sustained Vmax shows a decrease with reducing the grid spacing from 500 to 55 m.
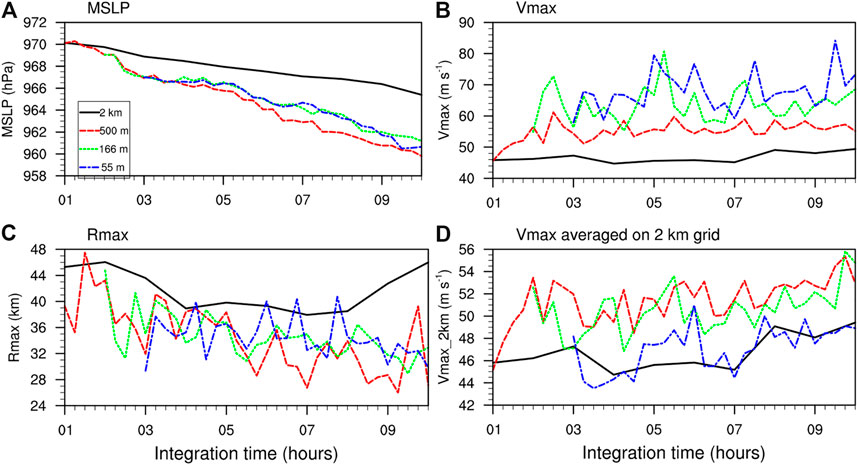
FIGURE 1. Time series of the simulated TC (A) minimum sea level pressure (MSLP), (B) maximum 10-m wind speed (Vmax) and (C) the corresponding radius of maximum wind speed (Rmax) in different grid spacing domains. (D) As (B), but after runs have been averaged to grids with a common grid spacing of 2 km.
To confirm the impact of the resolved turbulent eddies on the simulated TC, we show in Figure 2 the horizonal distribution of instantaneous 10-m wind speed (m s−1). In addition to the three coarse domains with the size the same as the domain d05 (166 m; Figures 2A,B,C), Figures 2D,E also show results from d05 and d06 with the size the same as the domain d6 to further distinguish the difference. First, the 166-m grid spacing starts to resolve roll-like turbulence but are less detailed with longer wavelengths. Second, consistent with Rmax, the 500-m grid spacing simulates the smallest eyewall size. This indicates that the size of the eyewall starts to converge at this sub-kilometer resolution. Third, because d06 only covers the eyewall region, we further compare the differences between the 500-m and 166-m grid spacings out of the eyewall later (see Figure 8). In addition to changes in the eyewall size, there are also significant differences among different domains. The 500-m and 166-m grid domain show some turbulence structure at a radius of 40–60 km. Detailed analyses on these small-scale features will be given in sections 3b and 3c below.
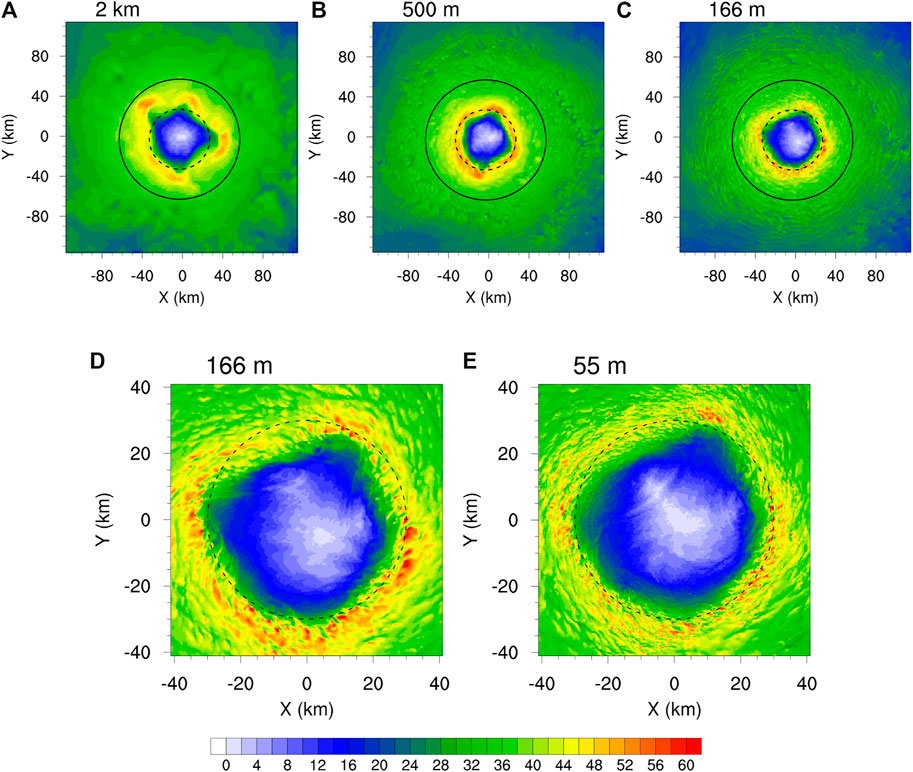
FIGURE 2. Horizonal cross-section of instantaneous 10-m wind speed (m s−1) at t = 9 h of the simulation from the grid spacings of (A) 2 km, (B) 500 m, and (C) 166 m with the domain size the same as d05; (D) and (E) are as in (C) but with the domain size the same as d06. Dash and solid circles indicate the radii of 30 and 60 km from the TC center, respectively.
In addition to the instantaneous wind distribution, we also analyzed the time averaged wind and gust factor distributions in the inner-core region of the simulated TC. This allows an examination of the impact of grid spacing on sustained winds (and also intensity). The sustained wind is 2-minutes average in the best-track data of CMA (China Meteorological Administrator) but 1-minutes average in that of JTWC (Joint Typhoon Warning Center). We calculated 2-minutes average 10-m wind speed (m s−1) and the gust factor for domains with the grid spacing less than 2 km, with the results shown in Figures 3A,B,C,D and E,F,G,H respectively. Consistent with the MSLP, the sustained wind from the 55-m grid spacing is generally weaker than that from the 166-m grid spacing (Figures 3C,D). Interestingly, the domain with 500-m grid spacing begins to resolve gust wind in the inner-core region (cf. Figures 3E,F). Relatively large gust factors expand radially outward with as the grid spacing decreases because more energetic large eddies (fine-scale turbulence) can be resolved by the model resolution. Although both the finest resolution (166 and 55 m) domains show similar structure and peak values in gust factor, the domain with the 55-m grid spacing still shows more detailed structure and stronger gusty winds that expand more outward than the domain with the 166-m grid spacing (Figures 3G,H).
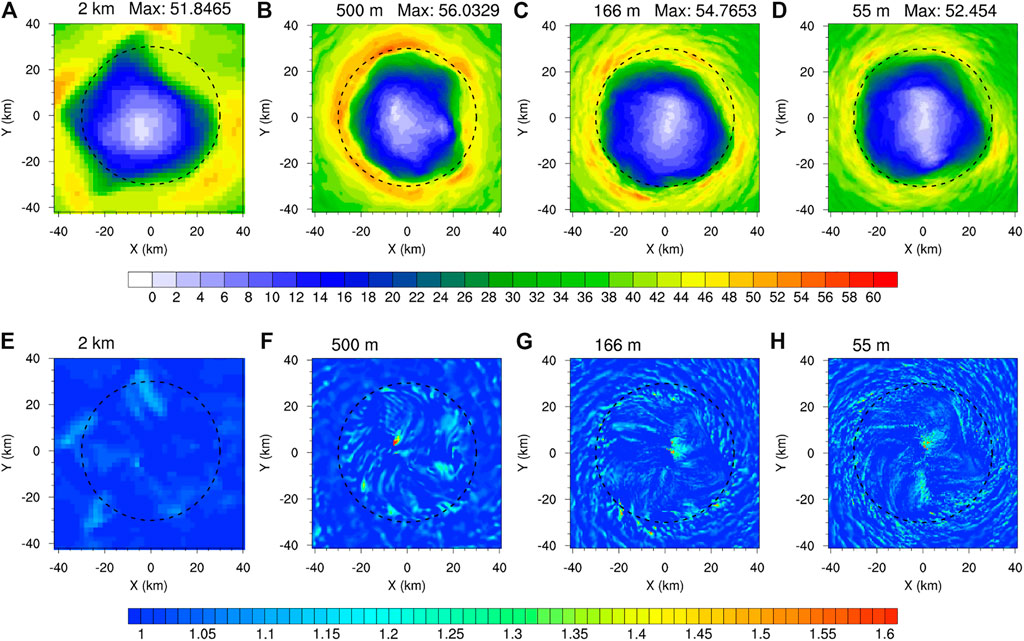
FIGURE 3. Horizonal cross-section of 2 min average 10-m wind speed (m s−1) at t = 9 h of the simulation from the grid spacings of (A) 2 km, (B) 500 m and (C) 166 m (D) 55 m, respectively; (E)–(H) are the same as (A)–(D) but for the gust factor. Dash circles indicate the radius of 30 km from the TC center.
Our results show a high degree of consistency with those of Ito et al. (2017). Their study examined structure of TCBL rolls by large eddy simulation of an entire TC. Although findings related to TCBL rolls were highly consistent, a nonnegligible difference is that Ito et al. (2017) showed most of the large gust factors located near the RMW, whereas our results clearly show large gust factors outside of the RMW. This may be attributed to the use of domain size for the entire TC, differences in the model configuration and physics parametrization in their study. For example, One possible reason for this difference is the choice of SGS scheme; Green and Zhang (2015) suggested that the use of NBA scheme reproduced better fine-scale than the TKE-based scheme. Figure 2 of this study can be directly compared with Figures 3E,F of Green and Zhang (2015) and Figure 3 of Zhu et al. (2019). The ability of the NBA scheme in the WRF model used in these studies and our results to resolve fine scale features guarantees that the horizontal wind would become widely distributed, which may extend large gust factor to the outside of the RMW.
Note that although the 500-m grid spacing did not resolve the PBL turbulence, it still shows marked differences in the PBL turbulence from the 2-km grid spacing. The discrepancy in gust wind between the 500 and 166-m or 55-m grid spacings arises mainly from the difference in explicitly resolving the large eddies in PBL turbulence. The discrepancy between the 166 and 55-m grid spacings is due to the different scale in the resolved eddies in PBL turbulence. Namely, the 55-m grid spacing can explicitly resolve eddies with finer structure and shorter wavelength, and thus producing gust factors with more detailed structures (Figure 3H).
The azimuthal mean boundary layer structures of the simulated TC in 2-km, 500-m, 166-m, and 55-m domains are compared in Figure 4. Note that the 55-m domain only covers the eyewall region (Figure 4D), nevertheless, we don’t see any noises near its lateral boundary, suggesting that the one-way nesting is successful in terms of the simulated azimuthal mean vortex-scale structure. The overall distributions of tangential and radial winds in the boundary layer are quite similar as the grid spacing decreased from 2 km to 55 m. However, the maximum inflow in the lower part of the boundary layer occurred at a slightly larger radius in the 2-km domain with slightly deeper and stronger inflow (Figure 4A). The radius of the maximum azimuthal mean tangential wind in the boundary layer is also larger in the 2-km domain than in the 500 (Figure 4B), 166 m (Figure 4C) and 500 m (Figure 4D) domains. The azimuthal mean tangential wind is slightly stronger with a slightly deeper inflow layer in the 55-m domain than in the 500-m and 166-m domains.
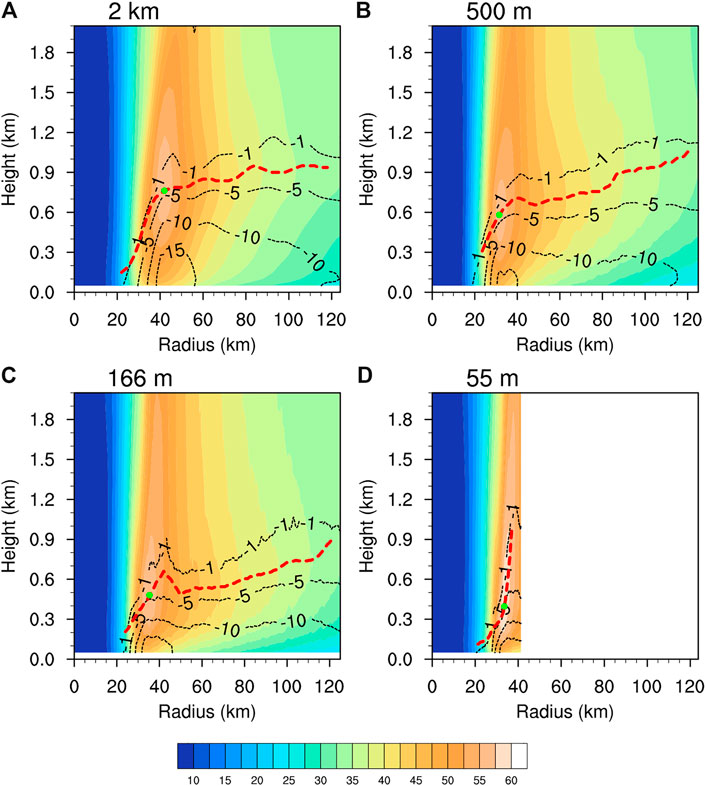
FIGURE 4. Azimuth mean tangential (shaded, m s−1) and radial (contour, m s−1) winds at t = 9 h of the simulation from the grid spacings of (A) 2 km, (B) 500 m, (C) 166 m, and (D) 55 m, respectively. The red lines indicate the heights of the maximum tangential wind varying with radius. The green dot represents the location of the maximum tangential wind.
To more clearly isolate the variations between the experiments attributable to the difference in horizontal grid spacing, the simulated height of maximum tangential wind is compared with observations (e.g., Zhang et al., 2011b and Franklin et al., 2003). Overall, there is a decrease in the height of the azimuthally averaged maximum tangential wind as the grid spacing decreases. The height of maximum tangential wind in the eyewall is above 600 m in all simulations with the horizontal grid spacing greater than 500 m. There is an evident decrease in the height of the azimuthal mean maximum tangential wind from the 166- to 55-m grid spacings, with the height between 400 and 600 m, slightly higher in the eyewall. The 55-m domain has the lowest height of the azimuthal mean maximum tangential wind, with a height of about 400 m. This is consistent with observations in Zhang et al. (2011b), who composited more than 793 dropsondes in TCs and showed that the maximum boundary layer tangential wind in the eyewall occurred between 400–1,300 m height. Franklin et al. (2003) also found that for an individual hurricane, the height of maximum tangential wind could be even lower than 400 m.
All domains exhibited a low frequency (>0.05%) of strong updrafts (>9 m s−1) in the eyewall at about 4-km altitude as we can see from the contoured frequency by altitude diagrams (CFADs) in Figure 5, which is similar to the findings in previous mesoscale model simulations (e.g., Fierro et al., 2009; Wang and Wang, 2014). Although the updraft distribution in the domain with the 2-km grid spacing did not show large differences, the strongest updrafts (near 9 m s−1; Figure 5A) are considerably less frequent than those simulated in the domain with the 500-m grid spacing (greater than 10% updrafts reached 12 m s−1 at 2–6 km altitude; Figure 5B). Note that only the 55-m and 166-m domains (Figures 5C,D) show another two low frequency of strong updrafts in the boundary layer at 300–400 m height and in the upper troposphere at about 11 km height, respectively, with maximum values increasing with decreasing of grid spacing, consistent with the LES simulations in Wu et al. (2019) and Zheng et al. (2020). The large difference in vertical motion in the boundary layer is mainly attributed to the resolved large eddies, corresponding the PBL rolls and tornado-scale vortices in the eyewall, which often result in extreme updrafts and increase both updrafts and downdrafts between (>3 and <−3 m s−1). In contrast, the 500-m domain produced a wider distribution of updraft at middle altitude although it started to show some weak updraft and downdrafts in the boundary layer, an improvement compared to the 2-km domain. Nevertheless, compared to 166 and 55-m domains, the 500-m grid spacing is not high enough to resolve the strong turbulent eddy motion and the related updrafts and downdrafts in the TC boundary layer. We will show below that the resolved eddy-related strong updrafts and downdrafts in the boundary layer are related to the boundary layer horizontal rolls and tornado-scale vortices and they play important roles in enhancing vertical mixing, affecting both the structure and intensity of the simulated TC.
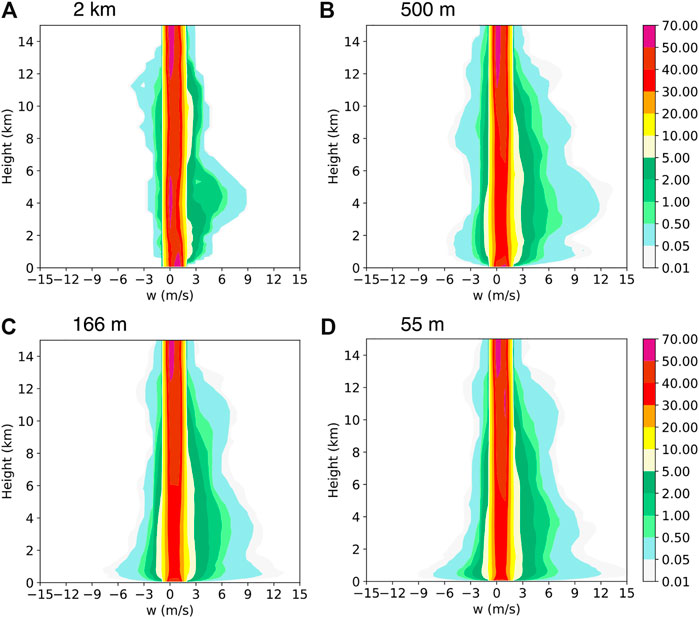
FIGURE 5. CFADs of the simulated vertical velocity (w; m s−1) in the radius of 41.25 km from the storm center (namely in the d06 domain) at t = 9 h of the simulation from the grid spacings of (A) 2 km, (B) 500 m and (C) 166 m (D) 55 m, respectively.
TCBL Horizontal Rolls
Figure 6 compares the horizonal distributions of vertical velocity at the 183-m height in the northeast quadrant at 8.75 h of the simulation from the three inner nest LES domains. Results from the 2-km grid spacing are not shown because there are little small-scale features in the 2-km domain. Note that the updraft-downdraft couplets along the azimuthal direction reflect the TCBL horizontal rolls. We can see from Figure 6 that the horizontal structure of the simulated TCBL horizontal depends strongly on model grid spacing. The 500-m grid spacing did not reproduce the line or banded structures in vertical motion, although it produced some fine-scale features of updraft and downdraft in the TCBL (Figure 6A), similar to those shown in Gentry and Lackmann (2010). The 166-m grid spacing produced two or three banded vertical motion between 6 and 8 m s−1 along the Rmax in the eyewall region (Figure 6B), suggesting that this grid spacing starts to resolve the TCBL horizontal rolls. The 55-m domain produced shorter wavelength, stronger vertical motion and more lines along the Rmax than the 166-m domain, also with some large difference in the structure of the simulated TCBL horizontal rolls. This indicates that the structure of the simulated TCBL rolls may be very sensitive to the horizontal grid spacing. It seems to suggest that sub-100-meters grid spacing is required to fully resolve fine-scale features of TCBL rolls.
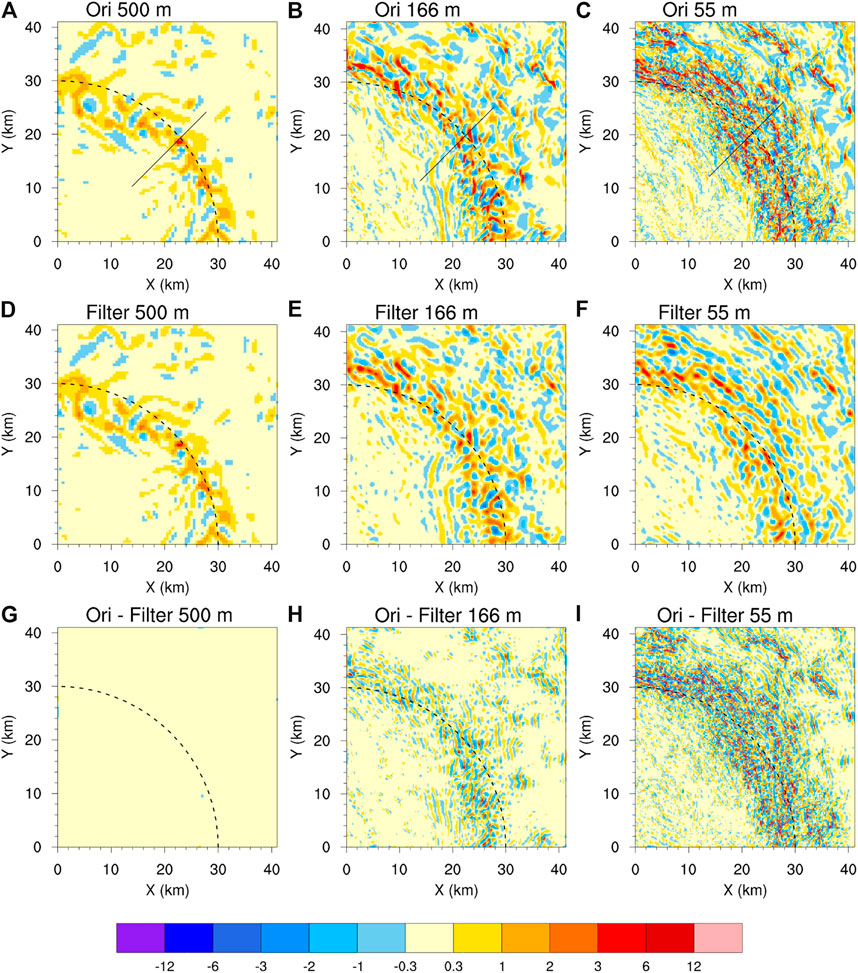
FIGURE 6. Horizonal distributions of vertical velocity (m s−1) at the 183-m height in the northeast quadrant at t = 8.75 h of the simulation from the grid spacings of (A) 500 m, (B) 166 m, and (C) 55 m. (D)–(F) and (G)–(I) are the same as (A)–(C) but for scales with the wavelengths larger than 1,600 m and those with wavelengths less than 1,600 m, respectively.
To examine the different characteristics of the simulated large eddies and the resolved small turbulence in the 166-m and 55-m domains, we decomposed the model vertical motion at 183-m height in Figures 6A–C into scales with the wavelengths larger than 1,600 m (about 10 times of the 166-m grid spacing) as filtered and those with wavelengths less than 1,600 m as residual with the results shown in Figures 6D–I, respectively. Since the 500-m grid spacing can hardly resolve turbulent eddies, the filtered field is nearly the same as the original field. The filtered field in the 166-m domain shows similar magnitude of updraft and turbulent structure in the inner edge of the eyewall to that in the 55-m domain. However, compared to those in the 166-m domain, the TCBL rolls in the 55-m domain extend much more radially outward and show much clearer banded and linearly shaped structure in the outer edge of the eyewall with much longer azimuthal length scales along the roll but shorter wavelengths cross the rolls in the radial direction. These features of the simulated TCBL rolls in the 55-m domain are more comparable with those in observations (Wurman and Winslow, 1998) than those simulated in the 166-m domain. In addition, larger discrepancies can be seen in the vertical motion with wavelength less than 1,600 m (Figures 6G–I) as the 55-m domain can resolve finer and stronger turbulent motions in addition to the TCBL rolls. These results demonstrate that even though the use of the recently updated NBA scheme for subgrid-scale turbulent processes, the 166-m grid spacing is not high enough to realistically resolve TCBL rolls and the fine turbulence structure in the LESs.
To have quick look at the vertical structure of TCBL rolls, we show in Figure 7 the vertical cross section of vertical velocity and the perturbation horizontal winds along the line segment given in Figure 6. As we see from the horizontal distribution of vertical velocity in Figure 6A, the 500-m domain still cannot resolve TCBL rolls well either in the vertical cross-section (Figure 7A). Both the 166-m and 55-m domains simulated the roll structure typical of TCBL rolls: including intense updrafts from the surface to the top of the TCBL, downdrafts, which brought high momentum from top down, a cyclonic-anticyclonic couplet along rolls (Figures 7B,C). However, as the roll wavelength ranged from hundreds to several kilometers and was much shorter in the eyewall, for example, with a wavelength of 600 m in Wurman and Winslow (1998), not all TCBL rolls were reproduced by the 166-m grid spacing. Nevertheless, in terms of the updraft magnitude (>12 m s−1) and vertical extent (∼1.2 km) of rolls, the 166-m domain still showed roll structure as fine as the 55-m domain.
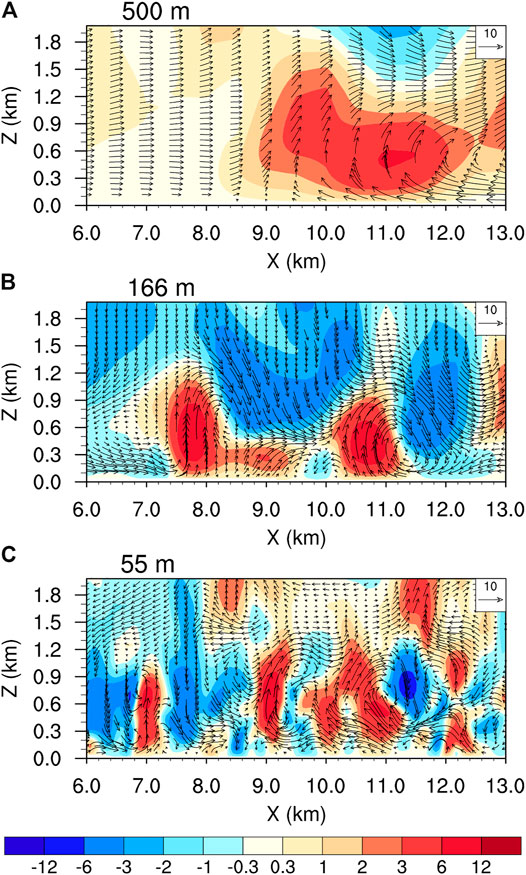
FIGURE 7. Vertical cross sections of vertical velocity (shaded, m s−1) and the perturbation horizontal winds (vectors, m s−1) from the grid spacings of (A) 500 m, (B) 166 m and (C) 55 m along the line segments shown in Figures 6A–C. Note that the perturbation horizontal winds are defined as the difference in vector winds between the instantaneous horizontal winds and the horizontal winds after an average in the 8 km by 8 km box.
In agreement with observations (Wurman and Winslow, 1998; Foster, 2005), the simulated wavelengths of the TCBL rolls in the 55-m domain are about 800–1,200 m (Figure 7C), much shorter than that in the 166-m domain (>2000 m; Figure 7B). Another important feature is that smaller-scale rolls can be resolved and coexist in the 55-m domain (Figure 7C). Nakanishi and Niino (2012) suggested that the roll vortices can be partly coupled with other processes, such as entrainments (ET), internal gravity waves (GW), and Kelvin–Helmholtz (KH) waves above the boundary layer. Compared with Fig. 12 in Nakanishi and Niino (2012), the characteristics of the rolls from the surface to about 300 m altitude is similar to their inflection point (IP) mode. The rolls at x = 7 km or 9 km are similar to their KH-IP mode and the roll at x = 11 km is similar to their ET mode. This suggests that the model can resolve the essential aspect of TCBL rolls as the grid spacing is sub-100-meters (reduced from 166 to 55 m). On the other hand, of interesting is that the 166-m grid spacing can produce better fine-scale rolls (Figure 8) in the outer core region than that in inner core of the TC. This is possibly due to the fact that rolls in the outer core region may have relatively longer wavelength than those in the eyewall, as in observation.
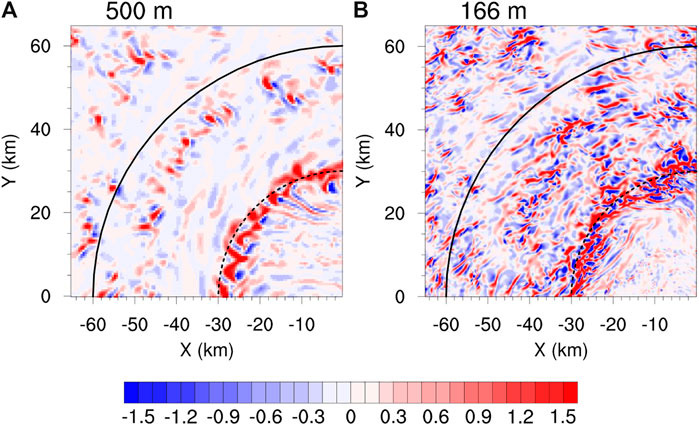
FIGURE 8. Horizonal distribution of vertical velocity (m s−1) at the 183-m height in the northwest quadrant at t = 8.75 h of the simulation from the grid spacings of (A) 500 m and (B) 166 m, respectively.
Tornado Scale Vortices
As in (Wu et al., 2019), tornado scale vortex are defined as w > 20 m s−1 or >15 m s−1 and vertical maximum vorticity >0.2 s−1 (for 55 m) or >0.1 s−1 (for 166 and 500 m). A comparison between the 500-m, 166-m and 55-m domains (Figures 9A–C) shows that there are only four extreme updrafts with w > 20 m s−1 and two of them with w > 20 m s−1 and vorticity >0.2 s−1, which can be defined as tornado-scale vortices in the 55-m domain (Figure 9). The number of the extreme updrafts (w > 20 m s−1) in both the 166-m and 55-m domains are very small. In the study of Wu et al. (2019), they show that there are 24 tornado-scale vortices found at the 11 h period (in their Table 1). Except for the 10 tornado-scale vortices at 27 h, 1–4 occur during 26–31 and 36 h. This indicate that there were 1–4 tornado-scale vortices for most of the time, when a LES is used to simulate the fine-scale features in TCBL from a single snapshot. The relatively small number of tornado-scale vortices is in agreement with Wu et al. (2019), and may be due to the relatively weak intensity of the simulated TC in this study. The count of vertical velocity >15 m s−1 in the 166-m domain is remarkably less than that in the 55-m domain. The 55-m grid spacing produced much stronger updrafts and simulated tornado-scale vortices with less restrict criteria than the 166-m grid spacing.
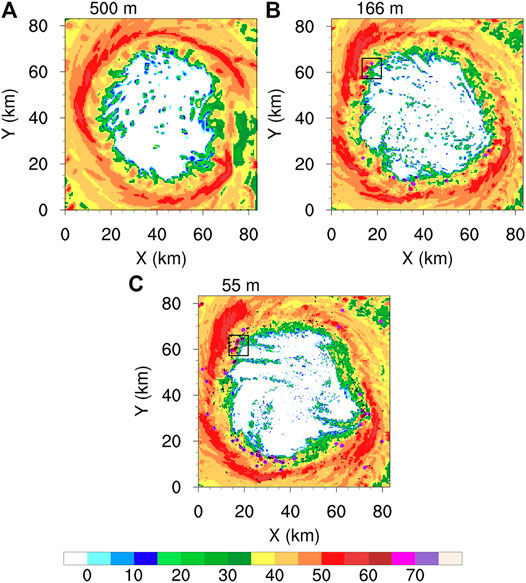
FIGURE 9. The simulated radar reflectivity (dBZ) with vertical maximum vorticity>0.2 m s−-1 or 0.1 m s−1 (black contour), w > 15 m s−1 (purple contour) and w > 20 m s−1 (red contour) at t = 9 h of the simulation from the grid spacings of (A) 500 m, (B) 166 m and (C) 55 m, respectively.
The local surface wind and perturbation winds shown in Figure 10 suggested the small-scale boundary layer features of about 10 km ⅹ 10 km box on the inner edge of the eyewall prevailed extreme updraft and vorticity at the 500-m altitude. It is important to note that tornado-scale vortices in the 55 m-domain (cf. Figures 10A,B) are surrounded by banded relative higher wind speed, which could be associated with TCBL rolls. The vertical structure around a tornado-scale vortex shown in Figure 11 reveals that updraft in the 166-m domain is much weaker (∼22 m s−1) than that of (>30 m s−1) in the 55-m domain, and the wind field is smoother because it could not resolve smaller scale features. Moreover, the 3D structure (Figure 12) reveals the presence of boundary layer rolls under tornado-scale vortices near the surface. Previous studies (Wu et al., 2018; Wu et al., 2019) suggested that extreme updrafts are mainly attributed to tornado-scale vortices, while strong updrafts could result from boundary layer rolls. Our results suggest, however, that multi-scale interaction between boundary layer rolls and tornado-scale vortices might play important roles in producing extreme updrafts in TCBL as well. Unlike those in the 55-m domain, the tornado-scale vortices in the 166-m domain do not show multi-scale interaction between boundary layer rolls and tornado-scale vortices (cf. Figures 12A,B). The result seems to suggest that the interaction between boundary layer rolls and tornado-scale vortices could result in more extreme updrafts and stronger maximum winds, such as that we see from the 55-m grid spacing. The simulated TCBL roll and tornado-scale vortices are sensitive to the grid spacing.
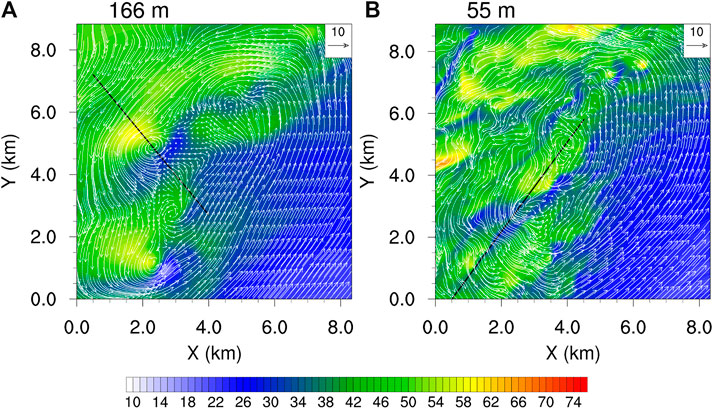
FIGURE 10. Horizonal distributions of perturbational winds (vector, m s−1) at 512 m height and surface wind speed (shaded, m s−1) at t = 9 h of the simulation from the grid spacings of (A) 166 m and (B) 55 m in the rectangle shown in Figures 9B,C, respectively.
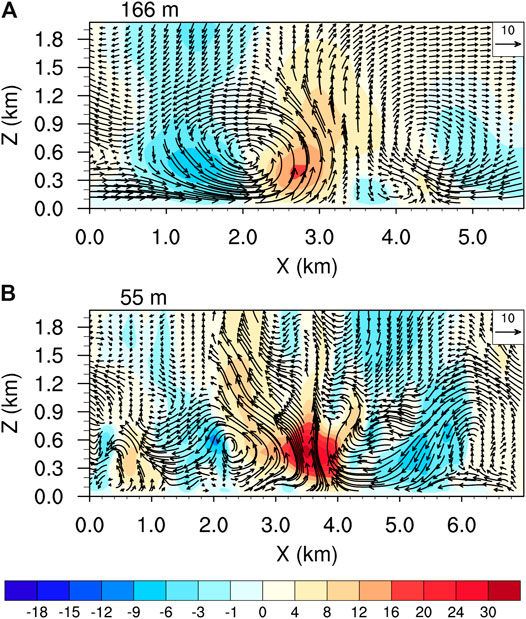
FIGURE 11. Vertical cross sections of vertical velocity (shaded, m s−1) and the perturbation winds (vectors, m s−1) along the line segment in Figure 10 from the grid spacings of (A) 166 m and (B) 55 m, respectively.
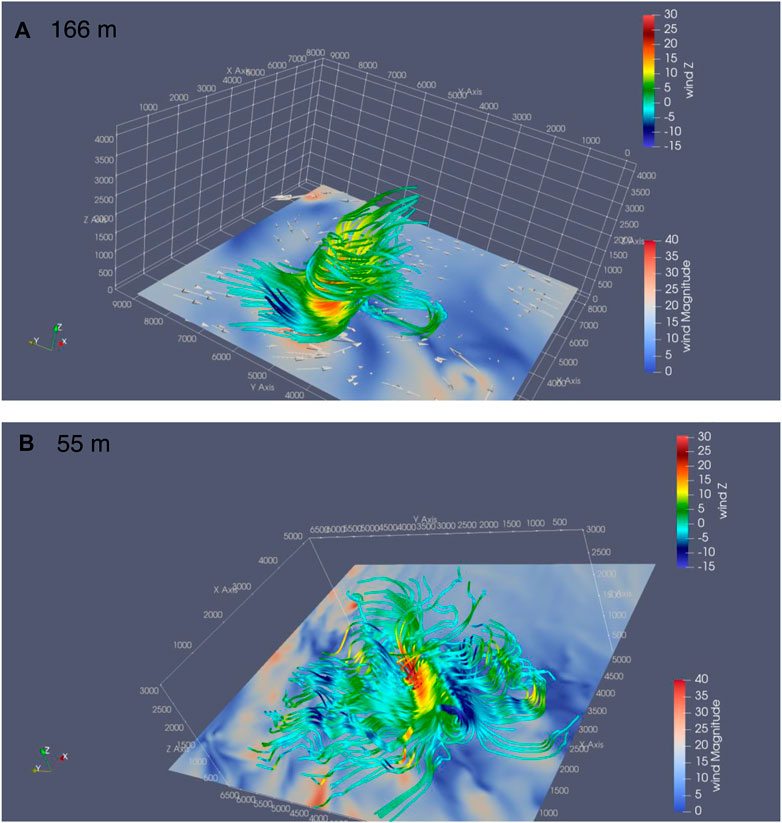
FIGURE 12. Three-dimensional streamlines of perturbation wind (m s−1) colored with vertical velocity (m s−1) and surface perturbation wind speed (shaded, m s−1) at t = 9 h of the simulation from the grid spacings of (A) 166 m and (B) 55 m. The scale of vertical coordinate is doubled as its size is much smaller than the horizontal coordinate.
The interaction between boundary layer rolls and tornado-scale vortices are show similar characteristics with airborne observations in the inner core of Hurricane Hugo first discussed by Marks et al. (2008). Marks et al. (2008) showed that the eyewall vorticity maximum (EVM) along the inner edge of the eyewall, which were similar to tornado-scale vortices seen in this study, were embedded within the boundary layer roll-like structures on the inner edge of the eyewall. Zhang et al. (2011a) suggested that this kind of features were considered to have short time-scale but showed very intense signatures locally. The magnitude and the heights of boundary layer rolls they observed in Hurricane Hugo indicate that they might be evidence of interaction between boundary layer rolls and tornado-scale vortices from 55-m grid spacing in our results.
Vertical Momentum Flux and Energy Spectra
To further show the impact of grid spacing on the simulated TC inner-core turbulent processes, we examined the vertical momentum fluxes from different grid spacings with the results shown in Figure 13. There are two components of the vertical momentum fluxes from, respectively, the parameterized sub-grid scale (SGS) and the resolved eddy processes. The vertical momentum fluxes are calculated following Green and Zhang (2015) and Zhu et al. (2019). Specifically, the resolved fluxes are estimated by the resolved turbulences with scales smaller than 2 km. The SGS fluxes directly output by WRF model are calculated from Eq. 7 of Mirocha et al. (2010). The SGS momentum fluxes in the TCBL decrease as the grid spacing decreases. The SGS momentum fluxes in the 55-m domain is very smaller than those in the 166-m and 500-m domains. In contrast to the SGS vertical momentum fluxes, the vertical momentum fluxes by the resolved eddy motions increase as the grid spacing decreases. Importantly, the total vertical momentum fluxes also decrease as the grid spacing decreases in the boundary layer. For example, the vertical momentum fluxes in the boundary layer from the 55-m grid spacing is much larger than that from the 500-m grid spacing, but show less discrepancies between the heights of 50 and 200 m. Furthermore, although the difference in the total vertical momentum fluxes between the 166-m and 55-m grid spacings are much closer, the 55-m grid spacing still produces slightly larger vertical momentum fluxes in middle and smaller in the lower boundary layer. This means that the relatively coarse horizontal resolution may considerably underestimate (overestimate) the middle (lower) boundary layer vertical mixing in the simulated TCs. Note that the vertical distributions of both the resolved and SGS momentum fluxes are similar to those in previous studies (Green and Zhang, 2015; Zhu et al., 2019), but with much smaller magnitude mainly because the intensity of the storm (with MSLP of 960–965 hPa) in this study is much weaker than that in their studies.
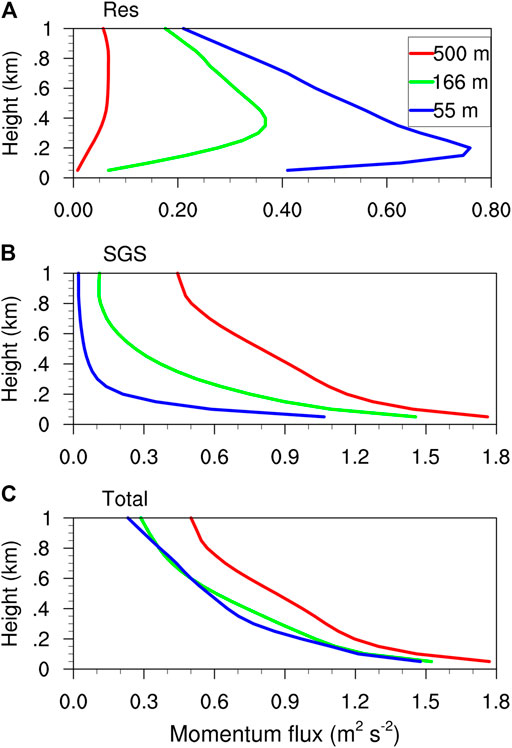
FIGURE 13. Vertical profiles of (A) SGS, (B) resolved and (C) total turbulent vertical momentum fluxes at t = 9 h of the simulation from the grid spacing of 500, 166, and 55 m, averaged in the radius of 41.25 km from the storm center (namely, in the d06 domain).
The coarser resolution with the NBA SGS parameterization scheme overestimates and underestimates the vertical momentum fluxes in the lower and middle boundary layer, respectively. In the coarse resolution simulation (e.g., 500 m), the total momentum fluxes are mainly determined by the SGS fluxes. Therefore, simulations of a coarse resolution would be more sensitive to the SGS scheme used in the model than those of a fine resolution. The simulated total momentum fluxes do not monotonically increase or decrease with the grid spacing in the vertical. These analyses strongly suggest that the representation of SGS vertical mixing in the gray zone is still an issue, especially in high turbulent TC conditions, even the recently updated NBA SGS scheme are used. Furthermore, recent modifications to the SGS boundary layer parameterization, such as the scale-aware schemes (Shin and Hong, 2015) in which the vertical profile of diffusion are multiplied by a factor estimated based on the PBL height and grid spacing may still not solve the problem. Therefore, more endeavor should be given to improve the parameterization of subgrid-scale boundary layer processes so that the effect of the unresolved fine-sale motions in the TC boundary layer can be reasonably represented.
The dependence of the vertical momentum fluxes on grid spacing can be understood by the difference in the resolved scales from different grid spacings. As we can see from Figure 14, which shows the energy spectra of vertical velocity at the 183-m altitude from different grid spacings in the radius of 41.25 km, namely in the d06 domain. As expected, the resolved scales strongly depend on the gird spacing. Given the ratio between the wavelength and grid spacing in the order of 10, it seems that the 55-m grid spacing is close to provide the convergence toward the TCBL horizontal rolls. This is because their wavelengths of 800–1,200 m are much longer than 10 times of the grid spacing of 55 m while the 166-m grid spacing could not resolve these fine-scale TCBL rolls. This suggests that a sub-100-meters grid spacing is required to realistically resolve TCBL rolls and tornado-scale vortices.
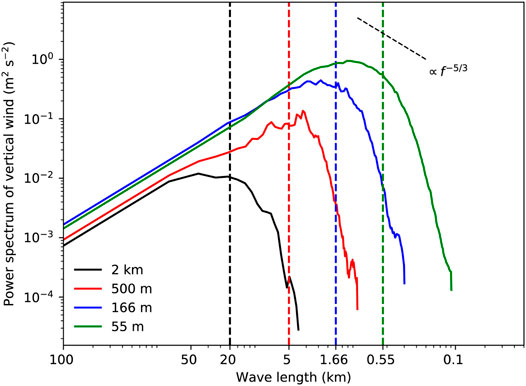
FIGURE 14. Energy spectra (sold) vertical velocity (m2 s−2) at the 183-m height at t = 9 h of the simulation in the radius of the 41.25 km from the storm center (namely in the d06 domain) from the grid spacings of 2 km, 500 m, 166 m, and 55 m, respectively. The vertical dash lines indicate the corresponding 10 times of the grid spacings.
Note that in the study of Rotunno et al. (2009), the grid spacing of 67 m still cannot completely resolve TCBL turbulence. Due to the computational constraint, the horizontal grid spacing of the innermost domain in our simulation is limited to 55 m, slightly finer than that in Rotunno et al. (2009) but still coarser than 36 m in (Wu et al., 2018; Wu et al., 2019). It is still an open question what is the finest horizontal grid spacing that can be fine enough to fully resolve TCBL turbulence and provide the converged solution to their upscale impact on the fine-scale TC structure and intensity change.
Figure 15 shows PDFs for the height of the simulated maximum vertical velocity and the height of the simulated maximum wind speed, along with the respective heights from dropsonde (Stern et al., 2016; Stern and Bryan, 2018). The heights of maximum vertical velocity decreases noticeably as grid spacing decreases. This is in agreement with the height of azimuthally averaged tangential winds, which indicate that, with smaller grid spacing, there is an evidently decrease in the height of the maximum horizontal and vertical winds. There is relatively good agreement between the finer grid spacing simulated and observed heights of the updrafts greater than 10 m/s, with extreme updrafts observed with similar frequencies within the lowest 500 m in the PBL (Figure 15). The peak frequency vertical motion is found at between 500 and 1,000 m in the 166 m, 55 m domains and observation, as opposed to 3,500–4,000 m in the 500 m domain. The presence of stronger vertical motion in the PBL at smaller grid spacing is physically attributable to the improved resolving of fine-scale features in the higher-resolution domains.
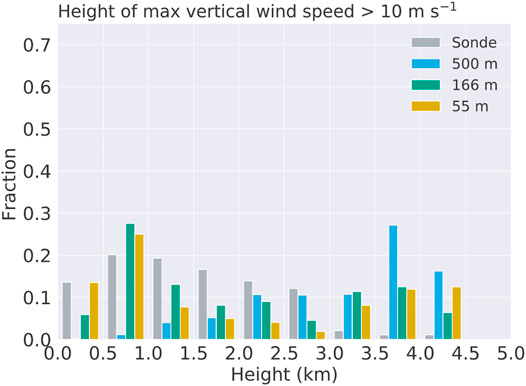
FIGURE 15. PDFs for height of maximum vertical velocity greater than 10 m s−1 at t = 9 h of the simulation. Sonde represent observed dropsondes from Stern et al. (2016) and Stern and Bryan (2018).
Discussion
As TC research moves toward large eddy simulation, it is crucial that horizontal grid spacing smaller than 1 km are well examined in order to be a good reference for the development of future operational TC forecast and research models. We note that Rotunno et al. (2009) found that turbulence could only be resolved by a model at the finest resolution of 62 m in their simulation of an idealized TC. However, Green and Zhang (2015) showed that sub-kilometer grid spacing could start to be able to resolve turbulence consistent with observations. They attributed the discrepancy to the use of the NBA (nonlinear backscatter with anisotropy) SGS scheme. They showed that simulations with the NBA SGS scheme produced better small-scale features than the TKE scheme in the LES simulations with sub-kilometer grid spacings. Our results agree with those of Green and Zhang (2015); we also show that a grid spacing of 166 m can reasonably resolve the macro aspects of boundary layer rolls and tornado-scale vortices in the simulated TC, especially in the outer core region.
Previous studies (Walters, 2000; Gentry and Lackmann, 2010) have shown that grid spacing finer than 1/10 of the wavelength is necessary to realistically reproduce the physical phenomena. Our results show that even for the wavelengths larger than 1,600 m, the 166-m grid spacing still cannot reproduce all important characteristics of TCBL roll structures (e.g., radial distribution and banded structure) that simulated in the 55-m domain. The ability to resolve the fine scales of turbulence at 55-m or smaller grid spacings seems to be important to resolve the rolls, multi-scale turbulent interaction, and tornado-scale vortices. One of the possible reasons could be related to the unrealistic representation of SGS parameterization. This is reported by previous non-TC studies (Muñoz-Esparza et al., 2014; Doubrawa and Muoz-Esparza, 2020). For example, Muñoz-Esparza et al. (2014) suggested that energy cannot be dissipated by the SGS parameterization and can result in overestimate of the resolved motions. In our results, overestimates and underestimates the vertical momentum fluxes in the lower and middle boundary layer in the 166-m and 500-m domains are possibly caused by the unrealistic representation of SGS parameterization. Observations showed that the dominant wavelengths of turbulence near the eyewall are very short [e.g., 600 m in Wurman and Winslow (1998)]. This may also explain why the 166-m grid spacing domain could not resolve the turbulence process in the eyewall region while can produce the broad turbulence features in the outer core region where the turbulent eddies have relatively longer wavelengths. Therefore, our results demonstrate that even the model grid spacing close to 100 m is still not fine enough to reproduce fine-scale features in the inner core region in TCBL and sub-100-m grid spacing is desired to realistically resolve TCBL fine-scale features in numerical models.
The 500-m grid spacing seems to be critical to whether a LES with NBA scheme is appropriate for TC simulations. This is crucial for the operational TC numerical forecasting community, because the sub-kilometer grid spacing, such as 500 m, could be about to be affordable for real-time operational forecasting. Although the 500-m grid spacing cannot resolve fine-scale features of turbulent eddies, such as TCBL horizontal rolls and tornado-scale vortices as shown in this study, it can produce the TC-scale structure and intensity much better than kilometer grid spacings (Bryan et al., 2003).
An issue for a sub-kilometer grid spacing also arises as to the existence of the turbulent gray zone or ‘‘terra incognita,’’ or sub-100-meters. The relatively coarse grid spacing of around 500 m in the turbulent gray zone potentially benefits the conventional TC intensity and size forecasting. Therefore, future work will be done to determine what kind of the subgrid PBL scheme (e.g., convectional scheme, scale-aware scheme, or TKE scheme) can be used to achieve the optimal performance of the model at about 500-m grid spacing in simulating/predicting TC structure and intensity. It might be a good topic to develop new turbulent parameterization schemes that can include contributions by the organized large-eddies in TCBL and thus can be used in the models with grid spacings in the turbulent gray zone.
Conclusion
In the present study, the Weather Research and Forecast (ARW-WRF) mesoscale model with multiple one-way moving nests and nonlinear backscatter with anisotropy (NBA) sub-grid-scale (SGS) scheme was utilized to examine the sensitivity of TCBL fine-scale features to model grid spacing from kilometers through sub-kilometer to sub-100-meters. The focus is on the effects of horizontal grid spacing on the 7–10 h simulation of the boundary layer rolls and tornado-scale vortices in the inner core region of an intensifying TC under idealized conditions.
Results show that reducing the horizontal grid spacing from kilometers to sub-kilometer (e.g., 500 m) can reasonably capture the TC intensity change and TC-scale vortex structure, and further reducing the grid spacing from sub-kilometer to sub-100-meters can start to resolve well organized file-scale eddies, including TCBL rolls and tornado-scale vortices. Furthermore, as the horizontal grid spacing decreases, increasingly more realistic fine structures in the TC eyewall can be simulated. However, because the resolved eddies at higher resolutions play an important role in enhancing the vertical momentum mixing, the simulated TC intensity often does not increase with the increasing model resolution and the eyewall size may increase a little bit as the grid spacing increases from about 500 m.
Compared with mesoscale simulations using grid spacings of kilometers, three innermost domains of sub-kilometer grid spacings with the use of an NBA SGS scheme show considerable improvements to the simulations of fine-scale features in TCBL. It is found that the 166-m grid spacing can simulate tornado-scale vortices, TCBL horizontal rolls and the associated near surface instantaneous wind gust. However, the sub-100-meters grid spacing (55 m) seems to be necessary to simulate finer scale rolls with wavelengths about 400–800 m. More importantly, only the sub-100-meters grid spacing can simulate the multiscale interactions between boundary layer rolls and tornado-scale vortices, including extremely intense updrafts of greater than 30 m s−1 near the inner edge of the TC eyewall. Nevertheless, we also found that the wavelengths of TCBL rolls increase with increasing distance from the TC center and thus the 166-m grid spacing also simulated TCBL rolls outside the inner core better than in the eyewall. Considering the cost effectiveness, our results seem to suggest a grid spacing of sub-100-meters is desirable to produce more detailed and fine-scale structure of TCBL horizontal rolls and tornado-scale vortices, while the relative coarse grid spacing of sub-kilometer (e.g., 500 m) is more cost-effective and feasible for research and operational forecasts if the major interests are not on the turbulence processes in the inner-core region of TCs.
In addition, constrained by computational resource, the innermost domain with the 55-m grid spacing only covered the inner core of the simulated TC. We showed that the 166-m grid spacing can marginally resolve boundary layer rolls outside the inner core (Figure 8) and could partially resolve the rolls and tornado-scale vortices in the eyewall region. However, it is unclear whether the boundary layer rolls in the outer core display any different characteristics of those in the eyewall because our finest grid spacing only covered the inner core region. This may be a topic for a future study examine the performance of different horizontal grid spacing in simulating the fine-scale features in the outer core region of a TCs.
Data Availability Statement
The datasets presented in this study can be found in online repositories. The names of the repository/repositories and accession number(s) can be found below: https://zenodo.org/badge/latestdoi/305684938.
Author Contributions
HX contributed to figures included in this manuscript. HX and YW wrote the manuscript. All authors contributed to the article and approved the submitted version.
Funding
This study was supported in part by the National Key R&D Program of China under grant 2017YFC1501602 and in part by the National Natural Science Foundation of China under grants 41730960, 41905095 and 61827901.
Conflict of Interest
The authors declare that the research was conducted in the absence of any commercial or financial relationships that could be construed as a potential conflict of interest.
References
Bao, J.-W., Gopalakrishnan, S. G., Michelson, S. A., Marks, F. D., and Montgomery, M. T. (2012). Impact of Physics Representations in the HWRFX on Simulated Hurricane Structure and Pressure-Wind Relationships. Monthly Weather Rev. 140, 3278–3299. doi:10.1175/mwr-d-11-00332.1
Bryan, G. H., and Morrison, H. (2012). Sensitivity of a Simulated Squall Line to Horizontal Resolution and Parameterization of Microphysics. Monthly Weather Rev. 140, 202–225. doi:10.1175/MWR-D-11-00046.1
Bryan, G. H., Wyngaard, J. C., and Fritsch, J. M. (2003). Resolution Requirements for the Simulation of Deep Moist Convection. Monthly Weather Rev. 131, 2394–2416. doi:10.1175/1520-0493(2003)131<2394:Rrftso>2.0.Co;2
Bu, Y. P., Fovell, R. G., and Corbosiero, K. L. (2017). The Influences of Boundary Layer Mixing and Cloud-Radiative Forcing on Tropical Cyclone Size. J. Atmos. Sci. 74, 1273–1292. doi:10.1175/jas-d-16-0231.1
Chen, L., and Meng, Z. (2001). An Overview on Tropical Cyclone Research Progress in china during the Past Ten Years. Chin. J. Atmos. Sci. 5, 420–432. doi:10.3878/j.issn.1006-9895.2001.03.11
Chen, P., Yu, H., Xu, M., Lei, X., and Zeng, F. (2019). A Simplified index to Assess the Combined Impact of Tropical Cyclone Precipitation and Wind on China. Front. Earth Sci. 13, 672–681. doi:10.1007/s11707-019-0793-5
Doubrawa, P., and Muñoz-Esparza, D. (2020). Simulating Real Atmospheric Boundary Layers at gray-zone Resolutions: How Do Currently Available Turbulence Parameterizations Perform? Atmosphere 11, 345. doi:10.3390/atmos11040345
Duan, Y., Wan, Q., Huang, J., Zhao, K., Yu, H., Wang, Y., et al. (2019). Landfalling Tropical Cyclone Research Project (LTCRP) in China. Bull. Am. Meteorol. Soc. 100, ES447–ES472. doi:10.1175/BAMS-D-18-0241.1
Dudhia, J. (1989). Numerical Study of Convection Observed during the winter Monsoon experiment Using a Mesoscale Two-Dimensional Model. J. Atmos. Sci. 46, 3077–3107. doi:10.1175/1520-0469(1989)046<3077:nsocod>2.0.co;2
Emanuel, K. (2018). 100 Years of Progress in Tropical Cyclone Research. Meteorol. Monogr. 59, 151–168. doi:10.1175/amsmonographs-d-18-0016.1
Fierro, A. O., Rogers, R. F., Marks, F. D., and Nolan, D. S. (2009). The Impact of Horizontal Grid Spacing on the Microphysical and Kinematic Structures of strong Tropical Cyclones Simulated with the WRF-ARW Model. Monthly Weather Rev. 137, 3717–3743. doi:10.1175/2009mwr2946.1
Foster, R. C. (2005). Why Rolls Are Prevalent in the hurricane Boundary Layer. J. Atmos. Sci. 62, 2647–2661. doi:10.1175/jas3475.1
Franklin, J. L., Black, M. L., and Valde, K. (2003). GPS Dropwindsonde Wind Profiles in Hurricanes and Their Operational Implications. Weather Forecast. 18, 32–44. doi:10.1175/1520-0434(2003)018<0032:GDWPIH>2.0.CO;2
Gao, K., and Ginis, I. (2014). On the Generation of Roll Vortices Due to the Inflection point Instability of the hurricane Boundary Layer Flow. J. Atmos. Sci. 71, 4292–4307. doi:10.1175/jas-d-13-0362.1
Gentry, M. S., and Lackmann, G. M. (2010). Sensitivity of Simulated Tropical Cyclone Structure and Intensity to Horizontal Resolution. Monthly Weather Rev. 138, 688–704. doi:10.1175/2009mwr2976.1
Gopalakrishnan, S. G., Marks, F., Zhang, J. A., Zhang, X., Bao, J.-W., and Tallapragada, V. (2013). A Study of the Impacts of Vertical Diffusion on the Structure and Intensity of the Tropical Cyclones Using the High-Resolution HWRF System. J. Atmos. Sci. 70, 524–541. doi:10.1175/jas-d-11-0340.1
Grasso, L. D. (2000). The Differentiation between Grid Spacing and Resolution and Their Application to Numerical Modeling. Bull. Am. Meteorol. Soc. 81, 579–580. doi:10.1175/1520-0477(2000)081<0579:CAA>2.3.CO;2
Gray, W. M., Ruprecht, E., and Phelps, R. (1975). Relative Humidity in Tropical Weather Systems. Monthly Weather Rev. 103, 685–690. doi:10.1175/1520-0493(1975)103<0685:RHITWS>2.0.CO;2
Green, B. W., and Zhang, F. (2015). Numerical Simulations of hurricane Katrina (2005) in the Turbulent gray Zone. J. Adv. Model. Earth Syst. 7, 142–161. doi:10.1002/2014ms000399
Hill, K. A., and Lackmann, G. M. (2009). Analysis of Idealized Tropical Cyclone Simulations Using the Weather Research and Forecasting Model: Sensitivity to Turbulence Parameterization and Grid Spacing. Monthly Weather Rev. 137, 745–765. doi:10.1175/2008mwr2220.1
Hong, S.-Y., and Lim, J.-O. J. (2006). The WRF Single-Moment 6-class Microphysics Scheme (WSM6). Asia Pac. J. Atmos. Sci. 42, 129–151.
Hong, S.-Y., and Pan, H.-L. (1996). Nonlocal Boundary Layer Vertical Diffusion in a Medium-Range Forecast Model. Mon. Wea. Rev. 124, 2322–2339. doi:10.1175/1520-0493(1996)124<2322:nblvdi>2.0.co;2
Ito, J., Oizumi, T., and Niino, H. (2017). Near-surface Coherent Structures Explored by Large Eddy Simulation of Entire Tropical Cyclones. Sci. Rep. 7, 3798. doi:10.1038/s41598-017-03848-w |
Kain, J. S., and Fritsch, J. M. (1993). Convective Parameterization for Mesoscale Models: The Kain-Fritsch Scheme. Meteorol. Monogr. 46, 165–170. doi:10.1007/978-1-935704-13-3_16
Kain, J. S. (2004). The Kain-Fritsch Convective Parameterization: An Update. J. Appl. Meteorol. 43, 170–181. doi:10.1175/1520-0450(2004)043<0170:Tkcpau>2.0.Co;2
Marks, F. D., Black, P. G., Montgomery, M. T., and Burpee, R. W. (2008). Structure of the Eye and Eyewall of Hurricane Hugo (1989). Monthly Weather Rev. 136, 1237–1259. doi:10.1175/2007MWR2073.1
Mirocha, J. D., Lundquist, J. K., and Kosović, B. (2010). Implementation of a Nonlinear Subfilter Turbulence Stress Model for Large-Eddy Simulation in the Advanced Research WRF Model. Monthly Weather Rev. 138, 4212–4228. doi:10.1175/2010mwr3286.1
Mlawer, E. J., Taubman, S. J., Brown, P. D., Iacono, M. J., and Clough, S. A. (1997). Radiative Transfer for Inhomogeneous Atmospheres: RRTM, a Validated Correlated-K Model for the Longwave. J. Geophys. Res. 102, 16663–16682. doi:10.1029/97jd00237
Morrison, I., Businger, S., Marks, F., Dodge, P., and Businger, J. A. (2005). An Observational Case for the Prevalence of Roll Vortices in the Hurricane Boundary Layer*. J. Atmos. Sci. 62, 2662–2673. doi:10.1175/jas3508.1
Muñoz-Esparza, D., Kosović, B., García-Sánchez, C., and Van Beeck, J. (2014). Nesting Turbulence in an Offshore Convective Boundary Layer Using Large-Eddy Simulations. Boundary-layer Meteorol. 151, 453–478. doi:10.1007/s10546-014-9911-9
Nakanishi, M., and Niino, H. (2012). Large-eddy Simulation of Roll Vortices in a hurricane Boundary Layer. J. Atmos. Sci. 69, 3558–3575. doi:10.1175/jas-d-11-0237.1
Rotunno, R., Chen, Y., Wang, W., Davis, C., Dudhia, J., and Holland, G. J. (2009). Large-eddy Simulation of an Idealized Tropical Cyclone. Bull. Amer. Meteorol. Soc. 90, 1783–1788. doi:10.1175/2009bams2884.1
Rotunno, R. (2013). The Fluid Dynamics of Tornadoes. Annu. Rev. Fluid Mech. 45, 59–84. doi:10.1146/annurev-fluid-011212-140639
Shin, H. H., and Hong, S.-Y. (2015). Representation of the Subgrid-Scale Turbulent Transport in Convective Boundary Layers at gray-zone Resolutions. Monthly Weather Rev. 143, 250–271. doi:10.1175/mwr-d-14-00116.1
Skamarock, W. C. (2004). Evaluating Mesoscale NWP Models Using Kinetic Energy Spectra. Mon. Wea. Rev. 132, 3019–3032. doi:10.1175/Mwr2830.1
Skamarock, W. C., Klemp, J. B., Dudhia, J., Gill, D. O., Liu, Z., Berner, J., et al. (2019). A Description of the Advanced Research WRF Model Version 4. NCAR Tech. Notes NCAR/TN-556+STR. doi:10.5065/1dfh-6p97
Smith, J., Bou-Zeid, E., and Talbot, C. (2012). Nested Mesoscale Large-Eddy Simulations with WRF: Performance in Real Test Cases. J. Hydrometeorology 13, 1421–1441. doi:10.1175/jhm-d-11-048.1
Stern, D. P., Bryan, G. H., and Aberson, S. D. (2016). Extreme Low-Level Updrafts and Wind Speeds Measured by Dropsondes in Tropical Cyclones. Monthly Weather Rev. 144, 2177–2204. doi:10.1175/MWR-D-15-0313.1
Stern, D. P., and Bryan, G. H. (2018). Using Simulated Dropsondes to Understand Extreme Updrafts and Wind Speeds in Tropical Cyclones. Monthly Weather Rev. 146, 3901–3925. doi:10.1175/MWR-D-18-0041.1
Walters, M. K. (2000). Comments of 'the Differentiation between Grid Spacing and Resolution and Their Application to Numerical Modeling. Bull. Am. Meteorol. Soc.
Wang, H., and Wang, Y. (2014). A Numerical Study of Typhoon Megi (2010). Part I: Rapid Intensification. Monthly Weather Rev. 142, 29–48. doi:10.1175/MWR-D-13-00070.1
Wang, Y., Kepert, J. D., and Holland, G. J. (2001). The Effect of Sea spray Evaporation on Tropical Cyclone Boundary Layer Structure and Intensity. Monthly Weather Rev. 129, 2481–2500. doi:10.1175/1520-0493(2001)129<2481:Teosse>2.0.Co;2
Wang, Y., and Wu, C.-C. (2004). Current Understanding of Tropical Cyclone Structure and Intensity Changes ? a Review. Meteorol. Atmos. Phys. 87, 257–278. doi:10.1007/s00703-003-0055-6
Wu, L., Liu, Q., and Li, Y. (2018). Prevalence of Tornado-Scale Vortices in the Tropical Cyclone Eyewall. Proc. Natl. Acad. Sci. USA 115, 8307–8310. doi:10.1073/pnas.1807217115 |
Wu, L., Liu, Q., and Li, Y. (2019). Tornado-scale Vortices in the Tropical Cyclone Boundary Layer: Numerical Simulation with the WRF-LES Framework. Atmos. Chem. Phys. 19, 2477–2487. doi:10.5194/acp-19-2477-2019
Wurman, J., and Kosiba, K. (2018). The Role of Small-Scale Vortices in Enhancing Surface Winds and Damage in hurricane Harvey (2017). Mon. Wea. Rev. 146, 713–722. doi:10.1175/mwr-d-17-0327.1
Wurman, J., and Winslow, J. (1998). Intense Sub-kilometer-scale Boundary Layer Rolls Observed in hurricane Fran. Science 280, 555–557. doi:10.1126/science.280.5363.555 |
Xu, H., Zhang, X., and Xu, X. (2013). Impact of Tropical Storm Bopha on the Intensity Change of Super Typhoon Saomai in the 2006 Typhoon Season. Adv. Meteorology 2013, 1–13. doi:10.1155/2013/487010
Zhang, D.-L., and Wang, X. (2003). Dependence of Hurricane Intensity and Structures on Vertical Resolution and Time-step Size. Adv. Atmos. Sci. 20, 711–725. doi:10.1007/bf02915397
Zhang, D.-L., Zhu, L., Zhang, X., and Tallapragada, V. (2015). Sensitivity of Idealized Hurricane Intensity and Structures under Varying Background Flows and Initial Vortex Intensities to Different Vertical Resolutions in HWRF. Monthly Weather Rev. 143, 914–932. doi:10.1175/MWR-D-14-00102.1
Zhang, J. A., Marks, F. D., Montgomery, M. T., and Lorsolo, S. (2011a). An Estimation of Turbulent Characteristics in the Low-Level Region of Intense Hurricanes Allen (1980) and Hugo (1989). Mon. Wea. Rev. 139, 1447–1462. doi:10.1175/2010mwr3435.1
Zhang, J. A., Rogers, R. F., Nolan, D. S., and Marks, F. D. (2011b). On the Characteristic Height Scales of the Hurricane Boundary Layer. Monthly Weather Rev. 139, 2523–2535. doi:10.1175/mwr-d-10-05017.1
Zhang, J. A., Rogers, R. F., and Tallapragada, V. (2017). Impact of Parameterized Boundary Layer Structure on Tropical Cyclone Rapid Intensification Forecasts in HWRF. Monthly Weather Rev. 145, 1413–1426. doi:10.1175/mwr-d-16-0129.1
Zheng, Y., Wu, L., Zhao, H., Zhou, X., and Liu, Q. (2020). Simulation of Extreme Updrafts in the Tropical Cyclone Eyewall. Adv. Atmos. Sci. 37, 781–792. doi:10.1007/s00376-020-9197-4
Zhu, P. (2008). Simulation and Parameterization of the Turbulent Transport in the hurricane Boundary Layer by Large Eddies. J. Geophys. Res. 113, D17104. doi:10.1029/2007jd009643
Keywords: tropical cyclones, grid spacing, Boundary layer rolls, tornado-scale vortices, TC forecasting
Citation: Xu H and Wang Y (2021) Sensitivity of Fine-Scale Structure in Tropical Cyclone Boundary Layer to Model Horizontal Resolution at Sub-Kilometer Grid Spacing. Front. Earth Sci. 9:707274. doi: 10.3389/feart.2021.707274
Received: 09 May 2021; Accepted: 07 June 2021;
Published: 21 June 2021.
Edited by:
Da-Lin Zhang, University of Maryland, United StatesReviewed by:
Liguang Wu, Fudan University, ChinaYubin Li, Nanjing University of Information Science and Technology, China
Copyright © 2021 Xu and Wang. This is an open-access article distributed under the terms of the Creative Commons Attribution License (CC BY). The use, distribution or reproduction in other forums is permitted, provided the original author(s) and the copyright owner(s) are credited and that the original publication in this journal is cited, in accordance with accepted academic practice. No use, distribution or reproduction is permitted which does not comply with these terms.
*Correspondence: Hongxiong Xu, eHVoeEBjbWEuZ292LmNu