 Xinyi Guo
 Qing Guo
 Zhongkui Feng1
95% of researchers rate our articles as excellent or good
Learn more about the work of our research integrity team to safeguard the quality of each article we publish.
Find out more
ORIGINAL RESEARCH article
Front. Earth Sci. , 13 August 2021
Sec. Quaternary Science, Geomorphology and Paleoenvironment
Volume 9 - 2021 | https://doi.org/10.3389/feart.2021.706998
This article is part of the Research Topic Application of Remote Sensing and GIS in Earthquake-Triggered Landslides View all 14 articles
It is vital to monitor the post-seismic landslides economically and effectively in high-mountain regions for the long term. The landslide creep could cause a subtle change of the overlying vegetation after the earthquake, which will lead to the change of vegetation spectral characteristics in optical remote sensing data. The optical remote sensing technique can be used to monitor the landslide creep areas with dense vegetation in a large range at a low cost because it is easy to obtain multi-temporal, multiple-scale, and multi-spectral information. We identified and extracted the vegetation change area before the 2018 Baige landslide by the high-resolution optical remote sensing data. Firstly, the image fusion method was used to improve the accuracy of change detection. Then, vegetation coverage before the landslide was calculated. The vegetation change was identified, and qualitative and quantitative methods were used to analyze the spatio-temporal changes of vegetation coverage. Our results indicate that the creep distance of the landslide is about 50 m and the vegetation in the back scarp area and the main sliding area display a significant downward trend with time closing to the landslide comparing with that in the reference area. The vegetation change in the remote sensing image has an excellent spatio-temporal correlation with the landslide creep. This study provides a possible way and perspective for monitoring post-seismic landslide disasters.
1. The changes in environmental conditions caused by the landslide creep have an impact on vegetation growth;
2. The vegetation change has an evident spatio-temporal correlation with the landslide creep;
3. The high-resolution optical remote sensing technology can be used to identify the vegetation change. For potential landslides in large-scale high-mountain areas, this method can be used for preliminary investigations economically and effectively.
The effect of earthquakes on landslides is not only in the seismic stage but also in several years after the earthquake. The slope formed some cracks during the earthquake and did not slide immediately but formed potential landslides. Previous studies have found that these potential landslides will be in an unstable state for a long time (years to hundreds of years) after the earthquake (Khattak et al., 2010). Moreover, due to the seismic topographical amplification effect (the seismic whiplash effect) (Xu et al., 2017), cracks mainly formed in the upper part of the slope, which is hard to be reached by the field investigation. When these areas are affected by rainfall, the shear strength of the mass will reduce, and the stability of the slope will decrease. Finally, the slope becomes unstable and forms a large and destructive landslide (such as the Xinmo village landslide in 2017). Southwest China is an earthquake-prone area characterized by high and steep topography and dense vegetation. So, it is challenging to monitor the potential landslides in high-risk areas after the earthquake, especially in remote or poor accessible regions. It is vital to monitor high-risk areas economically and effectively in the long-term change process after the earthquake.
Field displacement measurement is the main method for monitoring landslides. Moreover, the common non-contact displacement monitoring methods include the global positioning system (GPS) monitoring method Wang (2011) and the synthetic aperture radar (SAR) monitoring method (Bianchini et al., 2018). But the range of GPS monitoring is limited; the monitoring network of GPS needs to be established in advance; the instruments of GPS must avoid being sheltered by vegetation during the monitoring period. The complex environment in the mountain areas will increase the difficulty of network layout and increase the cost of operation (Fan et al., 2006). The GPS monitoring method, which uses the point as the monitoring unit, is difficult to reflect the continuous change information of the land. For the interferometric synthetic aperture radar (InSAR) monitoring method, the phase unwrapping is difficult. Complex terrain and dense vegetation will cause phase decorrelation of radar data. Therefore, some slopes are difficult to be photographed (Wang et al., 2010). InSAR monitoring is not suitable for monitoring landslides in the mountain and canyon areas. The intensity tracking method of offset tracking technology which is insensitive to the coherence of SAR images is suitable for the low coherence area with significant characteristics (Yang et al., 2017). This method has been used in monitoring landslides. It matches images based on the feature information, also known as feature matching. This method generally needs bright targets (e.g., buildings and bare rocks), providing accurate and reliable estimations (Jia et al., 2020). However, it will be difficult to find buildings and bare rocks when the slopes are covered by dense vegetation.
The optical remote sensing technique, with the characteristics of non-contact, large-scale, periodic observation, multiple archived data, and rich spectral information, is an essential mean of landslide monitoring. The landslide deformation monitored by optical remote sensing mainly focuses on identifying the deformation of the slope or the cracks and bare land caused by the deformation. Sub-pixel phase correlation of optical remote sensing images can be used to obtain deformation. The deformation can be obtained by calculating the offset between two optical remote sensing images, reflecting the position deviation of points in the two images. It has been used in some earthquake cases (Michel and Avouac, 2002; Dominguez et al., 2003; Binet and Bollinger, 2005). However, when the deformation, cracks, and bare land are hidden by vegetation, the method will be helpless.
Vegetation is the first layer of Earth observation. The weak information of vegetation change can reflect the geological activities, which has been applied in the investigation of mine and the identification of the fault (Zhao, 2013). Many slopes have a slow creep stage before the landslide. Sometimes cracks and small landslides will form on the creep slopes. The deformation in this stage will change the rock, soil, water, and other things in the surrounding areas, influencing the overlying vegetation (Ding et al., 2013; Du et al., 2013). Finally, it will lead to the change of vegetation spectral characteristics in optical remote sensing data. These vegetation change phenomena are common in geological investigations.
When the landslide deformation is hidden by vegetation, the vegetation can be considered the monitoring object. The spectral characteristics of vegetation can be used to indicate landslide creep. The image fusion can enhance the weak information of vegetation variations and explore the relationship between the vegetation change and the landslide in the remote sensing data before the landslide (Guo et al., 2020). The vegetation spectral change in optical remote sensing data can be used to identify the deformation of the land effectively. It can delineate the potential geological hazards and study the dynamic evolution process and characteristics of disaster deformation by the multi-temporal remote sensing data, which is helpful to determine the risk degree of hidden danger. This monitoring method can make up for the deficiency of the existing monitoring technique in the dense vegetation and high-mountain areas and assist in monitoring the landslide in the long-term change process after the earthquake. This method can be used to preliminary investigations of potential landslides economically and effectively in large-scale areas. Then it can combine with visual interpretation, SAR, and other techniques for further confirmation in the key areas. This study focuses on the Baige landslide in the Jinsha River, SE Tibet, to monitor the landslide after the earthquake through the vegetation change.
The Baige landslide with a source volume of 23 million m3 on October 11, 2018, occurred on the western bank of Jinsha River, a junction of Baiyu County (Ganzi Prefecture, Sichuan Province) and Jiangda County (Changdu City, Tibet Autonomous Region) (Figure 1). A second slide occurred at the same location on November 3, 2018. The second landslide volume was about 3.5 million m3, and the entrainment volume was about 8.5 million m3 (Fan et al., 2020). The landslide blocked the trunk stream of the Jinsha River and formed a barrier lake, which endangered Baiyu County, Batang County, and Delong County.
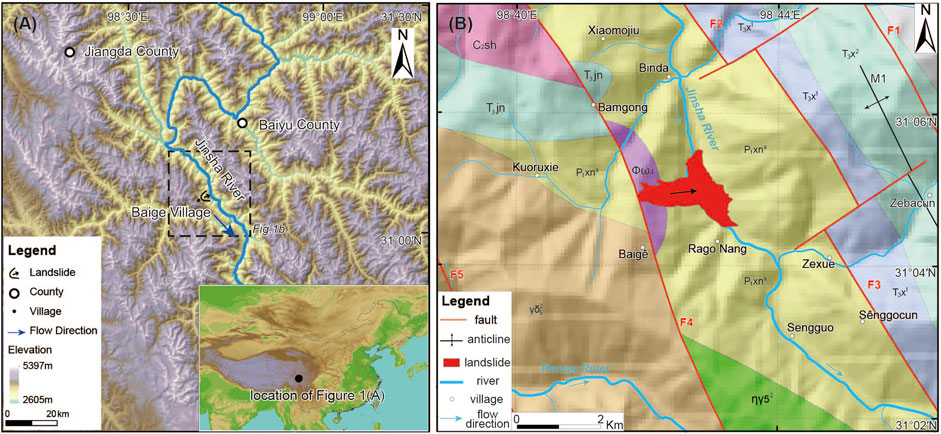
FIGURE 1. Topographic and geologic maps of Baige landslide (A) Topographic map (The insert shows the location of the study area in China). (B) Geological map (modified from Fan et al., 2019). F1: Xuenqing-Longgang Fault; F2: Zhuying-Gonda Fault; F3: Zeba-Xietang Fault; F4: Boluo-Muxie Fault; F5: Gangda-Dizhong Fault; M1: Shandong-Baba Anticline; T3jn: Upper Triassic Jingu Formation; T3x2: Upper Segment of Upper Triassic Xianisongduo Formation; T3x1: Lower Segment of Upper Triassic Xianisongduo Formation; C2sh: Upper Carboniferous Shengpa Formation; Ptxna: Upper Proterozoic Xiongsong Group Gneiss Formation; φω4: Late Paleozoic Variscan Jinshajiang ultramafic belt and serpentinite; ηγ52: Yanshanian Gepo superunit fine grained monzonitic granite; γδ52: Yanshanian Zeba superunit Muzha fine-grained granodiorite and quartz diorite.
The Baige landslide is located in the Southeastern Tibetan Plateau, which has steep topography, fierce landform incision, and broken rocks. Several structures are striking in the NW direction; significant among them are the Bolou-Muxie, Zhuying-Gonda, Xuenqing-Longgang faults, and the Shandong-Baba Anticline. The landslide is located on the edge of the BolouMuxie fault. The strata outcropping in the landslide area mainly consist of gneiss (Ptxna), granite (γδ52), limestone (T3jn), and serpentinite (φω4) (An et al., 2021). The landslide headscarp developed within the serpentinite from Variscan orogeny. The landslide body is mainly composed of gneiss and serpentinite. The borehole data show that the rock masses are extremely broken in the study area. The water in Bogong Gully has infiltrated the landslide body for a long time (Zhong et al., 2021). Zhang et al. (2020) think that serpentine in the Baige landslide was altered into clay minerals, such as montmorillonite or illite. Clayey altered rock is a weak interlayer, which significantly reduces the shear strength of the potential slip zone. It is rich in clay minerals and has good water absorption. The engineering properties of the altered soft rock, which shrink/swell with drying and wetting, are weak under the influence of water (Zhang et al., 2011). It will further deteriorate the slope rock structure. Finally, the serpentine strata gradually transformed into a creep zone (Fan et al., 2019).
In history, several strong earthquakes occurred around the Baige area, such as the 1842 Mw7.3 Zongguo earthquake, the 1870 Mw7.2 Batang earthquake, and the 1989 Mw6.5 earthquake (SSB, 1995; Ambraseys and Douglas, 2004). In recent years, earthquakes occurred around this area, including the 2013 Ms6.1 Changdu earthquake. The Changdu earthquake induced 37 new potential hazards in Jiangda county and 57 new potential hazards in Baiyu County (Wang et al., 2019). These earthquakes intensified the deformation of some potential landslides and promoted the occurrence of the Baige landslide. Finally, under the rainfall and the long-term gravity, the Baige landslide loses stability.
In this study, the images used for vegetation change detection need to be of good quality, from the same period each year, and without clouds. SPOT images have Ortho-Level images, which have been done ortho-rectification with few geometric distortion and good quality. According to the geographic conditions of the Baige landslide and the limited free image data available, a minimum number of SPOT-6 and SPOT-7 Ortho-Level images were selected. Panchromatic (PAN) band and multispectral (MS) bands (B, G, R, NIR) of SPOT-6 and SPOT-7 images were both used in this study. These images without clouds can provide reliable data sources for acquiring vegetation growth information before the landslide. These images come from the same period of 3 years (2014–2017), which reduces the interferences of the season (including rainfall, temperature, and other factors) to vegetation change. The information on remote sensing data is shown in Table 1.

TABLE 1. Remote sensing data covering the Baige landslide.
The steps to detect vegetation change are listed as follows (Figure 2): 1) Acquire remote sensing images and interference factors; 2) select appropriate fusion method; 3) divide Baige landslide and calculate vegetation coverage; and 4) analyze vegetation anomaly.
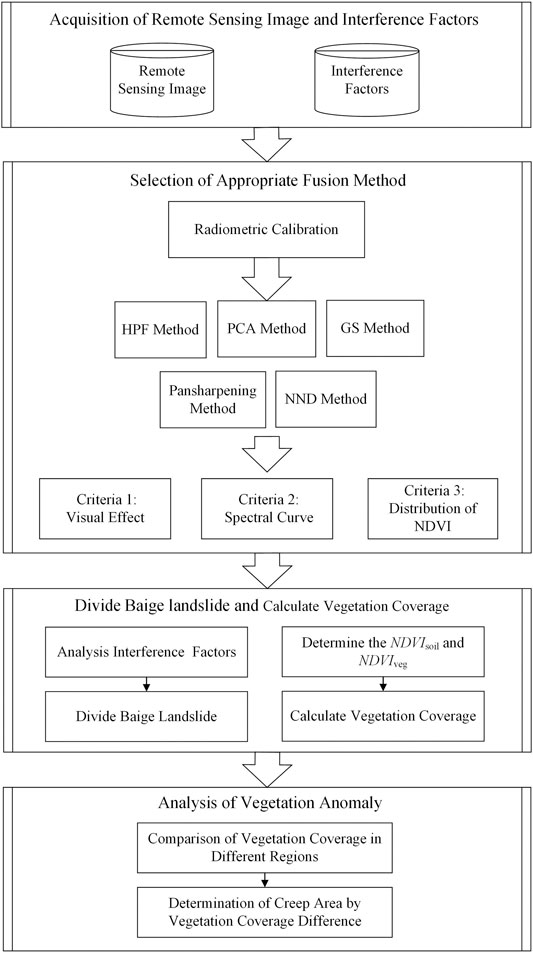
FIGURE 2. Procedural flow chart of this study.
The recognition ability of vegetation change in remote sensing images should be enhanced before the landslides. It is necessary to improve the spatial and spectral resolutions and then integrate them as much as possible. The remote sensing image fusion method can integrate the spatial and spectral information of multiple images, which can provide more abundant and complete information than that of any single image. It is an important step in remote sensing image processing, such as information extraction, change detection, and target recognition. However, different image fusion methods have different results. Some results may interfere with vegetation change detection. We try to guarantee the detected vegetation anomaly caused by the landslide creep rather than the fusion method. So, we chose five fusion algorithms for comparative experiments to select the fusion method with the least interference, including high pass filtering (HPF) (Ranchin and Wald, 2000), principal components analysis (PCA) (María et al., 2004), Gram-Schmidt (GS) (Clayton, 1971), Pansharpening (Zhang and Mishra, 2012) and nearest-neighbor diffusion-based pan-sharpening algorithm (NND) (Sun et al., 2014).
The Pansharpening method has been used in the SPOT fusion-level products. So, the SPOT fusion-level product can be used as the fused result of the Pansharpening method. But the SPOT fusion-level products are not processed by the atmospheric correction. Referring to the processing flow of the SPOT fusion-level products, we do not implement the atmospheric correction for the experimental images to ensure the consistency of the image processing flow. The panchromatic (PAN) and multispectral (MS) images of SPOT were directly calibrated to the reflectance image. Then, the five fusion methods were used to fuse the image.
Finally, we evaluated the results of image fusion and chose the appropriate fusion method. In this study, vegetation and bare land were the key objects that can reflect vegetation growth on the surface. Owing to the spectral fidelity of remote sensing data relating to the monitoring results of vegetation, the quality of the fused image is evaluated from the visual effect evaluation, spectral curves of vegetation and bare land, and distributions of normalized difference vegetation index (NDVI). We select the best image fusion method which is suitable for monitoring vegetation.
This paper aims to study the vegetation change caused by landslide creep. Besides, human activities and other factors will also interfere with vegetation. So, it is necessary to control the environment variables and obtain a single environment variable zone. The zoning excludes unrelated factors such as human activities to ensure the consistency of vegetation growth conditions within the same physical geographical units. Therefore, we combined the interpretation of high-resolution remote sensing data to divide the slope into different units before the Baige landslide.
Firstly, the main sliding area at the back part of the Baige landslide, with dense vegetation, was identified. In previous studies, the visual interpretation of historical satellite images shows that the site has experienced creep deformation in the last 50 years. Cracks and slight surface disruption had shown in 1966. The slope might have been already deforming and prone to failure. In this study, the interpretation results of Google Earth’s high-resolution remote sensing data (Figure 3A) show that the vegetation area had slipped and formed the back scarp of the landslide before 2011 (Fan et al., 2019). Since 2011, the displacement of vegetation area at the back part of the landslide increased rapidly, and the shear fractures on both sides formed. The road in the vegetation area was significantly dislocated at the shear crack. As time went by, the road was abandoned, and the sliding distance of the road increased (Figure 3B). Therefore, the vegetation area at the back part of the landslide was determined as the main sliding area, and the area shown in the red box (Figure 3A) was determined as the focus area.
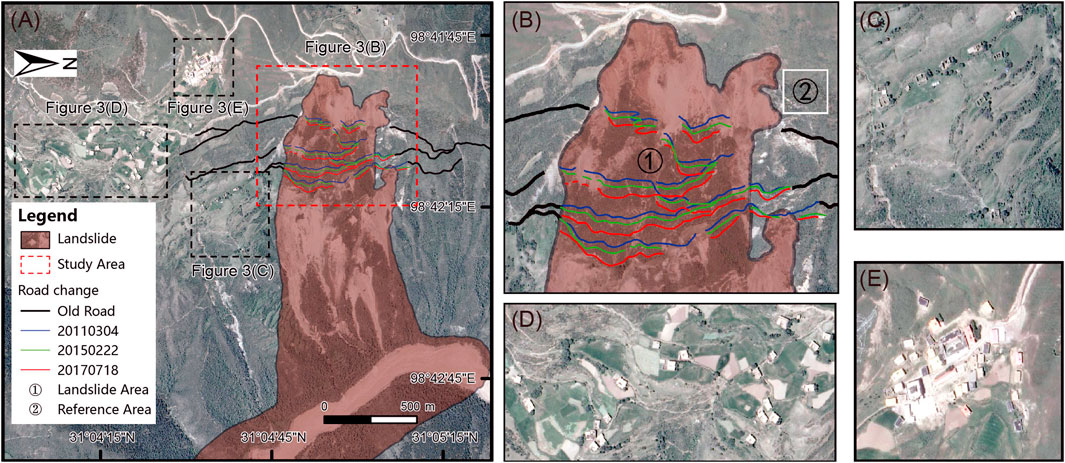
FIGURE 3. The Baige landslide (A) Interpretation map of Baige landslide (modified from State Key Laboratory of Geohazard Prevention and Geoenvironment Protection, 2018 (http://www.sklgp.cdut.edu.cn/info/1018/2247.htm)) (B) Deformation map of the road (C) Community-1 (D) Community-2 (E) Community-3.
Then, according to the interpretation result of human activities, this study made a detailed division. In the selected red box area, the landslide edge was taken as the boundary to divide this area into two parts: the landslide area (area ①) and the external area of the landslide. In the external area of the landslide, there were many communities on the left side, as shown in Figures 3C–E. They may interfere with the vegetation. However, there were no communities near the right side. Since the road was abandoned, the right side of the landslide had few human activities, especially the area drawn by the white box hardly was disturbed by human activities, as shown in Figure 3B. This area was on the same slope as the landslide, which had the same natural conditions as the landslide. It was helpful to verify the effect of the landslide creeps on vegetation. So, the area in the white box was regarded as the reference area (area ②).
Vegetation coverage can directly show the surface vegetation situation and is often used as an evaluation factor in geological hazard assessment, prevention, and mitigation. We used the dimidiate pixel model to calculate the vegetation coverage maps.
The dimidiate pixel method assumes that the land in a pixel is composed of vegetation area and non-vegetation area (soil or bare land). The spectral information of this land observed by remote sensing sensor is also composed of these two elements by linear weighting. The weight of each element is the proportion of their respective area in the pixel. The vegetation coverage can be regarded as the weight of vegetation (Leprieur et al., 1994; Chen et al., 2001; Zribi et al., 2003).
NDVI is also a kind of quantitative value that reflects the growth of vegetation on the land. It is calculated from the spectral information of land objects received by remote sensing sensors, as shown in Eq. 1. Since the atmospheric correction was not conducted in this study, NDVI can partly eliminate the atmospheric influence to reduce the atmospheric disturbance as much as possible. According to the dimidiate pixel model, the NDVI value of a pixel can be expressed as the information of NDVIveg contributed by vegetation and the information of NDVIsoil contributed by non-vegetation (soil or bare land). Moreover, it is shown that different indicators used to calculate vegetation coverage have different characteristics, among which NDVI is the most widely used in previous studies (Li, 2003). Therefore, the vegetation coverage can be expressed by the following formulas:
where
where Fc is the vegetation coverage value; NDVIsoil is the NDVI of the area entirely covered by soil; NDVIveg is the NDVI of the area entirely covered by vegetation.
In theory, NDVIsoil and NDVIveg should be determined by the field investigation. However, due to the Baige landslide has already happened, we can not verify NDVIsoil and NDVIveg by the field investigation. Previous studies usually use the statistics of NDVI to get the cumulative percentage of each NDVI and then set the confidence interval of the cumulative percentage to determine the NDVIsoil and NDVIveg (Li et al., 2014). Therefore, we count the cumulative percentage of each NDVI value in the remote sensing image at first. Secondly, we use the visual interpretation of remote sensing images to determine the vegetation area and the bare land area. Then, we use different confidence intervals to obtain the vegetation area and the bare land area. Finally, we compare the area obtained by different confidence intervals with the area obtained by visual interpretation to determine the suitable confidence interval. However, this method relies too much on visual interpretation. Sometimes there may be a slight deviation in the confidence interval of the best matching state obtained by visual interpretation of images in different phases. To obtain the consistent and best consistent vegetation coverage, we unify the confidence intervals of the three phases, getting 2%–98% as the confidence interval.
According to the confidence interval, this study determined the NDVIsoil and NDVIveg. The NDVI, whose accumulated percentage was 2% in the Baige landslide, was defined as NDVIsoil (i.e., The pixel’s NDVI, which was less than NDVIsoil, was entirely covered by soil). The NDVI, whose accumulated percentage was 98% in the Baige landslide, was defined as NDVIveg (i.e., The pixel’s NDVI, which was more than NDVIveg, was entirely covered by vegetation). Finally, the vegetation coverage of the Baige landslide was calculated according to Eq. 2. Besides, the vegetation coverage from high to low was transformed into the corresponding color from red to purple by the pseudo-color density segmentation. The calculation of vegetation coverage and pseudo-color enhancement can highlight the subtle vegetation changes related to landslide creep.
In the comparative experiment, the original MS reflectance image was taken as the reference image. The fused images obtained by different fusion methods were compared. The results of the fused images are shown in Figure 4. Owing to the PAN and MS images in the fusion experiment gotten from the same sensor in the same phase, the color differences of most fused images were inconspicuous. They can effectively improve image clarity and visual effect.
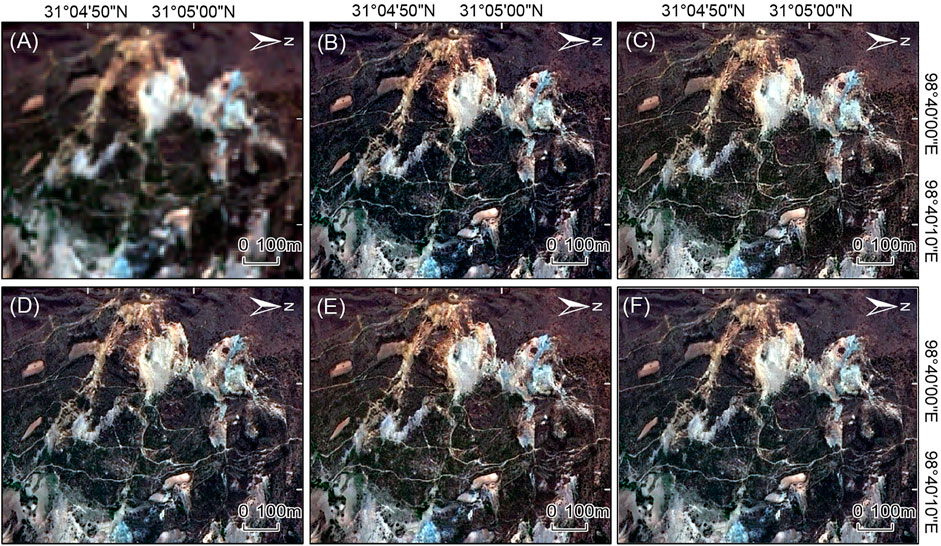
FIGURE 4. Visual effects of different fusion methods (A) MS image (B) Pansharpening fused image (C) HPF fused image (D) GS fused image (E) PCA fused image (F) NND fused image.
The spectral fidelity of vegetation and bare land was analyzed from the shape and scope of the reflectance spectrum curve in different fused images, as shown in Figure 5 and Figure 6. In Figure 5, the spectral reflectance curve of the vegetation in the NND fused image is the most consistent with that in the MS image, and the fidelity of the NND fused image is the best. Although the shapes of these spectral reflectance curves of Pansharpening, HPF, GS, and PCA fused images are not significantly different from that of the MS image, these reflectance values of fused images are high and spectral fidelity is poor. In Figure 6, the spectral reflectance curves of the bare land in the NND and PCA fused image have the same trend and good fidelity as that of the MS image. The curve trend of the HPF fused image is inconsistent with the MS image. Although the shapes of these spectral reflectance curves of Pansharpening and GS fused images are not significantly different from that of the spectral reflectance curve of MS image, these reflectance values of fused images are high, and their spectral fidelity is poor.
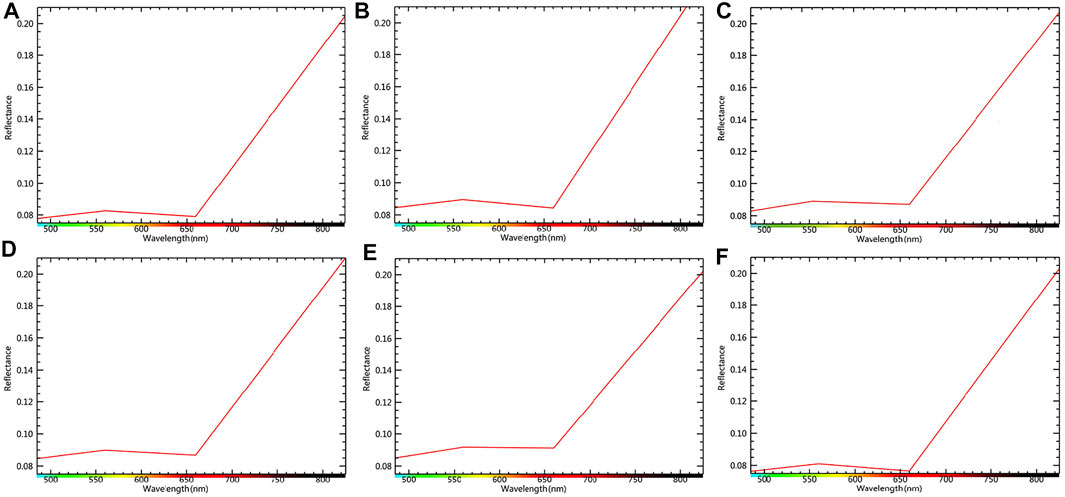
FIGURE 5. The spectral reflectance curves of vegetation with different image fusion methods (A) MS image (B) Pansharpening fused image (C) HPF fused image (D) GS fused image (E) PCA fused image (F) NND fused image.
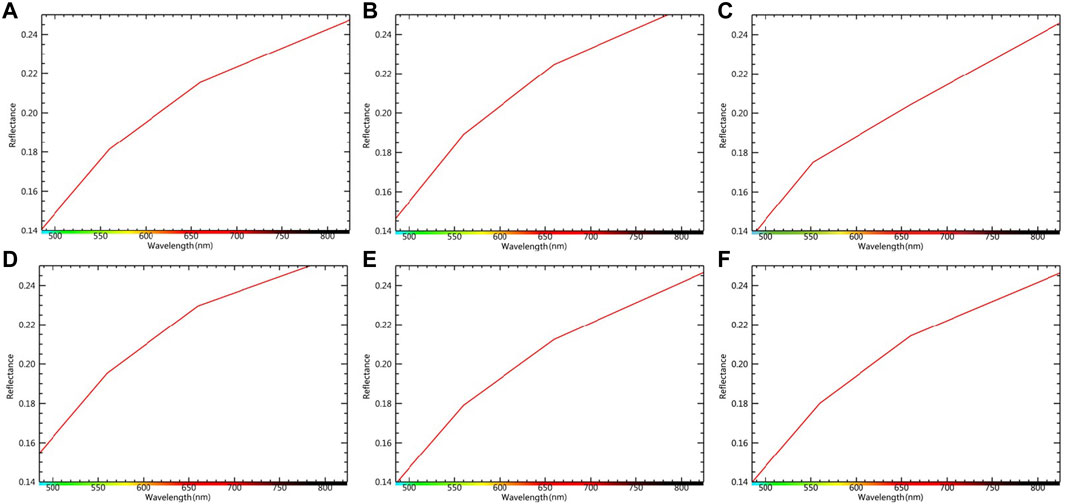
FIGURE 6. The spectral reflectance curves of bare land with different image fusion methods (A) MS image (B) Pansharpening fused image (C) HPF fused image (D) GS fused image (E) PCA fused image (F) NND fused image.
This study calculated the NDVI values of the MS image and fused images. The main objects in the selected study area are mainly bare land and vegetation, without clouds, water, and snow. So, the NDVI distribution values range from 0 to 1. The distributions of NDVI from these images are shown in Figure 7. The NDVI of the MS image was regarded as the actual value to compare with other NDVI values of the fused images (Table 2): 1) The maximum and minimum values of each NDVI result were counted. NDVI values are mainly distributed between 0.25 and 0.45 in the MS image. The distribution of NDVI values obtained by PCA fusion is mainly distributed between 0.25 and 0.5. In the MS image, NDVI appears most frequently around 0.4. In GS fused image, NDVI appears most frequently around 0.3. 2) In the mean NDVI, the approximation ratio of the mean NDVI was calculated. The approximation ratios of the mean NDVI obtained by these fused images and the MS image can almost reach 100%, except HPF fused image. 3) In the distribution of NDVI, we calculated the root mean squared error (RMSE) of the NDVI to measure the deviation between the NDVI values of the fused images and the actual NDVI value. This study compared the NDVI distribution of the fused images with that of the MS image. We found that the NDVI distribution of the fused images is similar to that of the MS image when RMSE is within 50. So, this study used RMSE as the criteria. The NDVI distribution of the NND and Pansharpening fused images are the most similar to the actual distribution.
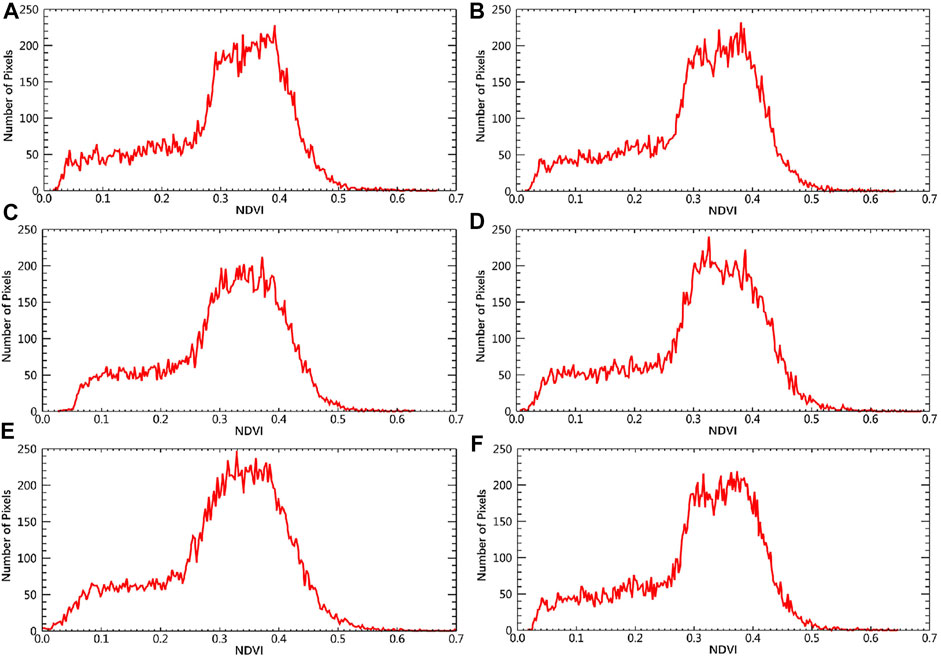
FIGURE 7. NDVI distribution of different fused images (A) MS image (B) Pansharpening fused image (C) HPF fused image (D) GS fused image (E) PCA fused image (F) NND fused image.

TABLE 2. NDVI of the fused image.
According to the visual effect, the spectral curve of vegetation and bare land, and the distribution of NDVI, we found that the NND fusion method is superior to the other four fusion methods for this study. It can keep the actual spectrum of bare land and vegetation and keep the actual distribution of NDVI. So, it is the best method for bare land and vegetation and selected as the fusion algorithm of this study. Moreover, the experiment also proves that calculating NDVI by suitable fused remote sensing images to monitor the vegetation is reasonable.
The study obtained the fused remote sensing image (Figures 8A–C), the maps of vegetation coverage (Figures 8D–F), and the maps of vegetation change (Figures 8G–I) of the Baige landslide. We can judge whether the landslide is sliding or not through the visual interpretation of fusion image, qualitative and quantitative study of vegetation coverage. For landslides with a long creep distance, we can outline the boundary of the landslide according to the change of vegetation coverage and judge the creep distance of the landslide.
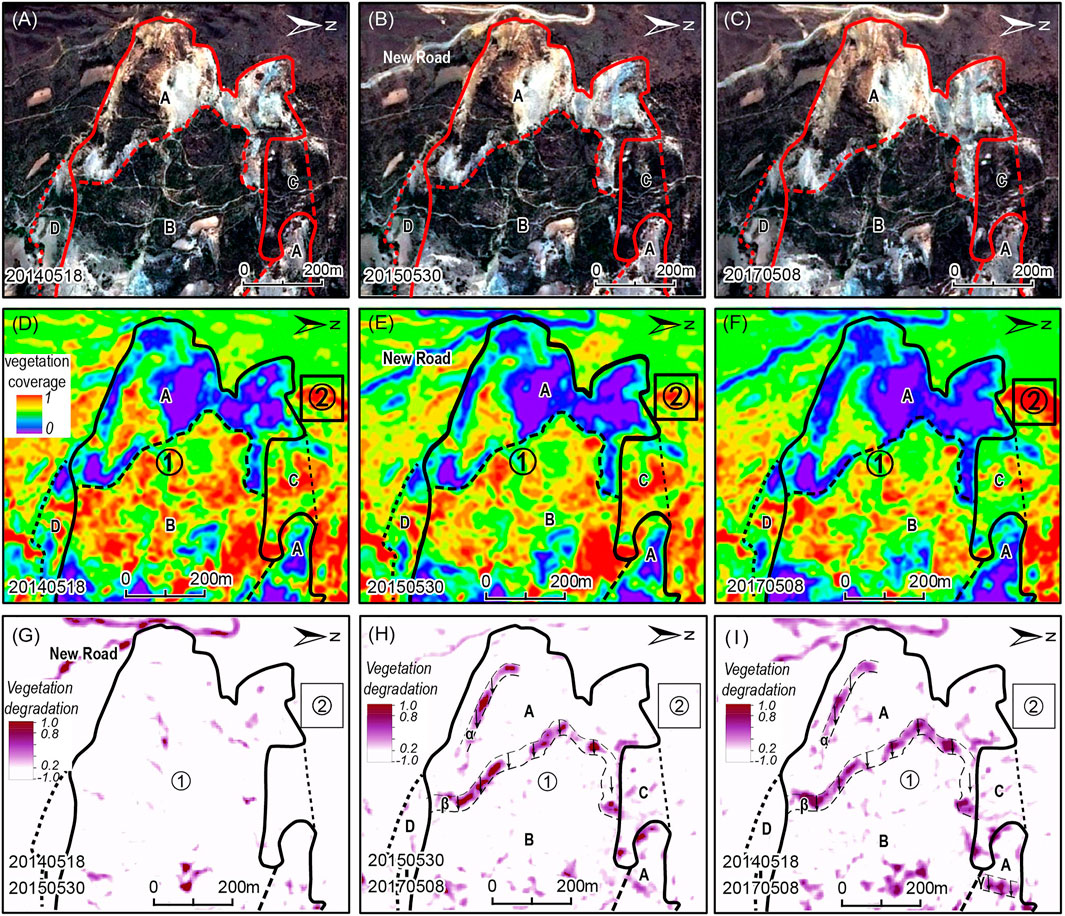
FIGURE 8. Remote sensing data and vegetation coverage map of Baige landslide (A) SPOT-6 image of May 18, 2014 (B) SPOT-7 image of May 30, 2015 (C) SPOT-7 image of May 8, 2017 (D) Vegetation coverage map of May 18, 2014 (E) Vegetation coverage map of May 30, 2015 (F) Vegetation coverage map of May 8, 2017 (G) Vegetation coverage change map of 2014–2015 (H) Vegetation coverage change map of 2015–2017 (I) Vegetation coverage change map of 2014–2017.
The range of bare land and the landslide boundary can be identified from the remote sensing image. The solid black line in Figure 3 is the landslide boundary, which is consistent with the first landslide boundary of the Baige landslide designated by the State Key Laboratory of Geohazard Prevention and Geoenvironment Protection (2018) (http://www.sklgp.cdut.edu.cn/info/1018/2247.htm). Moreover, the creep history can be determined according to the road displacement within the landslide (as shown in Figure 3).
The vegetation coverage change in the study area with time has significant spatial heterogeneity. It indicates that the vegetation in the study area is disturbed by the uneven distribution of influencing factors. We think that the main influencing factor may be landslide creep, according to the displacement of the road in Figures 8A–C. Therefore, the vegetation anomaly area at the middle part of the study area is the landslide-prone area that needs to be paid attention to. The change of vegetation coverage on both sides of the study area is complex. Therefore, we further divided the study area according to Figures 8A–C. The study area was divided into four zones: A-D. Area A is the back scarp of the landslide, where the bedrock is exposed because of the previous sliding. Area B is the main sliding area of the landslide, where the vegetation is still preserved. There is a significant boundary between area A and area B. It can be used as a marker for monitoring the creep distance of the landslide. Area C and area D are located out of the first landslide area and may be disturbed by the main landslide area. Area C had been creeping since 2014, and it slid in the second landslide. There are significant cracks on the left side of area D caused by the earlier sliding. After that, area D tends to be stable. There is still no sliding in the second landslide, which can be used as a reference area for the study of area C.
The change of vegetation coverage can be used to monitor the landslide creep. As the reference, the vegetation coverage in the reference area (area ②), which is unlikely to slide, decreased from 2014 to 2015 and then increased from 2015 to 2017. It is regarded as the background value of the vegetation coverage change. Before the first landslide, the vegetation coverage of area B decreased significantly, and the creep of the landslide can be identified. The scope of area A gradually expanded with time. It means that area A and area B, which compose area ① (landslide area), are dangerous. The vegetation coverage of area C has decreased before the first landslide. According to the displacement of roads in area C, this area has crept from 2014. It means that area C is also dangerous. Then this area slid in the second landslide. Vegetation coverage change of area D is not significant before the first landslide, which means the danger of area D is not high. Area D did not slide in the first and second landslides (Ouyang et al., 2019).
It is not intuitive to show the creep of landslides only through the change of vegetation coverage. So, we calculated the vegetation coverage difference in 2014–2017. The negative value indicates the increase of vegetation coverage, and the positive value indicates the decrease of vegetation coverage. According to the vegetation coverage change in the area ② (reference area), we think that the vegetation coverage change at 0–0.2 is normal and reasonable in 2014–2017. Because the area ② is in the natural state and unlikely to be disturbed by landslides, human activities, and other interference factors, we use a 0.2 reduction of vegetation as the threshold of the vegetation coverage change in 2014–2017. When the difference of vegetation coverage is between −1 and 0.2, it means that the vegetation is in the natural state or vegetation coverage is increasing. The difference map of vegetation coverage was counted, and the results are shown in Table 3. As time goes on, the proportion of vegetation coverage differences between −1 and 0.2 decreases by more than 10%; the proportion of vegetation coverage difference between 0.2 and 0.8 increased rapidly. In this study, the difference map was colored with pseudo color at an interval of 0.2. The areas in the natural state or with increasing vegetation coverage or are set as colorless. We obtained maps of vegetation coverage difference in 2014–2015 (Figure 8G), 2015–2017 (Figure 8H), and 2014–2017 (Figure 8I). The vegetation coverage of areas not affected by landslides increases or remains unchanged (e.g. area ②), while the vegetation coverage of the landslide area decreases significantly (e.g. areas A, B, C).
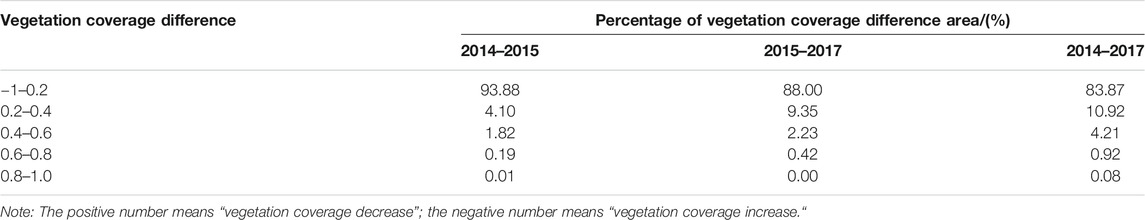
TABLE 3. Statistics of vegetation coverage difference.
The road construction caused the abnormal decrease of vegetation coverage in the upper part of the study area (Figure 8I). Moreover, according to the scope of vegetation coverage reduction area, the shape of the creeping landslide can be roughly outlined (Figure 8I). Although area D has bare land and its vegetation coverage is low (Figures 8D–F), the vegetation coverage change is similar to that of the background value, which contrasts with that of area C (Figure 8I). Area C and D did not slide in the first landslide, but area C slid in the second landslide. The decrease of vegetation coverage in 2014–2015 is far smaller than that in 2015–2017. Therefore, the creep distance of the landslide in 2014–2015 is far less than that in 2015–2017. At the same time, there are three significant strips α, β, and γ in the region, respectively corresponding to the exposed area of the back scarp of the landslide mass. According to the width of strips α, β, and γ in the east direction, we estimate that the creep distance of the three strips is roughly the same, about 50 m.
In this study, the displacement of the landslide caused the vegetation coverage change. With the increase of the displacement, the vegetation coverage change became more and more significant. Vegetation coverage change in the remote sensing data had a spatio-temporal correlation with the landslide creep before the landslide occurred (Figure 8).
This study is compared with other studies employing multiple methods for validation. In the Baige landslide, Ding et al. (2021) identified the active landslide region with a mass advancing motion from west to east (i.e., from up to down). It is consistent with the local topography. The spatial heterogeneity in the displacement velocity field is significant. So, the main landslide body can divide into several blocks. Area B, where the vegetation coverage change is significant, is the dominant deformation area. The State Key Laboratory of Geohazard Prevention and Geoenvironment Protection (2018) (Figure 6) also found that the landslide slid intermittently in blocks and grades since 2011 (http://www.sklgp.cdut.edu.cn/info/1018/2247.htm). Liu et al. (2020) found that the cumulative deformations of area B in the satellite line of sight direction and the azimuth direction reached −60.2 and 12.6 m, respectively. Xiong et al. (2020) found that area B has the maximum average displacement velocity, and its largest horizontal deformation rate exceeds 5.8 m/yr. The sliding speed became faster after January 15, 2017. It shows that the result of this study is consistent with other studies. The change of vegetation coverage can be used to identify potential landslides in the area with dense vegetation.
The phenomenons of vegetation change before landslides are common in the mountainous area of southwest China, such as the Xinmo village landslide. The Xinmo village landslide is a ridge-top landslide on June 24, 2017 in Maoxian county, Sichuan Province (Yin et al., 2017). This area has dense vegetation coverage and may be affected by the Diexi earthquake in 1933, the Pingwu-Songpan earthquake in 1976, and the Wenchuan earthquake in 2008. A previous study found that the vegetation change also exited before the Xinmo village landslide (Guo et al., 2020).
In the previous study, the inherent relationship between the vegetation change and the creep of the Xinmo village landslide was detected by high-resolution optical remote sensing images. In the upper landslide area, the vegetation coverage affected by the creep of landslide declined from 2014 to 2016. With the distance from the bare land edge of Xinmo village landslide increasing, the smaller the effect of landslide creep is, the better the status of vegetation gradually becomes. As time goes on, the more significant the impact of landslide creep is, the worse the vegetation becomes. In the middle potential impact area, the vegetation coverage around the springs and gullies declines with the more significant effect of landslide creep as the landslide time approaches. The vegetation change of the upper landslide area and the middle potential impact area has an evident spatio-temporal correlation with the landslide creep.
It proves that the phenomenon of vegetation change in the landslide creep stage is universal and can be detected by high-resolution optical remote sensing images. For potential landslides in large-scale earthquake-affected areas, this monitoring method is robust and can be used for preliminary investigations. Then it can combine with visual interpretation, SAR, and other techniques for further confirmation in the key areas.
The method is mainly used in large-scale surveys after earthquakes, especially in poor accessible high-mountain areas. The field investigation and GPS data may not be effectively used in poorly accessible areas, and even SAR data cannot be obtained in these areas with dense vegetation. It monitors landslide-prone areas economically and effectively in the long-term natural evolution, which applies to the case without significant environmental change, such as no earthquake event or no rare heavy rain event. This method will be used in a large range and at a low cost as a valuable supplement to the GPS and SAR. If there are earthquakes and rare heavy rain in natural evolution or this is a key area, we will consider combining it with GPS, SAR, and other methods. The fusion technology of optical remote sensing images and SAR images can be used to improve the method.
In the future, Sentinel-2A/B remote sensing images widely used in the study of landslides (Guo et al., 2021) can also be used as a new data source. It has the advantages of free access, short revisit cycle, high spatial resolution, and red edge band, which usually be used to monitor vegetation. Sentinel-2A/B remote sensing images have great potential for the application of this method. Moreover, this method can detect changes over time-series images in a larger range and a longer time, combined with the machine learning method.
This study can validate the indicative effect of vegetation change in the landslide creep stage. The changes in environmental conditions caused by the creep of landslides impact the vegetation growth, which can be identified by the optical image fusion of multi-temporal remote sensing data. The change of vegetation coverage can reflect the landslide creep.
The vegetation coverage in the back scarp area and the main sliding area of the Baige landslide significantly decreased compared to that in the normal area. The extent of vegetation coverage reduction can reflect the degree of creep, and the reduced area can show the outline of the potential landslide area. The vegetation change has an evident spatio-temporal correlation with the landslide creep in the Baige landslide.
This study can provide a new light to monitor potential landslides in high-mountain regions after the earthquake. For potential landslides in large-scale high-mountain areas, this method can be used to preliminary investigations economically and effectively. Then for the key areas, it can combine with visual interpretation, SAR, and other techniques for further confirmation.
The original contributions presented in the study are included in the article/Supplementary Material, further inquiries can be directed to the corresponding author.
XG and QG designed this study; XG analyzed the data, and wrote the manuscript; QG and ZF polished the paper. All authors approved the final version of the manuscript.
This research was funded by the National Natural Science Foundation of China (grant number 61771470) and the Strategic Priority Research Program of the Chinese Academy of Sciences (grant number XDA19010401).
The authors declare that the research was conducted in the absence of any commercial or financial relationships that could be construed as a potential conflict of interest.
All claims expressed in this article are solely those of the authors and do not necessarily represent those of their affiliated organizations, or those of the publisher, the editors and the reviewers. Any product that may be evaluated in this article, or claim that may be made by its manufacturer, is not guaranteed or endorsed by the publisher.
The authors are grateful for the helpful discussion with Weiheng Zhang of the Institute of Geology, China Earthquake Administration. We would like to thank the editor and reviewers for their valuable input, time, and suggestions to improve the quality of the manuscript.
Ambraseys, N. N., and Douglas, J. (2004). Magnitude calibration of north Indian earthquakes. Geophys. J. Int. 159, 165–206. doi:10.1111/j.1365-246X.2004.02323.x
An, H., Ouyang, C., and Zhou, S. (2021). Dynamic process analysis of the Baige landslide by the combination of DEM and long-period seismic waves. Landslides 18 (3), 1625–1639. doi:10.1007/s10346-020-01595-0
Bianchini, S., Raspini, F., Solari, L., Del Soldato, M., Ciampalini, A., Rosi, A., et al. (2018). From Picture to Movie: Twenty Years of Ground Deformation Recording over Tuscany Region (Italy) with Satellite InSAR. Front. Earth Sci. 6, 177. doi:10.3389/feart.2018.00177
Binet, R., and Bollinger, L. (2005). Horizontal coseismic deformation of the 2003 Bam (Iran) earthquake measured from SPOT-5 THR satellite imagery. Geophys. Res. Lett. 32 (L02307), 1–4. doi:10.1029/2004gl021897
Chen, J., Chen, Y. H., He, C. Y., and Shi, P. J. (2001). Sub-pixel model from vegetation fraction estimation based on land cover classification. J. Remote Sensing 5 (6), 416–422.
Clayton, D. G. (1971). Gram-Schmidt orthogonalization. Appl. Stat. 20 (3), 355–338. doi:10.2307/2346771
Ding, C., Feng, G., Liao, M., Tao, P., Zhang, L., and Xu, Q. (2021). Displacement history and potential triggering factors of Baige landslides, china revealed by optical imagery time series. Remote Sensing Environ. 254, 112253. doi:10.1016/j.rse.2020.112253
Ding, Y. L., Lei, S. G., Bian, Z. F., and Qie, C. L. (2013). Distortion-resistant ability of Tetraena mongolica root at the mining subsidence area. J. China Univ. Mining Tech. 42, 970–974+981. doi:10.13247/j.cnki.jcumt.2013.06.014
Dominguez, S., Avouac, J. P., and Michel, R. (2003). Horizontal coseismic deformation of the 1999 Chi-Chi earthquake measured from SPOT satellite images: Implications for the seismic cycle along the western foothills of central Taiwan. J. Geophys. Res. 108 (B2), 1–19. doi:10.1029/2001JB000951
Du, T., Bi, Y. L., Zou, H., Zheng, J. L., and Liu, S. (2013). Effects of surface cracks caused by coal mining on microorganisms and enzyme activities in rhizosphere of Salix psammophila. J. China Coal Soc. 38 (12), 2221–2226. doi:10.13225/j.cnki.jccs.2013.12.0016
Fan, Q. S., Tang, C. L., Chen, Y., and Zhang, X. D. (2006). Applications of GPS and InSAR in monitoring of landslide studies. Surv. Mapp. Sci. 031 (5), 60–62. doi:10.3771/j.issn.1009-2307.2006.05.019
Fan, X., Xu, Q., Alonso-Rodriguez, A., Subramanian, S. S., Li, W., Zheng, G., et al. (2019). Successive landsliding and damming of the Jinsha River in eastern Tibet, China: prime investigation, early warning, and emergency response. Landslides 16, 1003–1020. doi:10.1007/s10346-019-01159-x
Fan, X., Yang, F., Siva Subramanian, S., Xu, Q., Feng, Z., Mavrouli, O., et al. (2020). Prediction of a multi-hazard chain by an integrated numerical simulation approach: the Baige landslide, Jinsha River, China. Landslides 17 (1), 147–164. doi:10.1007/s10346-019-01313-5
Guo, X., Fu, B., Du, J., Shi, P., Li, J., Li, Z., et al. (2021). Monitoring and Assessment for the Susceptibility of Landslide Changes after the 2017 Ms 7.0 Jiuzhaigou Earthquake Using the Remote Sensing Technology. Front. Earth Sci. 9, 633117. doi:10.3389/feart.2021.633117
Guo, X. Y., Guo, Q., and Feng, Z. K. (2020). Relationship between landslide creep and vegetation anomalies in remote sensing images. J. Remote Sensing 24 (6), 776–786. doi:10.11834/jrs.20208330
Jia, H., Wang, Y., Ge, D., Deng, Y., and Wang, R. (2020). Improved offset tracking for predisaster deformation monitoring of the 2018 Jinsha River landslide (Tibet, China). Remote Sensing Environ. 247, 111899. doi:10.1016/j.rse.2020.111899
Khattak, G. A., Owen, L. A., Kamp, U., and Harp, E. L. (2010). Evolution of earthquake-triggered landslides in the Kashmir Himalaya, northern Pakistan. Geomorphology 115 (1-2), 102–108. doi:10.1016/j.geomorph.2009.09.035
Leprieur, C., Verstraete, M. M., and Pinty, B. (1994). Evaluation of the performance of various vegetation indices to retrieve vegetation cover from AVHRR data. Remote Sensing Rev. 10 (10), 265–284. doi:10.1080/02757259409532250
Li, K., Sun, Y. D., Jiang, B. H., Guo, J. J., Wang, Y. Q., and Yue, D. X. (2014). Analysis on spatial-temporal patterns of the vegetation coverage and landslides in Bailongjiang River Basin based on the Dimidiate Pixel Model. J. Lanzhou Univ. (Natural Sciences) 50 (3), 376–382. doi:10.13885/j.issn.0455-2059.2014.03.013
Li, M. M. (2003). The Method of Vegetation Fraction Estimation by Remote Sensing. [Beijing: Institute of Remote Sensing Applications, Chinese Academy of Sciences. [M.D. thesis].
Liu, X., Zhao, C., Zhang, Q., Lu, Z., and Li, Z. (2020). Deformation of the Baige Landslide, Tibet, China, Revealed through the Integration of Cross‐Platform ALOS/PALSAR‐1 and ALOS/PALSAR‐2 SAR Observations. Geophys. Res. Lett. 47 (3), 1–8. doi:10.1029/2019GL086142
María, G. A., José, L. S., Catalan, R. G., and García, R. (2004). Fusion of multispectral and panchromatic images using improved IHS and PCA mergers based on wavelet decomposition. IEEE Trans. Geosci. Remote Sensing. 42 (6), 1291–1299. doi:10.1109/TGRS.2004.825593
Michel, R., and Avouac, J. P. (2002). Deformation due to the 17 August 1999 Izmit, Turkey, earthquake measured from SPOT images. J. Geophys. Res. 107 (B4), ETG 2-1–ETG 2-6. doi:10.1029/2000JB000102
Ouyang, C., An, H., Zhou, S., Wang, Z., Su, P., Wang, D., et al. (2019). Insights from the failure and dynamic characteristics of two sequential landslides at Baige village along the Jinsha River, China. Landslides 16, 1397–1414. doi:10.1007/s10346-019-01177-9
Ranchin, T., and Wald, L. (2000). Fusion of high spatial and spectral resolution images: The ARSIS concept and its implementation. Photogrammetric Eng. Remote Sensing 66, 49–61. doi:10.1002/2014WR016042
SSB (1995). Chinese historical catalog from 2300 B.C to 1911 A. Beijing, China: D. Seismological Press.
State Key Laboratory of Geohazard Prevention and Geoenvironment Protection (2018). “Continuous release: Since 2011, the maximum downslope displacement of the Baige landslide area in Jinsha River is close to 50 meters,” in State Key Laboratory of Geohazard Prevention and Geoenvironment Protection Physics Web. http://www.sklgp.cdut.edu.cn/info/1018/2247.htm (Accessed on October 17, 2018).
Sun, W., Chen, B., and Messinger, D. W. (2014). Nearest-neighbor diffusion-based pan-sharpening algorithm for spectral images. Opt. Eng. 53 (1), 013107. doi:10.1117/1.oe.53.1.013107
Wang, G. (2011). GPS Landslide Monitoring: Single Base vs. Network Solutions - A case study based on the Puerto Rico and Virgin Islands Permanent GPS Network. J. Geodetic Sci. 1 (3), 191–203. doi:10.2478/v10156-010-0022-3
Wang, G. J., Xie, M. W., Qiu, C., and Jiangqi, Z. L. (2010). Application of D-InSAR technology in large-scale landslide monitoring. Geotechnical Mech. 4, 333–340. doi:10.16285/j.rsm.2010.04.010
Wang, L. C., Wen, M. S., Feng, Z., Sun, W. F., Wei, Y. J., Li, J. F., et al. (2019). Researches on the Baige landslide at Jinshajiang River, Tibet, China. Chin. J. Geol. Hazard Control. 30 (01), 1–9. doi:10.16031/j.cnki.issn.1003-8035.2019.01.01
Xiong, Z. Q., Feng, G. C., Feng, Z. X., Miao, L., Wang, Y. D., Yang, D. J., et al. (2020). Pre- and post-failure spatial-temporal deformation pattern of the Baige landslide retrieved from multiple radar and optical satellite images. Eng. Geo. 279, 105580. doi:10.1016/j.enggeo.2020.105880
Xu, Q., Li, W. L., Dong, X. J., Xiao, X. X., Fan, X. M., and Pei, X. J. (2017). The Xinmocun landslide on 24 June , 2017 in Maoxian, Sichuan: characteristics and failure mechanism. Chin. J. Rock Mech. Eng. 36 (11), 2612–2628. doi:10.13722/j.cnki.jrme.2017.0855
Yang, Z., Li, Z., Zhu, J., Preusse, A., Yi, H., Hu, J., et al. (2017). Retrieving 3-d large displacements of mining areas from a single amplitude pair of SAR using offset tracking. Remote Sensing 9 (4), 338. doi:10.3390/rs9040338
Yin, Y. P., Wang, W. P., Zhang, N., Yan, J. K., Wei, Y. J., and Yang, L. W. (2017). Long runout geological disaster initiated by the ridge-top rockslide in a strong earthquake area: A case study of the Xinmo landslide in Maoxian County, Sichuan Province. Geology China 44 (5), 827–841.
Zhang, Y., Guo, C., Qu, Y., and Song, Y. (2011). Engineering geological properties of altered rocks and implications for railway construction in the Sanjiang orogenic belt, Southwest China. Bull. Eng. Geol. Environ. 70 (1), 143–152. doi:10.1007/s10064-010-0294-y
Zhang, Y., and Mishra, R. K. (2012). A review and comparison of commercially available pan-sharpening techniques for high resolution satellite image fusion. Geosci. Remote Sensing Symp. (Igarss) 2012 IEEE Int., 182–185. doi:10.1109/IGARSS.2012.63516072012
Zhang, Y. S., Ba, R. J., Ren, S. S., and Li, Z. L. (2020). An analysis of geo-mechanism of the Baige landslide in Jinsha River, Tibet. Geology China 47 (6), 1637–1645. doi:10.12029/gc20200603
Zhao, Y. S. (2013). “Geology remote sensing,” in Principles and methods of Remote sensing application. 2nd. (Beijing: Science Press), Vol. 16, 487–488.
Zhong, Z., Chen, N. S., Ni, H. Y., Liu, E. L., and Han, Z. (2021). Engineering Geology and Hydrogeological Characteristics of Jinsha River in Baige Landslide. Sci. Tech. Eng. 21 (13), 5262–5269.
Keywords: post-seismic landslides, vegetation change, landslide creep, high-mountain regions, optical remote sensing technique
Citation: Guo X, Guo Q and Feng Z (2021) Detecting the Vegetation Change Related to the Creep of 2018 Baige Landslide in Jinsha River, SE Tibet Using SPOT Data. Front. Earth Sci. 9:706998. doi: 10.3389/feart.2021.706998
Received: 19 May 2021; Accepted: 03 August 2021;
Published: 13 August 2021.
Edited by:
Tolga Gorum, Istanbul Technical University, TurkeyReviewed by:
Milad Janalipour, K. N. Toosi University of Technology, IranCopyright © 2021 Guo, Guo and Feng. This is an open-access article distributed under the terms of the Creative Commons Attribution License (CC BY). The use, distribution or reproduction in other forums is permitted, provided the original author(s) and the copyright owner(s) are credited and that the original publication in this journal is cited, in accordance with accepted academic practice. No use, distribution or reproduction is permitted which does not comply with these terms.
*Correspondence: Qing Guo, Z3VvcWluZ0BhaXJjYXMuYWMuY24=
Disclaimer: All claims expressed in this article are solely those of the authors and do not necessarily represent those of their affiliated organizations, or those of the publisher, the editors and the reviewers. Any product that may be evaluated in this article or claim that may be made by its manufacturer is not guaranteed or endorsed by the publisher.
Research integrity at Frontiers
Learn more about the work of our research integrity team to safeguard the quality of each article we publish.