 Lavkush Kumar Patel
 Parmanand Sharma
 Ajit Singh
 Sunil Oulkar
 Bhanu Pratap
- National Centre for Polar and Ocean Research, Ministry of Earth Sciences, Government of India, Vasco-da-Gama, India
A large number of glaciers in the Hindu-Kush Himalaya are covered with debris in the lower part of the ablation zone, which is continuously expanding due to enhanced glacier mass loss. The supraglacial debris transported over the melting glacier surface acts as an insulating barrier between the ice and atmospheric conditions and has a strong influence on the spatial distribution of surface ice melt. We conducted in-situ field measurements of point-wise ablation rate, supraglacial debris thickness, and debris temperature to examine the thermal resistivity of the debris pack and its influence on ablation over three glaciers (Bara Shigri, Batal, and Kunzam) in Chandra Basin of Western Himalaya during 2016–2017. Satellite-based supraglacial debris cover assessment shows an overall debris covered area of 15% for Chandra basin. The field data revealed that the debris thickness varied between 0.5 and 326 cm, following a spatially distributed pattern in the Chandra basin. The studied glaciers have up to 90% debris cover within the ablation area, and together represent ∼33.5% of the total debris-covered area in the basin. The supraglacial debris surface temperature and near-surface air temperature shows a significant correlation (r = > 0.88, p = < 0.05), which reflects the effective control of energy balance over the debris surface. The thermal resistivity measurements revealed low resistance (0.009 ± 0.01 m2°C W−1) under thin debris pack and high resistance (0.55 ± 0.09 m2°C W−1) under thick debris. Our study revealed that the increased thickness of supraglacial debris significantly retards the glacier ablation due to its high thermal resistivity.
Introduction
In the Hindu Kush Himalayan (HKH) region, about 13% of the glacierized area and ∼40% of the ablation area is debris-covered (Scherler et al., 2011; Bolch et al., 2012), which is expanding annually due to accelerated glacier mass loss (Shukla and Qadir, 2016). The increased debris cover over the glaciers has a significant impact on the thermodynamics of the glaciers in the high Himalaya (Banerjee and Shankar, 2013; Rowan et al., 2020). Debris cover influences the ablation rate by regulating the heat flux from surface to glacier ice, thus influencing the glacier response to climate change (Nicholson et al., 2018). Recent studies on the impact of supraglacial debris cover on ablation have shown very contrasting results like higher melting (Pellicciotti et al., 2015; Steiner et al., 2019), no influence (Muhammad et al., 2020), and lower melting (Pratap et al., 2015; Patel et al., 2016; Sharma et al., 2016; Nicholson et al., 2018). Findings of enhanced melt have been attributed to the formation of supraglacial ponds, ice cliffs, and englacial hydrological processes (Benn et al., 2012; Fyffe et al., 2014; Buri et al., 2016). Debris cover accelerates water ponding and ice cliff (thermokarst erosion) formation over the glacier surface (Röhl, 2008) and can enhance heat transfer at the water-ice interface. However, several researchers have observed reduced melting and explained a reduction in heat transfer from thick debris (Pratap et al., 2015; Patel et al., 2016; Sharma et al., 2016; Nicholson et al., 2018). The heat transfer from debris surface to debris ice interface zone largely depends upon the thermal characteristics of the debris pack (Mihalcea et al., 2006; Lambrecht et al., 2011; Rowan et al., 2017) and atmospheric conditions (Collier et al., 2015). The thermal characteristics of the debris pack mainly depends on debris composition, its thickness, and its moisture content and is explained in terms of thermal resistance and conductivity. The thermal resistance is defined as the ratio of debris thickness and thermal conductivity of a debris layer. Thermal resistance is an important index to understand the evolution of several glaciers (Nakawo and Young, 1982; Suzuki et al., 2007; Lambrecht et al., 2011; Chand and Sharma, 2015). This index is obtained from surface temperature and heat balance within the debris layers. Since it is difficult to determine the thermal resistance of a layer of unknown material directly in the field, it was suggested that the surface temperature of the debris layer may be used for estimating the thermal resistance (Suzuki et al., 2007).
However, the thickness of a debris pack is crucial for controlling the impact of atmospheric warming and energy flux to the ice through debris (Nicholson and Benn, 2006). Sensitivity experiments have shown that an increase in debris thickness by 0.035 m can offset about 1°C of atmospheric warming (Fyffe et al., 2014), highlighting the importance of debris pack for protection of glacier ice. A thick debris pack with high moisture content effectively reduces the ablation by lowering the heat transmission by reducing the thermal diffusivity of the saturated debris layers (Juen et al., 2013; Collier et al., 2014). It is therefore imperative to investigate debris composition, moisture content and thickness, and quantify their effect on the resulting energy flux of the debris layer.
Analyzing the energy balance and ablation pattern of debris-covered glaciers has been a point of debate since 1980s’ where a simplified model was used for estimating the ablation pattern under thick debris by using thermal properties and meteorological parameters (Nakawo and Young, 1981; Nakawo and Takahashi, 1982; Nakawo and Young, 1982). Later, several researchers have modified these models by incorporating degree day factors or debris surface temperatures (Haidong et al., 2006; Mihalcea et al., 2006). The DEB-Model (Reid and Brock, 2014) and Crocus-DEB (Lejeune et al., 2013) are the only melt models that attempt a process-resolving simulation of energy fluxes at a debris-covered ice surface. Most of the studies were conducted over a smaller area and for shorter periods. Some satellite observations were also used to define the thermal resistance or characteristics of the debris-covered glaciers (Suzuki et al., 2007; Zhang et al., 2011; Foster et al., 2012; Rounce et al., 2015), which have emphasized the need for improved understanding of debris temperature and thermal properties. There are very few field data available on debris cover, thickness, and associated behavior. The debris pack surface, subsurface temperature, and thermal resistance variability are important to understand the underlying processes and debris behavior.
In this study, the thermal characteristics of supraglacial debris over three debris-covered glaciers in the Chandra basin (Western Himalaya) were examined using in-situ field observations. The surface temperature and ablation data were collected alongside debris thicknesses, at various altitudinal zones, during the period 2016-17. The thermal resistance of the debris pack was estimated using the debris cover surface temperature and ablation rate. The aim of the study is to analyze the diurnal and seasonal variability in surface temperature and thermal resistance of debris cover to understand the control of supraglacial debris on melting in the extensive debris-covered glaciers of the Western Himalaya. This type of analysis is useful for the empirical parameterisation of numerical models that may focus on predicting the ongoing and future climate changes in the HKH region.
Study Area and Selected Glaciers
In this study, in-situ observations were carried out over three glaciers (Bara Shigri, Batal, and Kunzam) in the Chandra basin of Western Himalaya. It is a major sub-basin of the Indus river basin, and lies within the central crystalline axis of the PirPanjal range in Lahaul-Spiti, Himachal Pradesh, India (Figure 1). The Chandra basin has 201 glaciers (Sangewar and Shukla, 2009), spread over an area of 2,440 km2, and about 15% of glacier area is covered by debris with varying thicknesses (Figure 1). It represents a highly rugged terrain with high mountains and deeply dissected valleys (Patel et al., 2017). The basin is influenced by the Indian monsoon in summer and westerlies in winter (Bookhagen and Burbank, 2006). The Bara Shigri is the largest glacier (113.8 km2) in the basin, and is also one of the biggest glaciers in the Indian Himalaya. This glacier has an average slope of 12° and flows towards the NW direction. The Batal Glacier covers an area of 4.35 km2 with a flowing direction towards the NE and the average slope of the glacier is 15°. The Kunzam Glacier covers an area of 0.48 km2 with a mean slope of 15° and it flows towards the N. Together, these three glaciers are the major debris-covered glaciers of the Chandra basin and represent almost ∼21.1% of overall glacier area and ∼33.5% of the debris-covered glacierized region of the basin. The debris layer comprises soil, rock fragments, pebbles, cobbles and big boulders with a hummocky [Unified Soil Classification System, USCS (ASTM D2487)] glacier surface.
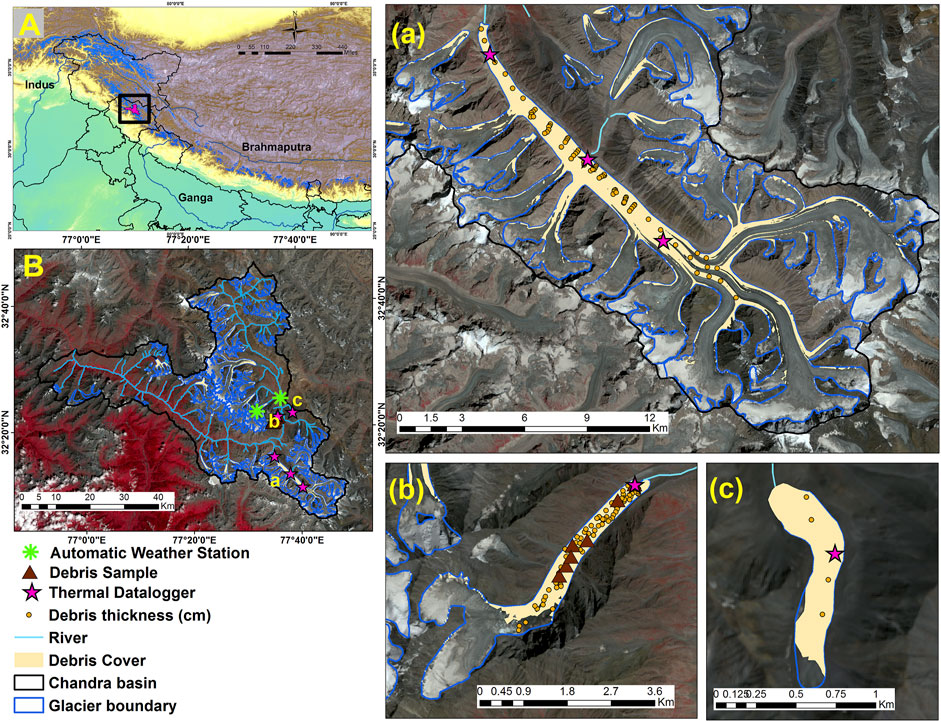
FIGURE 1. (A) Location map of Chandra basin (B) Glacierized terrain, debris cover, studied glaciers, automatic weather stations and various observational sites. The distribution of debris cover using remote sensing data (yellow shade) and in-situ debris sample points (brown dots) over the studied glaciers are marked along with thermal data logger sites installed at (a) Bara Shigri, (b) Batal, and (c) Kunzam Glaciers. (Background for inset map A is SRTM DEM and others are Sentinel 2B satellite image).
Data Collection and Methodology
Debris-Cover Mapping, Thickness, and Geological Characteristics
To analyze the thermal characteristics of the glacial debris over a glacierized basin, it was important to understand its spatial extent, hypsometry, thickness, and geological characteristics in the basin. The spatial extent and hypsometry were extracted by using Landsat 8 Operational Land Imager (OLI) satellite data and Advanced Spaceborne Thermal Emission and Reflection Radiometer, Global Digital Elevation Model Version 2 (ASTER GDEM V2), and the thickness and geological characteristics were explored by field observations and laboratory analysis. Detailed debris thickness measurements were carried out over the studied glaciers (Bara Shigri, Batal, and Kunzam) and additionally limited studies were undertaken over the Samudra Tapu, Sutri Dhaka, and Gepang Gath glaciers of Chandra basin (Supplementary Figure S1). The debris cover for the Chandra basin was mapped using Landsat 8 scene of the year 2016 acquired from the USGS website (https://earthexplorer.usgs.gov/). The Landsat scenes were pre-processed (atmospheric correction) converting the raw DN values to the top of atmosphere reflectance by using band multiplicative, additive rescaling factors and cosine corrections provided in the associated metadata file of the scene. Similarly, the brightness temperatures, were also converted from the thermal band (10) using band specific conversion constants (K1 and K2) from associated meta data file.
The corrected satellite datasets were used for the debris cover extraction using a semi-automated method. The semi-automated method uses band ratios (NIR, SWIR, and TIR bands) and the manually extracted glacier boundaries (Shukla et al., 2009; Alifu et al., 2015). Landsat 8 OLI scenes are 170 km by 183 km and consist of nine spectral bands (from visible through to SWIR) with a spatial resolution of 30 m (Bands 1 to 7 and 9). The spatial resolution for the panchromatic (Band 8) is 15 m, and for thermal bands (10 and 11), spatial resolution is 100 m. The ASTER GDEM V2 provides a comparable resolution, at 30 m, and with a quantified accuracy of ±2.3 m in the horizontal and ± 10 m in the vertical (Tachikawa, 2011). The manually extracted boundaries of 129 glaciers (566 km2 glacier area) from Chandra basin were used for debris extent estimation. The similar spectral response of the non-glacier surface and debris-covered glacier surface makes it difficult to delineate between the glacier and non-glacier area. In this situation, the thermal band helps to separate the periglacial and supraglacial debris (Alifu et al., 2015; Patel et al., 2017). The spectral response (i.e. reflectance) of supraglacial debris cover is low for the bands NIR, and SWIR compared to the clean ice. The hypsometry of glacier area and debris cover over the Chandra basin was extracted from the distribution of the debris cover and DEM. To accurately represent the complete debris cover of the Chandra basin, debris thickness was manually measured at more than 250 locations over the glaciers by removing the debris cover from the glacier surface to the ice-debris interface zone from 4,000 m asl to 5,000 m asl (Figure 2). There was some minor debris presence above 5,000 m asl, especially along the glacier margins, but this was not measured as the glacier flanks were visibly unstable. The big boulders and glaciers’ edges were avoided. The debris samples from the studied glaciers were also collected and analyzed for the identifying geological characteristics of the debris pack (Figures 1, 2). The debris sample/rock type sizes (Figures 2A–F) were classified based on the USCS and major minerals were identified by the petrographic study of the thin sections using a standard Petrological Microscope.
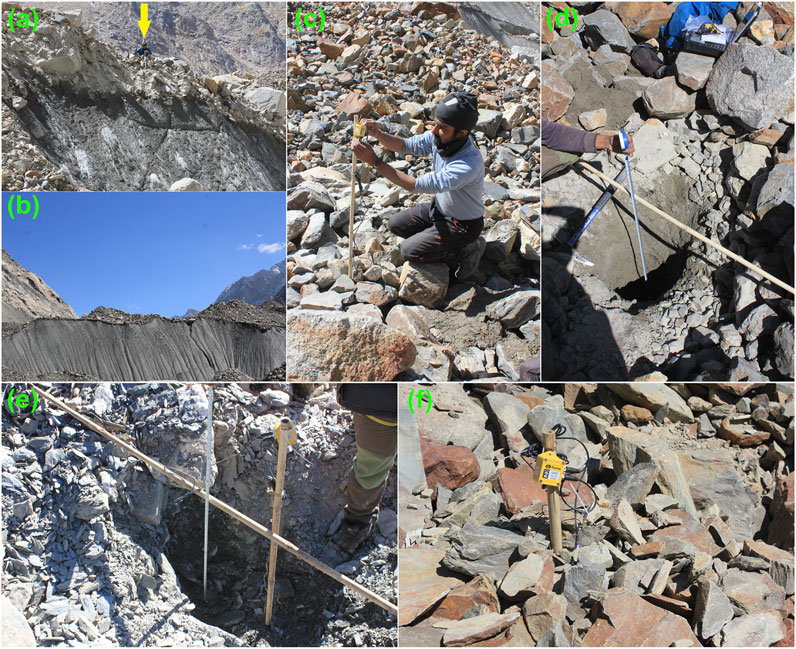
FIGURE 2. Field photographs of the observations on debris cover and installation of the thermal dataloggers over the debris-covered glaciers of Chandra Basin. (A) debris cover measurement over a ice cliff in Bara Shigri Glacier, (B) a big and wide (∼ 200 m long and ∼ 35 m thick) ice cliff depicting the debris -covered region and the thickness at the lower ablation zone of Bara Shigri Glacier, (C) installation of Tinytag thermal dataloggers at a fixed bamboo stake over Bara Shigri Glacier, (D) debris thickness measurement and sample collection, where the debris pack composition (boulders, cobbles, pebbles, at the upper layer while fine to coarse level sand at the lower layer) is clearly visible. (E) debris thickness measurement and sample collection over Kunzam Glacier, (F) Tinytag thermal data logger installation over Batal Glacier.
In-Situ Debris-Cover Temperature Measurements
To study the debris cover surface temperature, five thermal data loggers with sensors (Gemini Tinytag thermal data loggers model TGP 4520 and probe PB 5001) were installed over supraglacial debris along the central flowline. They were attached with bamboo stakes, and they continuously logged temperature data at 30 min intervals between September 2016 and October 2017 (Table 1). Many studies have used the same thermistor probes and dataloggers for temperature profiling for similar investigations of debris-covered glaciers in the Nepal Himalaya (Mihalcea et al., 2006; Brock et al., 2010; Nicholson and Benn, 2013; Rowan et al., 2021). The Tinytag datalogger (TGP 4520) has an accuracy of ± 0.4°C at 0°C, and two thermal probes can be connected into the logger unit. We fixed one probe at the debris surface and the second one at the debris-ice interface zone. To check the consistency of the loggers, pre-installation tests were conducted at the base camp (Himansh station, Lahaul-Spiti, Himachal Pradesh) and near the installation site over the glacier. Firstly, all the thermal data loggers were fixed within a 2 × 2 m plot for 30 min at the base camp Himansh station. Secondly, for each thermal data logger, before installation at supraglacial debris, the temperature data in the air were also checked for both the probes. In both cases, between sensor variability was less than 0.5°C. Three thermal data loggers and probes were installed over Bara Shigri, one at Batal and one at Kunzam Glacier. (Table 1; Figures 1, 2). In the Bara Shigri Glacier (5,200 m asl), both thermistor probes were at the debris surface due to thin debris (5 cm). In the Batal Glacier, during the ablation season (June 2017–September 2017), one of the probes of the Tinytag thermistor was fixed at the middle (∼30 cm) of the debris pack for subsurface temperature observations. The installed data loggers were retreived at the end of the ablation season (October 2017). One of the dataloggers (TG 4) was damaged (due to mutilation of probe wire) and malfunctioned. In addition, surface temperature (ice surface and bare ground) data were also collected from infrared sensors (Apogee SI-111) integrated at two installed Automatic Weather Stations (AWS) in this Chandra basin (Figure 1) and used for comparison and statistical analysis. The AWS data were also used for the meteorological analysis of the study area.
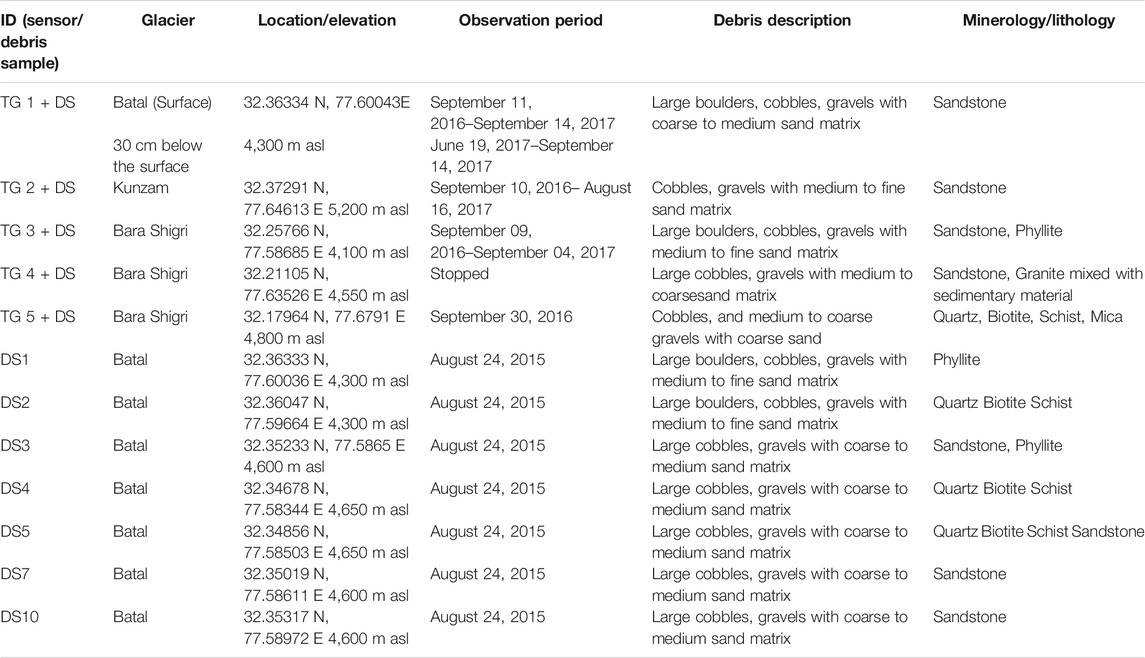
TABLE 1. Details of the spatial characteristics for the thermistor data loggers, and debris samples (DS) collected from selected glaciers of the Chandra Basin.
Thermal Resistance and Debris Thickness
The energy transfer in debris layers depends on the physical properties of the debris like grain size, lithology, and water content (Collier et al., 2014). Under the assumption of uniform debris conditions, heat transfer is controlled by thermal resistance. The thermal resistance of the debris cover is defined as the ratio between surface temperature
where thermal resistance R was estimated for the entire period with 30 min intervals by using the recorded
Where ht0 and ht1 are the exposed stake lengths at different periods and
Meteorological Observations
Apart from the measurements made over debris-covered surfaces, Meteorological data were collected at the Himansh station (4,052 m asl) and over Sutri Dhaka Glacier (4,864 m asl) (Figure 1). The AWS of the Himansh station is installed over flat open ground (off-glacier) with NE aspect (Figure 1) while the Sutri Dhaka AWS is located over clean ice in the upper ablation zone of Sutri Dhaka Glacier. Thus the glacier ice surface temperature (
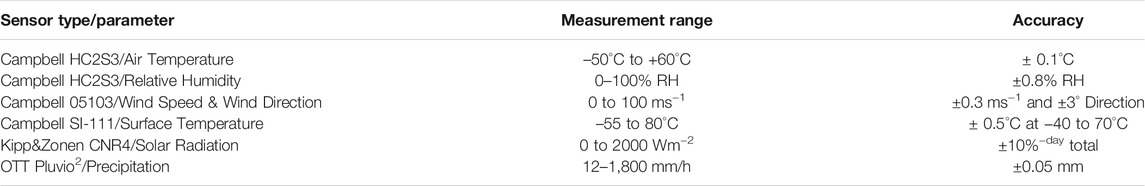
TABLE 2. The details of the AWS (Himansh station, Chandra Basin) sensors used in the study.
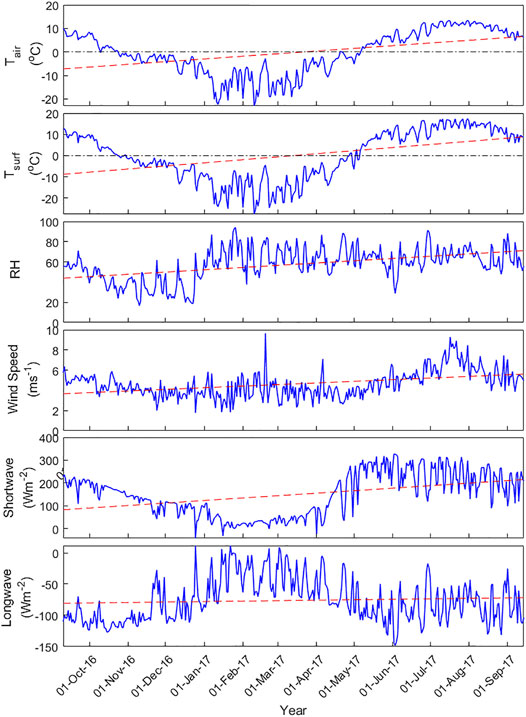
FIGURE 3. Daily mean meteorological (temperature, RH, Wind speed, Surface temperature) and radiation (Longwave and shortwave) parameters at Himansh station AWS for 2016-17. The dotted red line indicates the trend for the selected parameters within the observation period.
Results
Debris Cover Extent, Thickness, and Geological Characteristics
The semi-automated analysis of Landsat 8 data showed that a significant area (∼15% of glacier area) of the 129 glaciers from Chandra basin is debris-covered. Also, most of the debris-covered area (∼13%) lies below 5,200 m asl and only a small fraction lies above 5,200 m asl (Figures 1, 4A). Among the studied glaciers, 22.9% (26 km2) of Bara Shigri Glacier is debris-covered while 39.5% (1.72 km2) of Batal and 79.2% (0.38 km2) of Kunzam Glaciers is debris-covered. However, the ablation area of these glaciers is almost 90% debris-covered (Figure 1). The field observations over the major glaciers of the Chandra basin showed that the lower ablation zone and area near to lateral moraines of these glaciers are covered by thick debris (∼100 cm). The debris thickness over the Chandra basin glaciers was varying from 0.5 to 326 cm (Figure 5 and Supplementary Figure S1). The mean debris thickness (mean ± STD) was 48.4 ± 27.4 cm for the region below 4,400 m asl, 46.4 ± 19.5 cm at 4,400–5,000 m asl, and 1.2 ± 0.4 cm above 5,000 m asl (Figure 4B). Debris thickness followed a similar trend (thicker debris being found at lower elevations) over all the studied glaciers. The Bara Shigri Glacier showed a range of 0.5–200 cm debris thickness with a mean debris thickness of 32 ± 30 cm. The Batal Glacier had a mean debris thickness of 25 ± 25 cm, varying from 5 to 100 cm, and the Kunzam Glacier had a mean debris thickness of 51 ± 25 cm varying from 5 to 163 cm. These measurements fitted well with the summary of the debris thickness provided by Rounce et al. (2021) for world wide glaciers.
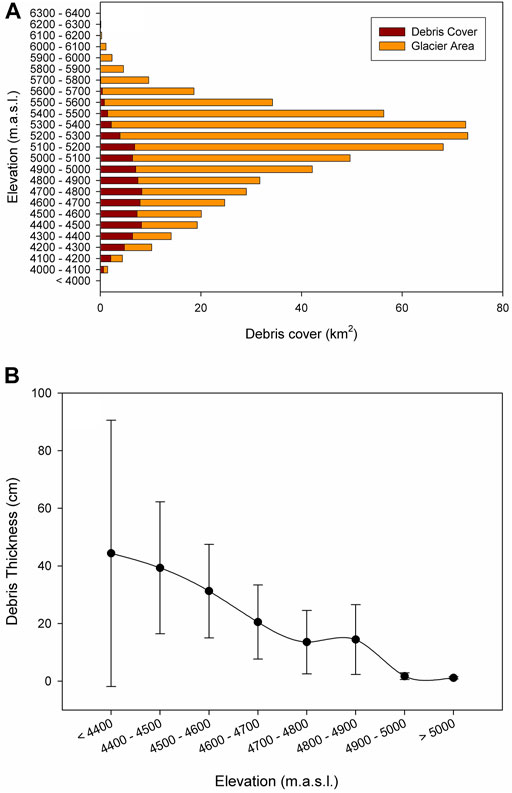
FIGURE 4. Distribution of the debris cover over the Chandra basin glaciers. (A) Hypsometric distribution of debris covers and glacier area. The major debris-covered glacierized region located <5,200 m asl (B) the debris thickness (mean ± SD) versus the altitude. Higher debris thickness >20 cm observed <4,700 m asl while thin debris layer >4,700 m asl.
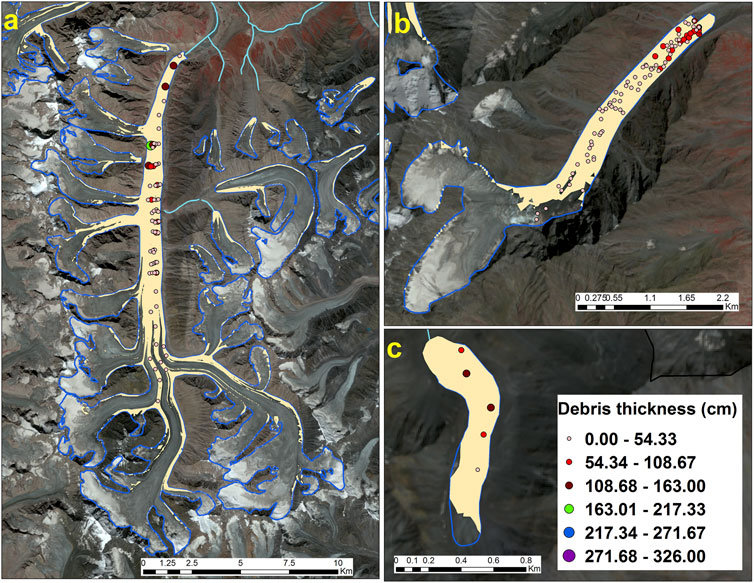
FIGURE 5. Debris cover (yellow shade) and debris thickness (circles) over the Bara Shigri (A), Batal (B) and Kunzam (C) glaciers, Chandra basin, Western Himalaya (Background satellite image: Sentinel 2B). The entire ablation zone (>75%) of the studied glaciers is covered with the debris and the thick debris over the lower ablation zone.
The debris size over the glacier surfaces ranged from poorly sorted sand particles to large boulders, distributed throughout the surface and mainly concentrated along medial and lateral moraines. Based on the Unified Soil Classification System, USCS (ASTM D2487), the composition of the debris pack was similar in most locations. The surface of the debris pack was dominated by boulders, cobbles and gravels, while at the ice-debris interface zone coarse to fine sand was observed. There were much fewer large boulders and cobbles and fine sand at the higher altitudinal locations (TG2, TG5, DS 4, DS 5, and DS 7) (Table 1). Similar glacier composition (size) has been also reported for the Khumbu Glacier, Nepal Himalaya (Gibson et al., 2018). The debris samples collected from the glacier were a mixture of the different rocks and sediment. Details of the debris samples, thickness and rock types at various glaciers (including data logger points) are given at Table 1. Petrographic studies revealed that the major rock types of glacier debris are granite, sandstone, phyllite, and schist, whereas major minerals were quartz, alkali feldspar, plagioclase, mica, and clays.
Spatio-Temporal Variability in Surface Temperature of Debris
The summary of the debris surface temperature
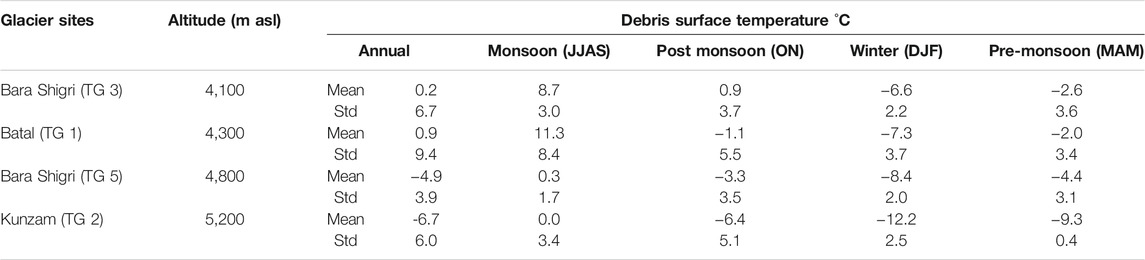
TABLE 3. Spatial and seasonal debris surface temperature (Ts)variability at different altitudes of glaciers in Chandra basin, Western Himalaya.
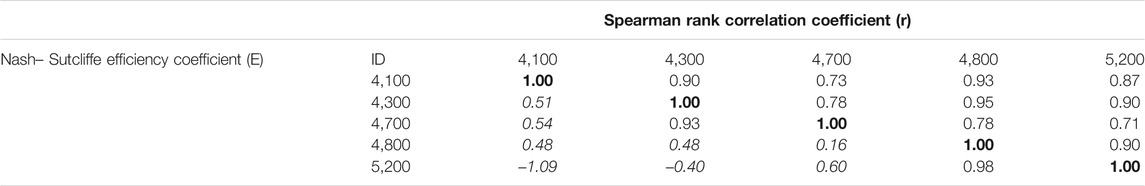
TABLE 4. The Spearman rank correlation coefficient (r) and Nash–Sutcliffe efficiency coefficient (E) matrix for each observation location (half hourly raw data) debris surface temperature and Ice surface temperature (4,700 m asl) timeseries.
The mean values for all the
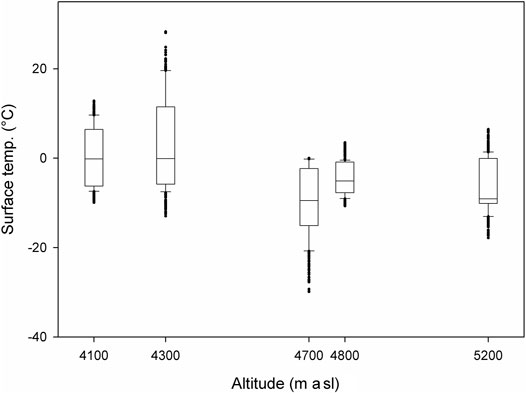
FIGURE 6. The box plot distribution and variability for the surface temperature data collected at selected altitudinal debris cover locations of the studied glaciers (Bara Shigri, Batal, and Kunzam) and ice surface temperature (4,700 m asl) from the Sutri Dhaka Glacier.
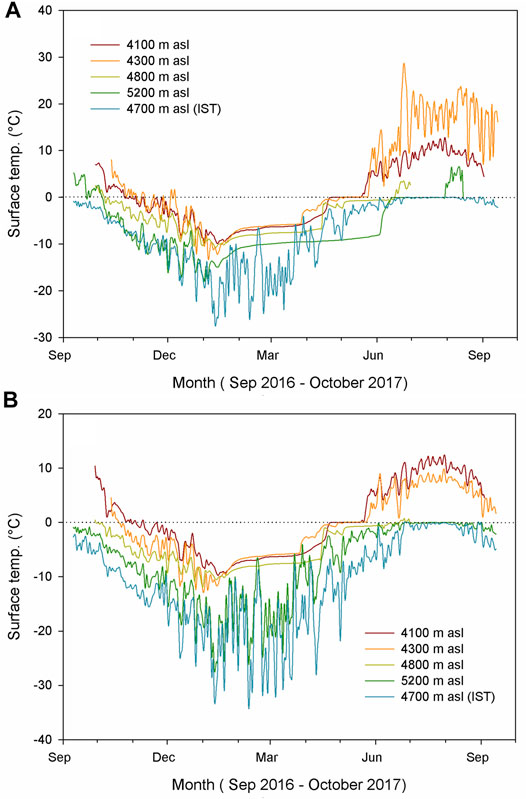
FIGURE 7. The temporal and spatial variability of the daily mean debris surface temperature and ice surface temperature (IST) during (A) the day and (B) night at the selected locations of the Chandra basin, Western Himalaya. The daily mean day and night temperature over the debris covered location was >0°C from June to October months.
During the ablation season (May – September) the mean
Figure 7 shows the diurnal variability in
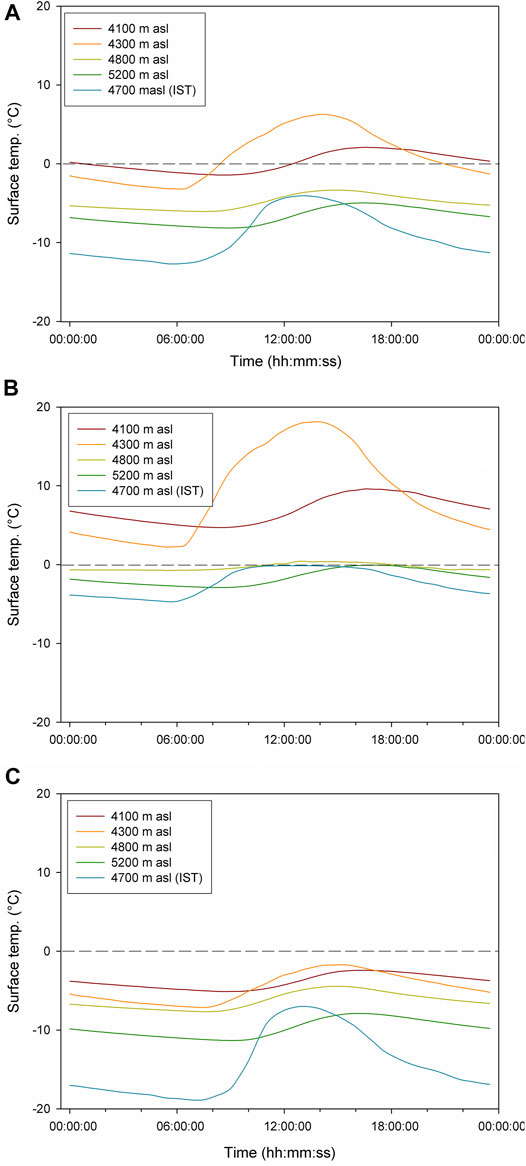
FIGURE 8. Diurnal variability for the debris surface temperature during (A) annual (B) ablation, and (C) accumulation periods in Chandra basin, Western Himalaya. The mean debris surface temperature was >0°C throughout the ablation months and the peaks were observed between 12:00–16:00 Hrs.
Further analysis was undertaken to understand the relationship between surface and subsurface temperature variability at Batal Glacier. The results showed a linear reduction in the temperature from
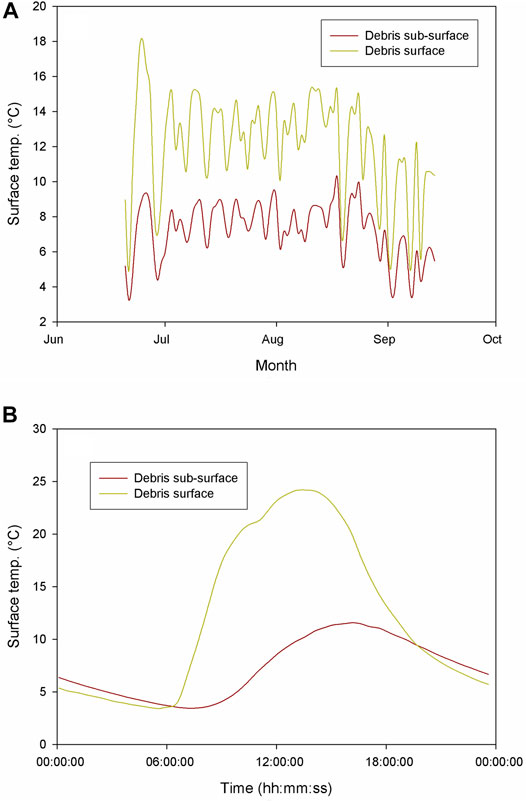
FIGURE 9. Debris surface and subsurface temperature variability at the Batal Glacier (4,300 m asl), during (A) ablation season and (B) diurnal variability. There was a linear trend with the surface and sub surface temperature, and the surface temperature was higher during day time while subsurface was higher during nights.
Data from the ablation stakes showed a higher cumulative loss (−8.3 m we) over the clean ice surface (4,700 m asl) during the observational period (2016-17). Among the debris covered locations, 4,300 m asl has showed the highest loss (−1.8 m we), followed by 4,800 m asl (−1.3 m we), 4,100 m asl (−1.2 m we), and 5,200 m asl (−0.6 m we) during 2016–17 (Figure 10A). The melt rate at Batal (4,300 m asl) and Kunzam (5,200 m asl) were 0.46 cm/day and 0.18 cm/day respectively. However, the melt rates at other selected locations (Bara Shigri) were within 0.37–0.39 cm/day (Figure 10B). The altitudinal variation and debris thickness were the major factors for the observed difference in the melt rates.
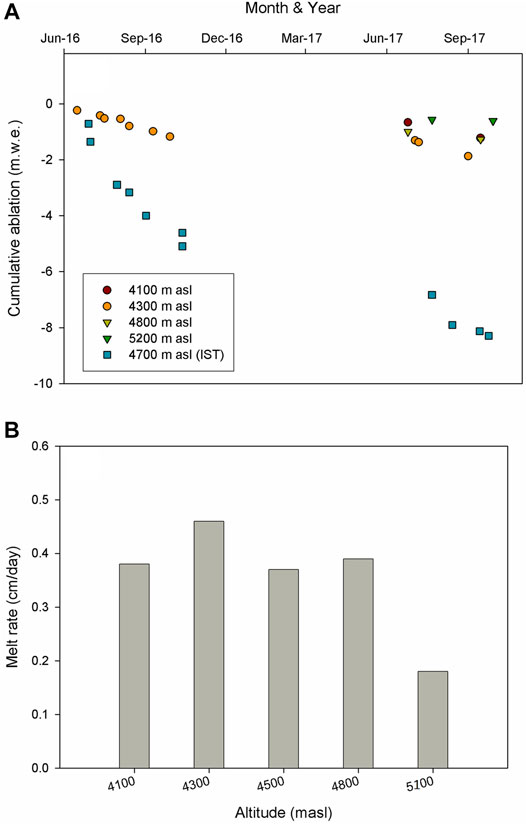
FIGURE 10. Cumulative ablation (A) and melt rates (B) during 2016-17 at different altitudes of the selected locations of glaciers in Chandra basin, Western Himalaya. The highest ablation was observed at the 4,700 m asl while lowest ablation at 5,200 m asl. However the melt rate at the debris covered location, at 4,300 m asl it was higher and lower at 5,200 m asl.
The estimated annual thermal resistance
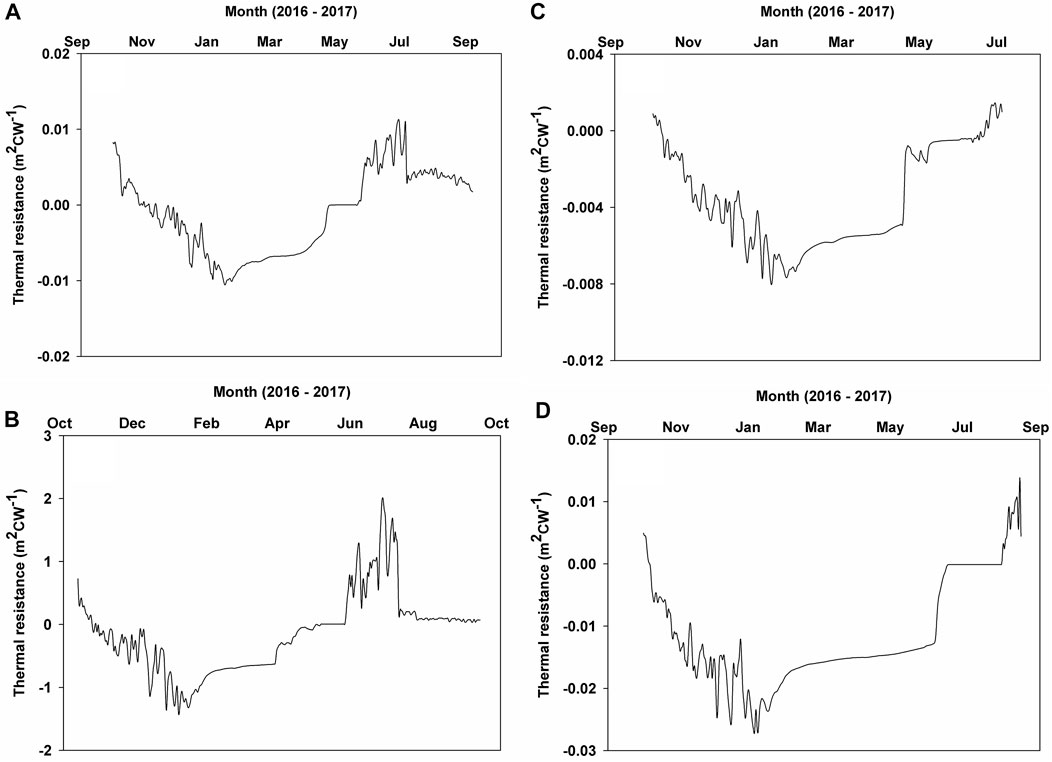
FIGURE 11. Annual spatial variability of thermal resistance over the debris-covered glaciers of Chandra basin during ablation season [4,100 m asl: TG 3 (A), 4,300 m asl: TG 1 (B), 4,800 m asl: TG 4 (C), and 5,200 m asl: TG 2 (D)].
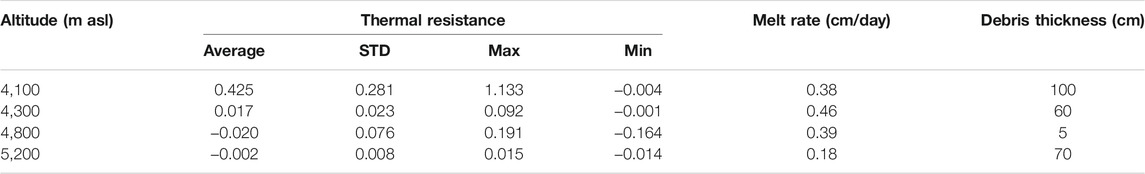
TABLE 5. The interrelation between the altitude, thermal resistance, melt rate and debris thickness duing the ablation season (June–October).
Discussion
The glacier mapping revealed that the ablation zones of most glaciers in the Chandra basin are debris-covered, and more extensively over the lower part of the ablation zones. The large debris-covered area over the ablation zones compared to the accumulation zones indicated the glacial transportation (englacial, subglacial, and supraglacial) of rocks and sediment from the higher to the lower zones, melting and glacial erosion, and hillslope processes (Banerjee and Wani, 2018). Some of the satellite observations have reported increasing debris cover over the Chandra basin glaciers and reported increasing glacier retreat as the major factor (Gaddam et al., 2016; Pratibha and Kulkarni, 2018). The increasing debris cover has also been reported for the Bhaga and Baspa river basins of the Western Himalaya (Pratibha and Kulkarni, 2018; Das and Sharma, 2019). The compositon (boulders, cobbels, gravels, and coarse to fine sand matrix) of the debris pack was also similar as per the increasing altitude for the all of the studied glacier. The debris over the Batal and Kunzam glaciers is dominantly composed of sandstone, while in Bara Shigari, only the lower portion (<4,500 m asl) is majorily dominated by sandstone while the upper portion (<5,000 m asl) is more variable, comprising quartz, biotite and schist. The major sources for the debris over the glacier catchments are rockfall and avalanche deposits from the mountain sides and physical weathering is the dominant process for the evolution of supraglacial debris (Banerjee and Shankar, 2013). This was also confirmed with the lithological analysis, where, the lithology of the debris material was found to be similar to the lithology of the surrounding mountains (Singh et al., 2017). The debris thickness and extent over the glacier surfaces are increasing annually which has shown to have potential control over the ablation rate over the glaciers. Some studies have also reported that the >50 cm thick debris can reduce the ablation by nearly 10 times compared to the clean glaciers in Chandra basin (Patel et al., 2016).
Factors Controlling the Debris Surface Temperature Over Glaciers
In the
The temperature datasets (
At the Batal Glacier, the linear reduction in the
The surface temperature datasets for the studied debris-covered glaciers indicated that the incoming solar radiation warms the debris surface and regulates the heat flow. The main insolation period for the debris surface warming is ablation season, especially the summer monsoon (JJAS), where the daytime (6:00 to 18:00 h) is the contributor to increasing debris surface temperature. It was also observed that the thinner debris at higher altitudes experiences enhanced warming, thus increasing the ice melt rate. Although the thicker debris surface at lower elevations is warmer, the ice beneath it undergoes less ablation.
Relationship Between Supraglacial Debris and Thermal Resistance
The measured
Conclusion
In this study, in-situ observations of supraglacial debris cover, its thickness and thermal properties were carried out over three major debris-covered glaciers of the Chandra basin in Western Himalaya during 2016-2017. An extensive debris cover over the lower ablation zone highlighted the glacial transportation processes and observed lithology of the debris samples marked the major debris sources from surrounding mountains. The debris surface temperature data showed that significant warming of surface debris occurs during the ablation period (June to September). Observed debris surface temperature
Data Availability Statement
The datasets presented in this study can be found in online repositories. The names of the repository/repositories and accession number(s) can be found below: https://pdc.ncpor.res.in/himalaya/DebrisSurfaceTempData_ChandraBasin.xls.
Author Contributions
LKP, PS, and MT devised the study. LKP, PS, and AS conducted the field survey for thermal data logger installation, temperature data collection, mass balance, debris thickness measurement, and debris sampling for the study. LKP analyzed the datasets and wrote the initial draft. SO has helped in the processing of the surface temperature and meteorological datasets. LKP, PS, BP, and MT contributed to finalizing the manuscript. All authors contributed to the data interpretation and discussion of the manuscript.
Funding
This work is funded under the Project PACER - Cryosphere and Climate by the Ministry of Earth Sciences (MoES), Government of India.
Conflict of Interest
The authors declare that the research was conducted in the absence of any commercial or financial relationships that could be construed as a potential conflict of interest.
Publisher’s Note
All claims expressed in this article are solely those of the authors and do not necessarily represent those of their affiliated organizations, or those of the publisher, the editors and the reviewers. Any product that may be evaluated in this article, or claim that may be made by its manufacturer, is not guaranteed or endorsed by the publisher.
Acknowledgments
We are thankful to the Director, National Centre for Polar and Ocean Research (NCPOR) for his support. Raghuram (Senior Geologist, Geological Survey of India) is gratefully acknowledged for analyzing the lithology and mineralogy of the collected debris samples. The U. S. Geological Survey (USGS) is acknowledged for the Landsat 8 data and ASTER GDEM V2 digital elevation model. The help and support provided by the logistic support personnel at the Himansh Station are duly acknowledged. This is the NCPOR contribution no. J-60/2021-22.
Supplementary Material
The Supplementary Material for this article can be found online at: https://www.frontiersin.org/articles/10.3389/feart.2021.706312/full#supplementary-material
Supplementary Figure S1 | The debris cover and thickness of the additional glaciers (A) SamudraTapu, (B) Sutri Dhaka, and (C) Gepang Gath from Chandra basin, Western Himalaya.
Supplementary Figure S2 | The estimated mean air temperature at the selected altitudinal observation sites over the debris-covered glaciers.
Supplementary Figure S3 | The inter-relationship between Thermal resistances, debris thickness, and melt rate during ablation season of 2016-2017 observation periods.
References
Alifu, H., Tateishi, R., and Johnson, B. (2015). A New Band Ratio Technique for Mapping Debris-Covered Glaciers Using Landsat Imagery and a Digital Elevation Model. Int. J. Remote Sensing 36 (8), 2063–2075. doi:10.1080/2150704X.2015.1034886
Banerjee, A., and Shankar, R. (2013). On the Response of Himalayan Glaciers to Climate Change. J. Glaciol. 59 (215), 480–490. doi:10.3189/2013JoG12J130
Banerjee, A., and Wani, B. A. (2018). Exponentially Decreasing Erosion Rates Protect the High-Elevation Crests of the Himalaya. Earth Planet. Sci. Lett. 497, 22–28. doi:10.1016/j.epsl.2018.06.001
Benn, D. I., Bolch, T., Hands, K., Gulley, J., Luckman, A., Nicholson, L. I., et al. (2012). Response of Debris-Covered Glaciers in the Mount Everest Region to Recent Warming, and Implications for Outburst Flood Hazards. Earth-Science Rev. 114 (1), 156–174. doi:10.1016/j.earscirev.2012.03.008
Bhutiyani, M. R., Kale, V. S., and Pawar, N. J. (2007). Long-term Trends in Maximum, Minimum and Mean Annual Air Temperatures across the Northwestern Himalaya during the Twentieth century. Climatic Change 85, 159–177. doi:10.1007/s10584-006-9196-1
Bolch, T., Kulkarni, A., Kääb, A., Huggel, C., Paul, F., Cogley, J. G., et al. (2012). The State and Fate of Himalayan Glaciers. Science 336 (6079), 310–314. doi:10.1126/science.1215828
Bookhagen, B., and Burbank, D. W. (2006). Topography, Relief, and TRMM-Derived Rainfall Variations along the Himalaya. Geophys. Res. Lett. 33 (8), 1–5. doi:10.1029/2006GL026037
Brock, B. W., Mihalcea, C., Kirkbride, M. P., Diolaiuti, G., Cutler, M. E. J., and Smiraglia, C. (2010). Meteorology and Surface Energy Fluxes in the 2005-2007 Ablation Seasons at the Miage Debris-Covered Glacier, Mont Blanc Massif, Italian Alps. J. Geophys. Res. 115 (D9), 1–16. doi:10.1029/2009JD013224
Buri, P., Miles, E. S., Steiner, J. F., Immerzeel, W. W., Wagnon, P., and Pellicciotti, F. (2016). A Physically Based 3‐D Model of Ice Cliff Evolution over Debris‐covered Glaciers. J. Geophys. Res. Earth Surf. 121 (12), 2471–2493. doi:10.1002/2016JF004039
Chand, P., and Sharma, M. C. (2015). Glacier Changes in the Ravi basin, North-Western Himalaya (India) during the Last Four Decades (1971-2010/13). Glob. Planet. Change 135, 133–147. doi:10.1016/j.gloplacha.2015.10.013
Collier, E., Maussion, F., Nicholson, L. I., Mölg, T., Immerzeel, W. W., and Bush, A. B. G. (2015). Impact of Debris Cover on Glacier Ablation and Atmosphere-Glacier Feedbacks in the Karakoram. The Cryosphere 9 (4), 1617–1632. doi:10.5194/tc-9-1617-2015
Collier, E., Nicholson, L. I., Brock, B. W., Maussion, F., Essery, R., and Bush, A. B. G. (2014). Representing Moisture Fluxes and Phase Changes in Glacier Debris Cover Using a Reservoir Approach. The Cryosphere 8 (4), 1429–1444. doi:10.5194/tc-8-1429-2014
Cuffey, K. M., and Paterson, W. S. B. (2010). The Physics of Glaciers. Cambridge, Massachusetts: Academic Press.
Das, S., and Sharma, M. C. (2019). Glacier Changes between 1971 and 2016 in the Jankar Chhu Watershed, Lahaul Himalaya, India. J. Glaciol. 65 (249), 13–28. doi:10.1017/jog.2018.77
Evatt, G. W., Abrahams, I. D., Heil, M., Mayer, C., Kingslake, J., Mitchell, S. L., et al. (2015). Glacial Melt under a Porous Debris Layer. J. Glaciol. 61 (229), 825–836. doi:10.3189/2015JoG14J235
Foster, L. A., Brock, B. W., Cutler, M. E. J., and Diotri, F. (2012). A Physically Based Method for Estimating Supraglacial Debris Thickness from thermal Band Remote-Sensing Data. J. Glaciol. 58 (210), 677–691. doi:10.3189/2012JoG11J194
Fyffe, C. L., Reid, T. D., Brock, B. W., Kirkbride, M. P., Diolaiuti, G., Smiraglia, C., et al. (2014). A Distributed Energy-Balance Melt Model of an alpine Debris-Covered Glacier. J. Glaciol. 60 (221), 587–602. doi:10.3189/2014JoG13J148
Gaddam, V. K., Sharma, P., Patel, L. K., Thamban, M., and Singh, A. (2016). “Spatio-temporal Changes Observed in Supra-glacial Debris Cover in Chenab Basins, Western Himalaya,” in Remote Sensing of the Oceans and Inland Waters: Techniques, Applications, and Challenges (Bellingham, Washington, United States: International Society for Optics and Photonics), 98781F. doi:10.1117/12.2227993
Gibson, M. J., Irvine-Fynn, T. D. L., Wagnon, P., Rowan, A. V., Quincey, D. J., Homer, R., et al. (2018). Variations in Near-Surface Debris Temperature through the Summer Monsoon on Khumbu Glacier, Nepal Himalaya. Earth Surf. Process. Landforms 43, 2698–2714. doi:10.1002/esp.4425
Haidong, H., Yongjing, D., and Shiyin, L. (2006). A Simple Model to Estimate Ice Ablation under a Thick Debris Layer. J. Glaciol. 52 (179), 528–536. doi:10.3189/172756506781828395
Juen, M., Mayer, C., Lambrecht, A., Wirbel, A., Kueppers, U., Lambrecht, A., et al. (2013). Thermal Properties of a Supraglacial Debris Layer with Respect to Lithology and Grain size. A Comparison of Glacier Melt on Debris-Covered Glaciers in the Northern and Southern Caucasus. Geografiska Annaler: Ser. A, Phys. Geography. Cryosphere 955 (3), 197525–209538. doi:10.5194/tc-5-525-2011
Lejeune, Y., Bertrand, J.-M., Wagnon, P., and Morin, S. (2013). A Physically Based Model of the Year-Round Surface Energy and Mass Balance of Debris-Covered Glaciers. J. Glaciol. 59 (214), 327–344. doi:10.3189/2013JoG12J149
Mihalcea, C., Mayer, C., Diolaiuti, G., Lambrecht, A., Smiraglia, C., and Tartari, G. (2006). Ice Ablation and Meteorological Conditions on the Debris-Covered Area of Baltoro Glacier, Karakoram, Pakistan. Ann. Glaciol. 43, 292–300. doi:10.3189/172756406781812104
Muhammad, S., Tian, L., Ali, S., Latif, Y., Wazir, M. A., Goheer, M. A., et al. (2020). Thin Debris Layers Do Not Enhance Melting of the Karakoram Glaciers. Sci. Total Environ. 746, 141119. doi:10.1016/j.scitotenv.2020.141119
Nakawo, M., and Takahashi, S. (1982). A Simplified Model for Estimating Glacier Ablation under a Debris Layer. United Kingdom: International Association of Hydrological Sciences.
Nakawo, M., and Young, G. J. (1982). Estimate of Glacier Ablation under a Debris Layer from Surface Temperature and Meteorological Variables. J. Glaciol. 28 (98), 29–34. doi:10.3189/S002214300001176X
Nakawo, M., and Young, G. J. (1981). Field Experiments to Determine the Effect of a Debris Layer on Ablation of Glacier Ice. Ann. Glaciol. 2, 85–91. doi:10.3189/172756481794352432
Nicholson, L., and Benn, D. I. (2006). Calculating Ice Melt beneath a Debris Layer Using Meteorological Data. J. Glaciol. 52 (178), 463–470. doi:10.3189/172756506781828584
Nicholson, L., and Benn, D. I. (2013). Properties of Natural Supraglacial Debris in Relation to Modelling Sub-debris Ice Ablation. Earth Surf. Process. Landforms 38 (5), 490–501. doi:10.1002/esp.3299
Nicholson, L. I., McCarthy, M., Pritchard, H. D., and Willis, I. (2018). Supraglacial Debris Thickness Variability: Impact on Ablation and Relation to Terrain Properties. The Cryosphere 12 (12), 3719–3734. doi:10.5194/tc-12-3719-2018
Patel, L. K., Sharma, P., Laluraj, C. M., Thamban, M., Singh, A., and Ravindra, R. (2017). A Geospatial Analysis of Samudra Tapu and Gepang Gath Glacial Lakes in the Chandra Basin, Western Himalaya. Nat. Hazards 86 (3), 1275–1290. doi:10.1007/s11069-017-2743-4
Patel, L. K., Sharma, P., Thamban, M., Singh, A., and Ravindra, R. (2016). Debris Control on Glacier Thinning-A Case Study of the Batal Glacier, Chandra basin, Western Himalaya. Arab J. Geosci. 9 (4), 309. doi:10.1007/s12517-016-2362-5
Pellicciotti, F., Stephan, C., Miles, E., Herreid, S., Immerzeel, W. W., and Bolch, T. (2015). Mass-balance Changes of the Debris-Covered Glaciers in the Langtang Himal, Nepal, from 1974 to 1999. J. Glaciol. 61 (226), 373–386. doi:10.3189/2015JoG13J237
Pratap, B., Dobhal, D. P., Mehta, M., and Bhambri, R. (2015). Influence of Debris Cover and Altitude on Glacier Surface Melting: a Case Study on Dokriani Glacier, central Himalaya, India. Ann. Glaciol. 56 (70), 9–16. doi:10.3189/2015AoG70A971
Pratibha, S., and Kulkarni, A. V. (2018). Decadal Change in Supraglacial Debris Cover in Baspa basin, Western Himalaya. Curr. Sci. 114 (4), 792. doi:10.18520/cs/v114/i04/792-799
Reid, T. D., and Brock, B. W. (2014). Assessing Ice-Cliff Backwasting and its Contribution to Total Ablation of Debris-Covered Miage Glacier, Mont Blanc Massif, Italy. J. Glaciol. 60 (219), 3–13. doi:10.3189/2014JoG13J045
Röhl, K. (2008). Characteristics and Evolution of Supraglacial Ponds on Debris-Covered Tasman Glacier, New Zealand. J. Glaciol. 54 (188), 867–880. doi:10.3189/002214308787779861
Rounce, D. R., Hock, R., McNabb, R. W., Millan, R., Sommer, C., Braun, M. H., et al. (2021). Distributed Global Debris Thickness Estimates Reveal Debris Significantly Impacts Glacier Mass Balance. Geophys. Res. Lett. 48, e2020GL091311. doi:10.1029/2020GL091311
Rounce, D. R., Quincey, D. J., and McKinney, D. C. (2015). Debris-covered Glacier Energy Balance Model for Imja-Lhotse Shar Glacier in the Everest Region of Nepal. The Cryosphere 9 (6), 2295–2310. doi:10.5194/tc-9-2295-2015
Rowan, A. V., Nicholson, L., Collier, E., Quincey, D. J., Gibson, M. J., Wagnon, P., et al. (2017). Multiannual Observations and Modelling of Seasonal thermal Profiles through Supraglacial Debris in the Central Himalaya. Cryosphere Discuss. 2017, 1–39. doi:10.5194/tc-2017-239
Rowan, A. V., Nicholson, L. I., Quincey, D. J., Gibson, M. J., Irvine-Fynn, T. D. L., Watson, C. S., et al. (2021). Seasonally Stable Temperature Gradients through Supraglacial Debris in the Everest Region of Nepal, Central Himalaya. J. Glaciol. 67 (261), 170–181. doi:10.1017/jog.2020.100
Sangewar, C. V., and Shukla, S. P. (2009). Inventory of the Himalayan Glaciers: A Contribution to the International Hydrological Programme. Special Publication No.34. Kolkata, West Bengal, India: Geological Survey of India.
Scherler, D., Bookhagen, B., and Strecker, M. R. (2011). Spatially Variable Response of Himalayan Glaciers to Climate Change Affected by Debris Cover. Nat. Geosci. 4 (3), 156–159. doi:10.1038/ngeo1068
Sharma, P., Patel, L. K., Ravindra, R., Singh, A., K, M., and Thamban, M. (2016). Role of Debris Cover to Control Specific Ablation of Adjoining Batal and Sutri Dhaka Glaciers in Chandra Basin (Himachal Pradesh) during Peak Ablation Season. J. Earth Syst. Sci. 125 (3), 459–473. doi:10.1007/s12040-016-0681-2
Shukla, A., Gupta, R. P., and Arora, M. K. (2009). Estimation of Debris Cover and its Temporal Variation Using Optical Satellite Sensor Data: a Case Study in Chenab basin, Himalaya. J. Glaciol. 55 (191), 444–452. doi:10.3189/002214309788816632
Shukla, A., and Qadir, J. (2016). Differential Response of Glaciers with Varying Debris Cover Extent: Evidence from Changing Glacier Parameters. Int. J. Remote Sensing 37 (11), 2453–2479. doi:10.1080/01431161.2016.1176272
Singh, A. T., Laluraj, C. M., Sharma, P., Patel, L. K., and Thamban, M. (2017). Export Fluxes of Geochemical Solutes in the Meltwater Stream of Sutri Dhaka Glacier, Chandra basin, Western Himalaya. Environ. Monit. Assess. 189 (11), 555. doi:10.1007/s10661-017-6268-9
Steiner, J. F., Buri, P., Miles, E. S., Ragettli, S., and Pellicciotti, F. (2019). Supraglacial Ice Cliffs and Ponds on Debris-Covered Glaciers: Spatio-Temporal Distribution and Characteristics. J. Glaciol. 65 (252), 617–632. doi:10.1017/jog.2019.40
Steiner, J. F., and Pellicciotti, F. (2016). Variability of Air Temperature over a Debris-Covered Glacier in the Nepalese Himalaya. Ann. Glaciol. 57 (71), 295–307. doi:10.3189/2016AoG71A066
Suzuki, R., Fujita, K., and Ageta, Y. (2007). Spatial Distribution of thermal Properties on Debris-Covered Glaciers in the Himalayas Derived from ASTER Data. Bull. Glaciological Res. 24, 13–22.
Tachikawa, T., Hato, M., Kaku, M., and Iwasaki, A. (2011). “Characteristics of ASTER GDEM Version 2,” in Proceedings of the 2011 IEEE International Geoscience and Remote Sensing Symposium, July 24–29, 2011 (Vancouver, BC: IEEE explorer), 3657–3660. doi:10.1109/igarss.2011.6050017
Keywords: supraglacial debris, glacier, thermal resistance, Chandra basin, Western Himalaya, debris-cover
Citation: Patel LK, Sharma P, Singh A, Oulkar S, Pratap B and Thamban M (2021) Influence of Supraglacial Debris Thickness on Thermal Resistance of the Glaciers of Chandra Basin, Western Himalaya. Front. Earth Sci. 9:706312. doi: 10.3389/feart.2021.706312
Received: 07 May 2021; Accepted: 10 November 2021;
Published: 16 December 2021.
Edited by:
Duncan Joseph Quincey, University of Leeds, United KingdomReviewed by:
Yong Zhang, Hunan University of Science and Technology, ChinaMorgan Jones, Aberystwyth University, United Kingdom
Copyright © 2021 Patel, Sharma, Singh, Oulkar, Pratap and Thamban. This is an open-access article distributed under the terms of the Creative Commons Attribution License (CC BY). The use, distribution or reproduction in other forums is permitted, provided the original author(s) and the copyright owner(s) are credited and that the original publication in this journal is cited, in accordance with accepted academic practice. No use, distribution or reproduction is permitted which does not comply with these terms.
*Correspondence: Lavkush Kumar Patel, bGF2a3VzaHBhdGVsQG5jcG9yLnJlcy5pbg==
†ORCID ID: Lavkush Kumar Patel, orcid.org/0000-0002-8131-9587