 Hotaek Park
 Alexander N. Fedorov
 Pavel Konstantinov3
94% of researchers rate our articles as excellent or good
Learn more about the work of our research integrity team to safeguard the quality of each article we publish.
Find out more
ORIGINAL RESEARCH article
Front. Earth Sci., 22 September 2021
Sec. Cryospheric Sciences
Volume 9 - 2021 | https://doi.org/10.3389/feart.2021.704447
This article is part of the Research TopicYedoma Permafrost Landscapes as Past Archives, Present and Future Change AreasView all 27 articles
Excess ice that exists in forms such as ice lenses and wedges in permafrost soils is vulnerable to climate warming. Here, we incorporated a simple representation of excess ice in a coupled hydrological and biogeochemical model (CHANGE) to assess how excess ice affects permafrost thaw and associated hydrologic responses, and possible impacts on carbon dioxide and methane (CH4) fluxes. The model was used to simulate a moss-covered tundra site in northeastern Siberia with various vertical initializations of excess ice under a future warming climate scenario. Simulations revealed that the warming climate induced deepening of the active layer thickness (ALT) and higher vegetation productivity and heterotrophic respiration from permafrost soil. Meanwhile, excess ice temporarily constrained ALT deepening and thermally stabilized permafrost because of the highest latent heat effect obtained under these conditions. These effects were large under conditions of high excess ice content distributed in deeper soil layers, especially when covered by moss and thinner snow. Once ALT reached to the layer of excess ice, it was abruptly melted, leading to ground surface subsidence over 15–20 years. The excess ice meltwater caused deeper soil to wet and contributed to talik formation. The anaerobic wet condition was effective to high CH4 emissions. However, as the excess ice meltwater was connected to the subsurface flow, the resultant lower water table limited the CH4 efflux. These results provide insights for interactions between warming climate, permafrost excess ice, and carbon and CH4 fluxes in well-drained conditions.
The warming climate has resulted in changes in the Arctic system. A representative change is permafrost warming (Biskaborn et al., 2019), which is closely related to changes in ecological, hydrological, and biogeochemical functions. The changes are in turn fed back to global climate through altered water, energy, and carbon fluxes. For example, permafrost is estimated to store approximately 1,300 Pg of carbon, which is considerably larger than the current atmospheric carbon pool (Hugelius et al., 2014). If thawed and mobilized, this carbon could become a major source of greenhouse gas emissions (Schuur et al., 2008). Field observations have monitored increases in carbon dioxide (CO2) release from permafrost soils to the atmosphere (Turetsky et al., 2019, 2020), and numerical models also projected the deepening active layer thickness (ALT)-induced increase in organic carbon thawing under future warming scenarios (Koven et al., 2011, 2015; Lawrence et al., 2012; Nitzbon et al., 2020). These results imply that future climate conditions will accelerate the permafrost thaw through positive feedback.
The ice-rich permafrost, formed by ice wedge and Yedoma, is vulnerable to climate change (Jorgenson et al., 2006; Liljedahl et al., 2016). The warming temperature enhances permafrost degradation and melting of ground ice, inducing landscape changes such as subsidence and thermokarst. The thermokarst processes can yield spatially heterogeneous thaw lakes and thermo-erosional gullies, influenced by the microtopography of the terrain. The ground-ice melt supplies water to the thaw lakes in conjunction with snowmelt water and precipitation, so that the thaw lakes tend to continuously grow once initiated (Fedorov et al., 2014), causing severe permafrost degradation within a few years or decades (Ulrich et al., 2017). Thaw lake growth significantly alters landscape scales of water and energy fluxes. In situ measurements and remote sensing observations in several Arctic sites have documented the thermokarst-associated changes in local and regional hydrology (Liljedahl et al., 2016), with implications for a range of ecosystem functions such as, for example, the decomposition of organic carbon (Lara et al., 2015).
The contribution of thermokarst landscape evolution to hydrological processes in a warming climate is likely further amplified by ground subsidence inducing greater snow accumulation, reduced winter heat loss, and increased ground ice melt (Aas et al., 2019). A variety of numerical modeling studies have addressed the hydrologic processes changed by permafrost degradation, separately identifying lateral fluxes of subsurface water as well as redistribution of snow and surface water, with groundwater flow and related heat advection (Kurylyk et al., 2016; Sjöberg et al., 2016; Grant et al., 2017; Bisht et al., 2018). Some studies assessed the influence of microtopography on the biogeochemical processes in polygonal tundra areas (Cresto Aleina et al., 2013; Kumar et al., 2016; Abolt et al., 2018). These modeling studies have improved our understanding of thermokarst associated processes and feedbacks. The knowledge gained in earlier studies has become an important resource for recent model development that can simulate more realistic ice-rich permafrost thaw dynamics and successive fine-scale ground subsidence (Aas et al., 2019; Nitzbon et al., 2020). However, the improved models have limitations in terms of representations at regional and global scales. To overcome these limitations, the Community Land Model (CLM) included land subsidence related to permafrost thaw and ground ice melt in a global simulation (Lee et al., 2014). Using a sub-grid tiling approach allows land surface models to represent lateral fluxes of heat, water, and snow in the degrading permafrost terrain (Qiu et al., 2018; Aas et al., 2019; Cai et al., 2020; Nitzbon et al., 2020).
Previous observational and modeling studies have provided evidence of continuously degrading permafrost under climate warming (Liljedahl et al., 2016; Cai et al., 2020). The model projections likely have biases that arise from assumptions about model parameters and limitations in representing the inherent distribution of ground ice relevant to permafrost degradation. Nonetheless, one of the advantages of incorporating excess ice in the model is that we can capture features of changes in permafrost landscapes and hydrology that result from thawing permafrost and melting excess ice. Therefore, we incorporated a simple framework of excess ice melt and subsidence (Bowling et al., 2008) into a coupled hydrological and biogeochemical model (CHANGE: Park et al., 2011, 2018). The objective of this study was to examine the impact of excess ice melt on permafrost hydrology and associated changes in CO2 and methane (CH4) fluxes under future climate scenarios following the strongest representative concentration pathways (RCP8.5) in a tundra site in northeastern Siberia using the improved CHANGE model. We also quantified the contribution of excess ice meltwater to the surface–subsurface hydrologic system, which is likely achieved because of the inclusion of a water tracer scheme within CHANGE to track pathways of water originating from precipitation and ground ice meltwater (Park et al., 2021).
CHANGE is a process-based land surface model that calculates momentum, water, heat, and carbon fluxes in the atmosphere–vegetation–snow–soil system, soil hydrothermal states, snow hydrology, and stomatal physiology and photosynthesis, in combination with interactions and feedbacks between components and processes within the system (Park et al., 2011, 2018). The model simulates snow accumulation and melt, and the meltwater is partitioned into soil infiltration and surface runoff, even during precipitation events. The infiltrated water can move up or down within the soil, depending on the water potential gradient between soil layers, in which a portion is used for plant transpiration and the excess vertically infiltrated water at either the permafrost table or the bottom soil boundary layer is converted to lateral water flux that is assumed to be subsurface flow. CHANGE calculates the energy balance over the canopy, snow, and soil surface separately and also solves the water budget at both the canopy and soil based on the mass conservation principle. The soil evaporation, transpiration, and rainfall interception by the canopy, which consists of evapotranspiration, are calculated by the balance solution, and their summation is evapotranspiration. The model explicitly represents the dynamics of water and heat flows in permafrost soil considering the freezing/thawing phase transitions in a soil column of 70.4 m depth to explicitly capture thermal inertia in deep ground. The heat flux into the soil–snow is obtained by solving an energy balance equation and is used as the upper boundary condition for the solution of the heat conduction. Zero heat flux is prescribed as the lower boundary condition. The effects of soil organic carbon (SOC) on the soil thermal and hydraulic dynamics are represented by the parameterization of the vertical distribution of SOC within the soil depth of 1.2 m. The calculated ice content in frozen soil layers is used for the parameterization of effective porosity that represents the soil water stress conditions associated with drying and/or freezing, which is coupled to stomatal conductance and the maximum rate of carboxylation, consequently controlling plant productivity as well as phenology. CHANGE mechanistically calculates leaf photosynthesis via the Farquhar biochemical model (Farquhar et al., 1980) as a function of absorbed light, leaf temperature, CO2 concentration within the leaf, and Rubisco enzyme capacity for photosynthesis. Leaf stomatal conductance, which is needed for the water flux, is coupled to the leaf photosynthesis and concentrations of CO2 and water vapor (Collatz et al., 1991). The model calculates photosynthesis and stomatal conductance separately for sunlit and shaded leaves. CHANGE simulates biogeochemical processes across multiple biomes, including the carbon and nitrogen cycles in vegetation, litter, and soil. The carbon absorbed by photosynthesis is partitioned into vegetation components, and the coupled nitrogen cycle allows nitrogen limitation to influence plant productivity that is associated with the dynamics of SOC. The decomposition rate of SOC, controlled by soil temperature and moisture, in turn affects productivity through nitrogen availability.
Mosses covering the subarctic soil surface strongly affect water and heat fluxes because of their high water holding capacity and the provision of insulation. CHANGE was coupled with a moss process module, enabling an explicit representation of heat, water, and carbon exchanges in the ecosystem (Park et al., 2018). The moss cover that is assumed to be uniformly distributed over the soil surface is divided into three vertical layers for the calculations of heat and water flows. The temperature of each moss layer is calculated using the heat conduction equation, which is forced by the heat flux into the moss surface from the atmosphere and snow bottom layer, solving the energy budget equation (Launiainen et al., 2015; Park et al., 2018). The dynamics of water content between moss layers are calculated by the water budget equation, and then the fraction of liquid and ice water in individual moss layers is estimated by the simulated temperature. The estimation of thermal properties (i.e., heat conductivity and capacity) in the moss layers is dependent on the separated water and ice fractions. The moss net CO2 exchange depends on climatic conditions and moss water content and temperature, based on the prognostic moss leaf area index over the annual time series. Therefore, the model assumes that the seasonal cycle of photosynthetic parameters of the moss layers was negligible, and all changes were considered to be instantaneous and reversible.
CHANGE includes a water tracer model that is designed to illustrate the spatiotemporal variability of water originating from precipitation and ground ice in the hydrologic system and quantify their contributions to hydrological processes (Park et al., 2021). It therefore has an ability to assess the contribution ratio of excess ice meltwater to the subsurface flow under future climate warming, which is important to understand the dynamics of hydrological processes.
CHANGE extended the soil column to a depth of 70.4 m, discretizing into 31 soil layers by default. The soil surface (e.g., ∼0.37 m) over which the soil water gradient is generally strong forms six soil layers based on an exponential equation, and then the soil layers have a 0.2-m node spacing to 3.2 m. The deepest remnant layers in turn form thicker node depths based on the exponential equation. The soil layers from the surface to 6 m are treated as hydrologically active with the remaining deeper layers representing bedrock. In the active soil layers, the appearance of permafrost operates the parameterization of ice blocking, thereby constraining the hydrological activity in the relevant soil layers regardless of the model configuration. The maximum ALT is updated during the model calculation period including spinup, and the frozen soil below the active layer which is defined as permafrost soil. Excess ice is initially distributed within the configured soil layers and below the ALT, with the same ice fraction (Table 1), which increases both the volume of the whole soil layer (including saturated soil moisture) and the soil layer thickness accordingly (Bowling et al., 2008; Lee et al., 2014). The increase in the soil layer thickness is linearly proportional to the volumetric content of excess ice. As excess ice melts in response to climatic warming, the soil layer thickness decreases, which corresponds to surface subsidence because of excess ice melt (Cai et al., 2020). The water holding capacity of the soil layer is simultaneously decreased by the melting. The subsidence induced changes in saturated soil moisture and soil layer thickness directly affect hydraulic characteristics such as hydraulic conductivity and saturated soil water suction. These changes influence the vertical fluxes of soil water and ultimately the moisture content of the soil layers, as described in the Supplementary Appendix. Because excess ice is located below the ALT, however, there is little to no change in excess ice and related variables during model spinup.
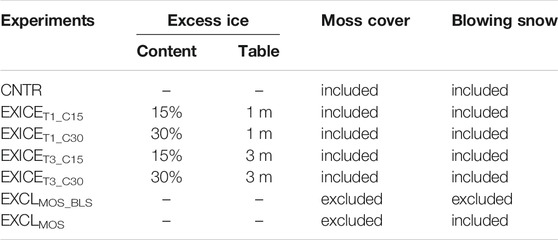
TABLE 1. Summary of experimental configurations used in this study.
The excess ice substantially affects soil thermal conductivity and soil heat capacity, which is immediately linked to soil temperature through their influences on heat flux and phase change. Following Lee et al. (2014), CHANGE adopted the thermal parameterization that includes the influence of the excess ice, as described in the Supplementary Appendix. Because the excess ice is prescribed as an initial condition, it only melts and does not grow again. As thawing occurs at a layer, permafrost soil of the layer is preferentially thawed, and thereafter excess ice. These assumptions allow simplification of the model calculation. The excess ice meltwater is added to liquid water of the soil layer or an unsaturated layer above if the soil layer is saturated. The liquid water then participates in the hydrologic system of transpiration and subsurface flow generation in the way of soil water movement.
The coupling of a CH4 biogeochemistry model integrated in the community land model (CLM4Me, Riley et al., 2011) to CHANGE was made to examine interactions of climate–excess ice–CH4 fluxes. CLM4Me has been improved by integrating several new process representations and parameterization, and the improved versions have been tested and evaluated at global and site scales (Meng et al., 2012; Melton et al., 2013). Because the detailed descriptions of CLM4Me have been provided in previous studies (Riley et al., 2011), we here describe the major characteristics of CLM4Me, including the major modifications. In the model calculation, CLM4Me first controls the initialization of boundary conditions, inundation, and impact of redox conditions and then calculates CH4 production, oxidation, transport through aerenchyma, ebullition, aqueous and gaseous diffusion, and the overall mass balance for unsaturated and saturated soils. Above all, mechanistically modeling net surface CH4 emissions requires representing a time series of changing inundated fraction. CHANGE can optionally use a parameterization based on TOPMODEL (Beven and Kirkby, 1979) that includes a groundwater model calculating changes in water table controlled by water recharge and lateral flow. As the water table becomes higher, more of the surface area becomes saturated, thereby flooding the regions with higher topographic index first. Here, the saturated fraction (fsat) calculated as in Gedney and Cox (2003) was alternated with the inundated fraction that is required in CLM4Me. The water table depth is calculated, and the probability distribution function of the topographic index within the site is then used to describe the relative frequency of occurrence of the topographic indices. fsat of the site can be found by integrating the probability distribution function of the topographic index. This is determined by numerical integration because a two-parameter gamma distribution is used for the probability distribution function. An exponential distribution of fsat is fitted to the parameters of the gamma distribution. fsat is allowed to change at each time step, in which the calculation is made four times in total in the saturated and unsaturated fractions for CH4 and O2. The total soil CH4 quantity is conserved by evolving CH4 to the atmosphere when fsat decreases and averaging a portion of the unsaturated concentration into the saturated concentration when fsat increases. In addition, our simulation neglected the solution of the CH4 and O2 mass balance for water bodies.
Several simulations were conducted for the years 1980–2099, based on various modeling setups of excess ice, as summarized in Table 1. The case “CNTR” is the standard version of the model that excludes the process of excess ice. The cases that included excess ice had different settings for the surface depth and content of excess ice along the thickness of 3 m. We combined two types of daily forcing data for running the model – the forcing data for the current climate from 1980 to 2013 were yielded by the combination of observations at the study site and ERA-Interim reanalysis data (Miyazaki et al., 2015) and the future forcing data from 2014 to 2099 were obtained from a single ensemble member of a projection simulation (RCP8.5) with Hadgem2-ES. Individual experiments were spun up for 1,200 years using the detrended forcing data of the initial 20 years and a CO2 concentration of 350 ppm. Through the spinup runs, the model determines dynamic equilibriums for soil temperature and moisture and vegetation carbon and nitrogen. A static land cover type of arctic grass was defined for the simulation, while the vegetation phenology was prognostic based on the estimated carbon and nitrogen contents.
The RCP8.5 scenario is a high greenhouse gas emissions scenario (Moss et al., 2010), which resulted in strong warming in the study site; for example, air temperature increased 3°C and there was three times higher precipitation in the 2090s when compared with the 1980s (Figure 1A). It is noted that projections by climate models tend to contain biases in the Arctic, particularly excessive winter snowfall that likely results in unexpected thicker snow depth, as identified by the CNTR experiment (Figure 1B). The snow depth leads to excessive soil insulation that likely results in rapid permafrost thawing in combination with the warmer air temperature than when the climate biases are removed. To explore the response of permafrost to the precipitation-induced snow depth change of strong emission scenarios, we conducted additional experiments that reduced precipitation by 50% when compared with the default condition (Table 1), which was called “the treated experiment.” Although the reduced precipitation produced lower snow depth during the winter than the original experiment (Figure 1B), the future snow depth of the treated experiment was considerably larger than the maximum snow depth (i.e., 40 cm) observed under the present climate.
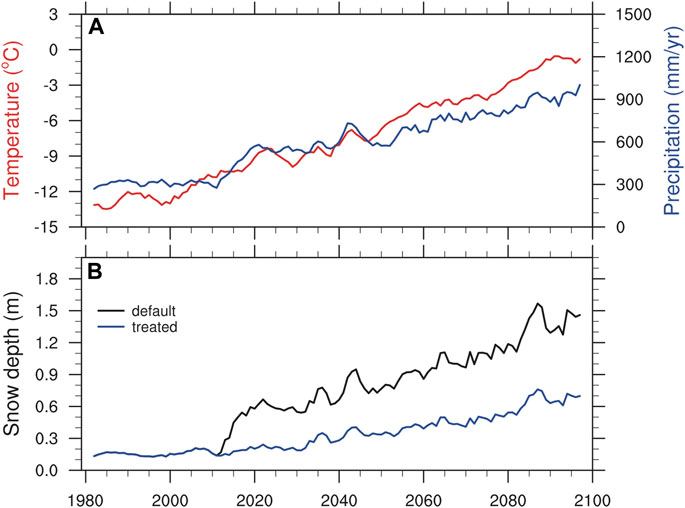
FIGURE 1. Variations in annual precipitation (blue) and annual mean air temperature (red) (A) and snow depth (B) simulated by the original forcing climate (default experiment) and when precipitation was reduced by 50% when compared with the original data (treated experiment). Air temperature and precipitation until 2013 were yielded by the combination of in situ observations and ERA-Interim reanalysis data (Miyazaki et al., 2015), and thereafter those were obtained from a single ensemble member of a projection simulation (RCP8.5) with Hadgem2-ES (Collins et al., 2008), as described in Model Experiments section.
The Tiksi field site is located in northeastern Siberia (71.4°N, 128.5°E), near the mouth of the Lena River and 5 km west of the Laptev Sea coast (Figure 2). The study site receives about 173 mm of precipitation annually, with 60% in the form of rain during the summer (June to September). Annual mean air temperature is about −13.5°C with an annual amplitude from an average of −33.3°C in January to an average of 7.5°C in August. Strong wind speed results in usually heterogeneous and shallow snow cover, recording maximum snow depths of about 40 cm. The site represents a typical lowland tundra landscape, characterized by small lakes and low flat plains of wet tundra, and hill slopes and mountains of dry tundra. Various vegetation types, such as non-tussock sedge, dwarf-shrubs, and moss, are distributed on flat plains and the lower parts of relatively gentle slopes. The top and steep-sloping part of the mountains is covered by gravel with lichen. Continuous and ice-rich permafrost underlies the ground. The thermo-erosion induced by the climate warming increases the expansion of thermokarst lakes and small ponds (Liljedahl et al., 2016). The tundra soil consists of water-/ice-saturated sandy peat, with the water table close to the surface. The mineral soil is a clay loam consisting of 35% silt, 32% sand, and 33% clay. The quantity of organic matter around the site is significantly heterogeneous, with values ranging between 3 and 85 kg m−3, and mean SOC values of 35 kg m−3 in the soil layer above 50 cm.
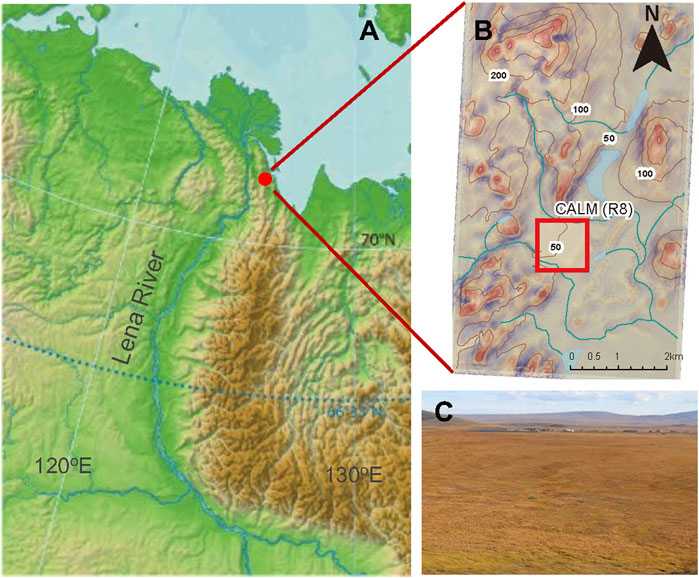
FIGURE 2. The study area showing the topography in the northeastern Siberia including the Tiksi region (red dot, A) in the main map and the topography map (B) and landscape (Iijima et al., 2016) (C) of the study site. The landscape photo was taken in August 2015.
Various meteorological variables have been recorded from a 10-m high observational tower since 1997. The meteorological variables (i.e., shortwave and longwave radiation, air temperature, precipitation, relative humidity, wind speed, and air pressure) were measured at different heights on the tower; however, heat, water vapor, and CO2 and CH4 fluxes have not been observed directly at this site.
The heterogeneous surface and subsurface properties of the study site likely produce large spatial variations in the soil thermal regime. ALT was monitored at a 1 km × 1 km CALM site established in 1998 (Iijima et al., 2016). The measurement was performed in grids with 100-m intervals, once a year in mid-September using a metal rod. Another site of moss-covered ground consisting of 12 points was established near the CALM site, to further monitor ALT in 2006. Two observation plots monitoring soil temperature were established in 2004 – the first plot was located in a flat and very wet area and the second was in a flattened wet area and a narrow valley about 500 m from the first site. The landscape of the plots was polygonal tundra, with low shrub, sedge, and moss cover. Moss cover was dominated by sphagnum. Each plot was equipped with two TR-52 single-channel temperature loggers (T&D Corp., Matsumoto, Japan). The temperature sensors were placed on the soil surface and in permafrost at depths of 0.5 and 0.6 m.
The CHANGE-simulated results for water and carbon fluxes and soil moisture and temperature profiles, which have previously been validated to observational records in this study site, showed statistically satisfactory performances for seasonal and interannual variability (Park et al., 2018). Although the CH4 process was newly added to CHANGE in this study, deficiencies in the observational data constrain the validation of model performance. Here, the ALTs simulated under various model settings were compared against the observational records, which enabled us to address the influence of climatic and surface conditions on ALT. The comparison between the simulated ALT and the observation shows that CHANGE captured the interannual variability of the observed ALT with +6 cm deviation during the period of 1997–2013 simulated by the current forcing climate (Figure 3). The observational values were averaged by records of points with different microclimates, soil properties, and vegetation characteristics. The one-dimensional CHANGE cannot accurately simulate the influences of these heterogeneities. This scale problem is one plausible reason for the difference in ALT between the simulated and observed values (Park et al., 2018). ALT was influenced more by snow cover than by moss cover (Figure 3). For example, the ALT simulated by EXCLMOS_BLS that excluded blowing snow was approximately 30 cm deeper than that by EXCLMOS that considered blowing snow, indicating the large cooling effect of thinner snow depth caused by blowing snow on ALT. The effect of moss cover on ALT was not larger than that of the blowing snow; CNTR, which considered moss cover, resulted in 5 cm lower ALT than EXCLMOS. Meanwhile, the comparison between CNTR and EXICET1_C15 showed small differences in ALT, revealing the slight impact of excess ice on ALT. Because the excess ice was located 1 m deeper than the ALT, it was part of the permafrost. Therefore, the latent heat effect was dominant at the ALT bottom (i.e., the permafrost table). Instead, the excess ice has a large cooling effect on permafrost temperature. The differences in ALT between the experiments (Figure 3) suggest that the representation of moss cover and blowing snow is an inevitable consideration in models for the correct projection of permafrost dynamics in tundra regions influenced by climate change. Previous studies highlighted the critical impact of SOC on ALT. For example, a simulation for Samoylov Island of northern Siberia, close to this study site, addressed that the inclusion of SOC reduced ALT by 50 cm relative to the exclusion (Chadburn et al., 2015).
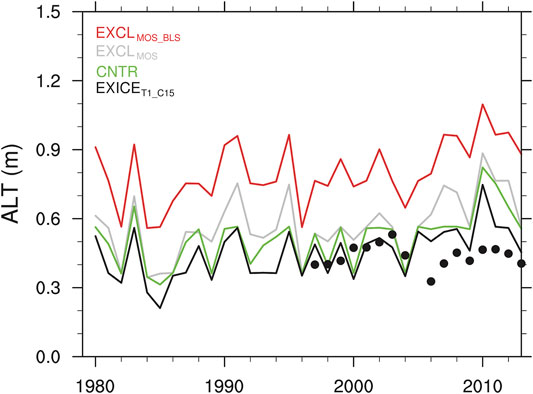
FIGURE 3. Simulated active layer thickness (ALT) based on different model settings compared with the observational records (dots). This comparison makes it possible to quantify the influence of excess ice, blowing snow, and moss cover on ALT through relative comparisons between simulations. Because the simulations from 2014 onwards were forced by the warming climate scenario RCP8.5, the comparison between observation and simulation is available until 2013.
The simulated ALT exhibited evident deepening during 1980–2099, driven by the warming climate (Figure 4C). The deepening was initiated from 2014 forced by the RCP8.5 climate conditions and became mostly significant from 2040 onwards when excess ice began to melt (Figure 4B). The rate of deepening increased over time, particularly under conditions of moss-free cover and excess ice exclusion (Figure 4C), where the resultant higher heat fluxes into the soil column were effective for the warming of permafrost. EXCLMOS_BLS of the default experiment resulted in 12 m of ALT during 2080–2099, which was considerably larger than that of the other simulations (Table 2). Comparison of the experimental ALTs confirmed that the presence of excess ice limited the ALT (Table 2). The limitation was largest in the cases with 30% ice contents of 3 m table; for example, ALT of EXICET3_C30 was 4 m during 2080–2099, which was three times lower than that of EXCLMOS_BLS because of the larger latent heat requirements for the excess ice melt. The surface soil layers repeat seasonally thawing and freezing even under the strong future emission scenarios, and the warming climates likely develop annually unfrozen talik layers beneath the ALT. It is therefore defined that ALT in this study is the maximum depth of unfrozen soil including talik.
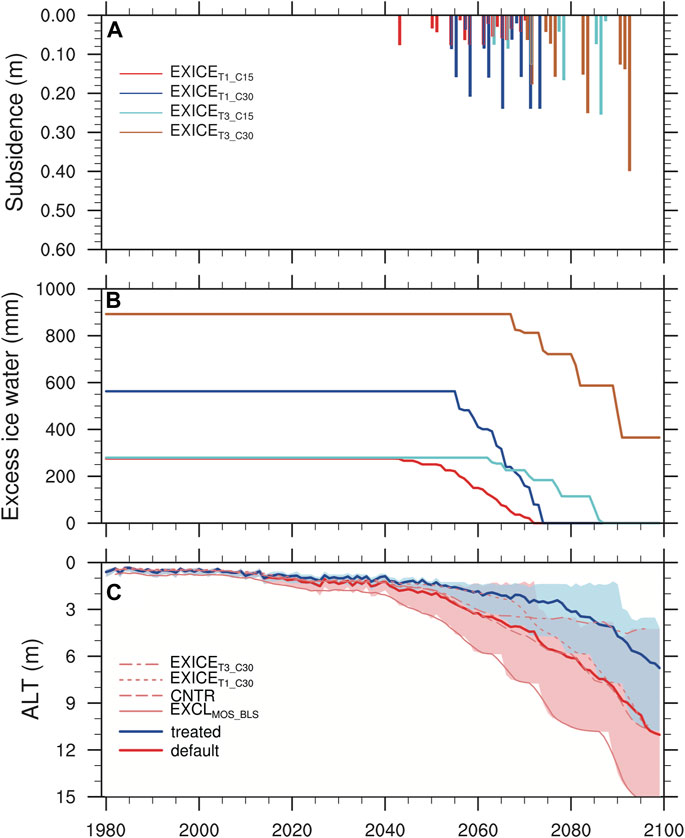
FIGURE 4. Interannual variability in estimated annual subsidence (A) caused by excess ice melt in the default experiment, including excess-ice water content (B) and active layer thickness (ALT) in the experiment (C). The colored lines of excess-ice water content (B) are consistent with the legends in panel (A). The shaded areas of ALT represent the range of maximum and minimum values among seven simulations in the default and treated experiments, and the thick lines in the figure indicate the average values of individual experiments. The different types of thin lines in the default experiment exhibit 3-year running averaged ALT for individual simulations.
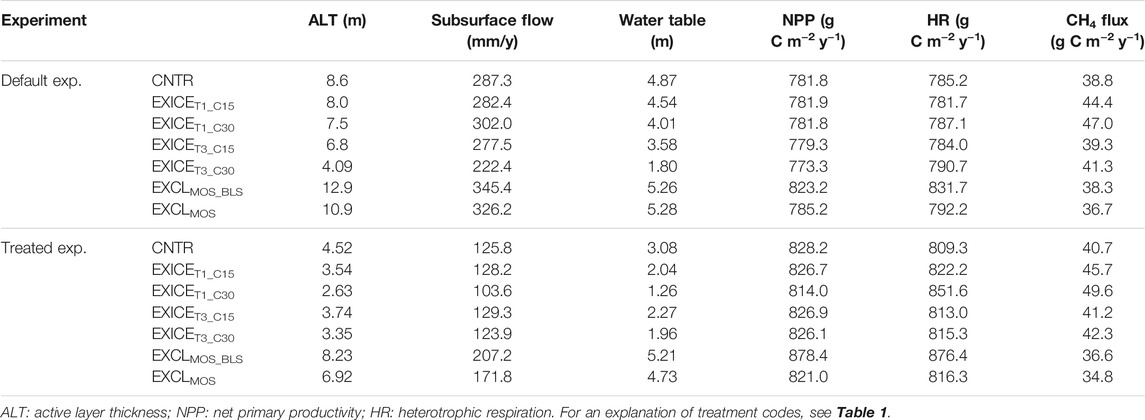
TABLE 2. Comparison of simulated components between simulations in individual experiments, averaged for the period 2080–2099. The annual methane (CH4) fluxes were averaged for the period of 2014–2099 forced by RCP8.5.
The treated experiments that reduced precipitation by 50% showed a time series of ALT variability similar to that of the default experiments. The absolute values of ALT under the same conditions were 45% larger on average in the default experiments than in the treated ones during 2080–2099 (Table 2), indicating the impact of snow on the ALT caused by the increased soil temperature. In the case of EXICET1_C15, for example, the snow depths in the two future periods (2030–2049 and 2080–2099) were considerably higher than in the present climate, despite later snow accumulation (Figures 5A,C). The thicker snow depth evidently has a larger insulation effect, preserving permafrost warming formed during summer and resulting in deeper ALT. A modeling study that treated snowfall magnitudes and snow seasons differently identified that changes in snow depth had larger impacts on thermal conditions of continuous rather than discontinuous permafrost and on colder Siberia than warmer North America (Park et al., 2015). The default experiment resulted in ALT of approximately 8 m on average during 2080–2099. The deeper ALT was also influenced by talik that was formed at the soil depth of 1 m or lower (Figures 5B,D). A large volume of water stored in the talik soil layers increases heat capacity and thermal conductivity, effectively dampening the annual temperature cycle (Subin et al., 2013; Lee et al., 2014), as identified in the seasonal ALT of the default experiment (Figure 5B). Interestingly, the talik was also found for the treated experiment with relatively thin snow depth (Figure 5D), which highlights the strong influence of the warming temperature on the talik, with high insulation effect of the snow depth and moss cover.
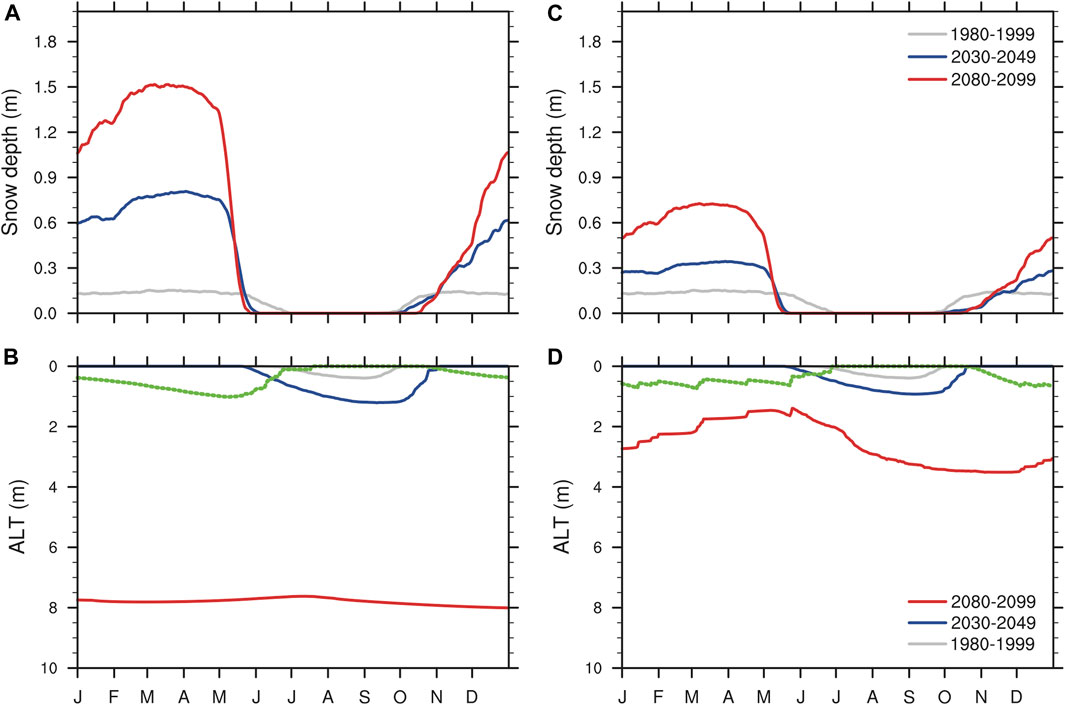
FIGURE 5. Comparisons of seasonal snow depths (A,C) and active layer thickness (ALT) (B,D) for the three decadal averages in the case of EXICET1_C15 of the default (left panels) and treated (right) experiments. The green lines in (B, D) represent the surface depth of talik.
The different setups of simulations in both experiments showed that excess ice in this study site preserved the initial state until 2040 because of the combined effects of less extreme emission scenario, the insulation of moss cover, and higher latent heat of excess ice, and thereafter it mostly melted by the end of the 21st century (Figures 4A,B). However, the melting time series showed evident differences between the simulations (Figure 4B). The timing and magnitude of excess ice melt was influenced by the distribution and amount of the initial excess ice; for example, the case EXICET1_C15 with lower excess ice resulted in advanced excess ice melt by approximately 10 years relative to the case of EXICET1_C30 (Figure 4B). In the case of EXICET3_C30, interestingly, a portion of excess ice remained until 2099 (Figure 4B) because of the higher latent heat effect associated with the higher excess ice content distributed at the deeper soil layer.
The excess ice melt resulted in land surface subsidence. The estimated annual subsidence ranged from 2 to 40 cm in the default simulations (Figure 4A). A simulation for Samoylov Island of northern Siberia, close to this study site, estimated surface subsidence of 35 cm by around 2030 and more than 1 m by the end of this century, based on the RCP4.5 warming scenario (Aas et al., 2019). Our results for subsidence show discontinuous occurrence in the time series of individual simulations. As permafrost thaws under the warming climate, excess ice simultaneously melts in nature. However, CHANGE used a physics model where excess ice starts to melt after permafrost of a soil layer is completely thawed. As the permafrost layer becomes active, the soil layer has already stored enough heat to rapidly melt the excess ice. Therefore, the physics model resulted in stepwise patterns of subsidence.
Permafrost and excess ice that are located at the base of the active layer greatly impede water flow below the layer. This leads to a relatively wet active layer and high water level. The simulations exhibited high water levels until 2040 (Figure 6A) when the excess ice was still intact (Figure 4); the water level rapidly lowered after the excess ice melted (Figure 6A). In the physics model, excess ice meltwater is added to soil moisture. The meltwater causes the base of the active layer to wet, so that the model groundwater becomes more active, leading to higher subsurface flow as observed in the simulations (Figure 6B). The runoff abruptly increased after 2040, although there were differences in the amount of runoff between the simulations (Figure 6B). In the treated experiments, the annual subsurface flow averaged 141.4 mm during 2080–2099, which corresponded to 31% of the annual precipitation averaged during the same period.
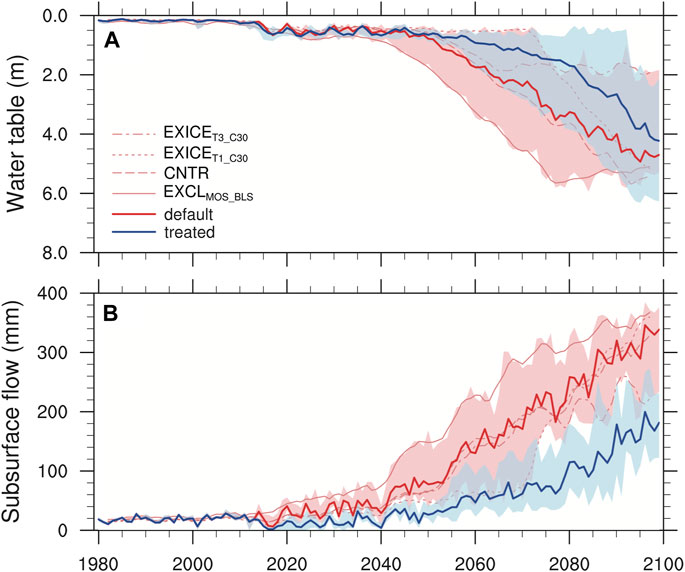
FIGURE 6. Interannual variability of water table (A) and subsurface flow (B) in the default (red) and treated (blue) experiments. The shaded areas and colored lines are the same as those in Figure 4.
As the ALT thickens, the meltwater from both excess ice and permafrost increases. Substantial amounts of unfrozen liquid water, defined as older soil moisture in the tracer scheme, is stored in permafrost soil. As the permafrost thaws, the liquid water becomes active and is involved in talik formation and subsurface flow. The tracer model quantified the largest contribution of the old soil moisture, which was the initial unfrozen water in the model setting, to the subsurface flow during 2080–2099 (Figure 7D). The excess ice meltwater accounted for 26% of the subsurface flow during the same period, which was not identified in the present climate. Both the old soil moisture and excess ice meltwater maintained high contribution rates to the subsurface flow with changing seasons, strongly implicating the talik in the runoff processes. The influence of the snow meltwater and rainwater on subsurface flow considerably decreased in the future when compared with the high fractions in the current climate (Figures 7B,D). The simulated results also displayed low fractions of the snow meltwater and rainwater constituting deeper soil moisture in the future, particularly at 1.6 m or deeper, while the excess ice meltwater increased at the same soil depths relative to the current climate (Figure 8).
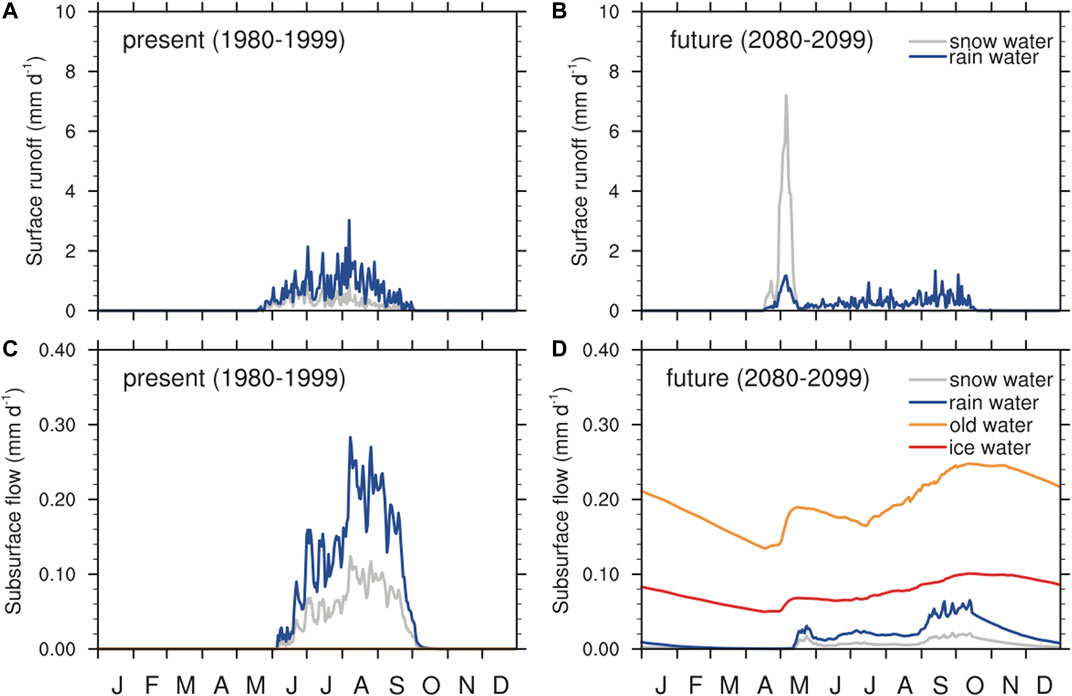
FIGURE 7. Contribution of source waters to the averaged seasonal surface (A,B) and subsurface (C,D) runoffs in the present (1980–1999, left) and future (2080–2099, right) climates in the case of EXICET1_C15 of the treated experiment. The contributions of source waters to runoffs were separated by the tracer scheme in CHANGE. The old water in (D) indicates the water that was existent as unfrozen type in the soil column by the initial model setup.
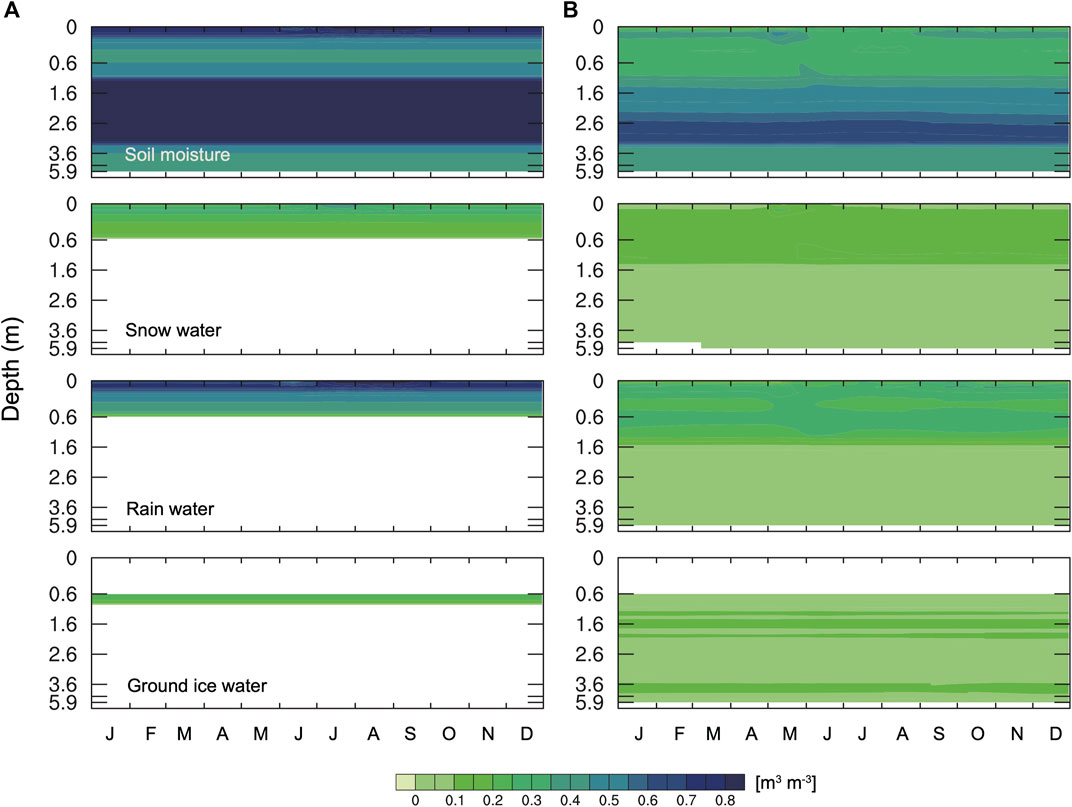
FIGURE 8. Seasonal variations in source waters composition of soil moisture in the soil column in the present (1980–1999, A) and future (2080–2099, B) climates in the case of CNTR of the treated experiment. The profiles of the tracer scheme separated source water were averaged in the two analyzed periods.
The future warming climate resulted in a drier environment in the upper soil layers relative to the present (Figure 8), despite the larger precipitation (Figure 1A). As ALT thickens, the higher conversion of excess ice meltwater to subsurface flow, as described above, was related to soil drying. The dried soil layers need more water for soil wetting. A portion of the available precipitation is used for soil wetting, which ultimately reduces water flowing to the deeper soil layers. In terms of soil moisture distribution, evapotranspiration increases moisture loss from the upper soil layers, thereby resulting in increased soil drying. The dry soil resulted in the decline of the water table (Figure 6A). The water table exhibited the declining trend toward the end of the 21st century, in which the interannual variability was also similar to the patterns of the subsurface flow and ALT, representing their interaction.
Soil moisture in the upper soil layers (i.e., 0–1 m) during 2080–2099 mainly distributed within the range of 0.2–0.3 m3 m−3, although it was drier than during 1980–1999 (Figure 8A). The future soil moisture was never low enough to constrain vegetation productivity or SOC decomposition. The simulated net primary productivity (NPP) of the study site continuously increased during the study period (Figure 9A), with slight differences in values between the model experiments during 2080–2099 (Table 2). The increase in NPP was large from 2014 when it was forced by the warming climate of RCP8.5. In the warming climate, there was no large difference in the annual mean NPPs of the two experiments. Interestingly, however, NPP of the default experiment showed slightly lower values than the treated one from 2060 onwards, despite the larger precipitation in the default experiment. The deeper ALT in the default relative to the treated experiment was linked to the decrease in soil moisture, as demonstrated by the lower water table (Table 2), which likely somewhat limits ecohydrological functions. The high precipitation during the summer season wets a large fraction of the vegetation, limiting temporary photosynthesis by plants (Park and Hattori, 2004). The simulated heterotrophic respiration (HR) exhibited similar variations to those identified for NPP (Figure 9B).
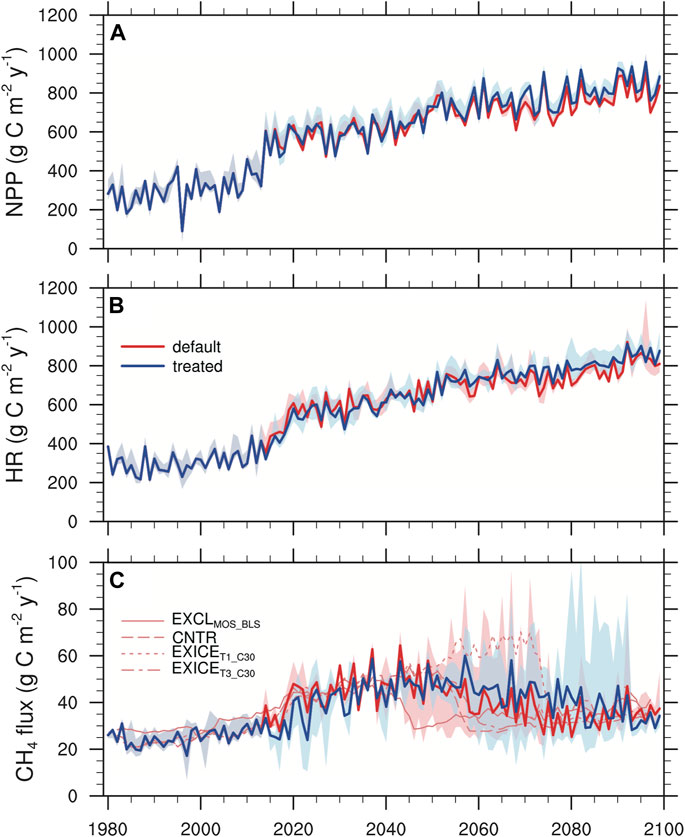
FIGURE 9. Interannual variability of simulated net primary productivity (NPP) (A), heterotrophic respiration (HR) (B), and methane (CH4) flux (C) for the default (red) and treated (blue) experiments. The shaded areas and colored lines are the same as those in Figure 4.
The simulated CH4 efflux displayed complex interannual variability and decadal trends (Figure 9C), considerably different to those identified for the simulated NPP and HR (Figures 9A,B). The warming climate forced increasing CH4 emission and HR from the permafrost soil to the atmosphere until 2040 when permafrost was still stable (Figure 4C), and the water level was relatively high (Figure 6A). Then, CH4 effluxes generally tended to decrease, although the timing was quite different according to the simulations; for example, CNTR of the default experiment represented the earliest decrease of CH4 efflux by 2040, because of the decreased soil moisture induced by the early permafrost thawing, while the experiments with excess ice simulated higher CH4 effluxes until the mid-2070s. The excess ice meltwater temporarily creates a wetted soil that efficiently generates CH4 effluxes. The model effectively simulated higher CH4 effluxes during excess ice melt. In contrast, the high conversion of excess ice meltwater to subsurface flow induced soil drying, as explained above, resulting in an abrupt decrease in CH4 effluxes because of the aerobic conditions. Despite of the soil drying, both NPP and HR continuously increased responding to the warming climate, inconsistent with the decreasing CH4 efflux. The precipitation in the future climate (Figure 1A) was as large as to alleviate the drying of the surface soil layers (Figure 8B), which contributed to higher vegetation productivity and respiration. The same variations in CH4 effluxes were identified in the treated experiments as those in the default experiments, although the timing of the projected higher CH4 effluxes was later relative to the default experiments. These model experimental results suggest that excess ice is an important component in the complex interannual variability of CH4 efflux.
The excess ice constrained the deepening of ALT; the magnitude of this response fluctuated depending on the ice content (Figure 4B). For example, at the cases that the surface of excess ice was 1 m, EXICET1_C30 with excess ice content of 30% lowered ALT by 50 cm relative to EXICET1_C15 with 15% during 2080–2099 (Table 2). At the cases of 3 m, the difference in ALT between EXICET3_C15 and EXICET3_C30 increased ALT by 2.7 m during the same period (Table 2), indicating larger latent heat effect by higher excess ice content.
The permafrost including excess ice impedes water flowing downward, wetting soil layers above the permafrost table and thereby resulting in a higher water level (Figure 6A). Under those conditions, the warming temperature warms the active soil layers, consequently increasing SOC decomposition. Excess ice melt contributed to increased CH4 efflux, with a larger response obtained for high ice content than for low ice content (Table 2). The depth of the excess ice table was also closely associated with the CH4 efflux, which was lower for an ice table depth of 3 m than of 1 m (Table 2). As the table of excess ice deepens, the thicker soil column intuitively slows the soil wetting and warming. These conditions are effective for limiting the CH4 efflux. Even though soil wetting and warming are extended to the deeper layers, CH4 efflux under the changed conditions might not be large because of smaller SOC storage in the deeper soil layers. The maximum estimated ALT was 60 cm during the model spinup of 1,200 years. SOC is mainly stored in the active layers. As ALT is thickened by the warming climate, SOC also flows down. However, the amount of SOC flowing to 3 m was low, hence the low CH4 efflux.
Because of the lack of excess ice datasets and observational evidence, our model projections of excess ice melt and associated processes likely have biases that arise from model settings and simplifications of the excess ice initialization. However, the sensitivity experiments can potentially improve our understanding of the impacts of excess ice melt on hydrological and biogeochemical processes. The water tracer model in CHANGE tracks pathways of excess ice meltwater in the soil system and assesses their contribution to hydrological processes.
The excess ice and permafrost act as a barrier to water infiltration because of the low conductivity of icy soils, storing the inflowing precipitation water within the active layers. The large volume of stored water induces higher heat capacity and conductivity, dampening the annual soil temperature cycles (Subin et al., 2013), in which warming climate forces permafrost thawing and excess ice melt. As soon as the excess ice melts, the ALT bottom layers are wetted by the melt water. The wetted soil moisture was connected to the subsurface flow (Liljedahl et al., 2016). Once excess ice melts, there is no additional water production from the soil layer. During these processes, subsidence occurs, and the excess ice meltwater is linked to the upper soil moisture that is mainly the result of precipitation (i.e., snowmelt and rainwater). However, evapotranspiration and the recharge of soil moisture preferentially use precipitation water inflowing from the surface, and thus there is limited connectivity of the precipitation to the deeper soil moisture. As a result, the soil column tends to be dried as ALT deepens, and the water level is lowered. CHANGE captured both the weakening signal of the connectivity of surface soil moisture to the deeper soil, and the hydrological regime of thawed permafrost tipping as a consequence of melted excess ice to a dominance of unsaturated soil condition (Aas et al., 2019; Nitzbon et al., 2020). The excess ice has a contrary effect of temporarily limiting rapid soil drying in the melting stage. At the bottom of the active layer, the excess ice melt water-induced wetting reduces water input from the upper soil layers because of the reversed large moisture gradient. The moisture gradient gradually decreases with the increasing subsurface flow, so that soil is dried. The excess ice melting lasted for 15–20 years dependent on the excess ice settings. In practice, the model setups that excluded excess ice simulated earlier soil drying than experiments that included the excess ice (Figure 6A).
The simulated regime of soil moisture is strongly dependent on the assumptions for the modeling. Under water-logged conditions, the melting of excess ice would develop deep water-filled troughs, and potentially form thermokarst lakes and ponds (Nitzbon et al., 2020). Furthermore, excess ice melt and associated ground subsidence increases the lateral hydrological connectivity of the natural landscape, causing higher water levels in the depressed lowlands. However, models lacking in the representation of thermokarst-inducing processes likely underestimate permafrost thaw dynamics and resultant carbon fluxes. A modeling study highlighted differences of 2–12 times in SOC decomposition between two experiments that included and excluded thermokarst-inducing processes in northeastern Siberia (Nitzbon et al., 2020). As mentioned before, CHANGE employed one-dimensional physics of permafrost thaw dynamics considering only the vertical heterogeneity of excess ice. It was assumed that the excess ice meltwater was connected to soil moisture dynamics and subsurface flow generation. The simplistic representation of CHANGE likely yields biased projections for the subsurface hydrology crucially influenced by heterogeneous microtopography, lateral hydrological connectivity and ground subsidence. In reality, CHANGE simulated wetter soil and higher subsurface flow after the melt of excess ice (Figure 7) and subsequent higher carbon releases (Figure 9). However, our simulations provide important insights for excess ice melt and associated changing hydrology and carbon fluxes under well-drained conditions. Following the simulated results, the default experiments with large precipitation produced large HR and CH4 (Figure 9) until 2040 when permafrost was stable, while larger production of HR and CH4 was found in the treated experiments after this time. However, the differences between the two experiments were not large. This is probably because of the relatively similar moisture environments in their upper soil layers that were relatively sensitive to precipitation. Although the default experiments simulated dry soil and lower water table level (Figure 6), the high precipitation was efficient in alleviating drying of the upper soil layers.
The CH4 fluxes showed different variations than that of HR. After 2060 when excess ice melted, the interannual variability of CH4 effluxes was large and exhibited considerable differences between simulations (Figure 9). Earlier occurrence of high CH4 efflux was found in the simulations with the surface of excess ice of 1 m than in ones with 3 m. Moreover, CH4 efflux was further increased in the simulations with higher volumetric contents of excess ice. These results indicate that the initialization of excess ice greatly affects CH4 efflux. Therefore, the model projection of CH4 efflux utterly relies on the initial settings of excess ice. Because of the scarcity of observational data, however, this study employed the active layer-dependent excess ice initialization for modeling, together with statistical and empirical knowledge of the vertical extent and depth of excess ice as used in previous modeling studies (Lee et al., 2014; Aas et al., 2019; Cai et al., 2020). These configurations of excess ice still likely deviated from the actual ice features. We do not therefore expect the modeled excess ice melt and CH4 efflux in this study to be an adequate representation of reality. However, our simulations could be used to infer the timing and magnitude of excess ice melt and associated carbon and CH4 fluxes, and possible changes in soil hydrology under the well-drained condition.
Locally developing thermokarst lakes have recently been observed in this study site (Liljedahl et al., 2016), which could have been induced by natural or anthropogenic disturbances like the accumulation of snow in topographic depressions, the removal of vegetation or moss cover, and forest and tundra fires (Jones et al., 2015; Nauta et al., 2015; Abolt et al., 2018). Here, our model results provide evidence for the early excess ice melt as a result of higher insulation of thicker snow and thus enhanced soil drying. The simulation that excluded moss cover also estimated considerably earlier excess ice melt than the undisturbed case. In contrast, the high cooling by moss cover limited ALT deepening, hence stable permafrost. A simulation including excess ice initialization for the Lena River delta close to our site estimated the initiation of excess ice melt before 2020 (Cai et al., 2020). The melt timing is quite fast relative to our result showing stable permafrost until 2040 (Figure 4). The different model structure and settings make it impossible to directly compare the two results. Considering that the model used by Cai et al. (2020) did not consider the influence of moss cover, here we could expect further easy warming of permafrost under the moss-free condition. Park et al. (2018) found that 4-cm-thick moss cover reduced the ALT by 14 cm relative to the moss-free case. These results suggest that model improvement including moss cover as a land component is required for realistic representation of permafrost features under warming climate conditions.
Recent observations reported complex landscape development in the terrestrial Arctic, such as thermokarst ponds and lakes of meter-scale distribution (Liljedahl et al., 2016; Ulrich et al., 2017). To represent the small-scale permafrost features, models employed sub-tile interactive setups that simulated microtopographic changes associated with degradation of ice-rich permafrost, considering the lateral water flux (Aas et al., 2019; Nitzbon et al., 2020). The sub-tile representation of excess ground ice within permafrost soil was used for the global simulation without the lateral flux (Cai et al., 2020). The sub-tiling approach preferentially needs available observational data for the model simulation, which is substantially consistent with the requirements of our model. Therefore, the introduction of the tiling system could be a direction for the future development of CHANGE, particularly by configuring an optional function whereby lateral heat and water fluxes could be switched on and off dependent on topography. Laterally coupled tiling likely builds more potential for better modeling subscale variability of soil and snow, consequently improving permafrost–water–carbon feedbacks.
This study coupled an excess ice scheme to CHANGE and examined the impacts of excess ice on permafrost, soil water dynamics, and carbon and methane fluxes in a Siberian tundra site under the strong future emission scenarios. The model results indicated that the warming air temperature and higher snow depth were major factors deriving ALT increasing and the resultant permafrost degradation. Under the warming permafrost, in contrast, excess ice thermally stabilized permafrost until it melts, which was further significant under the conditions of larger excess ice content and moss cover. As excess ice melts, however, the meltwater was connected to hydrologic and thermal regimes, and the resultant wetted and warm soil was positively fed back to higher subsurface flow, permafrost degradation, and temporarily higher CH4 efflux. These results provide insights for interactions and feedbacks between climate change, permafrost excess ice, and carbon fluxes in a well-drained condition.
The insights obtained by this study represented that the magnitude and timing of excess ice melt are largely dependent on the model settings. The model parameterization and initialization of excess ice remain necessarily simplistic, which highlights the importance of the connectivity of the excess ice meltwater to the subsurface flow and subsequent implications for carbon fluxes. Therefore, future model improvement emphasizes the necessity of coupling tiling hierarchy to CHANGE, which would enable a more comprehensive examination of the possible trajectory of the permafrost carbon–climate feedback under changing climate.
The raw data supporting the conclusions of this article will be made available by the authors, without undue reservation.
HP developed the ideas, wrote most of this paper and drew most of the figures. All authors participated in data processing and preliminary analysis; HP and TH coordinated the model experiments and analyzed the simulation results; AF and PK collected and analyzed in situ observational data.
This study was partly supported by the Japan Society for the Promotion of Science KAKENHI Grant Number 17H01870, 19H05668, and 21H04934. It was also supported by JST Belmont Forum Grant Number JPMJBF2003, Japan, and the Arctic Challenge for Sustainability II (ArCS II; JPMXD1420318865) project funded by the Ministry of Education, Culture, Sports, Science and Technology (MEXT), Japan.
The authors declare that the research was conducted in the absence of any commercial or financial relationships that could be construed as a potential conflict of interest.
The handling editor is currently organizing a Research Topic with one of the authors AF.
All claims expressed in this article are solely those of the authors and do not necessarily represent those of their affiliated organizations, or those of the publisher, the editors and the reviewers. Any product that may be evaluated in this article, or claim that may be made by its manufacturer, is not guaranteed or endorsed by the publisher.
We thank Catherine Dandie, from Edanz (https://jp.edanz.com/ac) for editing a draft of this manuscript.
The Supplementary Material for this article can be found online at: https://www.frontiersin.org/articles/10.3389/feart.2021.704447/full#supplementary-material
Aas, K. S., Martin, L., Nitzbon, J., Langer, M., Boike, J., Lee, H., et al. (2019). Thaw Processes in Ice-Rich Permafrost Landscapes Represented with Laterally Coupled Tiles in a Land Surface Model. The Cryosphere 13, 591–609. doi:10.5194/tc-13-591-2019
Abolt, C. J., Young, M. H., Atchley, A. L., and Harp, D. R. (2018). Microtopographic Control on the Ground thermal Regime in Ice Wedge Polygons. The Cryosphere 12, 1957–1968. doi:10.5194/tc-12-1957-2018
Beven, K. J., and Kirkby, M. J. (1979). A physically based, variable contributing area model of basin hydrology/Un modèle à base physique de zone d'appel variable de l'hydrologie du bassin versant. Hydrological Sci. Bull. 24, 43–69. doi:10.1080/02626667909491834
Bisht, G., Riley, W. J., Wainwright, H. M., Dafflon, B., Yuan, F., and Romanovsky, V. E. (2018). Impacts of Microtopographic Snow Redistribution and Lateral Subsurface Processes on Hydrologic and thermal States in an Arctic Polygonal Ground Ecosystem: a Case Study Using ELM-3D v1.0. Geosci. Model. Dev. 11, 61–76. doi:10.5194/gmd-11-61-2018
Biskaborn, B. K., Smith, S. L., Noetzli, J., Matthes, H., Vieira, G., Streletskiy, D. A., et al. (2019). Permafrost Is Warming at a Global Scale. Nat. Commun. 10, 264. doi:10.1038/s41467-018-08240-4
Bowling, L. C., Cherkauer, K. A., and Adam, J. C. (2008). “Current Capabilities in Soil thermal Representations within a Large-Scale Hydrology Model for Regions of Continuous Permafrost,” in Proceeding of Ninth International Conference of Permafrost, 177–182.
Cai, L., Lee, H., Aas, K. S., and Westermann, S. (2020). Projecting Circum-Arctic Excess-Ground-Ice Melt with a Sub-grid Representation in the Community Land Model. The Cryosphere 14, 4611–4626. doi:10.5194/tc-14-4611-2020
Chadburn, S., Burke, E., Essery, R., Boike, J., Langer, M., Heikenfeld, M., et al. (2015). An Improved Representation of Physical Permafrost Dynamics in the JULES Land-Surface Model. Geosci. Model. Dev. 8, 1493–1508. doi:10.5194/gmd-8-1493-2015
Collins, W. J., Bellouin, N., Doutriaux-Boucher, M., Gedney, T., Hinton, J., Jones, C. D., et al. (2008). Evaluation of the HadGEM2 model. Met Office Hadley Centre Technical Note no. HCTN 74. Available at: Met Office, FitzRoy Road, Exeter EX1 3PB. http://www.metoffice.gov.uk/publications/HCTN/index.html
Collatz, G. J., Ball, J. T., Grivet, C., and Berry, J. A. (1991). Physiological and Environmental Regulation of Stomatal Conductance, Photosynthesis and Transpiration: a Model that Includes a Laminar Boundary Layer. Agric. For. Meteorology 54, 107–136. doi:10.1016/0168-1923(91)90002-8
Cresto Aleina, F., Brovkin, V., Muster, S., Boike, J., Kutzbach, L., Sachs, T., et al. (2013). A Stochastic Model for the Polygonal Tundra Based on Poisson-Voronoi Diagrams. Earth Syst. Dynam. 4, 187–198. doi:10.5194/esd-4-187-2013
Farquhar, G. D., Von Caemmerer, S., and Berry, J. A. (1980). A Biochemical Model of Photosynthetic CO2 Assimilation in Leaves of C3 Species. Planta 149, 78–90. doi:10.1007/BF00386231
Fedorov, A. N., Gavriliev, P. P., Konstantinov, P. Y., Hiyama, T., Iijima, Y., and Iwahana, G. (2014). Estimating the Water Balance of a Thermokarst lake in the Middle of the Lena River basin, Eastern Siberia. Ecohydrol. 7, 188–196. doi:10.1002/eco.1378
Gedney, N., and Cox, P. M. (2003). The Sensitivity of Global Climate Model Simulations to the Representation of Soil Moisture Heterogeneity. J. Hydrometeor 4, 1265–1275. doi:10.1175/1525-7541(2003)004<1265:tsogcm>2.0.co;2
Grant, R. F., Mekonnen, Z. A., Riley, W. J., Wainwright, H. M., Graham, D., and Torn, M. S. (2017). Mathematical Modelling of Arctic Polygonal Tundra with Ecosys : 1. Microtopography Determines How Active Layer Depths Respond to Changes in Temperature and Precipitation. J. Geophys. Res. Biogeosci. 122, 3161–3173. doi:10.1002/2017jg004035
Hugelius, G., Strauss, J., Zubrzycki, S., Harden, J. W., Schuur, E. A. G., Ping, C.-L., et al. (2014). Estimated Stocks of Circumpolar Permafrost Carbon with Quantified Uncertainty Ranges and Identified Data Gaps. Biogeosciences 11, 6573–6593. doi:10.5194/bg-11-6573-2014
Iijima, Y., Park, H., Konstantinov, P. Y., Pudov, G. G., and Fedorov, A. N. (2016). Active-layer Thickness Measurements Using a Handheld Penetrometer at Boreal and Tundra Sites in Eastern Siberia. Permafrost Periglac. Process. 28, 306–313. doi:10.1002/ppp.1908
Jones, B. M., Grosse, G., Arp, C. D., Miller, E., Liu, L., Hayes, D. J., et al. (2015). Recent Arctic Tundra Fire Initiates Widespread Thermokarst Development. Sci. Rep. 5, 15865. doi:10.1038/srep15865
Jorgenson, M. T., Shur, Y. L., and Pullman, E. R. (2006). Abrupt Increase in Permafrost Degradation in Arctic Alaska. Geophys. Res. Lett. 33, L02503. doi:10.1029/2005gl024960
Koven, C. D., Lawrence, D. M., and Riley, W. J. (2015). Permafrost Carbon−climate Feedback Is Sensitive to Deep Soil Carbon Decomposability but Not Deep Soil Nitrogen Dynamics. Proc. Natl. Acad. Sci. USA. 112, 3752–3757. doi:10.1073/pnas.1415123112
Koven, C. D., Ringeval, B., Friedlingstein, P., Ciais, P., Cadule, P., Khvorostyanov, D., et al. (2011). Permafrost Carbon-Climate Feedbacks Accelerate Global Warming. Proc. Natl. Acad. Sci. 108, 14769–14774. doi:10.1073/pnas.1103910108
Kumar, J., Collier, N., Bisht, G., Mills, R. T., Thornton, P. E., Iversen, C. M., et al. (2016). Modeling the Spatiotemporal Variability in Subsurface thermal Regimes across a Low-Relief Polygonal Tundra Landscape. The Cryosphere 10, 2241–2274. doi:10.5194/tc-10-2241-2016
Kurylyk, B. L., Hayashi, M., Quinton, W. L., McKenzie, J. M., and Voss, C. I. (2016). Influence of Vertical and Lateral Heat Transfer on Permafrost Thaw, Peatland Landscape Transition, and Groundwater Flow. Water Resour. Res. 52, 1286–1305. doi:10.1002/2015wr018057
Lara, M. J., McGuire, A. D., Euskirchen, E. S., Tweedie, C. E., Hinkel, K. M., Skurikhin, A. N., et al. (2015). Polygonal Tundra Geomorphological Change in Response to Warming Alters Future CO 2 and CH 4 Flux on the Barrow Peninsula. Glob. Change Biol. 21, 1634–1651. doi:10.1111/gcb.12757
Launiainen, S., Katul, G. G., Lauren, A., and Kolari, P. (2015). Coupling Boreal forest CO2, H2O and Energy Flows by a Vertically Structured forest Canopy - Soil Model with Separate Bryophyte Layer. Ecol. Model. 312, 385–405. doi:10.1016/j.ecolmodel.2015.06.007
Lawrence, D. M., Slater, A. G., and Swenson, S. C. (2012). Simulation of Present-Day and Future Permafrost and Seasonally Frozen Ground Conditions in CCSM4. J. Clim. 25, 2207–2225. doi:10.1175/jcli-d-11-00334.1
Lee, H., Swenson, S. C., Slater, A. G., and Lawrence, D. M. (2014). Effects of Excess Ground Ice on Projections of Permafrost in a Warming Climate. Environ. Res. Lett. 9, 124006. doi:10.1088/1748-9326/9/12/124006
Liljedahl, A. K., Boike, J., Daanen, R. P., Fedorov, A. N., Frost, G. V., Grosse, G., et al. (2016). Pan-Arctic Ice-Wedge Degradation in Warming Permafrost and its Influence on Tundra Hydrology. Nat. Geosci. 9, 312–318. doi:10.1038/ngeo2674
Melton, J. R., Wania, R., Hodson, E. L., Poulter, B., Ringeval, B., Spahni, R., et al. (2013). Present State of Global Wetland Extent and Wetland Methane Modelling: Conclusions from a Model Inter-comparison Project (WETCHIMP). Biogeosciences 10, 753–788. doi:10.5194/bg-10-753-2013
Meng, L., Hess, P. G. M., Mahowald, N. M., Yavitt, J. B., Riley, W. J., Subin, Z. M., et al. (2012). Sensitivity of Wetland Methane Emissions to Model Assumptions: Application and Model Testing against Site Observations. Biogeosciences 9, 2793–2819. doi:10.5194/bg-9-2793-2012
Miyazaki, S., Saito, K., Mori, J., Yamazaki, T., Ise, T., Arakida, H., et al. (2015). The GRENE-TEA Model Intercomparison Project (GTMIP): Overview and experiment Protocol for Stage 1. Geosci. Model. Dev. 8, 2841–2856. doi:10.5194/gmd-8-2841-2015
Moss, R. H., Edmonds, J. A., Hibbard, K. A., Manning, M. R., Rose, S. K., van Vuuren, D. P., et al. (2010). The Next Generation of Scenarios for Climate Change Research and Assessment. Nature 463, 747–756. doi:10.1038/nature08823
Nauta, A. L., Heijmans, M. M. P. D., Blok, D., Limpens, J., Elberling, B., Gallagher, A., et al. (2015). Permafrost Collapse after Shrub Removal Shifts Tundra Ecosystem to a Methane Source. Nat. Clim Change 5, 67–70. doi:10.1038/nclimate2446
Nitzbon, J., Westermann, S., Langer, M., Martin, L. C. P., Strauss, J., Laboor, S., et al. (2020). Fast Response of Cold Ice-Rich Permafrost in Northeast Siberia to a Warming Climate. Nat. Commun. 11, 2201. doi:10.1038/s41467-020-15725-8
Park, H., Fedorov, A. N., Zheleznyak, M. N., Konstantinov, P. Y., and Walsh, J. E. (2015). Effect of Snow Cover on Pan-Arctic Permafrost thermal Regimes. Clim. Dyn. 44, 2873–2895. doi:10.1007/s00382-014-2356-5
Park, H., and Hattori, S. (2004). Modeling Scalar and Heat Sources, Sinks, and Fluxes within a forest Canopy during and after Rainfall Events. J. Geophys. Res. 109, D14301. doi:10.1029/2003JD004360
Park, H., Iijima, Y., Yabuki, H., Ohta, T., Walsh, J., Kodama, Y., et al. (2011). The Application of a Coupled Hydrological and Biogeochemical Model (CHANGE) for Modeling of Energy, Water, and CO2exchanges over a Larch forest in Eastern Siberia. J. Geophys. Res. 116, D15102. doi:10.1029/2010JD015386
Park, H., Launiainen, S., Konstantinov, P. Y., Iijima, Y., and Fedorov, A. N. (2018). Modeling the Effect of moss Cover on Soil Temperature and Carbon Fluxes at a Tundra Site in Northeastern Siberia. J. Geophys. Res. Biogeosci. 123, 3028–3044. doi:10.1029/2018JG004491
Park, H., Tanoue, M., Ichiyanagi, K., Iwahana, G., and Hiyama, T. (2021). Tracer Model-Based Quantitative Separation of Precipitation and Permafrost Waters Used for Evapotranspiration in a Boreal forest. Washington: ESSOAr. doi:10.1002/essoar.105063.1
Qiu, C., Zhu, D., Ciais, P., Guenet, B., Krinner, G., Peng, S., et al. (2018). ORCHIDEE-PEAT (Revision 4596), a Model for Northern Peatland CO2, Water, and Energy Fluxes on Daily to Annual Scales. Geosci. Model. Dev. 11, 497–519. doi:10.5194/gmd-11-497-2018
Riley, W. J., Subin, Z. M., Lawrence, D. M., Swenson, S. C., Torn, M. S., Meng, L., et al. (2011). Barriers to Predicting Changes in Global Terrestrial Methane Fluxes: Analyses Using CLM4Me, a Methane Biogeochemistry Model Integrated in CESM. Biogeosciences 8, 1925–1953. doi:10.5194/bg-8-1925-2011
Schuur, E. A. G., Bockheim, J., Canadell, J. G., Euskirchen, E., Field, C. B., Goryachkin, S. V., et al. (2008). Vulnerability of Permafrost Carbon to Climate Change: Implications for the Global Carbon Cycle. BioScience 58, 701–714. doi:10.1641/B580807
Sjöberg, Y., Coon, E., K. Sannel, A. B., Pannetier, R., Harp, D., Frampton, A., et al. (2016). Thermal Effects of Groundwater Flow through Subarctic Fens: A Case Study Based on Field Observations and Numerical Modeling. Water Resour. Res. 52, 1591–1606. doi:10.1002/2015wr017571
Subin, Z. M., Koven, C. D., Riley, W. J., Torn, M. S., Lawrence, D. M., and Swenson, S. C. (2013). Effects of Soil Moisture on the Responses of Soil Temperatures to Climate Change in Cold Regions*. J. Clim. 26, 3139–3158. doi:10.1175/JCLI-D-12-00305.1
Turetsky, M. R., Abbott, B. W., Jones, M. C., Anthony, K. W., Olefeldt, D., Schuur, E. A. G., et al. (2020). Carbon Release through Abrupt Permafrost Thaw. Nat. Geosci. 13, 138–143. doi:10.1038/s41561-019-0526-0
Turetsky, M. R., Abbott, B. W., Jones, M. C., Walter Anthony, K., Olefeldt, D., Schuur, E. A. G., et al. (2019). Permafrost Collapse Is Accelerating Carbon Release. Nature 569, 32–34. doi:10.1038/d41586-019-01313-4
Ulrich, M., Matthes, H., Schirrmeister, L., Schütze, J., Park, H., Iijima, Y., et al. (2017). Differences in Behavior and Distribution of Permafrost‐related Lakes in C Entral Y Akutia and Their Response to Climatic Drivers. Water Resour. Res. 53, 1167–1188. doi:10.1002/2016WR019267
Keywords: land surface model, subsurface flow, subsidence, permafrost excess ice, carbon and methane fluxes
Citation: Park H, Fedorov AN, Konstantinov P and Hiyama T (2021) Numerical Assessments of Excess Ice Impacts on Permafrost and Greenhouse Gases in a Siberian Tundra Site Under a Warming Climate. Front. Earth Sci. 9:704447. doi: 10.3389/feart.2021.704447
Received: 03 May 2021; Accepted: 07 September 2021;
Published: 22 September 2021.
Edited by:
Ko Van Huissteden, Vrije Universiteit Amsterdam, NetherlandsReviewed by:
Michelle Walvoord, United States Geological Survey (USGS), United StatesCopyright © 2021 Park, Fedorov, Konstantinov and Hiyama. This is an open-access article distributed under the terms of the Creative Commons Attribution License (CC BY). The use, distribution or reproduction in other forums is permitted, provided the original author(s) and the copyright owner(s) are credited and that the original publication in this journal is cited, in accordance with accepted academic practice. No use, distribution or reproduction is permitted which does not comply with these terms.
*Correspondence: Hotaek Park, cGFya0BqYW1zdGVjLmdvLmpw
Disclaimer: All claims expressed in this article are solely those of the authors and do not necessarily represent those of their affiliated organizations, or those of the publisher, the editors and the reviewers. Any product that may be evaluated in this article or claim that may be made by its manufacturer is not guaranteed or endorsed by the publisher.
Research integrity at Frontiers
Learn more about the work of our research integrity team to safeguard the quality of each article we publish.