 M. Chlieh
 C. Beauval
 H. Yepes
 J. Marinière
 M. Saillard
 L. Audin
- 1ISTerre, IRD, Université Grenoble Alpes, Université Savoie Mont Blanc, CNRS, Université Gustave Eiffel, Grenoble, France
- 2Instituto Geofísico, Escuela Politécnica Nacional, Quito, Ecuador
- 3Université Côte D’Azur, IRD, CNRS, Observatoire de La Côte D’Azur, Géoazur, France
The Colombia–Ecuador subduction zone is an exceptional natural laboratory to study the seismic cycle associated with large and great subduction earthquakes. Since the great 1906 Mw = 8.6 Colombia–Ecuador earthquake, four large Mw > 7.5 megathrust earthquakes occurred within the 1906 rupture area, releasing altogether a cumulative seismic moment of ∼35% of the 1906 seismic moment. We take advantage of newly released seismic catalogs and global positioning system (GPS) data at the scale of the Colombia–Ecuador subduction zone to balance the moment deficit that is building up on the megathrust interface during the interseismic period with the seismic and aseismic moments released by transient slip episodes. Assuming a steady-state interseismic loading, we found that the seismic moment released by the 2016 Mw = 7.8 Pedernales earthquake is about half of the moment deficit buildup since 1942, suggesting that the Pedernales segment was mature to host that seismic event and its postseismic afterslip. In the aftermath of the 2016 event, the asperities that broke in 1958 and 1979 both appears to be mature to host a large Mw > 7.5 earthquakes if they break in two individual seismic events, or an Mw∼7.8–8.0 earthquake if they break simultaneously. The analysis of our interseismic-coupling map suggests that the great 1906 Colombia–Ecuador earthquake could have ruptured a segment of 400 km-long bounded by two 80 km wide creeping segments that coincide with the entrance into the subduction of the Carnegie ridge in Ecuador and the Yaquina Graben in Colombia. These creeping segments share similar frictional properties and may both behave as strong seismic barriers able to stop ruptures associated with great events like in 1906. Smaller creeping segments are imaged within the 1906 rupture area and are located at the extremities of the large 1942, 1958, 1979, and 2016 seismic ruptures. Finally, assuming that the frequency–magnitude distribution of megathrust seismicity follows the Gutenberg–Richter law and considering that 50% of the transient slip on the megathrust is aseismic, we found that the maximum magnitude subduction earthquake that can affect this subduction zone has a moment magnitude equivalent to Mw ∼8.8 with a recurrence time of 1,400 years. No similar magnitude event has yet been observed in that region.
Introduction
The Colombia–Ecuador subduction zone extends about 900 km, measured along the trench axis, from the Gulf of Guayaquil (3°S) in South Ecuador to Buenavantura (4°N) in Colombia (Figure 1). This subduction segment has experienced the great (Mw > 8.5) 1906 Colombia–Ecuador megathrust earthquake; however, many uncertainties remain on its exact moment magnitude that fluctuates from 8.5 to 9.0 in the scientific literature and on its rupture length that is proposed between 300 and 500 km long (Kanamori and McNally, 1982; Kelleher, 1972; Mendoza and Dewey, 1984). From the analysis of long-period surface wave records, it was suggested that the 1906 earthquake did not exceed Mw = 8.5 (Okal, 1992), a magnitude similar from its associated tsunami’s height modeling with a rupture length of ∼300 km (Tsuzuki et al., 2017; Yoshimoto et al., 2017). Reassessments of the 1906 seismic moment suggest a moment magnitude Mw = 8.6 (Ye et al., 2016) that will be our reference moment magnitude for this study (Table 1). Recent cores collected offshore Esmeraldas at 3,000 m below sea level that samples the last 800 years indicate that the comparison of the main features of the 1906 turbidite with older earthquake-triggered turbidites suggests that a great earthquake similar to the 1906 event might have occurred ∼600 years ago (Migeon et al., 2017).
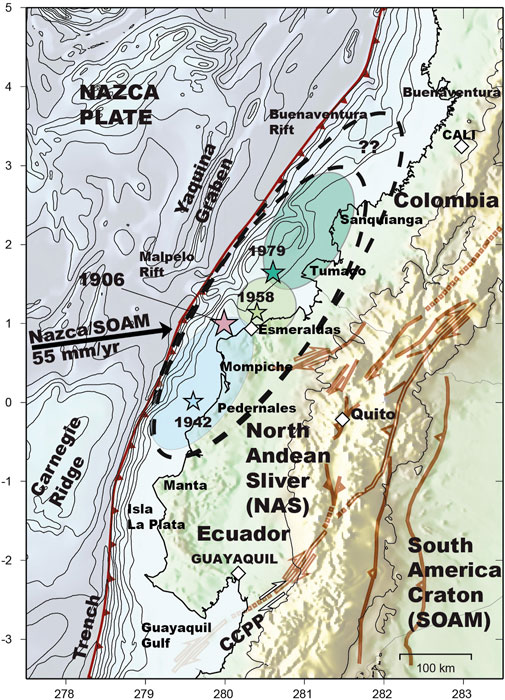
FIGURE 1. Seismotectonic setting of the Ecuador–Colombia subduction zone where the Nazca plate subducts below the North Andean Sliver (NAS) and the South America Craton (SOAM). The Carnegie Ridge and the Yaquina Graben are the two main geomorphological features on the oceanic seafloor. The Yaquina graben is an abandoned transform fault that behaves as a fracture zone that contributes to the reactivation of normal faults associated with paleo-rifts as the Malpelo rift and the Buenaventura rift that intersects the trench at 3.5°N (Lonsdale, 2005; MacMillan et al., 2004; Yepes et al., 2016) (see also Supplementary Figure S1). At the Colombia–Ecuador border, the relative Nazca/SOAM plate convergence rate is about 55 mm/yr (Kendrick et al., 2003). This oblique convergence is partitioned between quasi-normal motion accommodated on the subduction megathrust interface at the trench axis and right-lateral transpressional strike-slip motion on the Chingual-Cosanga-Pallatanga-Puná (CCPP) fault system (Alvarado et al., 2016; Yepes et al., 2016). The ellipses indicate the rupture and aftershocks areas with associated epicenters (stars) of the great 1906 Mw = 8.6 (black dashed lines), of the 1942 Mw = 7.8 (light blue), of the 1958 Mw = 7.6 (light green), and of the 1979 Mw = 8.1 (green) megathrust earthquakes (Beck and Ruff, 1984; Kanamori and McNally, 1982; Mendoza and Dewey, 1984; Swenson and Beck, 1996).
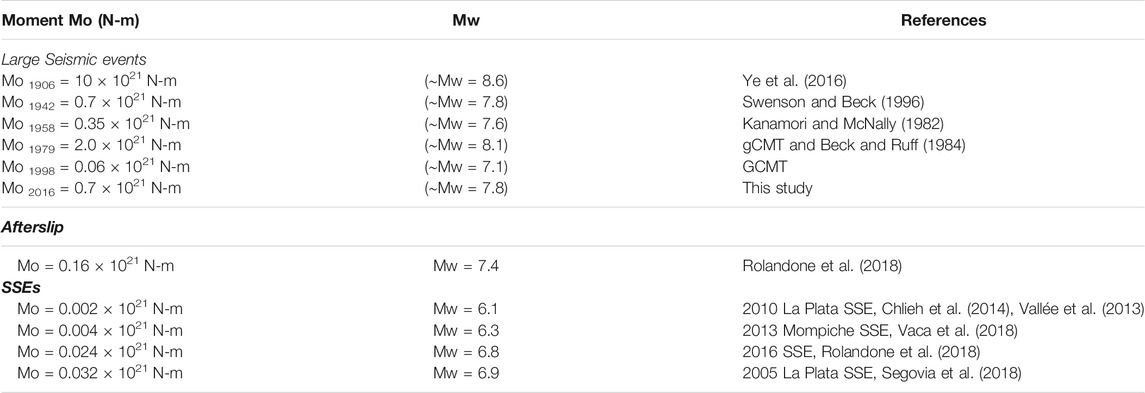
TABLE 1. Moment Mo in Newton-meter (N-m) and corresponding moment magnitude Mw (Kanamori, 1977) for transient seismic and aseismic events observed along the Ecuador–Colombia subduction zone. Note that the cumulative seismic moment of the 1942, 1958, 1979, and 2016 earthquakes represents ∼35% of the 1906 seismic moment.
During the 20th century, the 1906 rupture segment hosted three juxtaposed large (Mw > 7.5) seismic ruptures of about 100–150 km long (Figure 1 and Supplementary Figure S1). This sequence started off the Ecuadorian coast in 1942 with the Mw∼7.8 event (Mendoza and Dewey, 1984; Swenson and Beck, 1996), followed northward by the 1958 Mw = 7.6 event and finished off the coast of Colombia in 1979 with the Mw = 8.1 event (Beck and Ruff, 1984; Kanamori and McNally, 1982) (Table 1). The same segment that ruptured in 1942 failed again during the 2016 Mw = 7.8 Pedernales earthquake which initiated ∼50 km north of the equatorial line and propagated 120 km southward toward the Pedernales city which was severely impacted (Figure 2). The Harvard focal mechanism (from the Global Centroid Moment Tensor catalog, gCMT, https://www.globalcmt.org/CMTsearch.html) associated with the 2016 Mw = 7.8 Pedernales earthquake is consistent with a subduction earthquake with an average rupture strike = 27°, dip = 21°, slip rake = 124°, and with a moment magnitude Mw = 7.8 (Figure 2). The occurrence of the 2016 event naturally raises the question about the beginning of a new seismic sequence in that region.
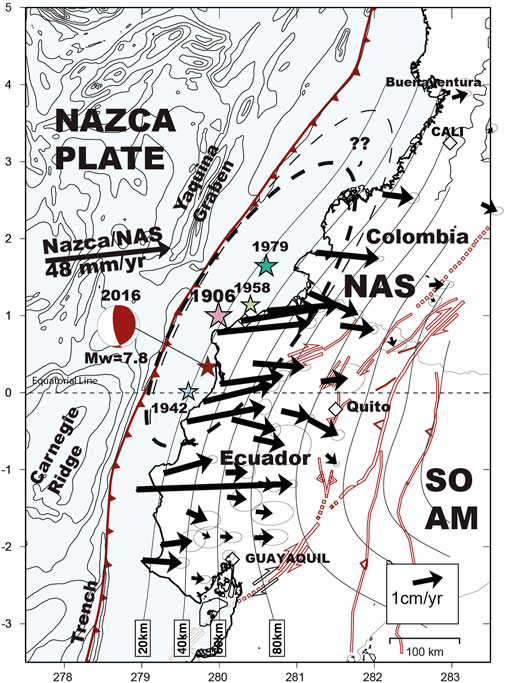
FIGURE 2. GPS velocities (black arrows) in the North Andean Sliver reference frame from Mora-Paez et al. (2019) with their respective error ellipses. The relative Nazca/NAS convergence rate taken up by the subduction interface is about 48 mm/yr at the Colombia–Ecuador border. Interseismic GPS velocities pointing towards the east show variable decreasing gradients which attest for variations on the frictional coupling along the megathrust interface. The epicenter location (red star) and focal mechanism (from the Harvard gCMT catalog) associated with the 2016 Mw = 7.8 Pedernales earthquake are consistent with a subduction earthquake that occurred on the megathrust interface. The megathrust geometry is reported from Slab 2 model geometry (Hayes et al., 2018) with iso-depth contours every 20 km.
Geodetic measurements collected in the last decade in Ecuador have shown that the friction in the seismogenic zone along the plates interface is highly heterogeneous and confined between the trench axis and the first 40 km depth (Chlieh et al., 2014; Nocquet et al., 2014). This heterogeneity reflects variations in the steady-state frictional properties of the interplate contact with velocity-weakening behavior in areas that appear highly locked and velocity-strengthening behavior in areas that are creeping. Creeping is the most prominent process at the scale of the whole slab interface and the locking occurs only in very specific places of the seismogenic zone. It has been shown in many subduction zones and continental faults that there is always a high spatial correlation between the location of large earthquake sources and the location of locked asperities during the interseismic period (Chlieh et al., 2008; Chlieh et al., 2011; Konca et al., 2008; Loveless and Meade, 2011; Metois et al., 2016; Moreno et al., 2010). Here, we take advantage of newly released global positioning system (GPS) data acquired at the scale of the Colombia–Ecuador subduction zone to map the interseismic locking over the great 1906 rupture and neighboring subduction segments (Figures 1, 2). This map will provide us a better perception of the seismogenic zone segmentation which is fundamental to understand the physical parameters that control the genesis, extent, and arrest of large megathrust earthquakes.
Aseismic slip has an important role in the seismic cycle and it is only with the advent of modern space-based geodesy that we have been able to quantify its associated aseismic moment. Aseismic slip appears in the form of afterslip during the postseismic period and of spontaneous slow slip events (SSEs) during the interseismic and pre-seismic periods. It is often accompanied by a specific seismicity signature: postseismic aftershocks due to the afterslip and tremors and very low frequency or repeaters seismicity during SSEs episodes. Systematically, the cumulative seismic moment associated with this seismic activity is found to be much lower than the afterslip and SSEs moments derived from geodesy, suggesting that these transient slip processes are dominated by aseismic slip. Because permanent geodetic observations are slowly developing in many countries during the last 2 decades, our actual knowledge of the aseismic slip process is limited to sparse reports documented in various subduction zones. When the spatial resolution of the data is high, we often found that the postseismic afterslip moment is about 10–30% of the coseismic moment (Bürgmann et al., 2000; Chlieh et al., 2007; Chlieh et al., 2004; Hsu et al., 2006; Lin et al., 2013; Perfettini et al., 2010; Remy et al., 2016; Shrivastava et al., 2016). For SSE, their recurrence is not the same from one region to another and their moment magnitude varies from one SSE to another in the same area (Ide et al., 2007; Michel et al., 2019; Radiguet et al., 2012; Vallée et al., 2013), making it difficult to have a precise long-term quantification of the aseismic moment associated with SSEs. This estimation has a direct impact on the determination of the moment magnitude and recurrence time of large seismic events, which makes it a fundamental parameter that is unfortunately often neglected in many seismic hazard studies.
In active tectonics, the seismic moment conservation principle, which arises from the elastic rebound theory, requires that the cumulative interseismic moment buildup on a fault plane balances the sum of all the transient seismic and aseismic moments released by pre-seismic slip, coseismic slip (earthquake), postseismic afterslip, and spontaneous slow slip event. Deterministic approach to estimate the recurrence time of large earthquakes relies on the use of the historical and instrumental seismic records. This assumption is reasonable in places where the earthquake catalog is long enough to represent the average seismicity over the long term which is unfortunately rarely the case. Indeed, the largest events are often not well represented as their recurrence time exceeds the typical duration of earthquake catalogs. To overcome such limitation, statistical methods are applied. When the magnitude–frequency distribution of earthquakes obeys the Gutenberg–Richter (G-R) law over the moderate magnitude range, rates of earthquakes in the upper magnitude range can be obtained by extrapolation (Aki, 1965; Gutenberg and Richter, 1954). The G-R distribution must be bounded, otherwise the moment released by earthquakes would exceed the moment deficit that builds up due to locking during the interseismic period, which is unphysical. The earthquake recurrence model should, therefore, be constrained to satisfy the principle of seismic moment conservation (Avouac, 2015). We adopt this approach here to balance the moment buildup during the interseismic period with the moment released through earthquakes and aseismic transient episodes along the Ecuador–Colombia subduction zone.
Global Positioning System Measurements Relative to the North Andean Sliver Reference Frame
Mora-Páez et al., 2019 provided new GPS velocities with numerous permanent sites across all Colombia (Supplementary Figure S2) that complement the Ecuadorian velocity field published by Nocquet et al., 2014. This unified GPS field covers the whole Ecuadorian subduction zone and the rupture area of the great 1906 earthquake that extended along the Colombian subduction zone (Figure 2). Based on that geodetic data set, a reestimation of the location and the angular velocity of the North Andean Sliver (NAS) Euler pole was proposed to be located at 58.6°N, 174.8°W and rotates counter-clockwise at a rate of 0.072°/Ma relatively to a fixed South American (SOAM) reference frame (Mora-Páez et al., 2019). This pole predicts a NAS rigid motion of about 8.6 mm/yr toward N 60°E, a result relatively similar with the 8.5 ± 1.0 mm/yr proposed by Chlieh et al. (2014). The resulting Nazca/NAS convergence rate shows that along the southern Ecuador Trench in the Gulf of the Guayaquil area, the Nazca plate subducts beneath the North Andean Sliver at a rate of about 50 mm/yr in a direction nearly orthogonal to the trench. The direction of convergence becomes increasingly oblique toward the northwest and the relative plate convergence is partitioned into thrusting at the trench and right-lateral transpressional strike-slip motion on the Chingual-Cosanga-Pallatanga-Puná (CCPP) fault system (Alvarado et al., 2016; Yepes et al., 2016). Offshore the Colombia–Ecuador border, the Nazca/NAS convergence rate is about 48 mm/yr and decreases northward up to 46 mm/yr offshore Buenaventura in Colombia (Figure 2). To explore models of interseismic coupling on the subduction megathrust interface, we selected 43 horizontal GPS velocities of Mora-Paez et al. (2019) with their respective 1-sigma error ellipses collected in Ecuador and Colombia between latitudes 3°S and 4°N (Supplementary Table S1 and Figure 2 and Supplementary Figure S2). In the NAS reference frame, GPS velocities highlight significant variations in the elastic strain accumulation along the Nazca subduction interface. Near the Colombia–Ecuador border, coastal sites Esmeraldas and Tumaco moved east-northeastward at 22.2 ± 0.5 mm/yr and 18.3 ± 0.4 mm/yr, respectively. Velocities decrease northward with the Cali and Buenaventura velocities showing 7.6 ± 1.3 mm/yr and 9.7 ± 0.3 mm/yr, respectively.
The spatial resolution of the slip distribution on the megathrust interface depends on the spatial density of observations at the surface. To evaluate the power of slip resolution on the megathrust interface of the Ecuadorian and Colombian GPS networks, we run several checkerboards resolution tests for characteristic rectangular elements of 120 × 60 km2 (Supplementary Figure S3A) or square elements of 80 and 60 km2, respectively (Supplementary Figure S3B). Each of the elements are either fully locked or fully creeping at the plate convergence rate. The predicted velocities of the initial checkerboard models are computed at all the GPS sites and then inverted to evaluate the power of restitution of the GPS networks. We found that the lateral variations of the slip patches are relatively well reproduced for all characteristic size patches between slab depths of 20 and 100 km. Patches as small as 60 km2 are also well reproduced for the shallower 20 km depths of the slab interface offshore Ecuador where the trench-coast distances are the shortest, that is, in Isla La Plata and in Punta Galera, and Manta and Punta Salinas Peninsulas (see C and D in Supplementary Figure S3B). Offshore Colombia, where the trench-coast distances are the highest, even large 120 × 60 km2 patches are not resolved for the shallower 20 km depths of the megathrust interface located between 2°N and 4°N (Supplementary Figure S3A). The sparse distribution of coastal GPS sites in Colombia (only three sites, Tumaco, Guapi, and Buenaventura) together with five continental GPS sites allow, however, to restitute relatively well all patches of 80 km2 located between 20 and 100 km depths of the slab interface as well as patches of 60 km2 when GPS sites are lying right on top or nearby (Supplementary Figure S3A). The moment restitution between the initial and inverted checkerboard models is always higher than 97% suggesting that even if the spatial location of locked asperities can be locally lost near the trench, the Ecuador–Colombia GPS networks will remain quite sensitive to the degree of locking during the interseismic period.
Interseismic Modeling
Assuming that the surface deformation measured by geodesy is the result of slip on the megathrust interface, we perform nonlinear inversions of the GPS data based on a stochastic-simulated annealing algorithm to determine coupling/slip on the megathrust, as previously done in Chlieh et al. (2014). First, we describe the geometrical and kinematics parameters before introducing the inversion procedure and the results.
Megathrust Geometry and Medium Rheology
The geometry of the slab was built considering the position of the trench axis and the depth contours of the Slab 2 geometry model from Hayes et al. (2018). This new slab geometry shows significant differences with the geometry used in previous studies (Chlieh et al., 2014; Font et al., 2013; Hayes et al., 2012). The geometry of the Slab 2 model is much steeper and about 10–15 km deeper than the Font et al. (2013) and Slab 1 geometries between latitudes −1°S and 2°N. Slab 2 geometry becomes shallower than the Slab 1 model along the Colombian coast between 2°N and 4°N (Supplementary Figure S4). Our modeled megathrust interface here is composed of 3 juxtaposed rectangles extending along strike from southern Ecuador northward 240 km, 240, and 480 km, respectively, and about 300 km along the megathrust dip (Supplementary Table S2). The average dip angle measured from the trench axis located at 7 km below sea level to slab iso-depth contour of 50 km increases northward from 18°, to 20° and 22°, respectively. We discretize the megathrust interface into 700 square elements of 20 km × 20 km with a source point fixed at the center of each element. The megathrust geometry is then embedded in a Poisson solid–layered half-space (Supplementary Table S3) with a Poisson coefficient of 0.25 and an average shear modulus µ of 36 GPa computed between 0 and 50 km depth of the subduction wedge. With that formalism, static displacements are computed following the analytical expressions of (Ji et al., 2002; Xie and Yao, 1989). The slip rake is authorized to vary ±10° from the average rake direction given by local gCMT slip vectors. When all the parameters described above are set, the full representation of the fault response relies principally on the dislocation amplitude parameter and on the rake angle that is partially controlled. We can invert these parameters by fitting the modeled static displacements to the observations considering a reduced chi-square χr2 criterion defined as:
where n is the number of data, obs and pred are the observation and the prediction, respectively, and σ is the standard deviation error associated with each GPS component.
Inversion Procedure
The general forward problem is written as follows:
where G represents the Green functions linking the observables to the model parameters, d is the data vector and m is the model parameter vector (here, the back-slip amplitude and rake direction at each of the 700 source points). In each inversion, we weighted the GPS measurements by their respective 1-sigma uncertainties (Supplementary Table S1). The inverted back-slip distribution follows two types of regularized constraints: one that minimizes the difference between the slip on adjacent sub-faults and a second that minimizes the final moment (or moment deficit rate in case of interseismic). The cost function to minimize is:
where Dc represents the differences in the slip (or back-slip for interseismic) of adjacent cells, Moapriori is an a priori moment deficit rate, and Mo is the final moment. The coefficient λ1 controls the smoothing coefficient through an L1+L2 norm, and the coefficient λ2 modulates the weight assigned to minimize the final moment deficit rate. We found that for λ1 = 0.1 the fit to the GPS data is optimal without over-estimating the roughness of the final slip solution (Supplementary Figure S5).
Back-Slip Inversions
For the interseismic modeling, we applied a back-slip approach (Savage, 1983) following the inversion procedure described above. We bound the back-slip rate (Vback) to the relative Nazca/NAS plate convergence rate (Vpl) of 50 mm/yr in the southern Ecuador, of 48 mm/yr in the central-north Ecuador, and of 46 mm/yr in Colombia. The local interseismic coupling (IC) is then defined as:
resulting in pure creeping on the megathrust interface, when Vback = Vpl (IC = 0), and in full locking of the plate contact, when Vback = 0 (IC = 1). Using that definition, the moment deficit rate integrated over a specific fault surface S embedded in rigid medium µ is:
where Vpl-Vback is the back-slip offset rate across the fault.
Inversions of the GPS velocities provide a highly heterogeneous interseismic coupling map at the scale of the Ecuador–Colombia subduction (Figures 3–5). Considering the 1-sigma error uncertainties of the GPS components and solutions with a reduced Chi-square χr2<1, we found that models with an average moment deficit rate of 8.5 ± 1.5 × 10¹⁹ N-m/yr (Supplementary Table S4) for the whole Colombia–Ecuador subduction zone provide the best fit to the GPS data (Figure 4, Supplementary Figures S6, S7). The rate of moment deficit corresponds to the equivalent of Mw∼7.2 ± 1 earthquake that is accumulating annually on the megathrust interface from Guayaquil to Buenaventura. Models with a lower moment deficit rate would degrade the fit to the data and reduce spatially the locking at the centers of highly locked patches (Supplementary Figure S6). Models with a higher moment deficit rate would also increase the data misfit (Supplementary Figure S7) and saturate the coupling near the trench (Supplementary Figure S6). Because the shallow portion of the plate interface lies in the stress shadow of deeper-locked asperities (Bürgmann et al., 2005; Chlieh et al., 2008), it has been for long time impossible to assess the level of locking in the shallower portion of the slab interface without near-trench seafloor observations (Chlieh et al., 2011; Gagnon et al., 2005). A promising approach suggests adding some physical constraints to evaluate more precisely the level of locking that remains in the shallow stress shadow of deeper asperities (Almeida et al., 2018; Herman and Govers, 2020; Lindsey et al., 2021). Our average and maximum solutions, shown in the inset C and D of Figure 4, share some similarities with this new approach and indicates that the shallow coupling can be higher than 0.4 nearly everywhere and even reach 1 near the trench.
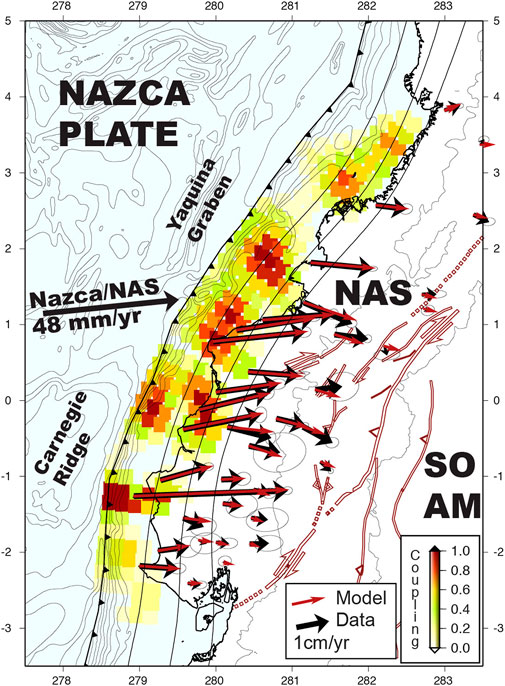
FIGURE 3. Average interseismic coupling model derived from the inversion of interseismic GPS velocities along the Ecuador–Colombia subduction zone. The global moment deficit rate (in Newton. meter per year, Nm/yr) is 0.85 × 10²⁰ N-m/yr. Black and red arrows represent the observed and predicted GPS velocities, respectively. Hot colors patches indicate highly locked areas of the megathrust interface.
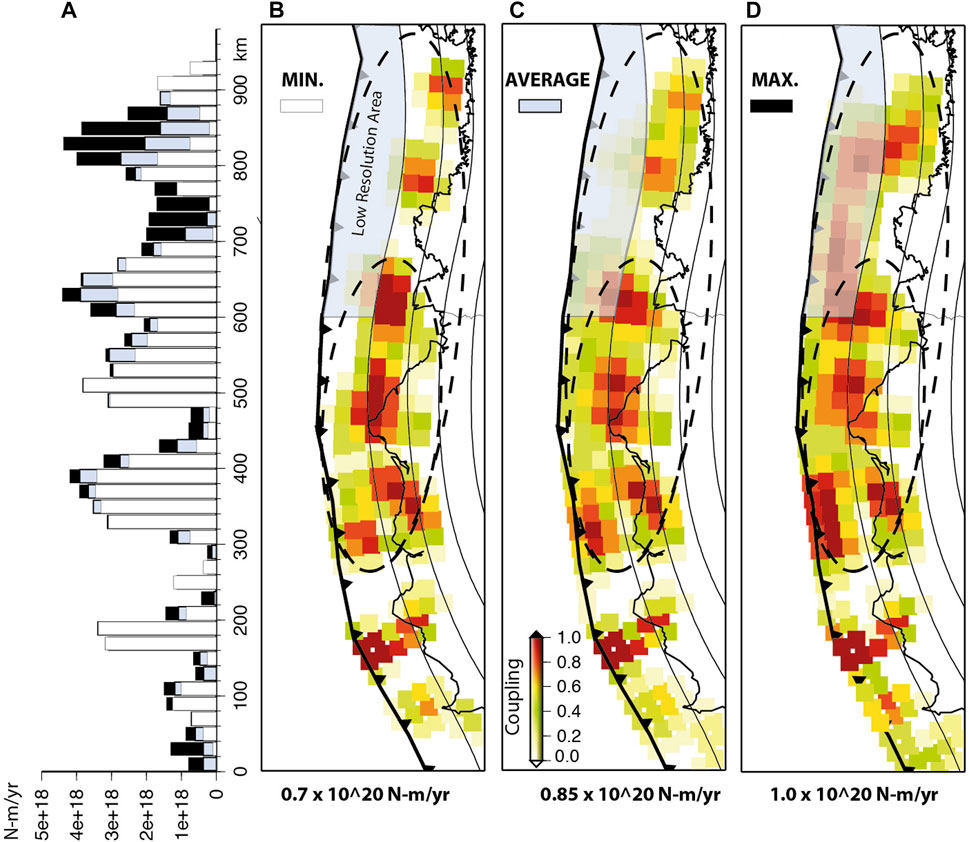
FIGURE 4. Range of the best GPS-fitting interseismic coupling models with their associated along-trench moment deficit rate. (A) Along trench strike variations of the moment deficit rate (in Nm/yr) as determined from the minimum ((B), in white, 0.7 × 10²⁰ N-m/yr), average ((C), in gray, 0.85 × 10²⁰ N-m/yr), and maximum ((D) in black, 1.0 × 10²⁰ N-m/yr) interseismic coupling models. Each bar represents the cumulative moment deficit rate calculated within 20 km-large sections normal to the trench axis. (B–D) shows the minimum, the average, and the maximum interseismic coupling models, respectively, with the fully locked asperities (in red) and the fully creeping segments in white. Overall, the interseismic coupling remains confined within the first 50 km depth of the slab interface with some robust characteristics that remain stable in all models (i.e., large asperities location and creeping segments) and significant variations in areas of low spatial resolution (shaded gray rectangle) as deduced from the checkerboard tests shown in Supplementary Figures S3A,B.
Source Inversion of the 2016 Mw = 7.8 Pedernales Earthquake
To analyze the seismic source of the 2016 Mw = 7.8 Pedernales earthquake, we inverted the horizontal and the vertical coseismic displacements of permanent and campaign GPS stations of the Ecuadorian GPS network (listed in Supplementary Table S5) published by Nocquet et al. (2016) using the same procedure described above. In the rupture area of the Pedernales earthquake, there are significant differences between slab geometries that we explored by running series of dislocations geometries in which the strike, dip, and rake angles are varied (Supplementary Figure S8). We found tan optimum fit to the coseismic GPS data for rupture geometries with an average strike angle of 25° ± 5°, dip angle of 18° ± 3°, and rake angle of 120° ± 5°. These angles are relatively well consistent with the 27° strike, 21° dip, and 124° rake angles determined by the gCMT focal mechanism and also closer to the average dip angle of Slab 2 geometry. Modeled focal mechanism using the Slab 2 geometry and observed gCMT are relatively well consistent and shown in Figure 6A.
Then, using the same Slab 2 megathrust geometry, layered medium and inversion procedure for the interseismic models, we fixed the seismic moment to magnitude Mw = 7.8 (with λ2 > 100) and varied the smoothing factor λ1 from 0.01 to 10 (see Supplementary Figure S7). The fit to the GPS data becomes optimal for a smoothing coefficient λ1 lower than 1. Best-GPS fitting slip distributions exhibit either one slip patch that peak up to 3.5 m or two slip patches for rougher solutions, typically when λ1 ≤ 0.01 (see Supplementary Figure S7). Many publications of the seismic source of the 2016 Mw = 7.8 Pedernales event suggest either one slip patch when the inversions is derived only from geodetic (InSAR or GPS) data (He et al., 2017) or two slip patches when the inversions include seismic waveforms and/or tsunami data (Gombert et al., 2018; Heidarzadeh et al., 2017; Nocquet et al., 2016; Ye et al., 2016; Yi et al., 2018). Here, for consistency with the interseismic modeling and with the goal to balance properly each phase of the seismic cycle using the same inversion procedure, slab geometry and boundary conditions, we decide to retain the coseismic slip distribution for the smoothing coefficient λ1 = 0.1 (Figure 6A) that fit very well the coseismic GPS data (Figure 6B) and that is the same than for interseismic models.
Results
On the Ecuador–Colombia Interseismic Coupling Map
The pattern of interseismic coupling allows us to distinguish with confidence several persistent asperities of about 50–100 km width and with a relatively high level of coupling typically above 0.6. From south to north, these asperities appear on the megathrust interface offshore Punta Salinas, below La Plata island, between the Bahia de Caraquez and the Atacames promontory (Pedernales asperities), offshore Esmeraldas, and offshore the Tumaco Peninsula (Figure 5). Further north in Colombia, between the Sanquianga Peninsula and Buenaventura, it is less clear whether there are two 50 km-wide asperities located between the slab depths of 20 and 50 km or if the coupling is much higher on a large asperity that extends diagonally from about 10 km depth offshore the Sanquianga Peninsula to 40 km depth offshore Buenaventura. The lack of resolution of the shallow megathrust in this area leaves a high uncertainty in the spatial location of the Cali–Buenaventura asperities; however, it appears quite clear that the Cali–Buenaventura asperities accumulate a significant amount of moment deficit (Figure 5) and that the locking never extends below a slab depth of 20 km offshore the Sanquianga Peninsula. These asperities are disconnected by creeping segments with widths varying along strike from 20 to 80 km that are either fully creeping (level of coupling = 0) or partially creeping with a level of coupling typically lower than 0.4 (Figures 4, 5).
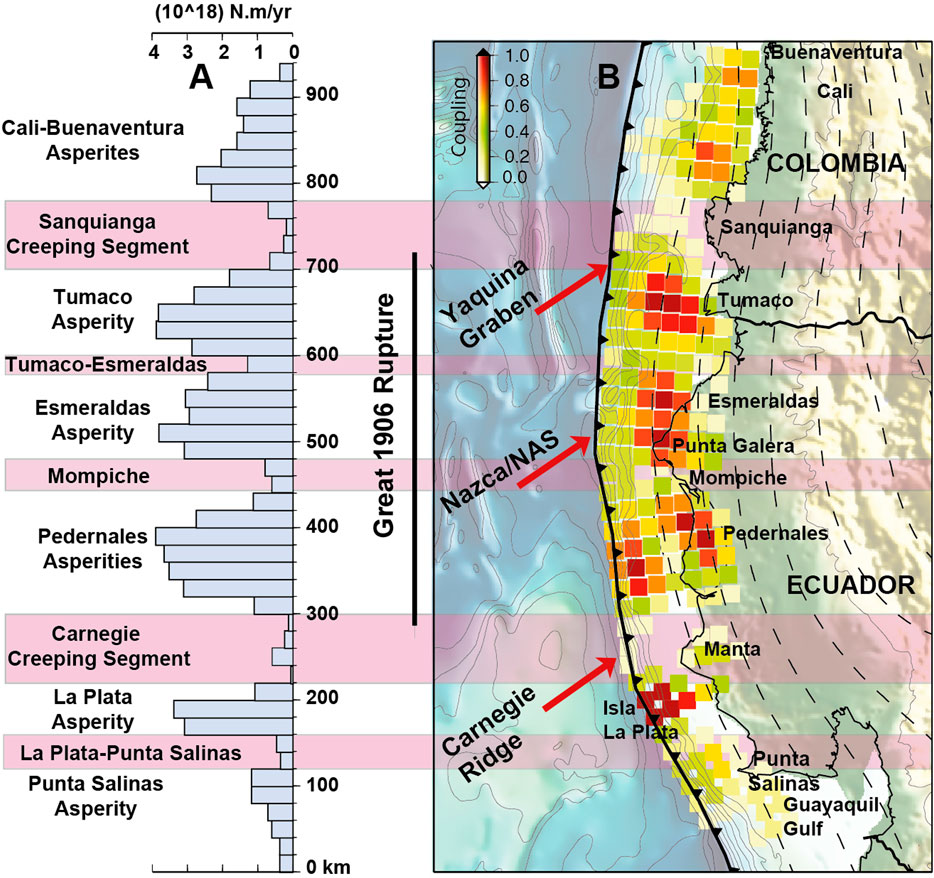
FIGURE 5. Seismic segmentation of the Ecuador–Colombia subduction zone from the interseismic coupling map. (A) High moment deficit rates (in N.m/yr) indicate the location of highly locked asperities since low moment deficit rates highlight the presence of creeping segments. (B) Average interseismic coupling map resulting from geodetic inversion with a 68% confidence level. Creeping segments of ∼80 km-width and with an average level of coupling lower than 0.2 coincide with the entrance into the subduction of the Carnegie Ridge in Ecuador and the young oceanic crust east of the Yaquina Graben in Colombia. These two wide creeping segments have the characteristics of relatively strong seismic barriers able to stop great rupture like the great 1906 Colombia–Ecuador earthquake. Thinner creeping segments of about 20–40 km large appear between Tumaco and Esmeraldas and offshore Mompiche.
On the Coseismic Source
Figure 6A shows one of the best GPS fitting solutions with a seismic source that reaches a maximum slip of 3.5 m at about 25 km depth. The maximum slip amplitude is consistent with the 3.55 m predicted by the finite plate convergence considering a relative Nazca/NAS convergence rate of 48 mm/yr between 1942 and 2016, suggesting no overshoot. Inverted slip rake directions are collinear with the gCMT slip rake directions of background seismicity and aftershocks that have preceded and followed the Mw = 7.8 Pedernales earthquake (Figure 6 and Supplementary Figure S1). These rake directions are also relatively well consistent with the relative Nazca/NAS plate convergence vector, suggesting no significant slip partitioning during that earthquake. One of the most striking features of the gCMT aftershocks are two normal-trench alignments south of the Atacames promontory and offshore the Bahia de Caraquez (Figure 6 and Supplementary Figure S1). These two aftershock ribbons bound laterally the 2016 Mw = 7.8 seismic source, supporting the presence of two creeping transition zones there. Many recent studies document very well that aftershock sequence including large aftershocks, seismic swarms, and slow slip events activated by the afterslip on the megathrust interface that occurred during the postseismic period, but also crustal seismic events associated with the reactivation of shallow crustal faults (Agurto-Detzel et al., 2019; Hoskins et al., 2021; Soto-Cordero et al., 2020; Vaca et al., 2018). A wide range of seismic and aseismic slip modes were documented and primarily associated with the seafloor roughness and the subduction of geomorphological features as ridges or seamounts (Collot et al., 2017; Marcaillou et al., 2016).
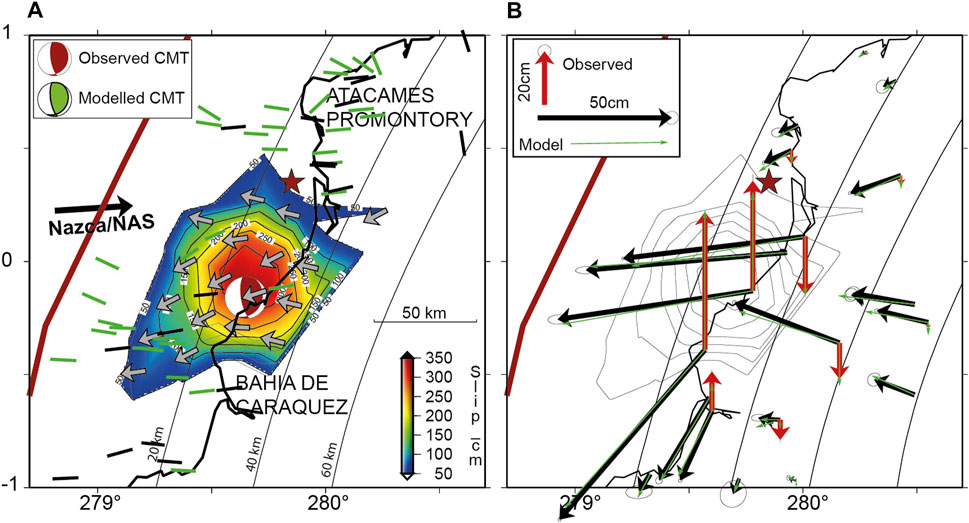
FIGURE 6. GPS-derived seismic source of the 2016 Mw = 7.8 Pedernales earthquake. (A) Seismic source distribution associated with the 2016 Mw = 7.8 subduction earthquake derived from the joint inversion of horizontal and vertical GPS data using Slab 2 megathrust geometry. The color indicates the slip amplitude and the gray arrows the inverted slip rake directions at each source points that mesh the megathrust interface. Inverted slip rake directions are collinear with the gCMT slip rake directions of background seismicity (black bars) and aftershocks (green bars) that have preceded and followed the Mw = 7.8 Pedernales earthquake (see the gCMT catalog in Supplementary Figure S1). These rake directions are also collinear with the relative Nazca/NAS plate convergence vector, suggesting no significant slip partitioning during that earthquake. The modeled focal mechanism (green beach-ball) is well consistent with the observed gCMT (red beach-ball). (B) Observed horizontal (black arrows) and vertical (red arrows) coseismic GPS displacements compared to the modeled displacements (green arrows) associated with the source model shown in A. Slip contours of the seismic sources are reported every 0.5 m.
The spatial distribution of our 2016 seismic source correlates relatively well with the location of a highly-coupled and persistent asperity well identified in our interseismic models (Figure 5) and located right below the coastline between 20 and 40 km depth of the megathrust interface. The rupture extremities of the 2016 Pedernales earthquake are laterally well bounded by two creeping segments: the Carnegie creeping segment to the south and the Mompiche creeping segment to the north (Figures 5, 7) that may have played the role of seismic barriers to the rupture propagation. The reactivation of these areas during the postseismic period is an additional evidence that support the presence of these creeping segments.
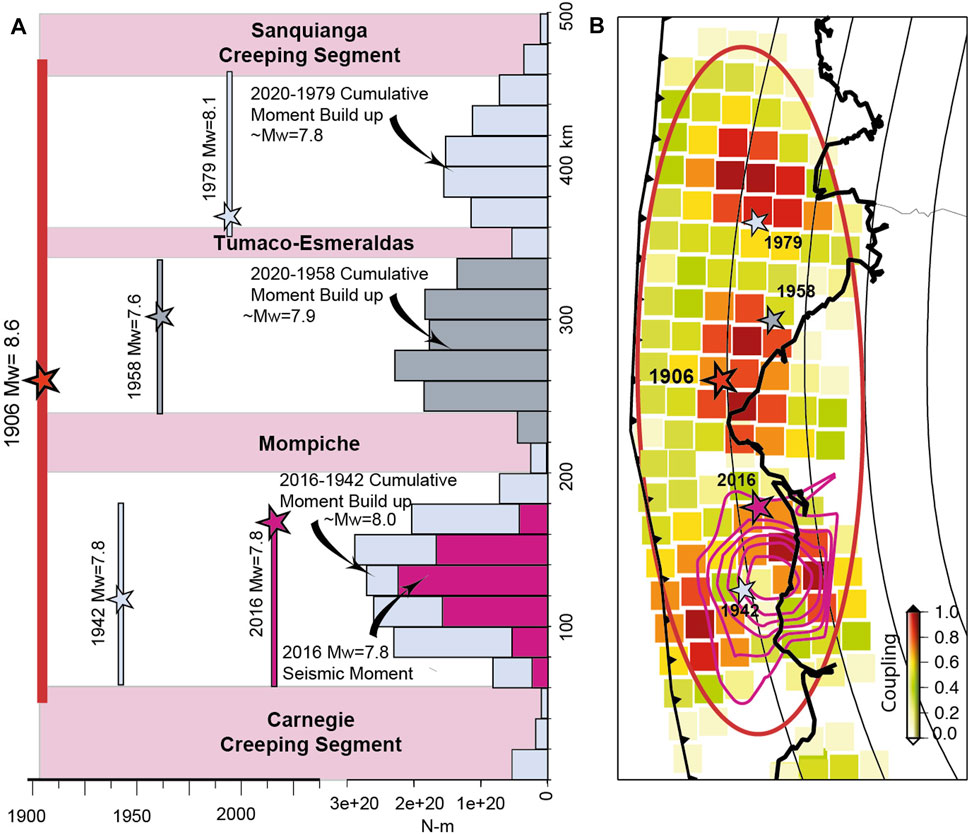
FIGURE 7. Comparison of the cumulative interseismic moment buildup (in N.m) since 1942, 1958, and 1979 with the seismic moment released (in N.m) associated with the 2016 Mw = 7.8 Pedernales earthquake. (A) Along-trench cumulative moment buildup (in N m, N.m) between 1942 and 2016 in the Pedernales segment, between 1958 and 2020 in the Esmeraldas segment, and between 1979 and 2020 in the Tumaco segment. We consider a steady state interseismic process (i.e., linear with time). We found that the cumulative moment buildup since 1942 is about twice larger than the 2016 seismic moment released, suggesting that the 2016 Pedernales earthquake was well expected. In 2020, the moment buildup in the 1958 and 1979 rupture areas is equivalent to an Mw = 7.9 event and to an Mw = 7.8 event, respectively. (B) Map of the average interseismic coupling model used to integer the moment buildup in (A). Seismic slip contours of the 2016 Mw = 7.8 Pedernales event are reported in purple from Figure 6A. The 2016 rupture area overlaps relatively well the 1942 rupture area and is bounded northward by the Mompiche creeping segment and southward by the Carnegie creeping segment.
Discussion
Did the 2016 Mw = 7.8 Pedernales Released Seismic Moment Balance the Cumulative Moment Deficit Buildup Since the Last Event in the Region in 1942?
Because our knowledge of the 1942 seismic source is quite limited compared to the recent 2016 seismic source analysis, it is hard to say whether these two large seismic events unambiguously broke the same locked asperity, however, some seismic and geodetic evidences, let suppose that, it is likely the case. Between the Atacames promontory and Bahia de Caraquez located at 0.5°N and 0.5°S, respectively, the interseismic coupling map indicates two distinctively locked asperities on the megathrust (Figure 7). One asperity is shallow and extents from the trench to about 20 km depth, and the second asperity is deeper and extends from about 20 to 40 km depths. The location of this deeper asperity overlaps relatively well with the coseismic source distribution of the 2016 Pedernales event (Figure 7) and overlap with the rupture and aftershocks area of the 1942 Mw = 7.8 earthquake (Chlieh et al., 2014; Swenson and Beck, 1996). It is unlikely that one of these seismic events did rupture the shallow asperity without producing an important local tsunami as it was observed from well identified tsunami-earthquakes with similar or lower moment magnitude during the 1996 Mw = 7.5 Chimbote event in Peru (Ihmlé et al., 1998) or the 1994 Mw = 7.6 and 2006 Mw = 7.8 Java events in Indonesia (Abercrombie et al., 2001; Ammon et al., 2006). The relatively low tsunami generated in 1942 and 2016 rather support that both ruptures are associated with the failure of the deeper mapped asperity. Assuming a steady-state interseismic moment deficit rate, we found that over the 2016 rupture area, the moment deficit buildup since 1942 is equivalent to 1.3 ± 0.1 1021 N-m which is nearly twice the seismic moment released during the 2016 event (Figure 7). This result is in contradiction with recent studies that suggest an overshoot of slip and then excess of seismic moment released through earthquakes since 1906 in that region (Gombert et al., 2018; Nocquet et al., 2016).
Postseismic afterslip associated with the 2016 Pedernales event occurred up-dip of the coseismic rupture area and has released a postseismic moment of 0.16 × 10²¹ N-m which represents about 23% of the 2016 seismic moment (Rolandone et al., 2018). From a high-rate GPS analysis, it has been shown that the early postseismic afterslip that occurred in the 12 to 72 first hours following the initiation time of the 2016 rupture would increase the postseismic/coseismic moments ratio to about ∼30% (Tsang et al., 2019; Twardzik et al., 2019). Then, the cumulative 2016 coseismic and postseismic moment would represent about 60–70% of the moment deficit buildup between 1942 and 2016. This suggests that the Pedernales asperities were well mature to host the 2016 Mw = 7.8 earthquake and its associated afterslip. The remaining moment deficit can be released by the background seismicity and/or aseismically through slow slip episodes as reported in many places of the Ecuadorian subduction zone (Chlieh et al., 2014; Rolandone et al., 2018; Vaca et al., 2018; Vallée et al., 2013). It is also possible that a fraction of that remaining moment deficit is simply stored for future large subduction earthquakes and long-term topography building (Jolivet et al., 2020; Melnick, 2016; Saillard et al., 2017).
With similar steady-state interseismic loading rate assumptions, we found that the Esmeraldas asperity that failed during the 1958 Mw = 7.6 event has built up a cumulative 1958–2020 moment deficit of 0.9 ± 0.1 1021 N-m (∼Mw = 7.9) and that the Tumaco asperity that failed during the 1979 Mw = 8.1 event has built up a cumulative 1979–2020 moment deficit of 0.7 ± 0.2 1021 N-m (∼Mw = 7.8). Considering that only half of these moment deficits is released seismically through large earthquakes as observed in the Pedernales segment, then the Esmeraldas asperity would be mature to host a Mw∼7.7 event and the Tumaco asperity would be mature for a Mw∼7.6 event (Figure 7). If we consider that the two asperities fail simultaneously, a Mw∼7.9 seismic event could be generated. Alternative scenarios can be built considering the moment rate deficit associated with each asperity listed in Supplementary Table S4 with an uncertainty determined at 1-sigma (68% confidence level) and considering different fractions of aseismic/seismic moments.
Segmentation of Large and Great Megathrust Earthquakes and Barriers Efficiency
The GPS-derived average interseismic coupling model indicates the locations of large apparent asperities associated with a relatively high rate of moment deficit. These asperities are bounded by creeping segments of few tens of kilometers where the rate of moment deficit is relatively low. These creeping segments promote velocity strengthening on the megathrust interface which in the long-term play the role of seismic barrier able to slow down and inhibit seismic rupture propagation. The barrier efficiency of a velocity strengthening patch has been shown to be proportional to its along-strike length and an average level of interseismic coupling (Kaneko et al., 2010). Then, large creeping barriers with low interseismic coupling will be much more efficient than smaller barriers and would stop systematically all seismic ruptures, even those associated with great earthquakes like in 1906. Smaller barriers have a dual frictional behavior and will work efficiently in case of a large Mw∼7.5–8.0 seismic rupture but will fail during great Mw > 8.5 rupture that break, simultaneously, many large juxtaposed asperities. These smaller barriers will slow down the rupture speed but will not be able to totally inhibit it as it was observed in Peru during the 2001 Mw = 8.4 Arequipa and the 2007 Mw = 8.0 Pisco earthquakes (Perfettini et al., 2010; Robinson et al., 2006).
In Ecuador, the Carnegie Ridge creeping segment is characterized by an along-strike length of about 50–60 km and an average interseismic coupling lower than 0.2 and has been considered as a strong and efficient seismic barrier (Chlieh et al., 2014; Yepes et al., 2016). This is supported by the fact that the 1906, 1942, 1998, and 2016 ruptures all abut at the northern extremity of the Carnegie creeping segment. In Colombia, a similar creeping segment that shares the same length and frictional properties with the Carnegie Ridge appears offshore the Sanquianga peninsula (Figure 5). Offshore Colombia, from the Tumaco Peninsula to Buenaventura, the gCMT catalog indicates that the outer rise seismicity located between the Yaquina Graben and the trench is dominated by trench-parallel normal faulting (see Supplementary Figure S1). This seismicity is due to reactivation of normal faults associated with buried extinct rift that intersects the Colombian accretionary complex at latitude 3.5°N (Hardy, 1991; Lonsdale, 2005). Normal faulting crosses the trench and follows the slab geometry suggesting a highly fractured subducting slab interface (Collot et al., 2002; Yepes et al., 2016). The roughness of the megathrust interface induced by the subduction of the Carnegie ridge in Ecuador and the highly fractured oceanic crust east of the Yaquina Graben in Colombia, coupled with poorly consolidated sediment at the plate contact may promote aseismic slip, a process governed by rate-strengthening friction (Collot et al., 2017). This suggests that the Sanquianga creeping segment can also be considered as a strong and efficient seismic barrier and might probably have limited the northern extent of the 1906 rupture.
If the Sanquianga creeping segment bounded the northern extremity of the great 1906 Colombia–Ecuador earthquake, then the 1906 great rupture would have not exceeded an along-strike length of 400 km distance measured along the trench axis from the northern edge of the Carnegie Ridge creeping segment to the southern edge of the Sanquianga creeping segment (Figure 5). Comparatively, the 2005 Mw = 8.6 Nias earthquake in Indonesia ruptured a segment of ∼350–400 km of the Sunda megathrust (Chlieh et al., 2008; Hsu et al., 2006). Along the South America subduction zone, the 2001 Mw = 8.4 Arequipa earthquake in Peru ruptured a segment of ∼300–350 km (Chlieh et al., 2011; Pritchard et al., 2007), and the 2010 Mw = 8.8 Maule earthquake in Chile ruptured a segment of ∼500–550 km (Delouis et al., 2010).
By contrast, “weaker” barriers as the Mompiche and the Tumaco-Esmeraldas creeping segments appear no longer than about 20–40 km and with an average interseismic coupling lower than 0.4 (Figure 5). The proximity between the locked asperities that have respectively failed in 1942/2016, 1958, and 1979 may produce a lateral stress shadow that is translated as saddle-like shape in the lateral variation of the moment deficit rate (Figure 5A). It appears that these creeping segments have a dual behavior since they have worked efficiently during the large earthquakes of 1942, 1958, 1979, and 2016 but have both failed during the great 1906 rupture. Aftershocks that have followed the 2016 Mw = 7.8 Pedernales earthquake cluster along trench-normal alignments that fit quite well with the Mompiche creeping segment supporting the presence of some afterslip and then aseismic slip there (Agurto-Detzel et al., 2019; Ye et al., 2016). In addition, a 2-year recurrent slow slip events that trigger seismic swarms on the megathrust interface have been reported in that same segment (Vaca et al., 2018), suggesting that the apparent creeping behavior revealed by the coupling models is not a continuous process but is likely the result of higher coupling during inter-SSE periods that alternate with recurrent transient creeping episodes that contribute to release locally the accumulated moment deficit.
Seismic Catalog and Balance Between the Seismic Rate and the Moment Buildup Rate
To model the magnitude–frequency distribution along the Colombia–Ecuador subduction zone, we used a unified and homogeneous earthquake catalog (Figure 8A) recently updated in Beauval et al. (2018), which is based on instrumental and early instrumental earthquake catalogs (Beauval et al., 2018; Beauval et al., 2013; Yepes et al., 2016). This catalog is built from four global earthquake catalogs: the ISC event catalog, the ISC-Global Earthquake Model (GEM) catalog covering the time window 1900-2013 (Storchak et al., 2015), the Global Centroid Moment Tensor (gCMT) catalog covering the time window 1976–2014, and finally the NEIC catalog. For earthquakes with mb and Ms teleseismic magnitudes, Mw proxies are estimated applying conversion equations of (Lolli et al., 2014). The final catalog contains 2,531 events with Mw ≥ 4.2. For the first half of the century (1900–1963), only magnitudes down to Mw 5.5 are reported in the catalog. More details on the building of the catalog can be found in Beauval et al. (2018). For our specific analysis of the slip budget in the seismogenic zone of the subduction interface, we excluded outer rise seismicity and selected the earthquakes located in the 0–60 km depth of the Colombia–Ecuador megathrust interface.
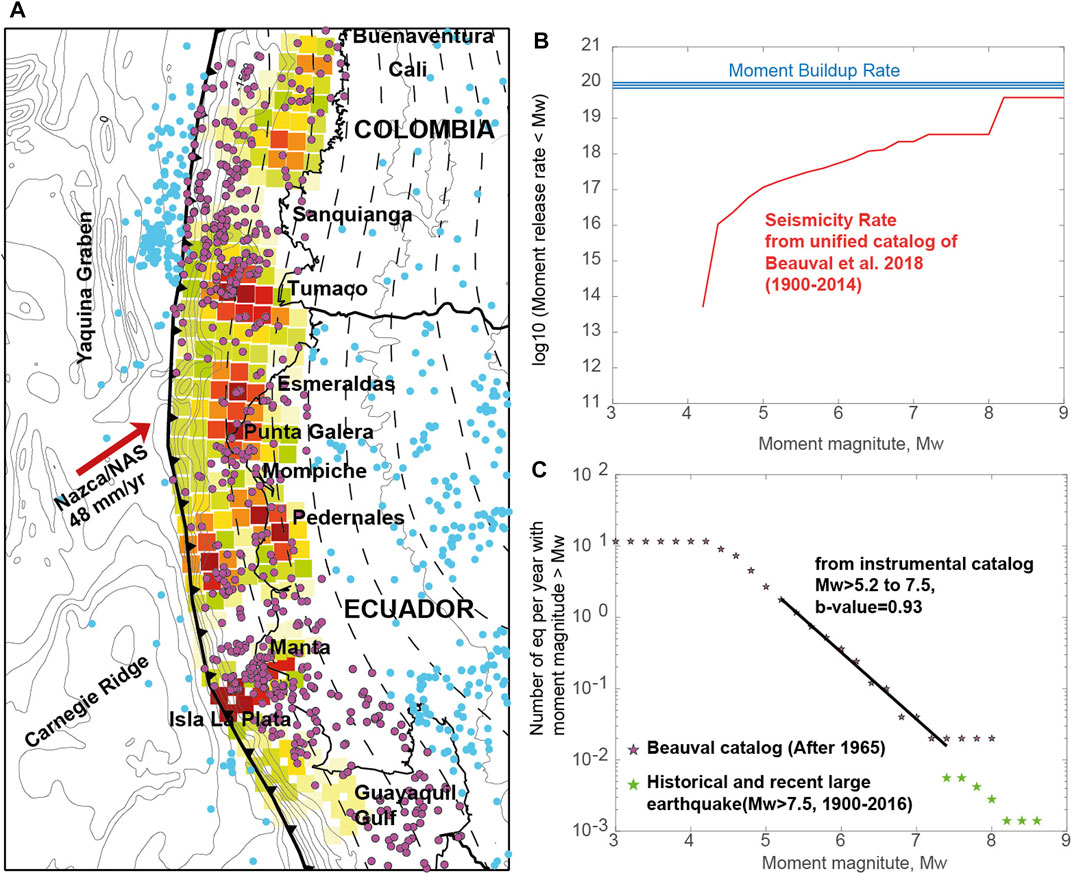
FIGURE 8. Seismic Catalog in map view, Gutenberg–Richter model of the 1965-2014 instrumental seismicity, and seismicity rate vs. the moment deficit rate. (A) Unified seismic catalog from Beauval et al. (2018) (blue and purple dots) with selected subduction event of the background seismicity (purple dots). (B) Balance of the interseismic moment buildup and the seismic moment released by the subduction earthquakes in the Ecuador–Colombia subduction segment. Blue lines show the moment buildup rates calculated from the coupling models shown in Figure 4. Red line shows the seismic rate from the unified seismic catalog (all earthquakes with magnitude less than the abscissa value are added). The seismic rate does not balance the moment buildup rate suggesting that other seismic and aseismic processes are needed to fill up the gap. (C) Frequency–magnitude distribution based on the 1965-2014 instrumental seismicity obeys a Gutenberg–Richter law with b values of 0.93 for moment magnitude Mw event in the range 5.2–7.5 (black stars). The green stars represent the events with Mw > 7.5.
The cumulative seismic moment rate is also calculated by adding the moment rates of earthquakes estimated over their completeness period. Assuming that the earthquake catalog is complete with relatively well-constrained magnitudes and that the interseismic model derived from decadal geodetic measurements reflects the average long-term interseismic buildup, we balance the interseismic moment buildup rate and the seismic moment released rate. In Figure 8B, the red line show the cumulative seismic moment release rate in the period 1900-2016 and the blue lines show the moment buildup rates calculated from our best interseismic coupling models shown in Figure 4. We found that, during the time period 1900-2016, seismicity does not balance locking in the interseismic period. One great or many large megathrust earthquakes are needed to close the budget. Alternative possibilities would invoke that aseismic slip is more prominent or that interseismic moment buildup may vary with time.
Seismic Moment Balance at the Scale of the 1906 Colombia–Ecuador Subduction Zone
Slip budget closure is reached when the long-term slip at any point on the fault equals the summation of seismic and aseismic slips (Avouac, 2015). This principle of moment balance is verified when the cumulative interseismic moment buildup balances the sum of transient seismic and aseismic moments released either through earthquakes, afterslip, or spontaneous SSEs. The moment balance can be then written as:
where MoDeficit is the cumulative moment deficit associated with the interseismic loading, MoSeismic the cumulative seismic moment, and Moaseismic the cumulative aseismic moment due to postseismic afterslip (and various slow slip events that occur during the interseismic and pre-seismic periods). Assuming that the frequency–magnitude distribution of megathrust earthquakes follows the Gutenberg–Richter (G-R) law on the long-term (Gutenberg and Richter, 1944):
where N is the number of earthquakes larger than Mw, Mw = 2/3 log10 (Mo)–6.07 with Mo in N.m (Kanamori, 1977), and Mmax the maximum magnitude on the megathrust. The slope of the distribution is the b-value and a describes the productivity. Different forms can be assumed for predicting the rates in the upper magnitude range close to Mmax (Mariniere et al., 2021); however, in this study only this form is investigated.
To derive a long-term earthquake recurrence model of the Colombia–Ecuador subduction zone, we selected subduction earthquakes in a box that includes the 0–60 km depth of the megathrust interface (purple dots in Figure 8A). Earthquake rates are obtained by normalizing the catalog by its timespan. The frequency–magnitude distribution indicates a b-value of 0.93 (Figure 8C), computed over the magnitude interval 5.2–7.5 considering the whole Colombia–Ecuador subduction zone from latitudes 3°S to 4°N.
Maximum Magnitude Earthquake and Recurrence Time
In a region where the seismicity follows a Gutenberg–Richter law, the maximum magnitude earthquake (Mmax) can be determined looking for the upper bound of the recurrence model that implies a seismic budget closure (Stevens and Avouac, 2017). Knowing the a- and b-values, the seismic budget closure determined by the interseismic moment buildup rate gives the necessary constraint to find Mmax. Assuming that the frequency–magnitude distribution follows Equation 7, the mean recurrence time of the maximum magnitude earthquake Mmax is defined as (Avouac, 2015; Molnar, 1979):
where α is the fraction of transient slip that is seismic during the seismic cycle and is written as:
Assuming a b-value of 0.93 found from the instrumental catalog and extrapolated for larger magnitudes and an average moment deficit rate (dMointer/dt) of 8.5 ± 1.5 × 10¹⁹ N m/yr, we explore what would be the maximum magnitude earthquake for various α between 0.1 and 1 (Supplementary Figure S10 and Supplementary Table S6). As the minimum bound for Mmax is the magnitude of the largest earthquake observed in that subduction zone, that is, the 1906 Mw = 8.6 event, then we found that α cannot be lower than 0.37. When α < 0.37, the frequency–magnitude distribution of the seismicity overshoots the frequency of the largest earthquake and the maximum magnitude earthquake would be lower than the 1906 event. For α = 0.1, 02, or 0.3 the model would predict a Mmax of 7.6, 8.1 and 8.4, respectively, which is not consistent with the Mmax of the historical seismic catalog. This indicates that aseismic slip cannot be more than 1.7 larger than seismic slip over the long-term. Alternatively, if aseismic slip is considered as negligible compare to seismic slip, then α would tend to 1. In the specific case where α = 1, we found a maximum magnitude event Mwmax of 9.36. This case is certainly not valid since it does not take into account any aseismic slip. We know from the 2016 Pedernales postseismic afterslip and many other postseismic afterslip examples in different subduction zones that the postseismic afterslip would release an aseismic moment of about 10–30% of the coseismic moment (Chlieh et al., 2007; Chlieh et al., 2004; Hsu et al., 2006; Perfettini et al., 2010; Remy et al., 2016). Considering that Moafterslip corresponds to about 30% of Moseismic, like in the case of the 2016 Pedernales event, then α that cannot be higher than 0.77. In that specific case, we found a maximum magnitude event Mmax of 9.16.
Moment budget closure are conducted for specific alpha value. In Figure 9, the red lines represent the seismicity rates required for the maximum magnitude earthquake to be equal to 6, 7, 8, 9 and 10 respectively from top to bottom. The blue line represents the frequency of the largest earthquake derived from Equation 8 with the geodetically-derived moment deficit rate. The intersection between the blue line and the red line fitting the moderate-to-large earthquakes indicates the largest magnitude earthquake that could occur on the whole Ecuador–Colombia subduction zone. If we consider that in the long-term, the aseismic moment released equals the seismic moment released, then α would equal to 0.5 and Mmax = 8.8 with a recurrence time of about 1,400 years. In that specific case, the model would predict that the recurrence time of an event equivalent to the 1906 Mw = 8.6 would be of 635 ± 110 years, a recurrence time that is quite consistent with paleo-seismic records from a core collected in the trench offshore Esmeraldas that indicate that a 1906-type event have occurred ∼600 years ago (Migeon et al., 2017).
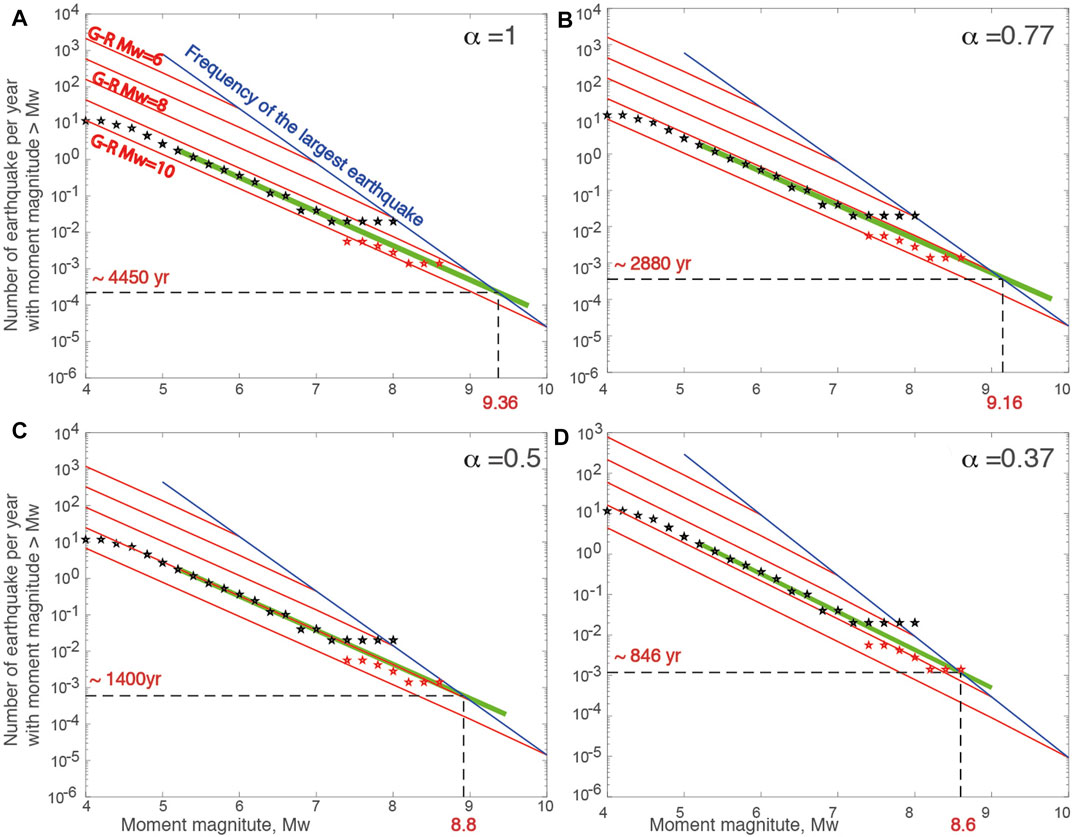
FIGURE 9. Moment budget closure for the Ecuador–Colombia subduction zone for various seismic/aseismic ratio. The blue line represents the frequency of the maximum magnitude earthquake to fulfill the moment budget closure condition. The red lines follow the GR law with a b value of 0.93 (found in the instrumental catalog, Figure 8C) and show where the seismicity should lie given an earthquake with maximum magnitude of 6, 7, 8, 9, or 10 from top to bottom, respectively. We assume different amount of seismic vs. aseismic slip: (A) α = 1, transient slip is fully seismic, (B) α = 0.77 (30% of the transient slip is aseismic), (C) α = 0.5 (transient slip is half seismic and half aseismic), and (D) α = 0.37, lower α limit to be consistent with an Mw = 8.6 event like in 1906.
Conclusion
We Found
1. The 1906 rupture length probably did not exceed ∼400 km-long and appears to be bounded by two 80 km-large creeping segments that coincide with the subduction of the Carnegie Ridge in Ecuador and of the young and fractured oceanic crust east of the Yaquina Graben in Colombia (Lonsdale, 2005; Yepes et al., 2016).
2. The 2016 Mw = 7.8 Pedernales earthquake appears to be the successor of the 1942 Mw = 7.8 event since they both broke the same asperity of the Pedernales segment
3. The 2016 Mw = 7.8 Pedernales earthquake and its associated postseismic afterslip released a cumulative moment of about 60–70% of the moment build-up since the last rupture of that segment in 1942 suggesting that this area was well mature to host the 2016 seismic event and its afterslip.
4. In the aftermath of the 2016 Pedernales event, the 1958 rupture area is mature to host an Mw = 7.7 to 7.9 event and the 1979 rupture area is mature for a Mw = 7.6 to 7.8 event. The simultaneous rupture of these two segments could host a Mw∼7.8–8.0 earthquake.
5. The cumulative seismic moment of the 1942, 1958, 1979 and 2016 earthquakes represents ∼35% of the 1906 seismic moment.
6. In the long-term, if 30% of the slip is aseismic, the moment balance suggests that the maximum magnitude event in this subduction zone could be around ∼9.2 with a mean recurrence time around 2,800 years.
7. In the long-term, if 50% of the slip is aseismic, the moment balance suggests that the maximum magnitude event in this subduction zone could be around ∼8.8 with a mean recurrence time around 1,400 years. In that case, the recurrence time of Mw = 8.6 like in 1906 would be 635 ± 110 years.
Data Availability Statement
The original contributions presented in the study are included in the article/Supplementary Material; further inquiries can be directed to the corresponding author.
Author Contributions
The preparation of the initial version of the manuscript and figures were done by MC. CB, HY, JM, MS, and LA brought their knowledge and experience to improve the aspect related to tectonics and seismic hazard. All authors discussed the results and conclusions and contributed to the final version of the manuscript.
Funding
This work has been continuously supported by the Institut de Recherche pour le Developpement (IRD, France) and the Instituto Geofísico de la Escuela Politécnica Nacional (IG-EPN, Ecuador) through the Laboratoire Mixte International “Séismes et Volcans dans les Andes du Nord”. This work is also supported by the Centre National d’Etude Spatiale (CNES) of France through the program TOSCA and the ANR MARACAS program (ANR-18-CE31-0022). We used the GMT software (Wessel and Smith, 1998) and MATLAB software to prepare the figures.
Conflict of Interest
The authors declare that the research was conducted in the absence of any commercial or financial relationships that could be construed as a potential conflict of interest.
Publisher’s Note
All claims expressed in this article are solely those of the authors and do not necessarily represent those of their affiliated organizations, or those of the publisher, the editors, and the reviewers. Any product that may be evaluated in this article, or claim that may be made by its manufacturer, is not guaranteed or endorsed by the publisher.
Supplementary Material
The Supplementary Material for this article can be found online at: https://www.frontiersin.org/articles/10.3389/feart.2021.701720/full#supplementary-material
References
Abercrombie, R. E., Antolik, M., Felzer, K., and Ekström, G. (2001). The 1994 Java Tsunami Earthquake: Slip over a Subducting Seamount. J. Geophys. Res. 106 (B4), 6595–6607. doi:10.1029/2000jb900403
Agurto-Detzel, H., Font, Y., Charvis, P., Régnier, M., Rietbrock, A., Ambrois, D., et al. (2019). Ridge Subduction and Afterslip Control Aftershock Distribution of the 2016 Mw 7.8 Ecuador Earthquake. Earth Planet. Sci. Lett. 520, 63–76. doi:10.1016/j.epsl.2019.05.029
Aki, K. (1965). Maximum Likelihood Estimate of B in the Formula logN = a - bM and its Confidence Limits. Bull. Earthquake Res. Inst. 43, 237–239.
Almeida, R., Lindsey, E. O., Bradley, K., Hubbard, J., Mallick, R., and Hill, E. M. (2018). Can the Updip Limit of Frictional Locking on Megathrusts Be Detected Geodetically? Quantifying the Effect of Stress Shadows on Near-Trench Coupling. Geophys. Res. Lett. 45, 4754–4763. doi:10.1029/2018GL077785
Alvarado, A., Audin, L., Nocquet, J. M., Jaillard, E., Mothes, P., Jarrín, P., et al. (2016). Partitioning of Oblique Convergence in the Northern Andes Subduction Zone: Migration History and the Present-Day Boundary of the North Andean Sliver in Ecuador. Tectonics 35, 1048–1065. doi:10.1002/2016TC004117
Ammon, C. J., Kanamori, H., Lay, T., and Velasco, A. A. (2006). The 17 July 2006 Java Tsunami Earthquake. Geophys. Res. Lett. 33, L24308. doi:10.1029/2006gl028005
Avouac, J.-P. (2015). From Geodetic Imaging of Seismic and Aseismic Fault Slip to Dynamic Modeling of the Seismic Cycle. Annu. Rev. Earth Planet. Sci. 43 (1), 233–271. doi:10.1146/annurev-earth-060614-105302
Beauval, C., Marinière, J., Yepes, H., Audin, L., Nocquet, J. M., Alvarado, A., et al. (2018). A New Seismic hazard Model for Ecuador. Bull. Seismol. Soc. Am. 108 (3A), 1443–1464. doi:10.1785/0120170259
Beauval, C., Yepes, H., Palacios, P., Segovia, M., Alvarado, A., Font, Y., et al. (2013). An Earthquake Catalog for Seismic Hazard Assessment in Ecuador. Bull. Seismological Soc. America 103 (2A), 773–786. doi:10.1785/0120120270
Beck, S. L., and Ruff, L. J. (1984). The Rupture Process of the Great 1979 Colombia Earthquake: Evidence for the Asperity Model. J. Geophys. Res. 89, 9281–9291. doi:10.1029/jb089ib11p09281
Bürgmann, R., Kogan, M. G., Steblov, G. M., Hilley, G., Levin, V. E., and Apel, E. (2005). Interseismic Coupling and Asperity Distribution along the Kamchatka Subduction Zone. J. Geophys. Res. 110, B07405. doi:10.1029/2005JB003648
Bürgmann, R., Rosen, P. A., and Fielding, E. J. (2000). Synthetic Aperture Radar Interferometry to Measure Earth's Surface Topography and its Deformation. Annu. Rev. Earth Planet. Sci. 28, 169–209. doi:10.1146/annurev.earth.28.1.169
Chlieh, M., Avouac, J. P., Hjorleifsdottir, V., Alex Song, T. R., Ji, C., Sieh, K., et al. (2007). Coseismic Slip and Afterslip of the Great (Mw9.15) Sumatra-Andaman Earthquake of 2004. Bull. Seism. Soc. Am. 97 (No. 1A), S152–S173. doi:10.1785/0120050631
Chlieh, M., Avouac, J. P., Sieh, K., Natawidjaja, D. H., and Galetzka, J. (2008). Heterogeneous Coupling of the Sumatran Megathrust Constrained by Geodetic and Paleogeodetic Measurements. J. Geophys. Res. 113 (B05305). doi:10.1029/2007JB004981
Chlieh, M., de Chabalier, J. B., Ruegg, J. C., Armijo, R., Dmowska, R., Campos, J., et al. (2004). Crustal Deformation and Fault Slip during the Seismic Cycle in the North Chile Subduction Zone, from GPS and InSAR Observations. Geophys. J. Int. 158 (2), 695–711. doi:10.1111/j.1365-246x.2004.02326.x
Chlieh, M., Mothes, P. A., Nocquet, J.-M., Jarrin, P., Charvis, P., Cisneros, D., et al. (2014). Distribution of Discrete Seismic Asperities and Aseismic Slip along the Ecuadorian Megathrust. Earth Planet. Sci. Lett. 400, 292–301. doi:10.1016/j.epsl.2014.05.027
Chlieh, M., Perfettini, H., Tavera, H., Avouac, J.-P., Remy, D., Nocquet, J.-M., et al. (2011). Interseismic Coupling and Seismic Potential along the Central Andes Subduction Zone. J. Geophys. Res. 116, B1245. doi:10.1029/2010JB008166
Collot, J.-Y., Charvis, P., Gutscher, M. A., and Operto, S. (2002). Exploring the Ecuador-Colombia Active Margin and Inter-plate Seismogenic Zone. EOS Trans. AGU 83 (17), 189–190. doi:10.1029/2002eo000120
Collot, J.-Y., Sanclemente, E., Nocquet, J.-M., Leprêtre, A., Ribodetti, A., Jarrin, P., et al. (2017). Subducted Oceanic Relief Locks the Shallow Megathrust in central Ecuador. J. Geophys. Res. Solid Earth 122, 3286–3305. doi:10.1002/2016JB013849
Delouis, B., Nocquet, J.-M., and Vallée, M. (2010). Slip Distribution of the February 27, 2010 Mw = 8.8 Maule Earthquake, central Chile, from Static and High-Rate GPS, InSAR, and Broadband Teleseismic Data. Geophys. Res. Lett. 37, L17305. doi:10.1029/2010GL043899
Font, Y., Segovia, M., Vaca, S., and Theunissen, T. (2013). Seismicity Patterns along the Ecuadorian Subduction Zone: New Constraints from Earthquake Location in a 3-D A Priori Velocity Model. Geophys. J. Int. 193, 263-286. doi:10.1093/gji/ggs1083
Gagnon, K., Chadwell, C. D., and Norabuena, E. (2005). Measuring the Onset of Locking in the Peru-Chile Trench with GPS and Acoustic Measurements. Nature 434 (7030), 205–208. doi:10.1038/nature03412
Gombert, B., Duputel, Z., Jolivet, R., Simons, M., Jiang, J., Liang, C., et al. (2018). Strain Budget of the Ecuador-Colombia Subduction Zone: A Stochastic View. Earth Planet. Sci. Lett. 498, 288–299. doi:10.1016/j.epsl.2018.06.046
Gutenberg, B., and Richter, C. F. (1944). Frequency of Earthquakes in California*. Bull. Seismol. Soc. Am. 34 (4), 185–188. doi:10.1785/bssa0340040185
Gutenberg, B., and Richter, C. F. (1954). Seismicity of the Earth and Associated Phenomena. Princeton, NJ: Princeton University Press, 310.
Hardy, N. C. (1991). Tectonic Evolution of the Easternmost Panama basin: Some New Data and Inferences. J. South Am. Earth Sci. 4 (3), 261–269. doi:10.1016/0895-9811(91)90035-j
Hayes, G. P., Moore, G. L., Portner, D. E., Hearne, M., Flamme, H., Furtney, M., et al. (2018). Slab2, a Comprehensive Subduction Zone Geometry Model. Science 362 (6410), 58–61. doi:10.1126/science.aat4723
Hayes, G. P., Wald, D. J., and Johnson, R. L. (2012). Slab1.0: A Three-Dimensional Model of Global Subduction Zone Geometries. J. Geophys. Res. 117 (B1), B01302. doi:10.1029/2011jb008524
He, P., Hetland, E. A., Wang, Q., Ding, K., Wen, Y., and Zou, R. (2017). Coseismic Slip in the 2016Mw 7.8 Ecuador Earthquake Imaged from Sentinel‐1A Radar Interferometry. Seismological Res. Lett. 88 (2A), 277–286. doi:10.1785/0220160151
Heidarzadeh, M., Murotani, S., Satake, K., Takagawa, T., and Saito, T. (2017). Fault Size and Depth Extent of the Ecuador Earthquake (Mw 7.8) of 16 April 2016 from Teleseismic and Tsunami Data. Geophys. Res. Lett. 44, 2211–2219. doi:10.1002/2017GL072545
Herman, M. W., and Govers, R. (2020). Locating Fully Locked Asperities along the South America Subduction Megathrust: A New Physical Interseismic Inversion Approach in a Bayesian Framework. Geochem. Geophys. Geosystems 21, e2020GC009063. doi:10.001029/002020GC009063
Hoskins, M. C., Meltzer, A., Font, Y., Agurto-Detzel, H., Vaca, S., Rolandone, F., et al. (2021). Triggered Crustal Earthquake Swarm across Subduction Segment Boundary after the 2016 Pedernales, Ecuador Megathrust Earthquake. Earth Plan. Sci. Lett. 553, 116620. doi:10.1016/j.epsl.2020.116620
Hsu, Y.-J., Simons, M., Avouac, J. P., Sieh, K., Galetzka, J., Chlieh, M., et al. (2006). Frictional Afterslip Following the 2005 Nias-Simeulue Earthquake, Sumatra. Science 312 (5782), 1921–1926. doi:10.1126/science.1126960
Ide, S., Beroza, G. C., Shelly, D. R., and Uchide, T. (2007). A Scaling Law for Slow Earthquakes. Nature 447, 76–79. doi:10.1038/nature05780
Ihmlé, P. F., Gomez, J.-M., Heinrich, P., and Guibourg, S. (1998). The 1996 Peru Tsunamigenic Earthquake: Broadband Source Process. Geophys. Res. Lett. 25 (14), 2691–2694. doi:10.1029/98gl01987
Ji, C., Wald, D., and Helmberger, D. V. (2002). Source Description of the 1999 Hector Mine, California, Earthquake, Part I: Wavelet Domain Inversion Theory and Resolution Analysis. Bull. Seismological Soc. America 92 (4), 1192–1207. doi:10.1785/0120000916
Jolivet, R., Simons, M., Duputel, Z., Olive, J. A., Bhat, H. S., and Bletery, Q. (2020). Interseismic Loading of Subduction Megathrust Drives Long‐term Uplift in Northern Chile. Geophys. Res. Lett. 47, e2019GL085377. doi:10.1029/2019gl085377
Kanamori, H., and McNally, K. C. (1982). Variable Rupture Mode of the Subduction Zone along the Ecuador-Colombia Coast. Bull. Seismol. Soc. Am. 72 (4), 1241–1253.
Kanamori, H. (1977). The Energy Release in Great Earthquakes. J. Geophys. Res. 82, 2982–2983. doi:10.1029/jb082i020p02981
Kaneko, Y., Avouac, J.-P., and Lapusta, N. (2010). Towards Inferring Earthquake Patterns from Geodetic Observations of Interseismic Coupling. Nat. Geosci 3, 363–369. doi:10.1038/ngeo843
Kelleher, J. A. (1972). Rupture Zones of Large South American Earthquakes and Some Predictions. J. Geophys. Res. 77, 2087–2103. doi:10.1029/jb077i011p02087
Kendrick, E., Bevis, M., Smalley, R., Brooks, B., Vargas, R. B., Laurı́a, E., et al. (2003). The Nazca-South America Euler Vector and its Rate of Change. J. South Am. Earth Sci. 16 (2), 125–131. doi:10.1016/s0895-9811(03)00028-2
Konca, A. O., Avouac, J.-P., Sladen, A., Meltzner, A. J., Sieh, K., Fang, P., et al. (2008). Partial Rupture of a Locked Patch of the Sumatra Megathrust during the 2007 Earthquake Sequence. Nature 456, 631–635. doi:10.1038/nature07572
Lin, Y.-n. N., Sladen, A., Ortega-Culaciati, F., Simons, M., Avouac, J.-P., Fielding, E. J., et al. (2013). Coseismic and Postseismic Slip Associated with the 2010 Maule Earthquake, Chile: Characterizing the Arauco Peninsula Barrier Effect. J. Geophys. Res. Solid Earth 118, 3142–3159. doi:10.1002/jgrb.50207
Lindsey, E. O., Mallick, R., Hubbard, J. A., Bradley, K. E., Almeida, R. V., Moore, J. D. P., et al. (2021). Slip Rate Deficit and Earthquake Potential on Shallow Megathrusts. Nat. Geosci. 14, 321–326. doi:10.1038/s41561-021-00736-x
Lolli, B., Gasperini, P., and Vannucci, G. (2014). Empirical Conversion between Teleseismic Magnitudes (Mb and Ms) and Moment Magnitude (Mw) at the Global, Euro-Mediterranean and Italian Scale. Geophys. J. Int. 199 (2), 805–828. doi:10.1093/gji/ggu264
Lonsdale, P. (2005). Creation of the Cocos and Nazca Plates by Fission of the Farallon Plate. Tectonophysics 404 (3-4), 237–264. doi:10.1016/j.tecto.2005.05.011
Loveless, J. P., and Meade, B. J. (2011). Spatial Correlation of Interseismic Coupling and Coseismic Rupture Extent of the 2011 MW= 9.0 Tohoku-Oki Earthquake. Geophys. Res. Lett. 38 (17), a–n. doi:10.1029/2011GL048561
MacMillan, I., Gans, P. B., and Alvarado, G. (2004). Middle Miocene to Present Plate Tectonic History of the Southern Central American Volcanic Arc. Tectonophysics 392 (1-4), 325–348. doi:10.1016/j.tecto.2004.04.014
Marcaillou, B., Collot, J.-Y., Ribodetti, A., d'Acremont, E., Mahamat, A.-A., and Alvarado, A. (2016). Seamount Subduction at the North-Ecuadorian Convergent Margin: Effects on Structures, Inter-seismic Coupling and Seismogenesis. Earth Planet. Sci. Lett. 433, 146–158. doi:10.1016/j.epsl.2015.10.043
Mariniere, J., Beauval, C., Nocquet, J.-M., Chlieh, M., and Yepes, H. (2021). Earthquake Recurrence Model for the Colombia-Ecuador Subduction Zone Constrained from Seismic and Geodetic Data, Implication for PSHA. Bull. Seismol. Soc. Am. 111, 1508–1528. doi:10.1785/0120200338
Melnick, D. (2016). Rise of the central Andean Coast by Earthquakes Straddling the Moho. Nat. Geosci 9 (5), 401–407. doi:10.1038/ngeo2683
Mendoza, C., and Dewey, J. W. (1984). Seismicity Associated with the Great Colombia-Ecuador Earthquakes of 1942, 1958 and 1979: Implications for Barrier Models of Earthquake Rupture. Bull. Seismol. Soc. Am. 74 (2), 577–593.
Metois, M., Vigny, C., and Socquet, A. (2016). Interseismic Coupling, Megathrust Earthquakes and Seismic Swarms along the Chilean Subduction Zone (38°-18°S). PAGeoph 173. doi:10.1007/s00024-00016-01280-5
Michel, S., Gualandi, A., and Avouac, J.-P. (2019). Similar Scaling Laws for Earthquakes and Cascadia Slow-Slip Events. Nature 574, 522–526. doi:10.1038/s41586-019-1673-6
Migeon, S., Garibaldi, C., Ratzov, G., Schmidt, S., Collot, J.-Y., Zaragosi, S., et al. (2017). Earthquake-triggered Deposits in the Subduction Trench of the north Ecuador/south Colombia Margin and Their Implication for Paleoseismology. Mar. Geology. 384, 47–62. doi:10.1016/j.margeo.2016.09.008
Molnar, P. (1979). Earthquake Recurrece Intervals and Plate Tectonics. Bull. Seism. Soc. Am. 69, 115–133.
Mora-Páez, H., Kellogg, J. N., Freymueller, J. T., Mencin, D., Fernandes, R. M. S., Diederix, H., et al. (2019). Crustal Deformation in the Northern Andes - A New GPS Velocity Field. J. South Am. Earth Sci. 89, 76–91. doi:10.1016/j.jsames.2018.11.002
Moreno, M., Rosenau, M., and Oncken, O. (2010). 2010 Maule Earthquake Slip Correlates with Pre-seismic Locking of Andean Subduction Zone. Nature 467, 198–202. doi:10.1038/nature09349
Nocquet, J.-M., Jarrin, P., Vallée, M., Mothes, P. A., Grandin, R., Rolandone, F., et al. (2016). Supercycle at the Ecuadorian Subduction Zone Revealed after the 2016 Pedernales Earthquake. Nat. Geosci 10, 145–149. doi:10.1038/ngeo2864
Nocquet, J.-M., Villegas-Lanza, J. C., Chlieh, M., Mothes, P. A., Rolandone, F., Jarrin, P., et al. (2014). Motion of continental Slivers and Creeping Subduction in the Northern Andes. Nat. Geosci 7 (4), 287–291. doi:10.1038/ngeo2099
Okal, E. A. (1992). Use of the Mantle magnitudeM M for the Reassessment of the Moment of Historical Earthquakes. PAGEOPH 139, 17–57. doi:10.1007/BF00876825
Perfettini, H., Avouac, J.-P., Tavera, H., Kositsky, A., Nocquet, J.-M., Bondoux, F., et al. (2010). Seismic and Aseismic Slip on the Central Peru Megathrust. Nature 465, 78–81. doi:10.1038/nature09062
Pritchard, M. E., Norabuena, E. O., Ji, C., Boroschek, R., Comte, D., Simons, M., et al. (2007). Geodetic, Teleseismic, and strong Motion Constraints on Slip from Recent Southern Peru Subduction Zone Earthquakes. J. Geophys. Res. 112, B03307. doi:10.1029/2006JB004294
Radiguet, M., Cotton, F., Vergnolle, M., Campillo, M., Walpersdorf, A., Cotte, N., et al. (2012). Slow Slip Events and Strain Accumulation in the Guerrero gap, Mexico. J. Geophys. Res. 117, B04305. doi:10.1029/2011jb008801
Remy, D., Perfettini, H., Cotte, N., Avouac, J. P., Chlieh, M., Bondoux, F., et al. (2016). Postseismic Relocking of the Subduction Megathrust Following the 2007 Pisco, Peru, Earthquake. J. Geophys. Res. Solid Earth 121 (5), 3978–3995. doi:10.1002/2015JB012417
Robinson, D. P., Das, S., and Watts, A. B. (2006). Earthquake Rupture Stalled by a Subducting Fracture Zone. Science 312, 1203–1205. doi:10.1126/science.1125771
Rolandone, F., Nocquet, J.-M., Mothes, P. A., Jarrin, P., Vallée, M., Cubas, N., et al. (2018). Areas Prone to Slow Slip Events Impede Earthquake Rupture Propagation and Promote Afterslip. Sci. Adv. 4 (1), eaao6596. doi:10.1126/sciadv.aao6596
Saillard, M., Audin, L., Rousset, B., Avouac, J.-P., Chlieh, M., Hall, S. R., et al. (2017). From the Seismic Cycle to Long-Term Deformation: Linking Seismic Coupling and Quaternary Coastal Geomorphology along the Andean Megathrust. Tectonics 36 (2), 241–256. doi:10.1002/2016TC004156
Savage, J. C. (1983). A Dislocation Model of Strain Accumulation and Release at a Subduction Zone. J. Geophys. Res. 88, 4984–4996. doi:10.1029/jb088ib06p04984
Segovia, M., Font, Y., Régnier, M., Charvis, P., Galve, A., Nocquet, J.-M., et al. (2018). Seismicity Distribution Near a Subducting Seamount in the Central Ecuadorian Subduction Zone, Space-Time Relation to a Slow-Slip Event. Tectonics 37, 2106–2123. doi:10.1029/2017TC004771
Shrivastava, M. N., González, G., Moreno, M., Chlieh, M., Salazar, P., Reddy, C. D., et al. (2016). Coseismic Slip and Afterslip of the 2015 Mw 8.3 Illapel (Chile) Earthquake Determined from Continuous GPS Data. Geophys. Res. Lett. 43 (20), 10710–10719. doi:10.1002/2016GL070684
Soto-Cordero, L., Meltzer, A., Bergman, E. A., Hoskins, M., Stachnik, J. C., Alvarado, A., et al. (2020). Structural Control on Megathrust Rupture and Slip Behavior: Insights from the 2016 Mw 7.8 Pedernales Ecuador Earthquake. J. Geophys. Res. Solid Earth 125, e2019JB018001. doi:10.1029/2019JB018001
Stevens, V. L., and Avouac, J. P. (2017). Determination of Mmax from Background Seismicity and Moment Conservation. Bull. Seism. Soc. Am. 107 (6), 2578–2596. doi:10.1785/0120170022
Storchak, D. A., Di Giacomo, D., Engdahl, E. R., Harris, J., Bondár, I., Lee, W. H. K., et al. (2015). The ISC-GEM Global Instrumental Earthquake Catalogue (1900–2009): Introduction. Phys. Earth Planet. 239, 48–63.
Swenson, J. L., and Beck, S. L. (1996). Historical 1942 Ecuador and 1942 Peru Subduction Earthquakes, and Earthquake Cycles along Colombia-Ecuador and Peru Subduction Segments. Pure Appl. Geophys. 146 (1), 67–101.
Tsang, L. L. H., Vergnolle, M., Twardzik, C., Sladen, A., Nocquet, J.-M., Rolandone, F., et al. (2019). Imaging Rapid Early Afterslip of the 2016 Pedernales Earthquake, Ecuador. Earth Planet. Sci. Lett. 524, 115724. doi:10.1016/j.epsl.2019.115724
Tsuzuki, M., Koyama, J., R. Gusman, A., and Yomogida, K. (2017). Re-evaluation of Earthquake and Tsunami Magnitudes of the 1906 Great Ecuador-Colombia Earthquake. Jssj 69, 87–98. doi:10.4294/zisin.69.87
Twardzik, C., Vergnolle, M., Sladen, A., and Avallone, A. (2019). Unravelling the Contribution of Early Postseismic Deformation Using Sub-daily GNSS Positioning. Sci. Rep. 9, 1775. doi:10.1038/s41598-41019-39038-z
Vaca, S., Vallée, M., Nocquet, J.-M., Battaglia, J., and Régnier, M. (2018). Recurrent Slow Slip Events as a Barrier to the Northward Rupture Propagation of the 2016 Pedernales Earthquake (Central Ecuador). Tectonophysics 724-725, 80–92. doi:10.1016/j.tecto.2017.12.012
Vallée, M., Nocquet, J.-M., Battaglia, J., Font, Y., Segovia, M., Régnier, M., et al. (2013). Intense Interface Seismicity Triggered by a Shallow Slow Slip Event in the Central Ecuador Subduction Zone. J. Geophys. Res. Solid Earth 118, 2965–2981. doi:10.1002/jgrb.50216
Wessel, P., and Smith, W. H. F. (1998). New, improved version of generic mapping tools released. Eos Trans. AGU 79 (49), 579. doi:10.1029/98EO00426
Xie, X., and Yao, Z. X. (1989). A Generalized Reflection-Transmission Coefficient Matrix Method to Calculate Static Displacement Field of a Dislocation Source in a Stratified Half Space. Chin. J. Geophys. 32, 191–205.
Ye, L., Kanamori, H., Avouac, J.-P., Li, L., Cheung, K. F., and Lay, T. (2016). The 16 April 2016, M7.8 (M7.5) Ecuador Earthquake: A Quasi-Repeat of the 1942 M7.5 Earthquake and Partial Re-rupture of the 1906 M8.6 Colombia-Ecuador Earthquake. Earth Planet. Sci. Lett. 454, 248–258. doi:10.1016/j.epsl.2016.09.006
Yepes, H., Audin, L., Alvarado, A., Beauval, C., Aguilar, J., Font, Y., et al. (2016). A New View for the Geodynamics of Ecuador: Implication in Seismogenic Source Definition and Seismic hazard Assessment. Tectonics 35 (5), 1249–1279. doi:10.1002/2015tc003941
Yi, L., Xu, C., Wen, Y., Zhang, X., and Jiang, G. (2018). Rupture Process of the 2016 Mw 7.8 Ecuador Earthquake from Joint Inversion of InSAR Data and Teleseismic P Waveforms. Tectonophysics 722, 163–174. doi:10.1016/j.tecto.2017.10.028
Keywords: Seismic Cycle, Ecuador-Colombia Subduction, maximum magnitude, Seismic Hazard, aseismic slip on the seismogenic zone
Citation: Chlieh M, Beauval C, Yepes H, Marinière J, Saillard M and Audin L (2021) Seismic and Aseismic Cycle of the Ecuador–Colombia Subduction Zone. Front. Earth Sci. 9:701720. doi: 10.3389/feart.2021.701720
Received: 28 April 2021; Accepted: 27 July 2021;
Published: 22 September 2021.
Edited by:
Rafael Almeida, Yachay Tech University, EcuadorReviewed by:
Matthew Herman, California State University, Bakersfield, United StatesAnne Meltzer, Lehigh University, United States
Kyle Bradley, Nanyang Technological University, Singapore
Copyright © 2021 Chlieh, Beauval, Yepes, Marinière, Saillard and Audin. This is an open-access article distributed under the terms of the Creative Commons Attribution License (CC BY). The use, distribution or reproduction in other forums is permitted, provided the original author(s) and the copyright owner(s) are credited and that the original publication in this journal is cited, in accordance with accepted academic practice. No use, distribution or reproduction is permitted which does not comply with these terms.
*Correspondence: M. Chlieh, bW9oYW1lZC5jaGxpZWhAdW5pdi1ncmVub2JsZS1hbHBlcy5mcg==, bW9oYW1lZC5jaGxpZWhAaXJkLmZy