 Xi Xu1
 Shengqing Xiong1,2*
 Akiko Tanaka3Qiang Zheng2Xingtao Kuang1Xiaoying Zhu1Daoqing Zhou1
 Qifang Zheng1Jianhua Wan1Xuezhong Yu1Baodi Wang1
- 1China Aero Geophysical Survey and Remote Sensing Center for Natural Resources, Beijing, China
- 2School of Geophysics and Information Technology, China University of Geosciences, Beijing, China
- 3Geological Survey of Japan, National Institute of Advanced Industrial Science and Technology, Tsukuba, Japan
The lateral distribution of the magnetic layer beneath the Tarim Craton and its environs was estimated from spectral analysis using the newest high-resolution aeromagnetic dataset of mainland China, which is enlarged by EMAG2. As a proxy, the Curie point depth (CPD) provides a comprehensive view of a crust-scale thermal regime, accounted for the depth at which magnetite becomes paramagnetic, and the correspondence of the CPD with the tectonic regime indicates that the CPD is useful for delineating the regional crustal thermal structure. Furthermore, lateral variations in CPD provide useful insights into the lithospheric thermal state of the Tarim Craton and its surrounding areas and can be related to ancient and active tectonics, such as geothermal activity, seismicity, and mineral-petroleum generation. In the Tarim interior, the NW domain covering the Bachu Uplift and its surrounding areas corresponds to the minimum magnetic CPD signature geometry of this area, which is most likely linked to the Permian Tarim plume-lithosphere interaction. In contrast, the other domains are characterized by large CPD values (up to 50 km), which are floored by a Precambrian basement without the Permian magmatism modification. Moreover, the estimated CPD values are consistent with surface heat flow measurements with an inverse correlation, which can assist in identifying the potential area for mineral deposits and hydrocarbon fields. Earthquakes are mostly concentrated in the gradient and transition zones of the Curie surface, suggesting that these abrupt variation domains in the crustal thermal structure act as a secondary mechanism for earthquake generation.
Introduction
The Earth’s crustal thermal structure is related to ancient and active tectonics such as volcanism, intrusion, mountain uplift and earthquakes (e.g., Turcotte and Schubert, 2002a; Li et al., 2009; Li et al., 2012a; Correa et al., 2016; Wang et al., 2018), and constrains the lithospheric tectonic processes in response to the dynamics of the Earth, as the mechanical/physical properties of the crust and lithosphere are temperature-dependent (Afonso et al., 2005). The thermal structure is commonly described by the Curie point depth (CPD), which is used as a proxy for the regional thermal structure (Okubo et al., 1985; Tanaka et al., 1999; Ross et al., 2006; Li et al., 2009; Li et al., 2012b; Correa et al., 2016). It is widely accepted that the CPD may be interpreted as the isotherm surface where ferromagnetic magnetized minerals, which are responsible for the magnetization of crustal rocks, become paramagnetic due to the temperature (CPD), generally approximated at 580°C (Bhattacharyya and Leu, 1975; Frost and Shive, 1986; Lorwrie, 2007). The depth of this surface depending on temperature can be accurately used to infer the regional thermal structure within the lithosphere. Generally, surficial heat flow variations have been used to infer the deep thermal structure (e.g., Liu et al., 2016). However, considering the influence of irregularly distributed measurements, shallow geothermal circulation, and local tectonic activity (e.g., Davies, 2013; Li and Wang, 2016; Andrés et al., 2018), the thermal regime can be better constrained overall via the CPD, which is derived from magnetic anomalies; the CPD is viewed as an alternative to circumvent the thermal configuration of crust and lithosphere (e.g., Tanaka, 2007).
The CPD corresponds to the depth to the bottom boundary of the crustal magnetic layer estimated by magnetic anomaly data spectral analysis. Such a spectral approach in the Fourier domain is assumed to be independent of the directional attributes of the magnetized sources, as it is used to statistically average the source depths over a region with complex tectonic patterns (e.g., Tanaka et al., 1999; Tanaka, 2017). In the past forty years, many studies have focused on determination of the CPD in various geological regions and have found a link between this parameter and tectonic evolution and dynamics (e.g., Bhattacharyya and Leu, 1975; Okubo et al., 1985; Tanaka et al., 1999; Turcotte and Schubert, 2002b; Ross et al., 2006; Li et al., 2009; Li et al., 2012a; Correa et al., 2016; Wang et al., 2018). For the first time, based on the spectral approach originally proposed by Spector and Grant (1970), Bhattacharyya and Leu (1975) developed a method to estimate the centroid depth over Yellowstone National Park in the United States assuming a constant parallelepiped magnetization model. Later, Okubo et al. (1985) and Tanaka et al. (1999) further developed this method to account for random magnetization. Recently, a revised centroid method, which assumes that the magnetic layer responds to a fractal distribution of sources, has been widely applied in different scenarios (e.g., Maus et al., 1997; Bouligand et al., 2009; Bansal et al., 2011; Li et al., 2013; Wang and Li, 2015; Li and Wang, 2016). Among all the available methods that have been used to compare the depth of the magnetized layer based on the azimuthally averaged spectra of the magnetic data, Ravat et al. (2007) stated that it would be difficult to assess the approach that yields the best results, although the spectral method in the Fourier domain may be the only way to determine the statistically averaged depth over a complex region with an ensemble of magnetic sources (e.g., Odegard and Dickson, 2004). This spectral method remains contentious, as the Curie surface may be caused by a lithologic contact rather than a thermal boundary (Tanaka, 2017). However, further literature reveals that the expected inverse correlation between the estimated basal depth of the magnetic layer and surface heat flux exists universally in various regions (e.g., Tanaka et al., 1999; Li et al., 2013; Wang and Li, 2015; Li and Wang, 2016), suggesting that the Curie depth can be likely used to infer crustal thermal structure.
The Tarim Craton, expressed as a largest sedimentary basin in the China mainland (e.g., Carroll et al., 2010), has remained a research focus since the great discoveries of petroleum resources in the late 1950s (e.g., Jia, 1997). The Tarim Basin is a gigantic cratonic basin divided by several tectonic units and bounded by several active orogens, e.g., the Tian Shan, Altyn and West-Kunlun. Several significant geological processes control the basin’s tectonics, including the Permian Tarim large igneous event (e.g., Yang et al., 2007; Li et al., 2014; Xu et al., 2014) and the collision of the India-Australia plates with Eurasia (e.g., Yin, 2010; Yin and Harrison, 2000). Due to the complex tectonics and dynamics, it is important to infer in detail the CPD distribution for the entire Tarim Basin and its surrounding areas to better understand the deformation and evolution of the lithosphere. To date, only a few studies on CPD variations have been carried out. Li and Xu (1999) estimated the average CPD of the Tarim Basin by adopting the calculation from the moment spectrum analysis of aeromagnetic. Based on the geomagnetic field model NGDC-720-V3 (Maus 2010), Gao et al. (2015) and Shi et al. (2018) calculated the spatial variations in CPD across the Tarim Basin and its environs. In addition, recent studies on the CPD distribution and its anisotropy over the Tarim domain and its environs have been performed on both global and Chinese mainland scales by Li et al. (2016) and Xiong et al. (2016), respectively. These researchers suggested that it would be difficult to infer the fine thermal structure from a Curie-isotherm depth map with low resolution due to the large geographic scale (Li et al., 2016; Xiong et al., 2016) and satellite-derived magnetic data (Gao et al., 2015; Shi et al., 2018). Another perplexing difficulty is the interpretation of the geological meanings of the Curie surface. Resolving these dilemmas requires new datasets and related processing and interpretation schemes.
The primary aim of this study is to use the newest aeromagnetic dataset to calculate the depth to the bottom of the magnetization (indicated by the CPD) by undertaking the spectral method in the Fourier domain as described by Tanaka et al. (1999). Lateral variations in the topography of the CPD provide useful insights into the thermal structure of the Tarim Basin and can be correlated with ancient and present tectonics. By systematically processing the high-resolution aeromagnetic data and thoroughly integrating and comparing the estimated CPD with all the available geophysical and geological information, including outcrop, surface heat flow, electrical resistivity, Mohorovičić discontinuity (Moho) and earthquake records, we can answer some key scientific questions concerning the abnormal thermal structure beneath the Tarim Craton, the crustal composition heterogeneity of Tarim Large Igneous Province, the correspondence between the Curie surface and heat flow, and the correlation between the crustal thermal structure and earthquake generation.
Geological and Geophysical Frameworks
Located in Xinjiang Province of northwestern China, the modern Tarim Basin is the largest sedimentary basin in China, occupying an area of ∼600,000 km2. The Tarim Basin is tectonically bounded by the Tian Shan orogenic belt to the north and the West-Kunlun and Altyn orogenic belts to the south (Lu et al., 2008; Zhang et al., 2013a, Zheng et al., 2013) (Figure 1A). These belts all originated from the Indian-Asia collision-driven compressional processes (e.g., Yin, 2010). Furthermore, the Tian Shan resulted from subduction-related accretion in the Junggar-Balkash and South Tian Shan Oceans during the Paleozoic (Şengör et al., 1993; Allen et al., 1999; Chen et al., 1999; Windley et al., 2007; Charvet et al., 2011; Xiao et al., 2013) and is the western portion of the Central Asian orogenic belt. The West-Kunlun is located along the northwestern margin of the Tibetan Plateau, marked by a passive margin from the Carboniferous to Early Permian (Bi et al., 1999; Xiao et al., 2002; Xiao et al., 2005) and extending from the Pamir syntax to the southern portion of the Tarim Basin. The Altyn acts as the prominent active tectonic southern boundary of the Tarim Craton during the India-Asia collision and extends along the northeastern edge of the expanding Tibetan Plateau (Sobel and Arnaud, 1999; Chen et al., 2001; Khain et al., 2003; Yin, 2010).
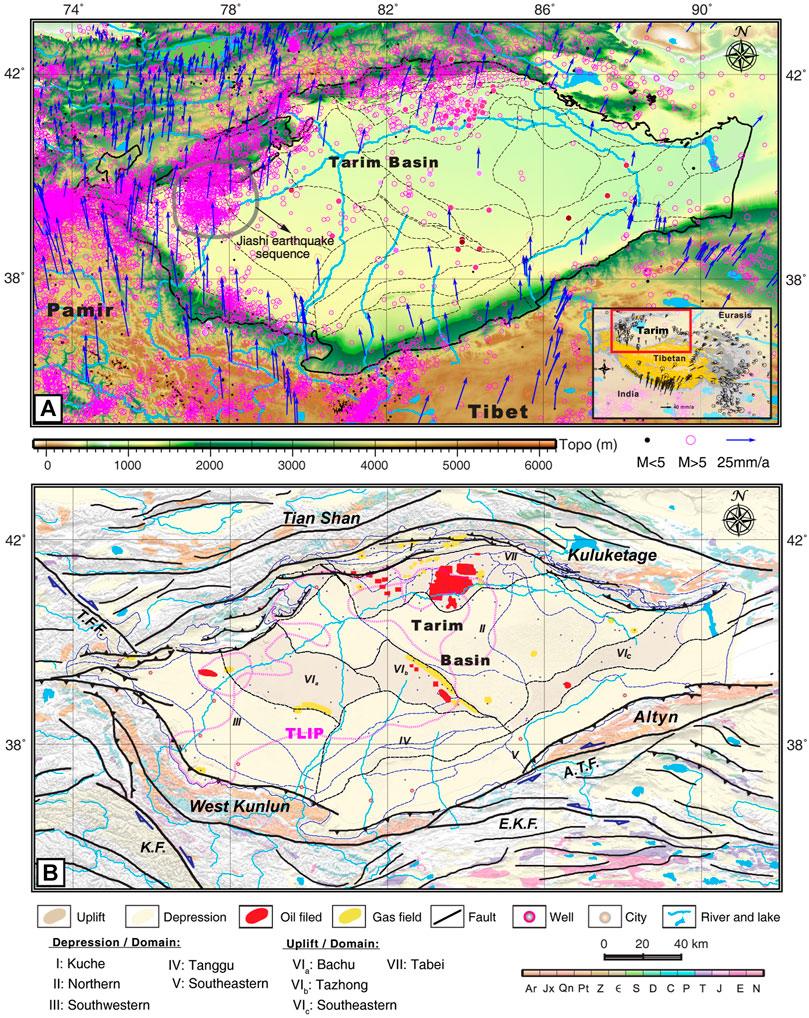
FIGURE 1. (A) Topography of the Tarim Basin and its environs. Inset map shows the location of study area. The black and purple circles represent earthquakes from 1964 to 2016, from the ISC data base (http://www.isc.ac.uk/). The blue arrows represent GPS velocities relative to Siberia (Zheng et al., 2017). The black line outlines the Tarim Basin, within which the dashed black lines are the boundaries of subdomains corresponding to basinal structural units marked and named as in the legend, and the red lines are major faults (B) Tectonic map of the Tarim Basin and its environs. The black lines represent major faults and sutures. These multi-colored patches on the digital elevation model are chronological geological bodies including Precambrian basement and igneous rocks, modified from XJBGMR (1993b), XZBGMR (1993a) and QHBGMR (1991). The purple line represents the Tarim Large Igneous Province (TLIP), modified from Yang et al. (2007). The yellow patches are Cenozoic layers. Abbreviations are as follows: A.T.F., Altyn-Tagh Fault; T.F.F., Talas-Fergana Fault; K.F., Karakorum Fault; E.A.F., East-Kunlun Fault; K.F., Karakorum Fault. The underlying topography is derived from the ETOPO1 model available from the NOAA database (http://www.ngdc.noaa.gov/mgg/global/global.html).
The Tarim Craton is also the least known of the continental blocks in Asia because of its extensive coverage by the Taklamagan desert (Xu et al., 2014), which is floored by a Precambrian crystalline basement and overlain by thick Late Precambrian to Phanerozoic sedimentary cover, locally exceeding 15 km (He et al., 2018; Wu et al., 2018). The Precambrian basement is believed to be related to the breakup of the Rodinian supercontinent (Li et al., 2003; Lu et al., 2008), while the origin of sedimentary strata may be traced to the Paleozoic or even farther back to the Neoproterozoic (Guo et al., 2015; Wu et al., 2018; He et al., 2018). In the Tarim interior, several regionally extensive unconformities corresponding to tectonic activities at different times have been drilled by industrial exploration wells and imaged by seismic reflection profiles. The Tarim basement is mostly buried beneath Neoproterozoic to Quaternary sediments (XJBGMR, 1993a; Jia, 1997; Zhang, 2003; Xu et al., 2014). It is widely known that the large-scale Permian magmatism marked by the large igneous province was the largest tectonic event in the Phanerozoic geological history of the Tarim Basin, covering an area >250,000 km2 (Yang et al., 1997; Xu et al., 2014). During this era, the Permian rocks outcropped as surface geology from the basin margins, and the drilled well cores in the basin are mainly composed of volcano-sedimentary sequences, including limestone, volcanic and related igneous rocks of 270∼300 Ma (Yang et al., 2007; Li et al., 2014; Xu et al., 2014). Owing to the far field effect of the Cenozoic India-Eurasia collision, the basement and Paleozoic strata are folded and faulted on a large scale, forming various E-W trending structural highs and lows (e.g., Jia, 1997), known geologically by uplift and depression, respectively (Figure 1B). According to Jia (1997), the basin-scale structure units have been preliminarily interpreted. With the enrichment of geophysical and borehole data in the 2000’s, the latest dividing scheme of structure units has been confirmed and prevails in the various literature. It is widely known that a Central Tarim Uplift extends nearly across the entire basin oriented from northwest to east, which includes the Bachu, Tazhong and southeastern Uplifts. The Central Tarim Uplift, approximately parallel to the Tabei Uplift in the North, has been surrounded by a series of depressions, such as the Kuche, Northern, Southwestern, Tanggu and southeastern Depressions (Figure 1B). Moreover, the modern Tarim Basin, termed the “walled basin” by Carroll et al. (2010), is surrounded by the Cenozoic uplift of mountain ranges such as the Tian Shan, West-Kunlun and Altyn and represents seismically active zones of rejuvenated intraplate deformation that began as early as the Permian (Hendrix et al., 1992; Carroll et al., 1995; Wartes et al., 2002). Modern seismicity in response to north-south shortening triggered by the ongoing collision between the Tibetan Plateau and the Indian subcontinent continues to be focused within the basin-bounding active mountain ranges, whereas the basin interiors are relatively aseismic and typically experiencing minor deformation (e.g., Zhang et al., 2013b) (Figure 1A).
Recent industrial and academic geophysical surveys in the Tarim Basin and surrounding areas, one of the best geophysically constrained areas within the Chinese continent, offer an ideal opportunity to better understand the basin subsurface strata and structure, especially the lithospheric structure, breaking the full coverage barrier of the Taklamagan desert (e.g., Kumar et al., 2005; An and Shi, 2006; Zhang et al., 2011; Teng et al., 2013; Teng et al., 2014). Wide-angle seismic profiles and high-resolution crustal thickness models have been presented (Teng et al., 2013; Teng et al., 2014). A high-resolution lithospheric structure imaged by Rayleigh-wave tomography was performed (Bao et al., 2015). Studies on the response of the lithosphere to tectonic processes, such as the thermal structure (Liu et al., 2016; Jiang et al., 2019) and effective elastic thickness (Chen et al., 2013), were developed. Furthermore, since the entire Tarim aeromagnetic survey was initiated in 1958, many surveys focusing on the Tarim Basin and its surrounding areas have been subsequently conducted to establish a structural framework to understand the hydrocarbon potential within this sedimentary basin (e.g., Wang et al., 2004; Xiong et al., 2013). However, studies based on large-scale magnetic data were overlooked and even neglected, and thus, the thermal structure of the overall basin and its environs is still loosely constrained overall based on CPD maps derived from low-resolution aeromagnetic data.
Data and Method
Magnetic Data
The total field magnetic anomaly data used in this study are based on a compilation provided by the China Aero Geophysics and Remote Sensing Center for Natural Resources (AGRS), an affiliate of the China Geological Survey, covering the northwestern China mainland from 35° to 43° N and from 72° to 93° E. These magnetic data were derived from 65 different airborne surveys during 1959 and 2004 with various parameters, including line spacings, altitude, reference fields and the data collection year. All data were adjusted to 1 km above Earth’s surface and sutured to be a continuous, merged dataset with a 1 km grid. A detailed description of these datasets, surveys and data processing methodology can be found in previous literature (e.g., Wang et al., 2004; Xiong et al., 2015). The EMAG2 (global Earth Magnetic Anomaly Grid) with a ∼3-km lateral resolution (Maus et al., 2009) has been used to fill the non-data areas, enlarging the broad domain of the data. It is extremely notable that there is a lack of aeromagnetic data or EMAG2 data in the SW corner of the study area. The two magnetic datasets were knitted together by the suture stitch method in Oasis Montaj software (Geosoft), and finally, a large-scale total field magnetic anomaly map was created (Figure 2A).
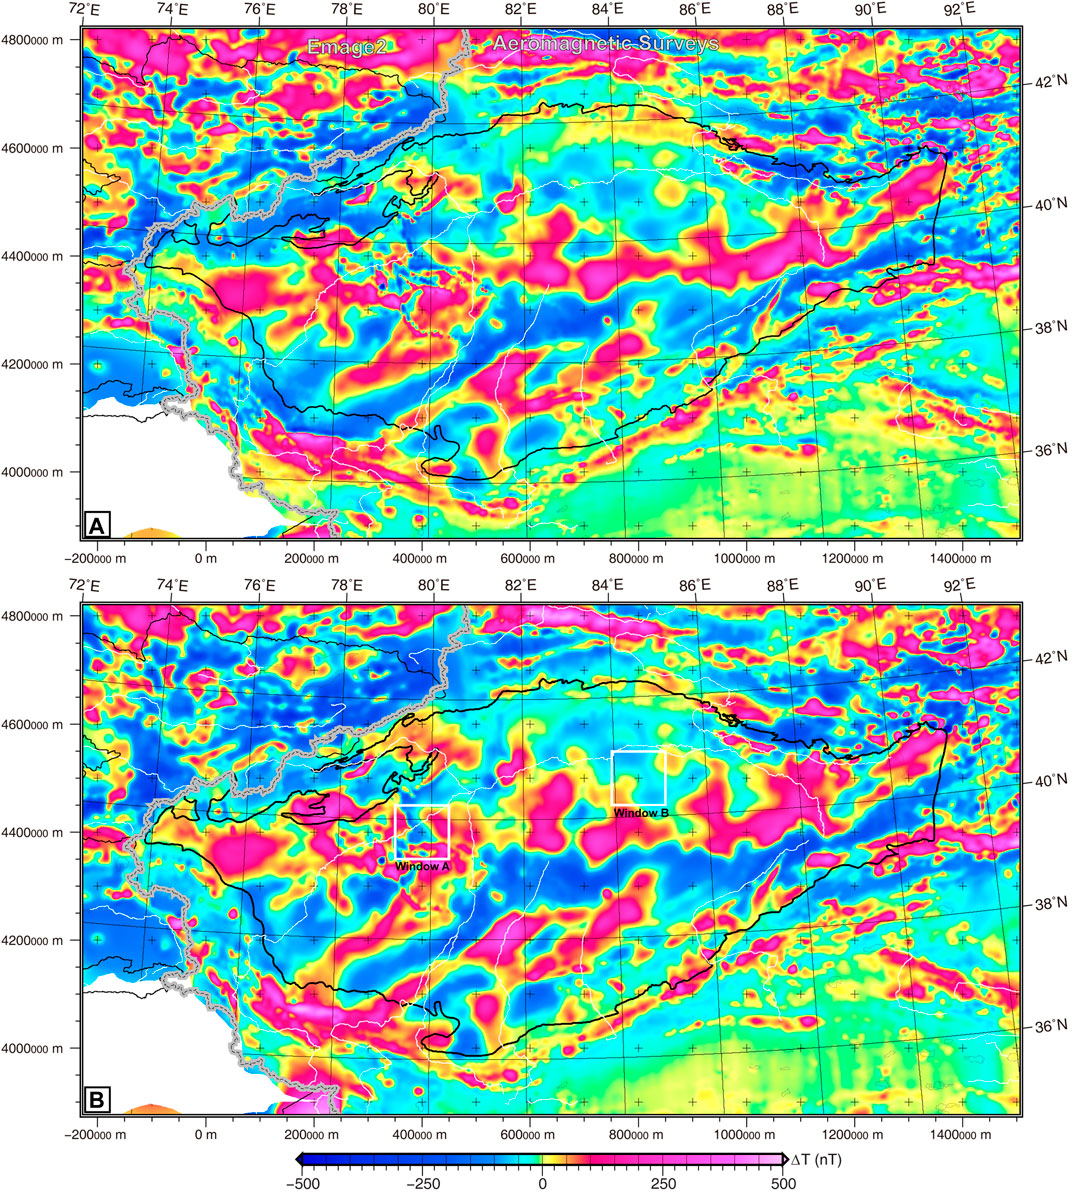
FIGURE 2. (A) Total-field magnetic anomalies dataset in the digital elevation model at an altitude of 1 km, comprising wholly aeromagnetic data within China (cell size, 1 km) and partly magnetic grids of EMAG2 (http://www.geomag.org/models/emag2.html) with ∼3-km resolution outside the dashed grey-black line. The black line outlines the Tarim Basin. (B) Magnetic anomaly map with reduction to the pole (RTP). White patches are the regions without magnetic data.
Such a merged dataset was projected to Ellipsoidal Transverse Mercator coordinates with the central meridian equal to 81°, which has been corrected from the International Geomagnetic Reference Field model by the reduction to pole (RTP) approach in the Geoprob software (http://www.agrs.cn/cgzt/xxcp/448.htm). As a result, the processed magnetic anomalies illustrate a slight northward shift in the RTP-corrected anomaly map (Figure 2B). To remove the effects of shallow magnetic bodies and to increase the accuracy of calculating the bottom depth of the magnetic layers, the aeromagnetic data were continued upward to a constant 4 km above the terrain, and these two data were gridded into 347 × 189 bins with equal sizes of 5 km × 5 km. Moreover, this process provides good consistency between the aeromagnetic and EMAG2 datasets. Due to the existence of long wavelength magnetic anomalies residing within the crust and contributed by the lithospheric mantle (Idoko et al., 2019), the resultant magnetic anomaly data used to estimate the CPD in this study is processed by first-order trend filtering.
Depth to the Bottom Boundary of the Magnetization Layer
Different techniques have been proposed to calculate the bottom of the magnetic sources (CPD), where the ferromagnetic rocks lost magnetization due to a Curie temperature of 580°C (853 K), which is found at the CPD and below this point, all rocks are nonmagnetic (Lanza and Meloni, 2006; Martos et al., 2017; Andrés et al., 2018); this provides an estimate of the magnetic Curie depth and hence the 580°C isotherm, with the Fourier spectral approach being the main tool.
The method of estimating the depth to centroid (Zc) of a parallelepiped constant magnetization was originally proposed by Bhattacharyya and Leu (1975) and further developed by Okubo et al. (1985) and Tanaka et al. (1999), assuming random magnetization and employing the logarithm of the Fourier power spectrum. Via the simplified calculus of Blakely (1995), the radial average power-density spectra of the total field magnetic anomaly have been formulated by Tanaka et al. (1999) as follows:
where k is the wavenumber in rad/km, A is a constant, and Zb and Zt are the depths to the bottom and top boundary of the magnetic layer, respectively. This equation was simplified as follows:
and
where
By fitting a straight regression at middle-low and low wavenumber parts of the radially averaged spectrum of
Assumptions and Limitations
Although the spectral analysis method has been successfully applied in many previous studies (i.e., Chiozzi et al., 2005; Maden, 2010; Bansal et al., 2011, 2013; Aboud and Ibrahim Selim, 2014; Hsieh et al., 2014; Bilim et al., 2016; Correa et al., 2016; Mickus and Hussein, 2016; Saada, 2016; Gailler et al., 2016) (Table 1), there are assumptions and limitations in computing the CPD that correspond to the behavior of the magnetization (random or fractal) and suitable window size, respectively. For instance, in East and Southeast Asia, Tanaka et al. (1999) divided the magnetic data into overlapping blocks with a window size of 200 km × 200 km. Chiozzi et al. (2005) divided Central-Southern Europe into subregions (320 km × 320 km) and estimated the power spectrum for each window. Bansal et al. (2011) mainly divided the study area into thirty-two square blocks with a 100 km × 100 km size in Germany, partly integrated with two 200 km × 200 km windows. Ravat et al. (2007) concluded that the largest possible size of the window may need to be up to 10 times the depth to the bottom. Additional cases about the selection of window size are presented in Table 1. It is certain that there are no unique criteria to determine the optimum size of the window, even though some authors used multiple window sizes to yield the average CPD variation (e.g., Wang and Li, 2015; Wang and Li, 2018). It is noted that there is a trade-off between windows large enough to encompass long-wavelength anomalies and those small enough to contour a detailed Curie surface plot. Selecting a window that is too small will miss the magnetic signal containing enough information from the deepest magnetization variations, whereas the spatial resolution of the CPD could decrease and the local depth anomalies may not be discernible because a window that was too large was selected. It was recently found in eastern Asia that varying window size has little effect on the estimated CPD but reforms its resolution (Li et al., 2010; Li et al., 2011). Furthermore, Gailler et al. (2016) systematically addressed the influence of window and cell size on Curie surface calculations, suggesting that the estimated CPD fluctuates slightly, but an overall tendency remains clearly preserved. According to Maus et al. (1999), a window with dimensions of 100 km × 100 km is large enough to calculate the depth to the average CPD, providing an overall uncertainty of approximately 5 km in CPD calculation, which is appropriate for our CPD estimation.
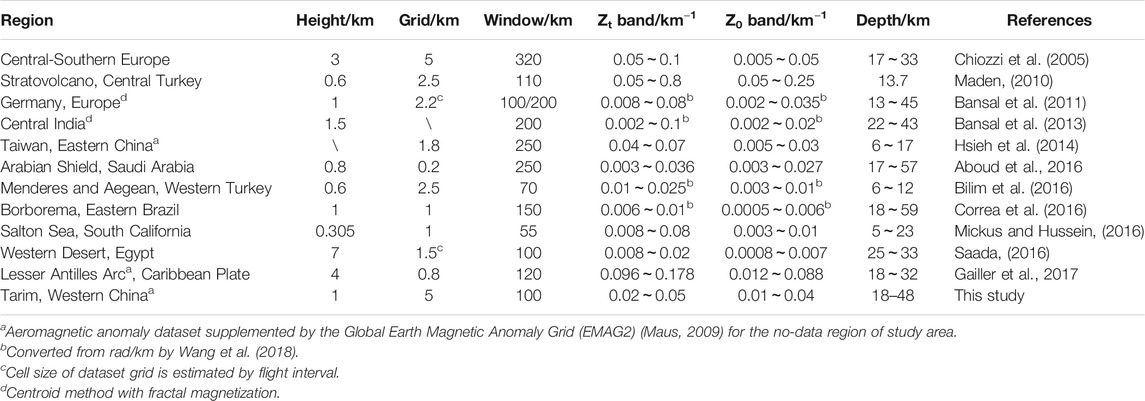
TABLE 1. Previous Curie-point depth estimations using the centroid approach based on aeromagnetic data.
We must keep in mind the assumptions of the spectral technique originally presented in Spector and Grant (1970) and all of its succedent variants (i.e., Okubo et al., 1985; Tanaka et al., 1999; Maus and Dimri, 1995; Bansal et al., 2011). The method of Tanaka et al. (1999), originally developed by Okubo et al. (1985), as used in this study, inherently assumes that the behavior of magnetization is completely random with an uncorrelated distribution of magnetic sources. In contrast, the spectral approach with the assumption of fractal magnetization has been widely applied in different publications (i.e., Maus and Dimri, 1995; Maus et al., 1997; Li et al., 2009; Bansal et al., 2011; Li et al., 2010; Li et al., 2011; Bansal et al., 2013). In this case, the amplitude spectrum of magnetization
CPD Estimation
To calculate the CPD and obtain a map of the spatial variation in the Curie surface, the corrected magnetic anomaly map of the entire study area, spanning approximately 2090 km in the E-W direction and 880 km in the N-S direction, was subdivided into a series of square subregions, corresponding to overlapping windows. A single Curie depth point is estimated from a spectral window (Figures 3A,B). Finally, the center of the window is moved for a specific distance each time until the calculations are repeated to cover the entire area (Figure 3C). Checking the window size and selecting the appropriate wavenumber range are superior to calculating the CPD for each window.
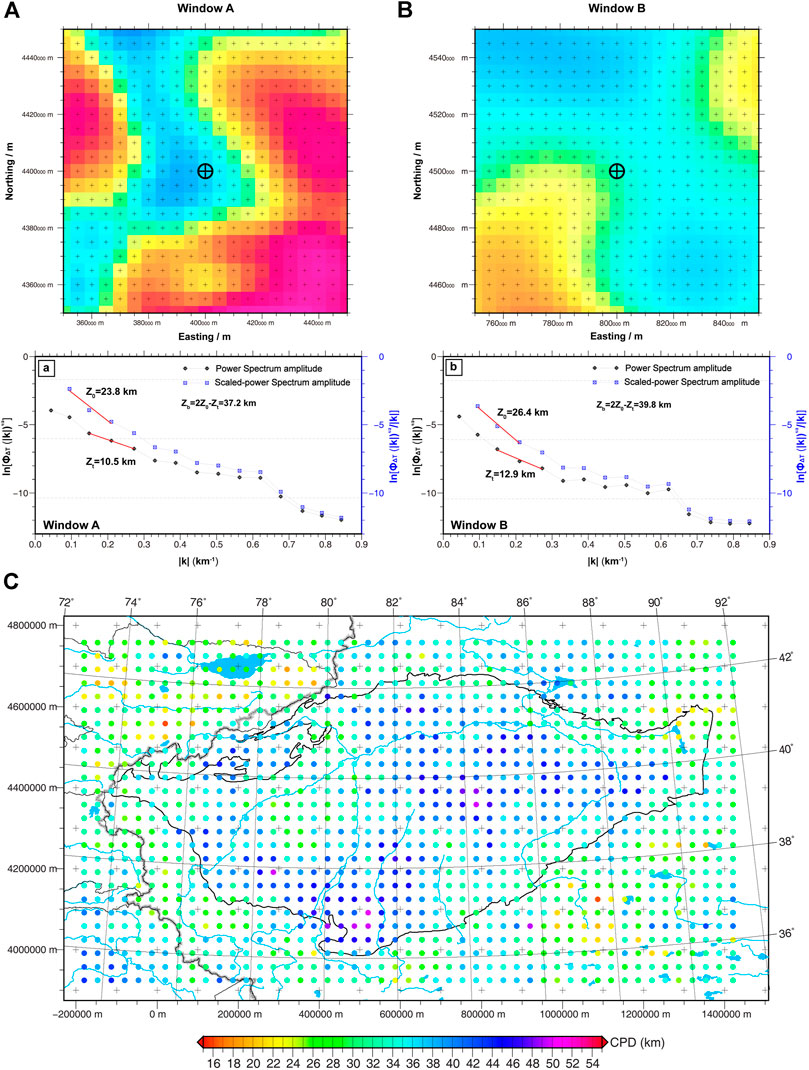
FIGURE 3. Examples of power spectrum amplitude for estimations of Curie depth using the 2D upward-continued magnetic anomaly data, covering the 100×100 km Curie-Zb calculation windows (A,B) centered on 400000 m/4400000 m and 800000 m/4500000 m, marked by black crosses with bounded black circles, respectively. The black crosses locate the center of each grid bin within 5×5 km (Panel A,B). According to Tanaka et al. (1999), Z0, Zt and Zb are defined as the centroid, the top and bottom depths for a selected grid with a size of 100×100 km (windows A,B), respectively. |k| is the wavenumber, and Ф△T(|k|)1/2 and [Ф△T(|k|)1/2]/|k| are the amplitude spectrum and scaled amplitude spectrum of the magnetic anomaly, respectively (Panel a,b). The corrected magnetic anomaly map of the whole study area has been subdivided into 1,274 estimated windows with a size of 100×100 km and a shift between windows of 33.33 km (C).
The window size determining the resolution of the estimated CPD is a critical parameter in the calculation of the bottom of the magnetic source because it constrains the wavelength that will be captured in the calculating window. Generally, a smaller window size is appropriately chosen in the volcanic or active areas marked by tectonic or geothermal geological processes since the Curie surfaces are expected to be shallow, whereas the windows with larger sizes could enhance the calculative stability and accuracy in tectonically stable geological environments (Li et al., 2009; Li et al., 2013). Empirically, windows ranging from 60 to 300 km have been studied and used by research pioneers (e.g., Maus, et al., 1997; Lin et al., 2005; Nuri et al., 2005; Ravat et la., 2007). After reviewing the literature, it is stated that there are no unique criteria to determine the optimum size of the window selected to estimate the CPD that is in a trade-off relationship with the spatial resolution of the CPD. Thus, we performed various tests using three different windows to calculate the depth to the bottom of the magnetization. The move step length in the CPD calculation with three windows of 100 × 100 km2, 120 × 120 km2, and 150 × 150 km2 are 33.33, 40 and 50 km, respectively, as shown in Figure 4. Although locally the CPD values may be different, these values demonstrate the same spatial trend: the high CPD appears in the stable domains marked by old cratonic basement, e.g., the Northern depression, Southwestern depression, and Tanggu depression, while the low CPD mainly corresponds to the orogenic or tectonic areas, e.g., the Bachu Uplift and Tian Shan and West-Kunlun orogenic belts. Clearly, a small window can effectively recover many short wavelength variations, such as the small-scale CPD variations in the Tarim Basin. In contrast, a large window can reliably recover the long wavelengths, whereas detailed local information marked by the short wavelengths is generally erased due to averaging. It should be noted that increasing the window size could ensure that the longest wavelengths are captured, but the resolution of the resulting Curie map has accordingly decreased. Moreover, the CPD values estimated with the 120 and 150 km windows are generally lower than those estimated with the 100 km window. However, the Curie surface variations from the 100 km window appear to be more consistent and reliable, not only due to perfectly random, normally distributed CPD values but also due to the spatial resolution. Therefore, we selected the window size of 100 km to estimate the depth to the bottom of the magnetization in this work, although several authors have taken the averaged CPD as the final illustrated results, which emerged by using different window sizes in previous literature (e.g., Wang and Li et al., 2015; Andrés et al., 2018).
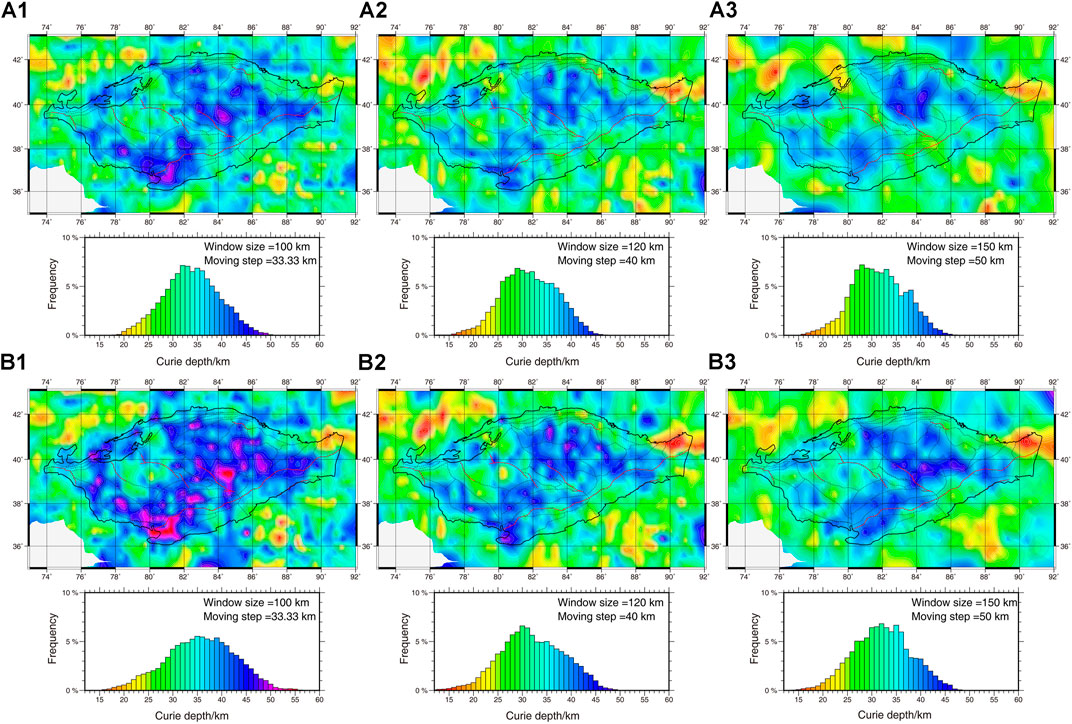
FIGURE 4. The spatial variations in the CPD over the Tarim Basin and surrounding areas using three different windows with two wavenumber bands selected for linear fitting by using least square method to calculate Zt and Z0: ca. 0.0237∼0.0334 and ca. 0.015∼0.033 km−1(A); ca. 0.0237∼0.0334 and ca. 0.0335∼0.0526 km−1(B), respectively. Window sizes: (1) 100×100 km2, (2) 120×120 km2, (3) 150×150 km2. The distributions of estimated CPD values from the centroid method in these tests have been plotted below the corresponding Curie surface illustrations.
There are no strongly reasonable criteria to select the wavenumber range to be used for the proper Z0 and Zt depths, as the depth to the bottom would vary laterally among the Tarim Craton and its surrounding orogenic belts. To select the optimal wavenumber ranges to recover the centroid (Z0) and top (Zt) depths, various tests were carried out, which is partly illustrated in Figure 4. The comparisons could provide reliable results. For example, two groups of wavenumber ranges have been evaluated in three different windows, showing that the CPD differences between the two series of wavenumber bands are remarkably expressed in the range of the CPD-value distribution (Figure 4), while the spatial variations present the same trend and consistency. Thus, considering the grid size used and the expected basal depth of the magnetic layers, which matches the results of previous studies (e.g., Li and Xu, 1999; Gao et al., 2015; Xiong et al., 2016; Li et al., 2016; Shi et al., 2018), both ranges between the upper and lower limit of wavenumber selected for straight-line fitting to calculate Zt and Z0 are specified as ca. 0.0237–0.0334 and ca. 0.015–0.033 km−1, respectively (Figure 4).
As mentioned above, the lateral variations in the CPD estimated by the moving windows are contoured and interpolated by the minimum curvature method (Briggs, 1974) and are illustrated in Figure 5D. It is pertinent to note that the CPD values in the southwestern corner of the map must be clipped due to the existence of a missing-data area and following an absurd continuous CPD interpolation for the data blank, reflecting the unreal characteristics of geological units.
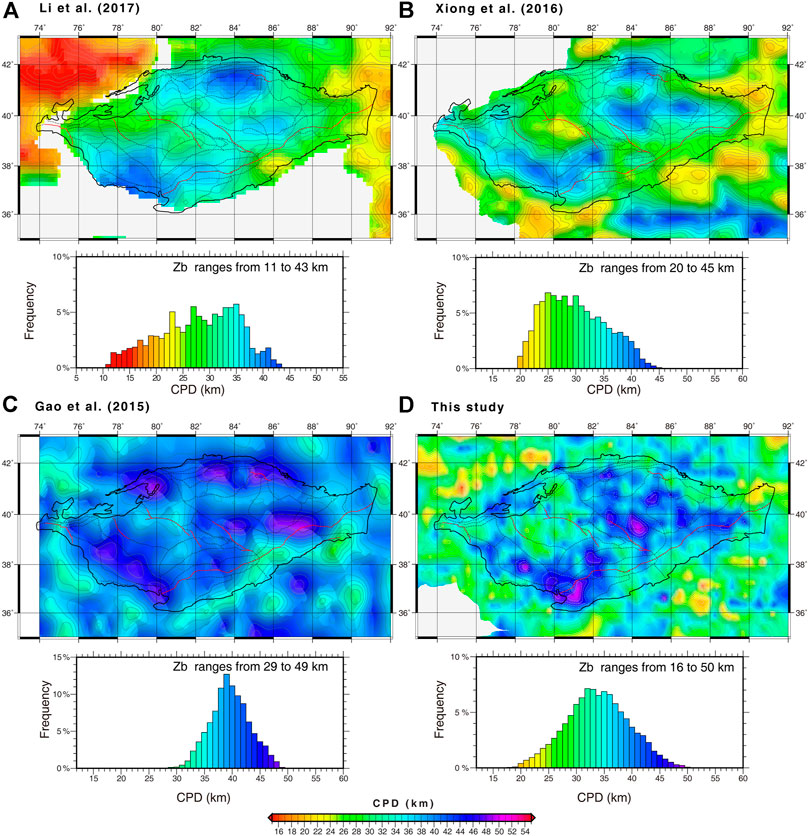
FIGURE 5. (A) Estimated CPD map of this study compared to the previous maps from (B)Li et al. (2017), (C)Xiong et al. (2016) and (D)Gao et al. (2015). The bold and dashed lines represent geologic units as shown in Figure 1. The histogram of CPD value has been plotted below the corresponding CPD map.
Results
Considering the Curie surface as an isotherm where rocks in a particular location reach their Curie temperature, the isotherm corresponds to the base of the magnetization estimated by the spectral approach of magnetic data, providing a link between magnetism and the thermal state of the lithosphere. In the Tarim Basin, the CPD calculated by the method presented in this paper is a surface located at depths between 20 and 50 km, with a median depth of 34 km, illustrating clear differences between within and outside basinal areas. Assuming that CPD is an isotherm, hot areas marked by shallow CPD and cold areas marked by deep CPD could be defined.
The NW Tarim domain, including the Bachu Uplift and Awati Depression, is obviously marked by a relatively shallow CPD, ranging between 24 and 32 km below topography. These shallow values extend to the area east of the Tanggu domain along an N-S orientation and reach the Altyn, being bounded by the deep CPD values, and extending westward to the westernmost end of the Tarim Basin. Northwestward of the western Tarim Basin, shallow values ranging from 34 km up to 20 km extend over the western Tian Shan and its environs, with the exception of the Issyk-Kul Lake domain characterized by high CPD values. A relatively deep (>5 km), NW-SE CPD zone is prominently located along the Kuluketage. Here, the geometry of the Curie surface follows the geometry of the Altyn-West-Kunlun orogenic system derived from the Tarim-Tibetan collision and continues to the Tian Shan. To the SE of the Altyn, in the northeastern Tibetan Plateau, the CPD decreases to more than 28 km. These shallow values are segmented by locally deep values. In the easternmost end of the Tarim Basin, minimum values appear locally over the NE basinal corner beside the Kuluketage (Figure 5).
In the interior of the Tarim Basin, deep CPD values (up to 50 km) appear widely over the Kuche, Northern, Tanggu, Southwestern and Tabei domains, with maximum values greater than 50 km. These deep values extend to the north, reaching Tian Shan and Kuluketage and reaching the interior of the NE southeastern domain to the east. A prominent feature is the deep, WS-NE CPD zone located between West Tian Shan and the Bachu domain. To the south of the Altyn, at the SE boundary of the Tarim Basin, the CPD values become shallower. In contrast, there is not a marked trend in the deep CPD values over the Tibetan Plateau, which are quite variable and locally distributed.
The pattern of the CPD variations in the Tarim Basin and its environs are in good agreement with the tectonic provinces. Obviously, the estimated results are also in good agreement with previous regional findings that the CPD of the old stable cratonic basin is much larger than that of the Phanerozoic tectonic orogens (e.g., Andrés et al., 2018). For the interior of the Tarim Basin, the estimated CPD spatial trend in this work agree well with those of previous studies (Li and Xu, 1999; Xiong et al., 2016; Gao et al., 2015; Li et al., 2016; Shi et al., 2018) but our CPD results exhibit remarkably greater detail (Figures 5A–C). In the spatial variations in particular, our CPD results are generally consistent with the Chinese mainland model of the Curie isotherm presented by Xiong et al. (2016) via the spectral method assuming random magnetization and in partial agreement with the global CPD model originated from Li et al. (2016), who used spectral analyses with a fractal magnetization, on account of the incomplete magnetic dataset with big data blank. However, with the comparison of CPD from Xiong et al. (2016) and Li et al. (2016) with our CPD estimation, the mean value of the misfit is 5 km with the CPD result presented here being deeper than that of Li et al. (2016) and Xiong et al. (2016); this finding presents the difference in the datasets used to estimate the CPD variation, such as the selection of β for the area, or the selection of wavenumber range or window size. Furthermore, it should be noted that previous studies suffer from low spatial resolutions, owing to the large geographic scale (Xiong et al., 2016) or relatively low resolution of satellite-derived magnetic data (Gao et al., 2015; Li et al., 2016; Shi et al., 2018) and the processing approach (Li and Xu, 1999).
Discussion
To interpret the spatial pattern and its tectonic significance in the CPD variation is the dominant objective. Our results exhibit great variability in the CPD, with a range from 20 to 50 km over the Tarim Basin and its environs, indicating different geological implications, such as the modification of crustal composition, thickness and structure, the change in the thermal field or crustal thermal structure and the effect of deep geological dynamics. Thus, the CPD variations are comprehensively compared with various geological and geophysical data to check the reliability of the CPD estimates and to evaluate the geological implication of the Curie surface.
Geothermal Structure of the Tarim Basin and Its Environs
As shown in Figure 6, the recently published surface heat flow in the Tarim and surrounding environs are sparsely and unevenly distributed with only 80 data numbers (Liu et al., 2016; Jiang et al., 2019). The newest updated heat flow map of continental China is presented by Jiang et al. (2019), which shows a referable spatial distribution of heat flow for this study area, although the heat flow data remain scarce. The first-order distribution pattern of heat flow exhibits extremely low heat flow in this study area, where the values range from 26.2 to 77.0 mWm−2 with a mean heat flow of 44.2 ± 9.9 mWm−2 (Liu et al., 2016; Jiang et al., 2019). A detailed description of the heat flow pattern in the study area can be found in Liu et al. (2016) and Jiang et al. (2019). The Curie surface is sensitive to the crustal composition and thickness, where the lateral variation could generate information about the thermal state of the crust. As presented in various studies, there are many similarities between heat flow and the Curie isotherm surface, which are considered to be inherent physical properties of magnetic minerals and could generally show an inverse relationship (e.g., Li et al., 2012b). The estimated CPD is correlated with heat flow, aiding in understand the crustal evolution and thereby the geological domains.
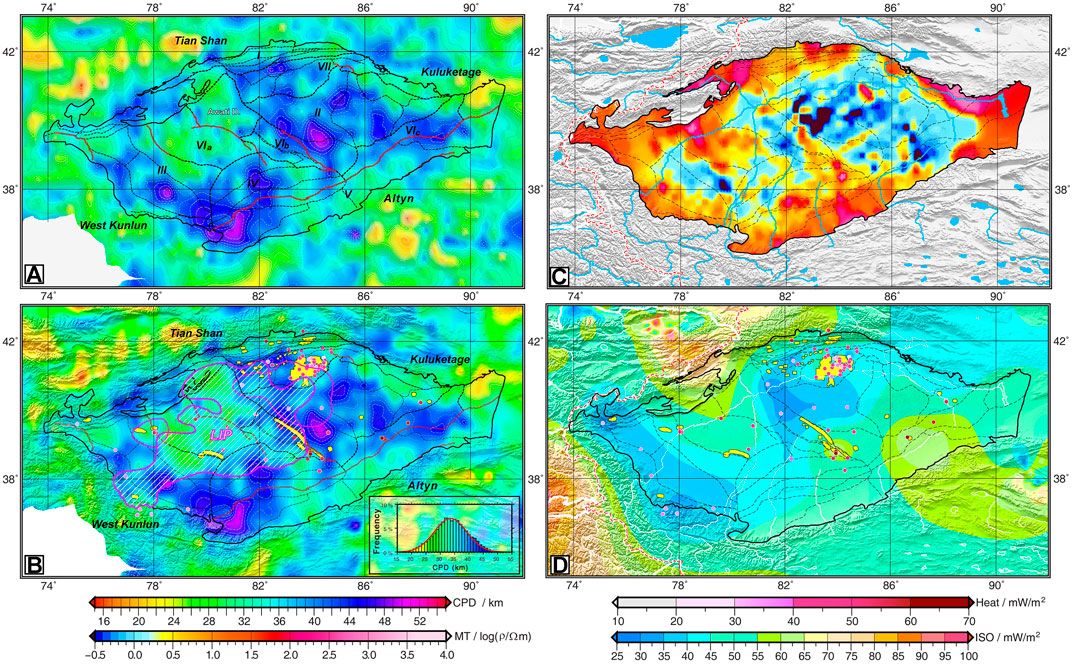
FIGURE 6. (A) Shaded Curie surface of Tarim Basin and its environs and (B) CPD lateral variation in the digital elevation model. The red lines are major faults within the basin. The purple line represents the Tarim Large Igneous Province (TLIP), modified from Yang et al. (2007). The Yellow patches are the oil and gas fields. Abbreviations are as follows: LIP, Large Igneous Province; Awati D., Awati Depression. The frequency histogram showing the variations in Curie depths with Gaussian distribution estimated by this study illustrated in the lower right corner of Figure B. The CPD map is overlain on the shaded ETOPO model. Note that the CPD values in the southwestern corner of the map must be clipped due to the existence of a missing-data area and following an unreasonable continuous CPD interpolation for the data blank, reflecting the unrealistic characteristics of geological units. (C) Spatial variations of electrical resistivity (MT) at 2 km depth overlay on the digital elevation model within the Tarim Basin, originated from Yang et al. (2015). (D) Isogram of heat flow (ISO) in the elevation model in the Tarim Basin and its environs, derived from Jiang et al. (2019). The colored circles (Heat) distributed on the map are newest measured heat flow points, compiled from Jiang et al. (2019).
In the interior of the Tarim Craton, the central-northern and northeastern areas cover the Kuche and Northern depressions and the Tabei uplift (Figure 6A), exhibiting an extremely deep Curie surface (up to 50 km) associated with low heat flow. According to Xu et al. (2014), these regions are floored with supracrustal and Archean to Paleoproterozoic basement and covered by a large Phanerozoic cover, suggesting that there are no significant lithospheric dynamics compared to the other regions. This Curie pattern is confirmed by magnetotelluric investigation (Zhang et al., 2012; Yang et al., 2015) because the majority of domains have low resistivity (low heat flow), while the electrical resistivity increases toward the southeastern depression and Bachu Uplift (Yang et al., 2015; Zhang et al., 2020), which is associated with an increase in heat flow (Figures 4B, 5B). In the central-western domain covering the Bachu Uplift, the Curie depth varies from 20 to 32 km, while the heat flow has been confirmed by the variation of 50–65 mW/m2 (Figure 6B). There is a high electrical resistivity anomaly (high heat flow) (Figure 6C). This combination of different geophysical signatures indicates the presence of differences in crustal compositions. It is one of the regions with Permian volcanism characterized by the large igneous provinces (Yang et al., 2007; Xu et al., 2021) (Figure 6B), which could be expected to modify the crustal composition and thermal structures, which was previously found by seismic tomography (Yang et al., 2015). Compared with the central-western domain, the southwestern domain corresponding to the southwestern depression shows a NW-trending high CPD zone with a low CPD patch in the central (Figure 6A). A high correlation was observed with low heat flow (35–40 mW/m2) and electrical resistivity [−0.5–0.2 log (ρ/Ωm)]. In the southeastern portion of the Tarim Basin, the domain has a shallow Curie surface with depths of less than 30 km and high associated heat flow and electrical resistivity. In the NW Tarim Basin, both the CPD and heat flow show relatively similar patterns with large lateral variations in values, suggesting high complexity in the composition and thickness. This domain is marked by intercontinental active belts that have been repeatedly modified by large crustal deformations and mantle dynamics. Obviously, to the southwest and southeast, the same correlation was observed for the shallow Curie surface, which corresponds to high heat flow. To the northeast, although there are some poor correlations mainly due to the scarcity and limited resolution of heat flow data, similar variations have been partly exhibited, such as the inverse relationship between heat flow and Curie depth (Figures 6B,D).
The CPD associated with surface heat flow measurements could provide a well-constrained first-order regional crustal and lithospheric geothermal structure (e.g., Tanaka et al., 1999; Li et al., 2011; Li et al., 2012a). To better understand the correlation between surface heat flow (qs) and CPD in the Tarim Basin, observed heat flow data have been statistically fitted to various kinds of theoretical curves to further deduce the geothermal physical parameters. The 80 surface heat flow points varying from 31.4 to 77 mW/m2 are compiled from the published literature (Liu et al., 2016; Jiang et al., 2019), and the corresponding Curie Zb values have been extracted. The correlated plot of the CPD and surface heat flow points (qs) is illustrated in Figure 7. Assuming vertical thermal conduction only and taking the temperature at the Curie surface as a boundary condition, from the 1D steady heat conduction equation, the CPD (Zb) and surface heat flow (qs) can be related by the following equation (Maul et al., 2005; Li, 2011; Li et al., 2012b):
where k is the bulk average vertical thermal conductivity for the magnetic layer, H0 is the heat production rate at the surface, hr is the characteristic drop-off in heat production, and T0 and Tc are the temperature at the surface elevation Z0 and Curie surface Zb, respectively.
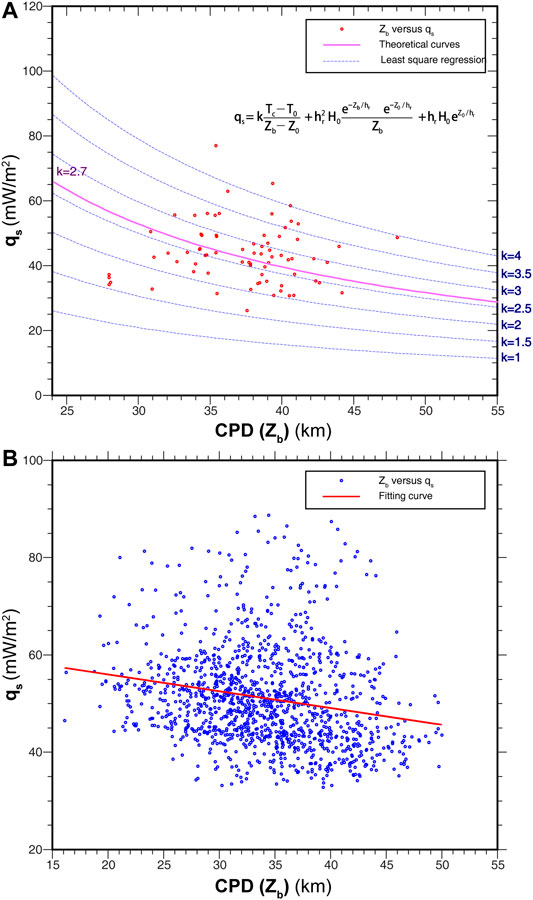
FIGURE 7. (A) Inverse correlation between Curie Zb and surface heat flow points qs. Blue dashed curves are theoretical predictions with different thermal conductivities. Solid pink curve is the optimal fitting model (in the least-squares sense) for heat flow, which gives k=2.7 W/(m°C), H0=3 μW/m3, and Hr=10 km. (B) The Curie depth points estimated from 1,274 moving windows and the corresponding points of heat flow. The solid red line is the linear trends of correlations between Curie Zb and surface heat flow points qs.
As expressed in Eq. 5, a nonlinear inverse correlation exists between the heat flow and Curie depths. Now, assuming that T0, Tc, H0, and hr are 0°C, 580°C, 3.0 μW/m3, and 10.0 km, respectively, which are within the ranges of commonly applied values (Turcotte and Schubert, 2002a; Stuwe, 2002), most surface heat flow (qs) and Curie Zb points are clustered between the two theoretical curves at 1.5 and 4 W/(m°C). By performing a nonlinear least-squares inversion on the data points in Figure 7A, the optimal value of bulk average vertical thermal conductivity (k) is estimated to be 2.7 W/(m°C). It should be mentioned that Eq. 5 and Figure 7 show that the surface heat flow (qs) is more sensitive to the conductivity value (k) than parameters H0 and hr in relation to the diverse geological settings. On a regional scale, the surface heat flow trend is modulated more by deep conductive contributions than by crustal radioactive contributions (Figure 7B). The former contribution is represented by the first term on the right-hand side of Eq. 5, while the latter corresponds to the last two terms.
Correlations Between Curie Surface and Intraplate Seismicity
Geologically, the Tarim Basin is a rigid craton bounded by active young orogens, such as the curved Tian Shan to the north and the West-Kunlun-Altyn to the south (e.g., Xu et al., 2011). It is a prominent feature that the majority of earthquakes are generated not within the Tarim Basin interior but in the orogens surrounding the basin. The causes of these seismic activities have been of widespread focus and interpreted in previous studies based on different hypotheses, and it has been argued that the earthquakes are located in weak tectonic zones of crust or that they are primarily distributed in regions with stress concentrations (Wittlinger et al., 2004; Gatinsky et al., 2011; Zhang et al., 2013a).
As shown in Figure 8, these craton-bounding orogens with many active thrust and strike-slip faults exhibit high concentrations of earthquakes, which as inferred from GPS observations, absorb most of the deformations and stress from the convergence of the India plate with the Tibetan Plateau (Wang et al., 2016; Zheng et al., 2017). While the crustal material moves northward with velocity roughly decreasing northward (Figure 8), an abnormally high seismic energy release (M > 5) occurs through intensive displacements along strike-slips and thrusts generated from the collision processes (Gatinsky et al., 2011). For example, in the orogenic belts near the Keping (Figure 8 AA′), Kuche (Figure 8 BB′) and northeastern Tabei domains (Figure 8 CC′), the majority of earthquakes occur in the transition zones of the Curie surface, especially the sharp CPD gradient zones. Furthermore, within the tectonically stable areas, it is interesting to note that nearly all of the earthquakes occurred not in the central part of the CPD gradient zone but within the area with the lowest offset between the Curie and Moho depths (Figure 8 AA′), although there are many transition zones. It is notable that so many strong earthquakes took place in Jiashi region and its surrounding domains (e.g., Yao et al., 2021), northwestern Tarim, marked by lowest Curie-Moho offset (Figure 8 AA′). To interpret the origin of such Jiashi strong earthquake sequence, the Curie-Moho offset is eligible to be a valuable indicator of crustal stability in the cratonic continent, except strong northward movement (high northward GPS velocity) (Figure 8 AA′), and could be further used to assess the potential earthquake hazards.
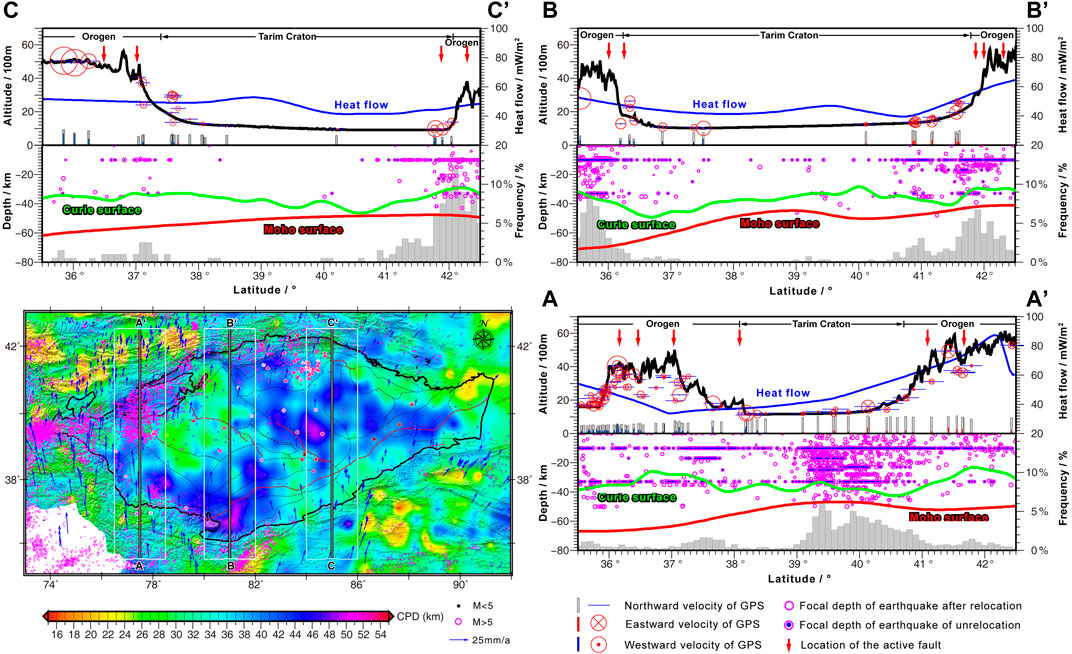
FIGURE 8. Interpreted transects AA’, BB’, and CC’ crossing the Tarim Basin and active orogenic belts. In the inset, the black and purple circles are earthquakes originated from ISC (http://www.isc.ac.uk/). The blue arrows represent GPS velocities relative to Siberia (Zheng et al., 2017). In the sections, the thick solid blue and green curves show the Curie surface and Moho surface (Figure 9B; Teng et al., 2014), respectively, and black curves are the topographic relief. The purple circles are earthquakes with focal depths after relocation. In contrast, the blue circles are earthquakes with focal depths of non-relocation. The probability plots of earthquakes in the Tarim Basin and its environs are exhibited in the sections. The red arrows represent the locations of active faults in the orogenic belts. The northward and eastward or westward velocities of GPS are marked by horizontal bars and circles with a fork or point in the center, respectively. The velocities of GPS in the sections are proportional to the size of labels.
In contrast, among the actively orogenic areas, the western Tian Shan and West-Kunlun orogenic belts present the highest offset between the CPD and Moho depths, as deep crustal roots have been proposed for both orogens, generating a large amount of earthquakes, much more than that of the Tarim Basin interior. This observation may imply that the correlation between the CPD and Moho depths will be crucial to understand the likelihood of earthquake generation and thus establish the tectonic settings where the earthquakes may occur. Tectonically, it has been interpreted that because the orogenic lithosphere located between rigid blocks experiences strong compression, marked by horizontal shortening-thickening and lithosphere heterogeneity, this result in low mechanical strength and consequent high active seismicity (Figure 8). Neil and Houseman (1997) proposed a simplified rheological model for the Tarim Basin and Tian Shan where the lithospheric temperature may positively affect the mechanical strength of the lithosphere. As dominated by the thermal state and structure, the lateral variation in crustal rheology structure may provide crucial constraints on understanding the intra- or inter-block deformation mechanism (Neil and Houseman, 1997; Zhang et al., 2013b), which can be expressed by the CPD and Curie/Moho offset that alter the crust-scale thermal regime and compositional structure (Figure 8).
Thereby, it is revealed that the craton is distributed by extremely high CPD (up to 50 km) and consequently by high mechanical strength. It is also extremely resistant to deformation, while, due to weakened tectonic essence and repeating orogeny, these young Phanerozoic orogens with intrinsically low mechanical strength are mainly characterized by CPD transition zones. Obviously, the latter make the crust more susceptible to generate earthquake than the former (Figure 8). As discussed above, an interpretation model could be proposed where the CPD is integrated with Moho depth and surface geological tectonics to assess the likelihood of earthquake generation. It is noted that earthquakes are generally concentrated in the CPD transition zones, especially sharp gradient regions, between hot and cold terrains, which suggests that the crustal rheology structure indicated by the crustal thermal structure acts as a secondary mechanism for the intra-continental seismicity compared with tectonic stress located on active faults.
Implications for the Plume-Lithosphere Interaction, Mineral and Hydrocarbon Systems
The CPD lateral variation at the base of the magnetic layer shows a heterogeneous feature throughout the Tarim Basin. A notable characteristic is the elongated large low-CPD region across the NW Tarim portion, which presents the minimum values for the entire basin. The CPD decreases significantly from 50 km to 20–30 km (Figure 9A). Moreover, the geometry of the maximum CPD/Moho depth offset (up to 20 km) presents a similar feature (Figure 9C). Compared with the NW Tarim Basin, corresponding to the Bachu domain and its envisons such as the Awati, the overall deeper CPD values (up to 50 km) prevail over the other parts of the Tarim Basin. This may imply that the area marked by overall high CPD values would be relatively stable, while the Archean lithosphere characterized by low CPD values, could be modified. The modification within the Tarim Basin occurs locally. There is a straightforward correlation between the shallow CPD zone and the area occupied by mafic-rock outcrops (e.g., Yang et al., 1996; Chen et al., 1997). Accordingly, we propose that this minimum geometry coincides with the position of the Tarim Large Igneous Province (TLIP) and the plume head (e.g., Yang et al., 1996; Yang et al., 2005; Chen et al., 1997; Li et al., 2008, Li et al., 2012a; Zhang et al., 2018; Xu et al., 2014; Xu et al., 2021), as shown in Figures 2B and 9C for a comparison of the short-wavelength magnetic anomaly and geology. With no significant posterior thermal events identified in this volcanic region, the massive magmatism event owing to plume-related volcanism during the Early Permian (270–300 Ma) may play a crucial role in the CPD signature within the Tarim Basin. The Tarim plume-lithosphere interaction will also be responsible for the configuration of the TLIP, expressed by a series of tectonic processes, including upwelling of the asthenosphere, crustal melting and magmatic eruption, followed by thermal relaxation (e.g., Xu et al., 2014; Xu et al., 2021). Furthermore, this proposed interpretation agrees well with the high heat flow observations (Liu et al., 2016; Jiang et al., 2019) and modified crust imaged by seismic tomography and deep seismic sounding profiles (Teng et al., 2013; Teng et al., 2014; Yang et al., 2015).
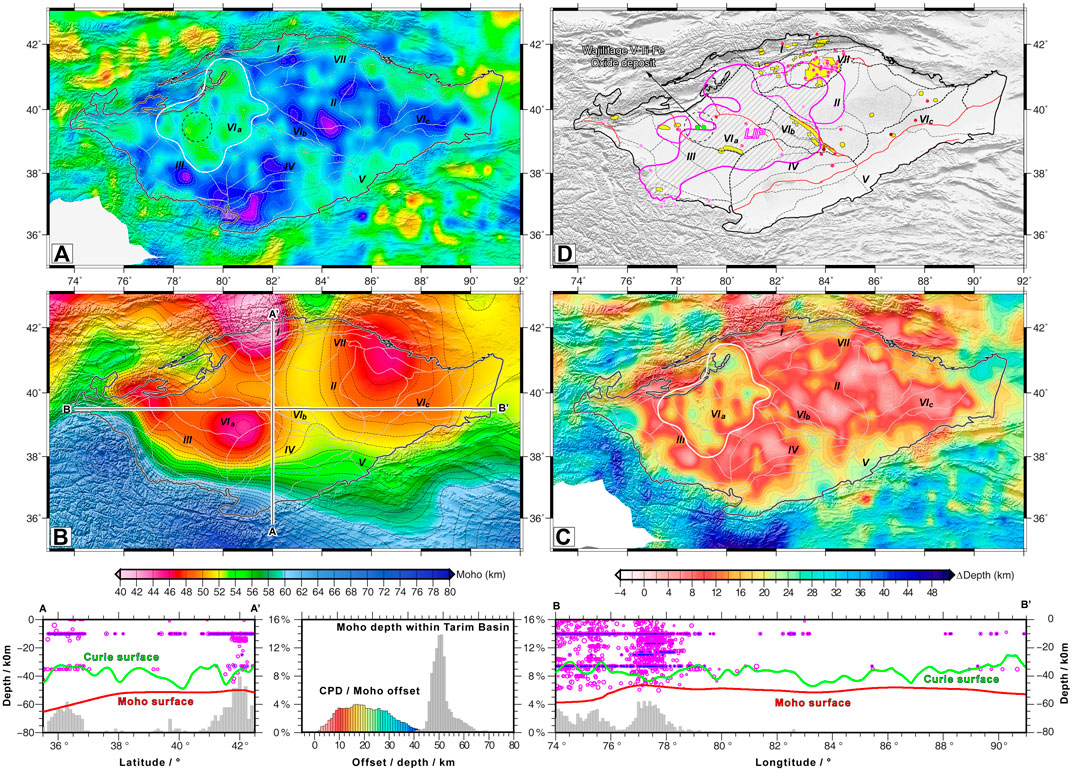
FIGURE 9. (A) Spatial variations in the CPD map in the digital elevation model. (B) Moho map (crustal thickness, CT), compiled from the datasets from Teng et al. (2014). The distribution of Moho depth values within the Tarim Basin are plotted below the corresponding Moho illustration. Transects AA’ and BB’ cross the Tarim Basin longitudinally and latitudinally, respectively. In the sections, the purple circles are earthquakes originated from ISC (http://www.isc.ac.uk/), the thick solid red curve shows the Curie depth, and thick green curve is the Moho depth. The purple circles are earthquakes with focal depths after relocation. In contrast, the blue circles are earthquakes with focal depths of non-relocation. The probability plots of earthquakes in the Tarim Basin and its environs are exhibited in the sections. (C) Curie-Moho Depth offset, with the distribution of these offsets illustrated below. (D) The tectonic and oil-and-gas-field maps. The legends are same as in Figure 1B. The solid, thick white curve in Panel A,C presents the regions marked by minimum values. The black dotted circle denotes the low-CPD path, corresponding to the Wajilitage V-Ti-Fe oxide deposit.
Investigations into the plume-lithosphere interaction will provide information regarding the vertical transfer of mantle materials and heat (Xu et al., 2014; Xu et al., 2021). As a result of the volcanism following with mantle upwelling, the Wajilitage V-Ti-Fe oxide deposit occurred in the central-western portion of the TLIP (e.g., Li Z. et al., 2012), showing a particularly good correspondence to a relatively low CPD patch (Figure 9D). This observation indicates a potential positive correlation between the occurrence of oxide deposits and low CPD around the TLIP. Interestingly, there is another exceedingly low CPD patch in the northeastern corner of the Tarim Basin. Moreover, this patch was determined to be Carboniferous and Permian igneous rock in the outcrops (Figure 1B).
As the largest sedimentary basin in China, the Tarim Basin has continued to receive a wide international focus for research since the discoveries of various oil-gas fields in the 20th century (e.g., Chen and Dickinson, 1986; Carroll et al., 2010). A notable phenomenon observed in the Tarim Basin is that the oil and gas provinces prevail over the regions with relatively high CPD values (Figures 6D, 9D), which is completely opposite to the mineral deposits characterized by notably shallow Curie surfaces. To optimally trace the cause of this obvious configuration, the abnormally high thermal flow followed with volcanic fluids was transmitted from the upper mantle to the upper crust and synchronously destroyed the hydrocarbon system, especially the existing source rock and petroleum reservoirs. Moreover, this interpretation has been corroborated by finite element thermal modeling for the Tarim Basin (Wang et al., 2018). However, there are three oil and gas fields distributed around the Bachu Uplift (low CPD) corresponding to the location of Tarim plume head (Figure 6B) (Xu et al., 2021). The plume-related thermal process would contribute to the thermal maturity of source rocks. Thus, the plume-related thermal effect on the hydrocarbon formation (destructed vs. facilitated) should be further revaluated, integrated with the detailed information of petroleum geology. As discussed above, the abnormal Curie depth point could be utilized as a potentially powerful proxy for identifying the mineral systems and indicating non-potential hydrocarbon provinces. The major crustal-scale modification originating from deep geological process, such as plume-lithosphere interaction, would be the predominant conduits for mineralization and thermal fluids to reach the upper crust, consequently forming mineral deposits and destroying the petroleum systems, respectively, which would show a variation in thermal state (Korsch and Doublier, 2016).
Conclusion
The centroid method based on the radially averaged amplitude spectrum has been applied to image high-resolution CPD map beneath the Tarim Basin and its surrounding areas. The newest high-resolution aeromagnetic dataset of the Chinese mainland acquired over the past 60 decades was used, and the no-data area corresponding to the abroad domain was enlarged by the EMAG2.
These new generation high-resolution magnetic datasets have been processed by RTP and upward continuation, which are used to accurately correct the locations of magnetic anomalies over corresponding causative bodies and eliminate the effect of shallow magnetic sources for CPD estimation, respectively. The processed magnetic dataset resampled to a 5 km × 5 km grid interval is carried out on the continuous upward magnetic map at 4 km to estimate the Curie surface. The calculated CPD variation from 20 to 50 km reveals complex deep crustal structures and compositions in the Tarim Basin and its environs. A large CPD up to 50 km dominates the majority of domains in the Tarim Basin, representing the remarkably stable tectonic regions floored by an intact Precambrian crystalline basement. Small CPD values of ca. 22–28 km are found separately, scattered and focally in the Tarim Basin, especially in its central-western domain, characterized by the Bachu Uplift, which was an area of strong plume-lithosphere interaction during the Late Permian. By integrating and correlating the Curie surface with the surface heat flow, an inverse correlation has been found, and via the 1D steady-state heat conduction algorithm, a bulk average vertical thermal conductivity has also been fitted for the crustal magnetic layer to obtain good alternative constraints on the crustal thermal structure.
Furthermore, the spatial distribution of CPD is eligible to serve as a potential guide to assess and choose the key regions of mineral and hydrocarbon exploration. Earthquakes in the Tarim Basin and its surrounding areas are mainly concentrated in Curie surface transition regions, where the stress field will be enlarged by the thermal stress triggered by the heat difference, which is exerted as a secondary mechanism of earthquake generation. The Curie surface imaged by high-resolution aeromagnetic anomaly data should be an important proxy in geological research. For more implications and details, further studies are required in the future.
Data Availability Statement
The raw data supporting the conclusion of this article will be made available by the authors, without undue reservation.
Author Contributions
XX and SX conceived the study, processed and interpreted the research data; XX wrote and edited the manuscript; AT checked the manuscript and geological interpretation; Other co-authors jointly modified the manuscript; SX oversaw this study.
Funding
All sources of funding received for the research being submitted. This research was funded by the Key Laboratory of Airborne Geophysics and Remote Sensing Geology Ministry of Natural Resources (2020YFL13), National Science Foundation of China (41902202), China Postdoctoral Science Foundation (2019M652062), and Geological Survey Project of China (DD20211396, 1212011087009, 121201003000172001).
Conflict of Interest
The authors declare that the research was conducted in the absence of any commercial or financial relationships that could be construed as a potential conflict of interest.
Publisher’s Note
All claims expressed in this article are solely those of the authors and do not necessarily represent those of their affiliated organizations, or those of the publisher, the editors and the reviewers. Any product that may be evaluated in this article, or claim that may be made by its manufacturer, is not guaranteed or endorsed by the publisher.
Acknowledgments
We thank all the coworkers at the China Aero Geophysical survey and Remote Sensing Center for Natural Resources (AGRS), China Geological Survey, for aeromagnetic surveys in the Tarim Basin and its environs. We are very grateful to Dr. Jiao Liguo for technical help and advice. Data processing and plot illustrating were supported by GMT software (Wessel and Smith, 1998).
References
Aboud, E., and Ibrahim Selim, ES. (2014). Application of spectral analysis technique on ground magnetic data to calculate the Curie depth point of the eastern shore of the Gulf of Suez, Egypt. Arabian Journal of Geosciences 7, 1749–1762. doi:10.1007/s12517-013-0868-7
Afonso, J. C., Ranalli, G., and Fernàndez, M. (2005). Thermal expansivity and elastic properties of the lithospheric mantle: results from mineral physics of composites. Physics of the Earth and Planetary Interiors 149, 279–306. doi:10.1016/j.pepi.2004.10.003
Allen, M. B., Vincent, S. J., and Wheeler, P. J. (1999). Late Cenozoic tectonics of the Kepingtage thrust zone: interactions of the Tien Shan and Tarim Basin, northwest China. Tectonics 18, 639–654. doi:10.1029/1999tc900019
An, M., and Shi, Y. (2006). Lithospheric thickness of the Chinese continent. Physics of the Earth and Planetary Interiors 159, 257–266. doi:10.1016/j.pepi.2006.08.002
Andrés, J., Marzán, I., Ayarza, P., Martí, D., Palomeras, I., Torné, M., Campbell, S., and Carbonell, R. (2018). Curie point depth of the Iberian Peninsula and surrounding margins. A thermal and tectonic perspective of its evolution. J. Geophys. Res. Solid Earth 123, 2049–2068. doi:10.1002/2017jb014994
Bansal, A. R., Anand, S. P., Rajaram, M., Rao, V. K., and Dimri, V. P. (2013). Depth to the bottom of magnetic sources (DBMS) from aeromagnetic data of Central India using modified centroid method for fractal distribution of sources. Tectonophysics 603, 155–161. doi:10.1016/j.tecto.2013.05.024
Bansal, A. R., Gabriel, G., Dimri, V. P., and Krawczyk, C. M. (2011). Estimation of depth to the bottom of magnetic sources by a modified centroid method for fractal distribution of sources: An application to aeromagnetic data in Germany. Geophysics 76, L11–L22. doi:10.1190/1.3560017
Bao, X., Song, X., and Li, J. (2015). High-resolution lithospheric structure beneath Mainland China from ambient noise and earthquake surface-wave tomography. Earth and Planetary Science Letters 417, 132–141. doi:10.1016/j.epsl.2015.02.024
Bhattacharyya, B. K., and Leu, L.-K. (1975). Analysis of magnetic anomalies over Yellowstone National Park: mapping of Curie point isothermal surface for geothermal reconnaissance. J. Geophys. Res. 80, 4461–4465. doi:10.1029/jb080i032p04461
Bi, H., Wang, Z., Wang, Y., and Zhu, X. (1999). History of tectono-magmatic evolution in the Western Kunlun Orogen. Sci. China Ser. D-Earth Sci. 42, 604–619. doi:10.1007/bf02877788
Bilim, F., Akay, T., Aydemir, A., and Kosaroglu, S. (2016). Curie point depth, heat-flow and radiogenic heat production deduced from the spectral analysis of the aeromagnetic Data for Geothermal Investigation on the Menderes Massif and the Aegean Region, Western Turkey. Geothermics 60, 44–57. doi:10.1016/j.geothermics.2015.12.002
Blakely, R. J. (1995). Potential Theory in Gravity and Magnetic Applications. Alustralia: Cambridge University Press. doi:10.1017/cbo9780511549816
Bouligand, C., Glen, J. M., and Blakely, R. J. (2009). Mapping Curie Temperature Depth in the Western United States with a Fractal Model for Crustal Magnetization. J. Geophys. Res. Solid Earth 114. doi:10.1029/2009jb006494
Briggs, I. C. (1974). Machine Contouring Using Minimum Curvature. Geophysics 39, 39–48. doi:10.1190/1.1440410
Carroll, A. R., Graham, S. A., Hendrix, M. S., Ying, D., and Zhou, D. (1995). Late Paleozoic Tectonic Amalgamation of Northwestern China: Sedimentary Record of the Northern Tarim, Northwestern Turpan, and Southern Junggar Basins. Geol. Soc. America Bull. 107, 571–594. doi:10.1130/0016-7606(1995)107<0571:lptaon>2.3.co;2
Carroll, A. R., Graham, S. A., and Smith, M. E. (2010). Walled Sedimentary Basins of China. Basin Res. 22, 17–32. doi:10.1111/j.1365-2117.2009.00458.x
Charvet, J., Shu, L., Laurent-Charvet, S., Wang, B., Faure, M., Cluzel, D., et al. (2011). Palaeozoic Tectonic Evolution of the Tianshan belt, NW China. Sci. China Earth Sci. 54, 166–184. doi:10.1007/s11430-010-4138-1
Chen, B., Chen, C., Kaban, M. K., Du, J., Liang, Q., and Thomas, M. (2013). Variations of the Effective Elastic Thickness over China and Surroundings and Their Relation to the Lithosphere Dynamics. Earth Planet. Sci. Lett. 363, 61–72. doi:10.1016/j.epsl.2012.12.022
Chen, H., Yang, S., Dong, C., Jia, C., Wei, G., and Wang, Z. (1997). The Discovery of Early Permian Basic Rock belt in the Tarim basin and its Tectonic Meaning. Geochemica 26, 77–87. (in Chinese with English abstract).
Chen, Q., and Dickinson, W. R. (1986). Contrasting Nature of Petroliferous Mesozoic-Cenozoic Basins in Eastern and Western China. AAPG Bull. 70, 263–275.
Chiozzi, P., Matsushima, J., Okubo, Y., Pasquale, V., and Verdoya, M. (2005). Curie-point Depth from Spectral Analysis of Magnetic Data in central-southern Europe. Phys. Earth Planet. Interiors 152, 267–276. doi:10.1016/j.pepi.2005.04.005
Correa, R. T., Vidotti, R. M., and Oksum, E. (2016). Curie Surface of Borborema Province, Brazil. Tectonophysics 679, 73–87. doi:10.1016/j.tecto.2016.04.037
Davies, J. H. (2013). Global Map of Solid Earth Surface Heat Flow. Geochem. Geophys. Geosyst. 14, 4608–4622. doi:10.1002/ggge.20271
Frost, B. R., and Shive, P. N. (1986). Magnetic Mineralogy of the Lower continental Crust. J. Geophys. Res. 91, 6513–6521. doi:10.1029/jb091ib06p06513
Gailler, L.-S., Lénat, J.-F., and Blakely, R. J. (2016). Depth to Curie temperature or bottom of the magnetic sources in the volcanic zone of la Réunion hot spot. J. Volcanology Geothermal Res. 324, 169–178. doi:10.1016/j.jvolgeores.2016.06.005
Gao, G., Kang, G., Li, G., and Bai, C. (2015). Crustal Magnetic Anomaly and Curie Surface beneath Tarim Basin, China, and its Adjacent Area. Can. J. Earth Sci. 52, 357–367. doi:10.1139/cjes-2014-0204
Gatinsky, Y., Rundquist, D., Vladova, G., and Prokhorova, T. (2011). Up-to-date Geodynamics and Seismicity of Central Asia. Ijg 02, 1–12. doi:10.4236/ijg.2011.21001
Guo, N., Wu, C., and Fagin, S. (2015). Seismic Imaging of Complex Structures in the Tarim basin. J. Earth Sci. 26, 586–591. doi:10.1007/s12583-015-0560-9
Hendrix, M. S., Graham, S. A., Carroll, A. R., Sobel, E. R., McKNIGHT, C. L., Schulein, B. J., et al. (1992). Sedimentary Record and Climatic Implications of Recurrent Deformation in the Tian Shan: Evidence from Mesozoic Strata of the north Tarim, South Junggar, and Turpan Basins, Northwest China. Geol. Soc. America Bull. 104, 53–79. doi:10.1130/0016-7606(1992)104<0053:sracio>2.3.co;2
Hsieh, H.-H., Chen, C.-H., Lin, P.-Y., and Yen, H.-Y. (2014). Curie point Depth from Spectral Analysis of Magnetic Data in Taiwan. J. Asian Earth Sci. 90, 26–33. doi:10.1016/j.jseaes.2014.04.007
Idoko, C. M., Conder, J. A., Ferré, E. C., and Filiberto, J. (2019). The Potential Contribution to Long Wavelength Magnetic Anomalies from the Lithospheric Mantle. Phys. Earth Planet. Interiors 292, 21–28. doi:10.1016/j.pepi.2019.05.002
Jia, C. (1997). Tectonic Characteristics and Oil-Gas in the Tarim Basin. China. Beijing: Petroleum Industry Press. (in Chinese).
Jiang, G., Hu, S., Shi, Y., Zhang, C., Wang, Z., and Hu, D. (2019). Terrestrial Heat Flow of continental China: Updated Dataset and Tectonic Implications. Tectonophysics 753, 36–48. doi:10.1016/j.tecto.2019.01.006
Khain, E., Bibikova, E., Salnikova, E., Kröner, A., Gibsher, A., Didenko, A., et al. (2003). The Palaeo-Asian Ocean in the Neoproterozoic and Early Palaeozoic: New Geochronologic Data and Palaeotectonic Reconstructions. Precambrian Res. 122, 329–358. doi:10.1016/s0301-9268(02)00218-8
Korsch, R. J., and Doublier, M. P. (2016). Major Crustal Boundaries of Australia, and Their Significance in mineral Systems Targeting. Ore Geology. Rev. 76, 211–228. doi:10.1016/j.oregeorev.2015.05.010
Kumar, P., Yuan, X., Kind, R., and Kosarev, G. (2005). The Lithosphere‐asthenosphere Boundary in the Tien Shan‐Karakoram Region from S Receiver Functions: Evidence for continental Subduction. Geophys. Res. Lett. 32(7):n/a. doi:10.1029/2004gl022291
Li, C.-F., and Wang, J. (2016). Variations in Moho and Curie Depths and Heat Flow in Eastern and Southeastern Asia. Mar. Geophys. Res. 37, 1–20. doi:10.1007/s11001-016-9265-4
Li, C.-F., Wang, J., Zhou, Z., Geng, J., Chen, B., Yang, F., et al. (2012a). 3D Geophysical Characterization of the Sulu-Dabie Orogen and its Environs. Phys. Earth Planet. Interiors 192-193, 35–53. doi:10.1016/j.pepi.2012.01.003
Li, C., Chen, B., and Zhou, Z. (2009). Deep Crustal Structures of Eastern China and Adjacent Seas Revealed by Magnetic Data. Sci. China Ser. D-earth Sci. 52, 984–993. doi:10.1007/s11430-009-0096-x
Li, C., Lu, Y., and Wang, J. (2017). A Global Reference Model of Curie-point Depths Based on EMAG2. Scientific Rep. 7, 45129. doi:10.1038/srep45129
Li, D., Yang, S., Chen, H., Cheng, X., Li, K., Jin, X., et al. (2014). Late Carboniferous Crustal Uplift of the Tarim Plate and its Constraints on the Evolution of the Early Permian Tarim Large Igneous Province. Lithos 204, 36–46. doi:10.1016/j.lithos.2014.05.023
Li, Q., and Xu, B. (1999). The Characteristic and Geological Meaning of Curie Isothermic Surface under the Tarim basin. Oil Geophys. Prospecting 34, 590–594. (in Chinese with English abstract).
Li, Z., Chen, H., Song, B., Li, Y., Yang, S., and Yu, X. (2011). Temporal Evolution of the Permian Large Igneous Province in Tarim Basin in Northwestern China. J. Asian Earth Sci. 42, 917–927. doi:10.1016/j.jseaes.2011.05.009
Li, Z., Li, X., Kinny, P., Wang, J., Zhang, S., and Zhou, H. (2003). Geochronology of Neoproterozoic Syn-Rift Magmatism in the Yangtze Craton, South China and Correlations with Other Continents: Evidence for a Mantle Superplume that Broke up Rodinia. Precambrian Res. 122, 85–109. doi:10.1016/s0301-9268(02)00208-5
Li, Z., Li, Y., Chen, H., Santosh, M., Yang, S., Xu, Y., et al. (2012b). Hf Isotopic Characteristics of the Tarim Permian Large Igneous Province Rocks of NW China: Implication for the Magmatic Source and Evolution. J. Asian Earth Sci. 49, 191–202. doi:10.1016/j.jseaes.2011.11.021
Liu, S., Lei, X., Feng, C., and Hao, C. (2016). Estimation of Subsurface Formation Temperature in the Tarim Basin, Northwest China: Implications for Hydrocarbon Generation and Preservation. Int. J. Earth Sci. (Geol Rundsch) 105, 1329–1351. doi:10.1007/s00531-015-1253-4
Lu, S., Li, H., Zhang, C., and Niu, G. (2008). Geological and Geochronological Evidence for the Precambrian Evolution of the Tarim Craton and Surrounding continental Fragments. Precambrian Res. 160, 94–107. doi:10.1016/j.precamres.2007.04.025
Maden, N. (2010). Curie-point Depth from Spectral Analysis of Magnetic Data in Erciyes Stratovolcano (Central TURKEY). Pure Appl. Geophys. 167, 349–358. doi:10.1007/s00024-009-0017-0
Martos, Y. M., Catalán, M., Jordan, T. A., Golynsky, A., Golynsky, D., Eagles, G., et al. (2017). Heat Flux Distribution of Antarctica Unveiled. Geophys. Res. Lett. 44 (11), 417–426. doi:10.1002/2017gl075609
Maus, S. (2010). An Ellipsoidal Harmonic Representation of Earth's Lithospheric Magnetic Field to Degree and Order 720. Geochem. Geophys. Geosystems 11. doi:10.1029/2010gc003026
Maus, S., Barckhausen, U., Berkenbosch, H., Bournas, N., Brozena, J., Childers, V., and Gaina, C. (2009). EMAG2: A 2–arc Min Resolution Earth Magnetic Anomaly Grid Compiled from Satellite, Airborne, and marine Magnetic Measurements. Geochem. Geophys. Geosystems 10 (8). doi:10.1029/2009gc002471
Maus, S., and Dimri, V. (1995). Potential Field Power Spectrum Inversion for Scaling Geology. J. Geophys. Res. 100, 12605–12616. doi:10.1029/95jb00758
Maus, S., Gordon, D., and Fairhead, D. (1997). Curie-temperature Depth Estimation Using a Self-Similar Magnetization Model. Geophys. J. Int. 129, 163–168. doi:10.1111/j.1365-246x.1997.tb00945.x
Mickus, K., and Hussein, M. (2016). Curie Depth Analysis of the Salton Sea Region, Southern California. Pure Appl. Geophys. 173, 537–554. doi:10.1007/s00024-015-1100-3
Neil, E. A., and Houseman, G. A. (1997). Geodynamics of the Tarim Basin and the Tian Shan in central Asia. Tectonics 16, 571–584. doi:10.1029/97tc01413
Okubo, Y., Graf, R. J., Hansen, R. O., Ogawa, K., and Tsu, H. (1985). Curie point Depths of the Island of Kyushu and Surrounding Areas, Japan. Geophysics 50, 481–494. doi:10.1190/1.1441926
QHBGMR (Qinghai Bureau of Geology and Mineral Resources) (1991). Memoir of Regional Geology of Qinghai Province. Beijing: Geological Publishing House.
Ravat, D., Pignatelli, A., Nicolosi, I., and Chiappini, M. (2007). A Study of Spectral Methods of Estimating the Depth to the Bottom of Magnetic Sources from Near-Surface Magnetic Anomaly Data. Geophys. J. Int. 169, 421–434. doi:10.1111/j.1365-246x.2007.03305.x
Ross, H. E., Blakely, R. J., and Zoback, M. D. (2006). Testing the Use of Aeromagnetic Data for the Determination of Curie Depth in California. Geophysics 71, L51–L59. doi:10.1190/1.2335572
Saada, S. A. (2016). Curie point Depth and Heat Flow from Spectral Analysis of Aeromagnetic Data over the Northern Part of Western Desert, Egypt. J. Appl. Geophys. 134, 100–111. doi:10.1016/j.jappgeo.2016.09.003
Şengör, A., Natal'in, B., and Burtman, V. (1993). Evolution of the Altaid Tectonic Collage and Palaeozoic Crustal Growth in Eurasia. Nature 364, 299–307. doi:10.1038/364299a0
Shi, B., Zhao, S., Lin, F., Xyu, X., and Hu, Y. (2018). The Study of the Curie Isothermal Surface in Tarim Basin and its Adjacent Area. J. Yunnan Univ. 40, 508–512. (in Chinese with English abstract).
Sobel, E. R., and Arnaud, N. (1999). A Possible Middle Paleozoic Suture in the Altyn Tagh, NW China. Tectonics 18, 64–74. doi:10.1029/1998tc900023
Spector, A., and Grant, F. S. (1970). Statistical Models for Interpreting Aeromagnetic Data. Geophysics 35, 293–302. doi:10.1190/1.1440092
Tanaka, A. (2017). Global Centroid Distribution of Magnetized Layer from World Digital Magnetic Anomaly Map. Tectonics 36, 3248–3253. doi:10.1002/2017tc004770
Tanaka, A. (2007). “Magnetic and Seismic Constraints on the Crustal thermal Structure beneath the Kamchatka Peninsula,” in Volcanism and Tectonics of the Kamchatka Peninsula and Adjacent Arcs. Editor J. Eichelberger, E. Gordeev, P. Izbekovet al. (Washington DC: American Geophysical Union), 172, 100–105.Geophyiscal Monography Series
Tanaka, A., Okubo, Y., and Matsubayashi, O. (1999). Curie point Depth Based on Spectrum Analysis of the Magnetic Anomaly Data in East and Southeast Asia. Tectonophysics 306, 461–470. doi:10.1016/s0040-1951(99)00072-4
Teng, J., Deng, Y., Badal, J., and Zhang, Y. (2014). Moho Depth, Seismicity and Seismogenic Structure in China mainland. Tectonophysics 627, 108–121. doi:10.1016/j.tecto.2013.11.008
Teng, J., Zhang, Z., Zhang, X., Wang, C., Gao, R., Yang, B., et al. (2013). Investigation of the Moho Discontinuity beneath the Chinese mainland Using Deep Seismic Sounding Profiles. Tectonophysics 609, 202–216. doi:10.1016/j.tecto.2012.11.024
Turcotte, D., and Schubert, G. (2002a). Geodynamics. New York: Cambridge University Press. doi:10.1017/cbo9780511807442
Turcotte, D., and Schubert, G. (2002b). Geodynamics. Second Edition. New York: Cambridge University Press, 456. doi:10.1017/cbo9780511807442
Wang, J., and Li, C.-F. (2015). Crustal Magmatism and Lithospheric Geothermal State of Western North America and Their Implications for a Magnetic Mantle. Tectonophysics 638, 112–125. doi:10.1016/j.tecto.2014.11.002
Wang, J., and Li, C.-F. (2018). Curie point Depths in Northeast China and Their Geothermal Implications for the Songliao Basin. J. Asian Earth Sci. 163, 177–193. doi:10.1016/j.jseaes.2018.05.026
Wang, L., Tian, W., Wei, Z., Gong, M., and Li, X. (2018). Volcanic Conduits of the Tarim Flood Basalt Province: 3D Structure and Thermogenic Gas Release. ACTA PETROLOGICA SINICA 34, 75–90. (in Chinese with English abstract).
Wang, N., Zhang, E., and Yang, L. (2004). Aeromagnetic Map of China and Adjacent Sea Region (1: 5000000). Beijing: Geological Publishing House.
Wang, W., Qiao, X., Yang, S., and Wang, D. (2016). Present-day Velocity Field and Block Kinematics of Tibetan Plateau from GPS Measurements. Geophys. J. Int. 208 (2), 1088–1102. doi:10.1093/gji/ggw445
Wartes, M. A., Carroll, A. R., and Greene, T. J. (2002). Permian Sedimentary Record of the Turpan-Hami basin and Adjacent Regions, Northwest China: Constraints on Postamalgamation Tectonic Evolution. Geol. Soc. America Bull. 114, 131–152. doi:10.1130/0016-7606(2002)114<0131:psrott>2.0.co;2
Wessel, P., and Smith, W. H. F. (1998). New, Improved Version of Generic Mapping Tools Released. Eos Trans. AGU 79 (47), 579. doi:10.1029/98eo00426
Windley, B. F., Alexeiev, D., Xiao, W., Kröner, A., and Badarch, G. (2007). Tectonic Models for Accretion of the Central Asian Orogenic Belt. J. Geol. Soc. 164, 31–47. doi:10.1144/0016-76492006-022
Wittlinger, G., Vergne, J., Tapponnier, P., Farra, V., Poupinet, G., Jiang, M., et al. (2004). Teleseismic Imaging of Subducting Lithosphere and Moho Offsets beneath Western Tibet. Earth Planet. Sci. Lett. 221, 117–130. doi:10.1016/s0012-821x(03)00723-4
Wu, L., Guan, S., Zhang, S., Yang, H., Jin, J., Zhang, X., et al. (2018). Neoproterozoic Stratigraphic Framework of the Tarim Craton in NW China: Implications for Rift Evolution. J. Asian Earth Sci. 158, 240–252. doi:10.1016/j.jseaes.2018.03.003
Xiao, W. J., Windley, B. F., Chen, H. L., Zhang, G. C., and Li, J. L. (2002). Carboniferous-Triassic Subduction and Accretion in the Western Kunlun, China: Implications for the Collisional and Accretionary Tectonics of the Northern Tibetan Plateau. Geol 30, 295–298. doi:10.1130/0091-7613(2002)030<0295:ctsaai>2.0.co;2
Xiao, W. J., Windley, B. F., Liu, D. Y., Jian, P., Liu, C. Z., Yuan, C., et al. (2005). Accretionary Tectonics of the Western Kunlun Orogen, China: A Paleozoic-Early Mesozoic, Long‐Lived Active Continental Margin with Implications for the Growth of Southern Eurasia. J. Geology. 113, 687–705. doi:10.1086/449326
Xiong, S., Fan, Z., Zhang, H., Ding, Y., Guo, Z., and Li, Z. (2015). Aeromagnetic Map Series of continental China (1:2500000). Beijing: Geological Publishing House. doi:10.1142/z007
Xiong, S., Yang, H., Ding, Y., and Li, Z. (2016). Characteristics of Chinese Continent Curie point Isotherm. Chin. J. Geophys. 59, 643–657. (in Chinese with English abstract). doi:10.1002/cjg2.30014
XJBGMR (Xinjiang Bureau of Geology and Mineral Resources) (1993a). Memoir of Regional Geology of Xinjiang Province. Beijing: Geological Publishing House.
Xu, X., Zuza, A. V., Yin, A., Lin, X., Chen, H., and Yang, S. (2021). Permian Plume-Strengthened Tarim Lithosphere Controls the Cenozoic Deformation Pattern of the Himalayan-Tibetan Orogen. Geology 49 (1), 96–100. doi:10.1130/g47961.1
Xu, Y.-G., Wei, X., Luo, Z.-Y., Liu, H.-Q., and Cao, J. (2014). The Early Permian Tarim Large Igneous Province: Main Characteristics and a Plume Incubation Model. Lithos 204, 20–35. doi:10.1016/j.lithos.2014.02.015
XZBGMR (Xizang Bureau of Geology and Mineral Resources) (1993b). Memoir of Regional Geology of Xizang Autonomous Region. Beijing: Geological Publishing House.
Yang, S.-F., Li, Z., Chen, H., Santosh, M., Dong, C.-W., and Yu, X. (2007). Permian Bimodal Dyke of Tarim Basin, NW China: Geochemical Characteristics and Tectonic Implications. Gondwana Res. 12, 113–120. doi:10.1016/j.gr.2006.10.018
Yang, S., Chen, H., Dong, C., Jia, C., and Wang, Z. (1996). The Discovery of Permian Syenite inside Tarim basin and its Geodynamic Significance. Geochimica 25, 121–128. (in Chinese with English abstract).
Yang, S., Chen, H., Ji, D., Li, Z., Dong, C., Jia, C., et al. (2005). Geological Process of Early to Middle Permian Magmatism in Tarim Basin and its Geodynamic Significance. Geol. J. China Universities 11, 504–511. (in Chinese with English abstract).
Yang, W., Xu, Y., Zhang, L., Yu, C., Yu, P., Zhang, B., et al. (2015). Magnetotellruic Investigation and 3D Lithospheric Structure in the Tarim Terrane. Acta Geol. Sinica 89, 1151–1161. (in Chinese with English abstract). doi:10.1111/1755-6724.12304_32
Yao, Y., Wen, S., Li, T., and Wang, C. (2021). The 2020 Mw 6.0 Jiashi Earthquake: A Fold Earthquake Event in the Southern Tian Shan, Northwest China. Seismol. Res. Lett. 92, 859–869. doi:10.1785/0220200146
Yin, A. (2010). Cenozoic Tectonic Evolution of Asia: A Preliminary Synthesis. Tectonophysics 488, 293–325. doi:10.1016/j.tecto.2009.06.002
Yin, A., and Harrison, T. M. (2000). Geologic Evolution of the Himalayan-Tibetan Orogen. Annu. Rev. Earth Planet. Sci. 28, 211–280. doi:10.1146/annurev.earth.28.1.211
Zhang, C.-L., Zou, H.-B., Li, H.-K., and Wang, H.-Y. (2013a). Tectonic Framework and Evolution of the Tarim Block in NW China. Gondwana Res. 23, 1306–1315. doi:10.1016/j.gr.2012.05.009
Zhang, L., Koyama, T., Utada, H., Yu, P., and Wang, J. (2012). A Regularized Three-Dimensional Magnetotelluric Inversion with a Minimum Gradient Support Constraint. Geophys. J. Int. 189, 296–316. doi:10.1111/j.1365-246x.2012.05379.x
Zhang, L., Zhao, C., Yu, P., Xiang, Y., Peng, X., Koyama, T., et al. (2020). The Electrical Conductivity Structure of the Tarim basin in NW China as Revealed by Three-Dimensional Magnetotelluric Inversion. J. Asian Earth Sci. 187, 104093. doi:10.1016/j.jseaes.2019.104093
Zhang, P., Deng, Q., Zhang, Z., and Li, H. (2013b). Active Faults, Earthquake Hazards and Associated Geodynamic Processes in continental China. Scientia Sinica Terrae 43, 1607–1620. (in Chinese with English abstract).
Zhang, Z., Yang, L., Teng, J., and Badal, J. (2011). An Overview of the Earth Crust under China. Earth-Science Rev. 104, 143–166. doi:10.1016/j.earscirev.2010.10.003
Zheng, G., Wang, H., Wright, T. J., Lou, Y., Zhang, R., Zhang, W., et al. (2017). Crustal Deformation in the India-Eurasia Collision Zone from 25 Years of GPS Measurements. J. Geophys. Res. Solid Earth 122, 9290–9312. doi:10.1002/2017jb014465
Keywords: curie point depth, thermal structure, aeromagnetic data, plume-lithosphere interaction, Tarim Craton, Northwest China
Citation: Xu X, Xiong S, Tanaka A, Zheng Q, Kuang X, Zhu X, Zhou D, Zheng Q, Wan J, Yu X and Wang B (2021) Thermal Structure Beneath the Tarim Craton and Its Tectonic Implications. Front. Earth Sci. 9:700114. doi: 10.3389/feart.2021.700114
Received: 25 April 2021; Accepted: 23 June 2021;
Published: 05 August 2021.
Edited by:
Lei Wu, Zhejiang University, ChinaCopyright © 2021 Xu, Xiong, Tanaka, Zheng, Kuang, Zhu, Zhou, Zheng, Wan, Yu and Wang. This is an open-access article distributed under the terms of the Creative Commons Attribution License (CC BY). The use, distribution or reproduction in other forums is permitted, provided the original author(s) and the copyright owner(s) are credited and that the original publication in this journal is cited, in accordance with accepted academic practice. No use, distribution or reproduction is permitted which does not comply with these terms.
*Correspondence: Shengqing Xiong, eHNxYWdyc0AxMjYuY29t