 Zhang Chen
 Renguang Wu
 Zhibiao Wang
- 1Plateau Atmosphere and Environment Key Laboratory of Sichuan Province, School of Atmospheric Sciences, Chengdu University of Information Technology, Chengdu, China
- 2Department of Atmospheric Sciences and Key Laboratory of Geoscience Big Data and Deep Resource of Zhejiang Province, School of Earth Sciences, Zhejiang University, Hangzhou, China
- 3Center for Monsoon System Research, Institute of Atmospheric Physics, Chinese Academy of Sciences, Beijing, China
- 4Southern Marine Science and Engineering Guangdong Laboratory (Zhuhai), Zhuhai, China
The present study investigates the impacts of autumn-winter Tibetan Plateau (TP) snow cover anomalies on the interannual variability of the East Asian winter monsoon (EAWM). It is found that the northern component of EAWM is significantly associated with October-November-December-January (ONDJ) snow cover anomalies over the eastern TP, whereas the TP snow cover changes have little impact on the southern component of EAWM. However, the relationship of the northern component of EAWM to ONDJ TP snow cover experienced an obvious change in the mid-1990s. During 1979–1998, due to the high persistence of TP snow anomalies from autumn to winter, extensive ONDJ TP snow cover anomalies have a prominent influence on atmospheric circulation over Asia and the North Pacific, with more TP snow cover followed by an enhanced Siberian high and a deepened Aleutian low in winter, resulting in stronger EAWM. During 1999–2016, TP snow cover anomalies have a weak persistence. The atmospheric circulation anomalies display a different distribution. As such, there is a weak connection between the northern component of EAWM and the TP snow cover anomalies during this period.
Introduction
The Tibetan Plateau (TP) is the highest plateau on earth with an average altitude over 4,000 m above sea level. Due to its high elevation, the TP is covered by snow in most of the year (Wang C. et al., 2017). As an important lower boundary condition, snow anomalies may change the surface energy budget and hydrological cycle, and induce both local and remote atmospheric responses (Barnett et al., 1989; Yasunari et al., 1991).
The impacts of the TP snow cover on global climate have received considerable attention. Numerous studies investigated the relationship between the TP snow cover and the Indian summer monsoon (e.g., Blanford 1884; Fasullo 2004; Zhao and Moore 2004) and the East Asian summer monsoon (e.g., Wu and Qian 2003; Wu and Kirtman 2007; Xiao and Duan 2016; Wang et al., 2018). The snow cover anomalies over the TP can also influence surface air temperature (SAT) variations over North America (e.g., Lin and Wu 2011; Qian et al., 2019; Wang et al., 2020), but the linkage between them is not stationary (e.g., Qian et al., 2019; Wang et al., 2020). Qian et al. (2019) showed that the connection between the TP autumn snow cover and the North America winter SAT is weakened after the mid-1990s. Wang et al. (2020) detected that the impact of the TP snow cover on the North America SAT in spring experienced a weakening in the mid-2000s. In addition, observational and numerical studies suggest that the TP snow anomaly can trigger near-global atmospheric circulation patterns, such as the Pacific-North American (PNA)-like teleconnection (e.g., Lin and Wu 2011; Wu et al., 2011; Liu et al., 2017) and the Western Pacific-like teleconnection (e.g., Liu et al., 2020).
Most of previous studies are concentrated on the impacts of the TP snow on summer monsoon. The effects of snow cover anomalies over the TP on the East Asian winter monsoon (EAWM) are rarely studied. The EAWM is one of the most active components in the global climate system during boreal winter, and it exerts large impacts on the Asia-Pacific winter climate (e.g., Lau and Chang 1987). Thus, it is valuable to investigate whether and how the TP snow cover anomalies influence the EAWM variability, and whether the relationship between the TP snow and EAWM has experienced interdecadal changes in the past? Furthermore, previous studies have demonstrated that the EAWM variability is dominated by two distinct components: the northern (mid-latitude) and southern (low-latitude) components (e.g., Wang et al., 2010; Liu et al., 2012; Chen et al., 2014a) and the two components have notably different circulation systems and factors (e.g., Liu et al., 2012, 2013; Chen et al., 2014a, 2014b; Chen et al., 2019). Additionally, climate anomalies associated with the two components of EAWM are also different. Chen et al. (2014a) found that when the northern component of EAWM is strong, significant cooling occurs over northwest and northeast China and significant warming is confined to southwestern China. However, when only the southern component of EAWM is strong, significant warming is observed in northeast China and the surface air anomalies are small over other regions of China. Therefore, to better understand the TP snow cover-related EAWM variability, it is necessary to consider the two components of the EAWM separately.
Data and Methods
The original weekly Northern Hemisphere snow cover data are acquired from the National Snow and Ice Data Center (NSIDC) (Brodzik and Armstrong 2013) (http://nsidc.org/data/). The data spans the period from October 1966 to December 2017, with a spatial resolution of 25 km. We have converted the raw snow cover data to monthly mean on regular 1° × 1° grids for our analyses. The monthly mean atmospheric data used in this study are from the National Centers for Environmental Prediction-Department of Energy (NCEP-DOE) Reanalysis-2, spanning the time period from 1979 to present (Kanamitsu et al., 2002) (https://www.esrl.noaa.gov/psd/). The variables include winds and geopotential heights at pressure levels, sea level pressure (SLP), surface air temperature (SAT), surface latent heat flux, surface sensible heat flux, upward and downward shortwave radiation, upward and downward longwave radiation and precipitation rate. The resolution of the NCEP-DOE reanalysis data is 2.5° × 2.5° for pressure level variables. The surface variables have a resolution of T62. The period of analysis in this study is from 1979 to 2016, and the winter of 1979 refers to the three months from December 1979 to February 1980. Since we focus on the interannual variability, all the variables are filtered by a 9-years high-pass Lanczos filter (Duchon 1979).
Following Chen et al. (2014a), we used area-mean 1000hPa meridional wind anomalies in December-January-February (DJF) over the regions of 10°–25°N, 105°–135° E (hereinafter, Sindex) and 35°–55°N, 110°–125°E (hereinafter, Nindex) to represent the southern and northern components of the EAWM variability, respectively. Note that these two indices have been multiplied by -1 so that a positive (negative) value of the index corresponds to a strong (weak) EAWM. The Aleutian low index is defined as the regionally averaged winter SLP anomaly over the region 30°–50°N, 160°–210°E. The Pacific-North American pattern (PNA) index is produced by the Climate Prediction Center (CPC, https://www.cpc.ncep.noaa.gov/).
The total atmospheric column heat source (Q1) defined by Zhao and Chen (2001) is applied to examine the effect of snow cover anomalies on the atmosphere. Q1 is calculated as follows:
SH denotes sensible heat flux at the surface,
Results
Relationship Between the Tibetan Plateau Snow Cover and East Asian winter monsoon
To explore the relationship between autumn-winter TP snow cover and the two components of the EAWM variability during 1979–2016, a correlation analysis was performed for October-November-December-January (ONDJ) TP snow cover anomalies with respect to the winter Nindex and Sindex separately (Figures 1A,B). The Nindex displays a significantly positive correlation with snow cover in the eastern TP (Figure 1A), whereas the Sindex shows a weak correlation over almost the whole TP (Figure 1B). Based on the distribution of significant correlation coefficients, we choose the region of 31°–37°N and 86°–98°E (denoted by the box in Figure 1A) as a key region to analyze the influence of TP snow cover anomalies on EAWM variability. The selected key region also shows a large standard deviation of the interannual variation of snow cover in ONDJ (figure not shown).

FIGURE 1. Correlation coefficients between the ONDJ snow cover anomalies over the Tibetan Plateau and the Nindex during 1979–2016 (A), 1979–1998 (C), and 1999–2016 (D), and those between the ONDJ snow cover anomalies over the Tibetan Plateau and the Sindex during 1979–2016 (D). The dotted regions represent the correlation coefficients significant at the 95% confidence level. The box denotes the key region over the Tibetan Plateau that is used to define the SCI.
To illustrate why we focus on the TP snow cover in ONDJ, area-mean snow cover anomalies in the TP key region are constructed for months from September to the following February. Then, we calculate the month-to-month correlation coefficients between those area-mean snow cover anomalies (Table 1). The correlation coefficient between September and October is significant at the 90% confidence level and that between January and February is significant at the 95% confidence level. The other correlation coefficients between October and November, between November and December, and between December and January are all significant at the 99% confidence level. This implies a month-to-month persistence of snow cover anomalies during September through January, consistent with previous studies (e.g., Wang et al., 2019). According to the magnitude of 1-month lag correlation coefficient, we combine the snow cover anomalies in the four months of October, November, December and January in analyzing the TP snow cover influences.
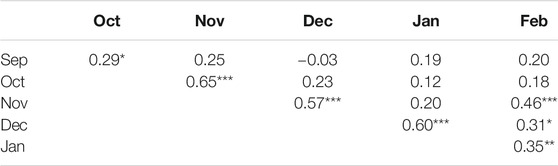
TABLE 1. Correlation coefficients between the neighboring month snow cover from September to February of the following year in the selected key region over the eastern TP for 1979–2016. Symbol “*”, “**” and “***” denote correlation coefficients significant at the 90, 95 and 99% confidence level.
An ONDJ TP snow cover index (SCI) is defined as area-mean ONDJ snow cover anomalies over the key region to represent the TP snow cover variation. During 1979–2016, the correlation coefficient of Nindex and Sindex with ONDJ TP SCI is 0.42 and 0.07, respectively, with the former reaching the 99% confidence level. This indicates that there is a close relationship between the ONDJ TP snow cover anomaly and the northern component of EAWM, but the TP snow cover has a weak effect on the southern component of EAWM.
Similar domains have been used in previous studies in defining snow cover indices to study the relationship between the TP snow cover and climate. Qian et al. (2019) calculated an area mean SCI in the region of 27.5°–36.0°N and 88.5°–100.5°E based on the spatial distribution of both climatological mean snow amount and the standard deviation of interannual variation of snow cover in autumn. According to the loading of the first EOF mode of autumn-winter mean snow cover, Wang et al. (2019) used area mean snow cover anomalies averaged over the central eastern region as an SCI. In the present study, we choose the region based on the distribution of significant correlation between the northern component of EAWM and the ONDJ TP snow cover.
The statistical relationship between the ONDJ TP snow cover and EAWM variations appears unsteady. The changing relationship is illustrated in Figure 2 that displays the sliding correlation between the ONDJ TP SCI and the Nindex and Sindex of the EAWM with a 21-years window. The SCI-Nindex correlation remains significant positive before the mid-1990s, but it weakens dramatically around the mid-1990s and becomes insignificant after the mid-1990s (Figure 2, solid line). In contrast, the SCI-Sindex correlation is weak and insignificant during the period of analysis though its magnitude shows changes (Figure 2, dashed line). This result reconfirms that the southern component of EAWM does not have an obvious relationship to the TP snow cover during 1979–2016. Thus, we focus on the effects of the TP snow cover on the northern component of EAWM in the following analysis.
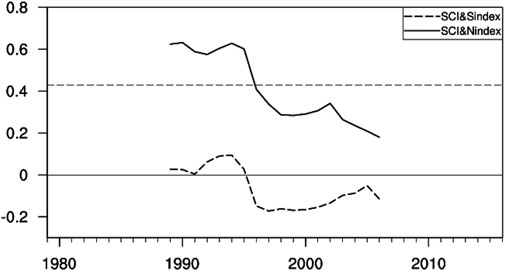
FIGURE 2. The 21-years sliding correlation between the ONDJ TP SCI and the Nindex (solid line) and Sindex (dashed line) of EAWM. The years are labeled based on the central year of the 21-years window. The horizontal dashed lines indicate correlation coefficient the 95% confidence level.
To understand the interdecadal changes in the ONDJ TP snow cover-northern component of EAWM connection, we separate the analysis period (1979–2016) into two subperiods, 1979–1998 as the high correlation period and 1999–2016 as the low correlation period. These two epochs are selected because the difference of the correlation achieves large contrast between the neighboring periods. The correlation coefficient between the ONDJ TP SCI and Nindex is 0.57 and 0.22, respectively, for the above two subperiods. Only the former exceeds the 99% confidence level. The changing relationship between the ONDJ TP snow cover and the northern component of EAWM can be verified by the spatial distributions of correlation coefficients between the ONDJ TP snow cover anomalies and Nindex during 1979–1998 and 1999–2016 as shown in Figures 1C,D. Apparently, the correlation with the Nindex is significant positive over the eastern TP during 1979–1998 (Figure 1C), but becomes weak during 1999–2016 (Figure 1D).
Processes Connecting the Tibetan Plateau Snow Cover to East Asian Winter Monsoon During 1979–1998
Previous studies pointed out that the impacts of snow on climate in local and remote regions are through modulating local atmospheric column heating (e.g., Xiao and Duan 2016; Wang et al., 2018; Qian et al., 2019). In this section, in order to understand the plausible physical processes that link the ONDJ TP snow cover to the northern component of EAWM for the period 1979–1998, we illustrate first the concurrent influence of TP snow cover anomalies on local atmospheric thermal condition. Then, we analyze the winter atmospheric circulation anomalies associated with the ONDJ TP snow cover anomalies and document their role in connecting the TP snow cover and EAWM variability.
Figure 3 presents anomalies of surface heat fluxes as well as anomalies of SAT and Q1 obtained by regression on SCI. Positive TP snow cover anomalies in the key region are accompanied by increased upward shortwave radiation flux (USWR, Figure 3A), which is attributed to the snow-albedo effect. Upward longwave radiation (ULWR) is reduced (Figure 3B) following the land surface temperature decrease (figure not shown), which is attributed to the absorption of less shortwave radiation by the land surface. Upward sensible heat flux (SHF) decreases notably (Figure 3C) due to the snow interception of heat exchange and the decrease of surface temperature. Latent heat flux (LHF) anomalies are small (Figure 3D). As a consequence, positive snow cover anomalies cool the near-surface air (Figure 3E). Corresponding to more snow cover, significant negative Q1 anomalies are observed over the eastern Plateau (Figure 3F). The correlation coefficient between SCI and area-mean Q1 in the same domain as the SCI in ONDJ is -0.69, exceeding the 99% confidence level. These results confirm the cooling effect of more snow cover on local atmospheric column.
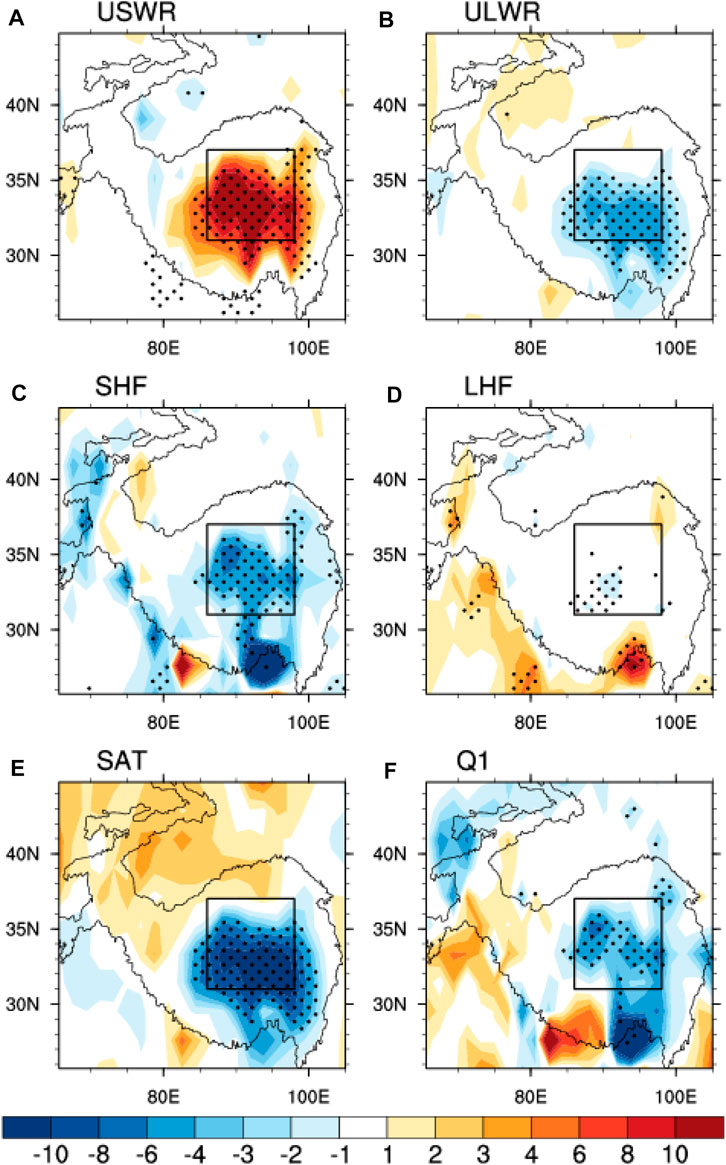
FIGURE 3. Interannual anomalies of (A) upward shortwave radiation flux (Wm−2), (B) upward longwave radiation flux (Wm−2), (C) sensible heat flux (Wm−2), (D) latent heat flux (Wm−2), (E) surface air temperature (×10, °C), and (F) Q1 (Wm−2) in ONDJ obtained by regression on the ONDJ TP SCI for the period 1979–1998. The dotted regions denote that anomalies are significant at the 95% confidence level. The box denotes the key region over the Tibetan Plateau that is used to define the SCI.
The cooling effect directly modulates the upper-level atmospheric state, which, in turn, may induce atmospheric circulation changes in remote regions. Figure 4 shows 500 hPa geopotential height, SLP, and 850 hPa wind anomalies in winter obtained by regression against the ONDJ TP SCI during 1979–1998. Corresponding to more snow cover over the eastern Plateau, negative height anomalies dominate the coastal East Asia and the northern North Pacific, and large positive height anomalies are observed over northern Eurasia and North America (Figure 4A). Such a circulation anomaly pattern indicates a deepened East Asian trough and an enhanced ridge around the Ural Mountains. When the SCI is high, significant positive SLP anomalies are seen around the Lake Baikal and significant negative SLP anomalies occur over the northern North Pacific, reflecting an enhanced Siberian high and a deepened Aleutian low (Figure 4B). Previous modeling studies revealed that the autumn-winter TP snow cover is closely associated with the winter Aleutian low variability (e.g., Yasunari et al., 1991; Walland and Simmonds 1996). Corresponding to the deepened Aleutian low, an anomalous cyclone is seen over the northern North Pacific (Figure 4C). The contrast of SLP anomalies over the Eurasian continent and the Aleutian low enhances the zonal gradient of SLP over East Asia, indicating a stronger EAWM. Indeed, significant northerly wind anomalies prevail over the coast of East Asia (Figure 4C). We have performed a regression analysis of winter atmospheric circulation with respect to ONDJ area-mean Q1 in the selected TP key region (figures not shown). The results are generally similar to those shown in Figure 4. This confirms that snow cover anomalies modulate the atmospheric circulation in local and remote regions through changing local atmospheric column thermal state.
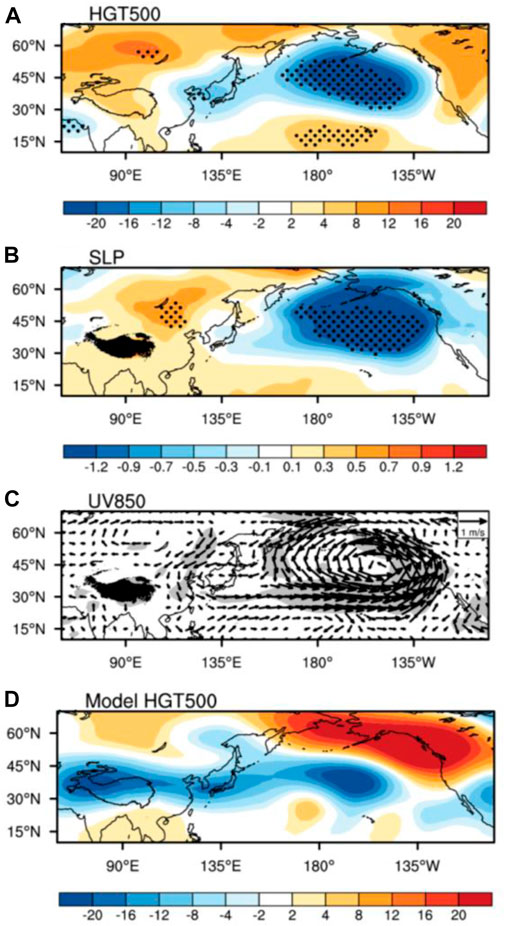
FIGURE 4. Interannual anomalies of winter (A) 500°hPa geopotential height (m), (B) SLP (hPa) and (c) 850°hPa wind (ms−1) obtained by regression on the ONDJ TP SCI for the period 1979–1998. (d) Difference of winter 500°hPa geopotential height (m) between the sensitivity experiment and control experiment based on the last 14-years simulations of the CAM model. The wind vector scale is shown on the top-right corner in (C). The dotted regions in (A, B) and the shaded regions in (C) denote that anomalies of geopotential height in (A), SLP in (B) and either u wind or v wind in (C) are significant at the 95% confidence level.
To confirm the role of the TP ONDJ snow cover anomalies on EAWM variations, we perform numerical experiments using the Community Atmospheric Model of version 5.0 (CAM5). The model is developed by the National Center for Atmospheric Research (Eaton 2011) with an approximately 1.9° × 2.5° latitude-longitude spatial resolution and 31 vertical levels. We perform one control experiment and one sensitivity experiment. In all experiments the model is integrated for 15°years. Since the albedo effect is the main way that snow cover affects the atmospheric variation, the albedo in the sensitivity experiment is set as 0.9 of that in the control experiment over the eastern Tibetan Plateau (see the box in Figure 1C) in ONDJ to represent the influence of positive TP snow cover anomalies. The model response derived as the difference between the sensitivity and control experiment displays negative height anomalies over the TP and the mid-latitude North Pacific and positive height anomalies over the northern Siberia, high-latitude North Pacific and Northern America (Figure 4D). The above distribution of height anomalies indicates an enhanced ridge around the Ural Mountains and a deepened East Asian trough, which agrees with that obtained in the observations (Figure 4A vs. Figure 4D).
Based on the above analyses, we propose the following processes connecting ONDJ snow cover anomalies over the eastern TP to winter Asian climate anomalies. The snow cover anomalies over the eastern TP have a significant cooling effect on local atmospheric column. The atmospheric cooling stimulates anomalous atmospheric circulation over East Asia and the North Pacific regions, leading to changes in the Aleutian low, the Siberian high, Ural ridge, and the East Asian trough. Chen et al. (2014a) pointed out that the northern component of EAWM is mainly affected by the above mentioned mid-latitude circulation systems. Thus, the ONDJ TP snow cover anomalies impose an impact on the northern component of the EAWM variability in 1979–1998.
Note that the spatial distribution of the atmospheric circulation anomalies in Figure 4A shows a PNA-like structure over the North Pacific through North America. In fact, previous observational and numerical studies have already demonstrated that autumn and winter positive TP snow cover anomalies can lead to a remote equivalent barotropic PNA response in winter (e.g., Lin and Wu 2011; Wu et al., 2011; Liu et al., 2017). Liu et al. (2017) suggested that the PNA responses result mainly from the eastward propagation of Rossby wave energy forced by TP snow forcing and winter transient eddy feedback.
Why Is the Relationship Between the Tibetan Plateau Snow Cover and EAWM Weak During 1999–2016?
To understand how anomalous TP snow cover influences the EAWM variation differently between 1979–1998 and 1999–2016, the same analysis is conducted for 1999–2016. During 1999–2016, when the SCI is high, the most prominent characteristic of both the 500 hPa height and SLP anomalies is a meridional dipole structure over the North Pacific, with positive and negative anomalies located north and south of approximately 45°N, respectively (Figures 5A,B). Positive height and SLP anomalies also extend westward to Asia (Figures 5A,B). Overall, there is no obvious change in the intensity of the East Asian trough (Figure 5A), the Siberian high and the Aleutian low (Figure 5B) in winter. Anomalous anticyclone and cyclone are present over the high-latitude and mid-latitude North Pacific, respectively (Figure 5C). The wind anomalies along the coast of East Asia are weak (Figure 5C), indicating a normal EAWM. Thus, the connection of the ONDJ TP snow cover with the EAWM variability is weak during 1999–2016.

FIGURE 5. As in Figure 4, but for 1999–2016.
In comparison, the influence of ONDJ TP snow cover on large-scale atmospheric circulation over the North Pacific is distinctly different between 1979–1998 and 1999–2016. Extensive more autumn-winter TP snow generates a PNA-like atmospheric response and induces a deepened Aleutian low in winter during 1979–1998 (Figures 4A,B). However, the PNA response is absent and there are no obvious anomalies in the intensity of the Aleutian low during 1999–2016 (Figures 5A,B). The correlation coefficient of winter PNA and Aleutian low index with the ONDJ SCI during 1979–1998 is 0.45 and −0.55, respectively, both exceeding the 95% confidence level, and that during 1999–2016 is −0.22 and −0.10, respectively, both of which are insignificant.
Why cannot the ONDJ TP snow anomalies trigger a winter PNA response and a deepened Aleutian low during 1999–2016? Liu et al. (2017) found that with TP snow cover anomalies in autumn or winter only, the winter PNA response is nearly absent or noticeably reduced, and the most significant PNA response requires persistent TP snow forcing from autumn to winter. To explore the persistence of TP snow cover anomalies in the two periods, we calculated the month-to-month snow cover correlation coefficient for the two epochs, respectively. In the former period, except for the correlation coefficient between September and October, the other correlation coefficients between neighboring month snow cover anomalies are all significant (Table 2). This means that the TP snow cover anomalies have a high persistence from October to February during 1979–1998, which is favorable for generating a robust PNA-like response in winter (Figures 4A,B). However, in the latter period, only the correlation coefficient between October and November is significant, the other correlation coefficients are all insignificant (Table 3). Thus, the persistence of TP snow cover anomalies is weak during 1999–2016. As a consequence, TP snow forcing in autumn or winter does not produce a PNA-like winter response during this period (Figures 5A,B).
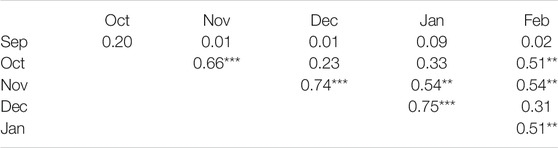
TABLE 2. As in Table 1, but for 1979–1998.
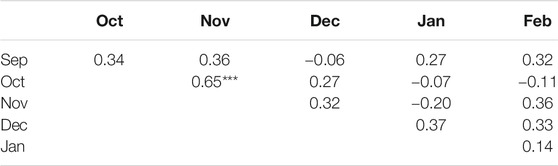
TABLE 3. As in Table 1, but for 1999–2016.
Summary
The present study investigates the impacts of the autumn-winter TP snow cover anomalies on the two components of the EAWM variability on the interannual time scale. A close relationship is identified between the ONDJ snow cover anomalies in the eastern TP and the northern component of the EAWM variability. However, the southern component of EAWM does not appear to be related to the autumn-winter TP snow cover anomalies. The relationship of the northern component of EAWM to the anomalous ONDJ TP snow cover experienced an obvious change in the mid-1990s. The relationship is strong and statistically significant before the mid-1990s, whereas the connection is weak and insignificant after the mid-1990s. Thus, the target period (1979–2016) is divided into two subperiods, 1979–1998 as the high correlation period and 1999–2016 as the low correlation period.
During 1979–1998, the TP snow cover anomalies have high persistence from October to February. Extensive more autumn-winter snow cover over the eastern TP induces persistent cooling in local atmospheric column and has a prominent influence on downstream atmospheric circulation over Asia and the North Pacific. The remote atmospheric responses in winter are mainly characterized by an enhanced Siberian high and a deepened Aleutian low, which result in stronger EAWM. During 1999–2016, due to weak persistence of TP snow cover anomalies from autumn to winter, the winter PNA-like response is nearly absent and the atmospheric circulation anomalies are relatively weak over East Asia. Thus, the connection between the northern component of EAWM and the ONDJ TP snow cover is weak during this period. For the recent two winters (2018/19 and 2019/20), the snow cover on the Tibetan Plateau is extremely above normal, while the value of Nindex is 0.12 and −1.62, respectively, for 2018/19 and 2019/20 winters, which is consistent with the weak statistical relationship during 1999–2016. Note that the percent variance of northern component of EAWM variability explained by ONDJ TP SCI is about 32% during 1979–1998. In addition, the northern component of EAWM is also affected by other factors, such as autumn Arctic sea ice concentration change (Chen et al., 2014b) and summer North Atlantic SST anomalies (Chen et al., 2019).
The analysis of Wang et al. (2019) illustrated that the opposite-sign sea surface temperature (SST) anomalies in the eastern North Pacific and western North Atlantic play an important role in the formation of snow cover anomalies over the central eastern TP in autumn. The SST anomalies in these regions may excite a wave train that extends to the TP and causes anomalous circulation and vertical motion, leading to anomalous snowfall over the eastern TP. It is worthy to note that the spatial distribution of atmospheric circulation anomalies over the North Pacific in Figures 5A,B shows a North Pacific Oscillation/western Pacific (WP)-like structure. Previous studies have already reported that the TP snow cover anomalies can lead to a WP-like response (e.g., Wang Z. et al., 2017; Liu et al., 2020). Why did the ONDJ TP snow forcing trigger a winter PNA response in 1979–1998 but a WP response in 1999–2016? Additionally, why is the persistence of TP snow cover anomalies from autumn to winter strong in 1979–1998 but weak in 1999–2016? Further studies are needed to address the above issues.
Data Availability Statement
The original contributions presented in the study are included in the article/supplementary material, further inquiries can be directed to the corresponding author.
Author Contributions
CZ and WR designed this manuscript; CZ and WZ performed the data analysis; CZ drafted the manuscript; WR performed manuscript review and editing.
Funding
This study is supported by the National Natural Science Foundation of China grants (41705051, 41530425, 41775080, and 41721004), Scientific Research Fund of Chengdu University of Information Technology (KYTZ201726), and the China Postdoctoral Science Foundation Grant (2019M660762, and 2020T130640).
Conflict of Interest
The authors declare that the research was conducted in the absence of any commercial or financial relationships that could be construed as a potential conflict of interest.
References
Barnett, T., Düenil, L., Schlese, U., Roeckner, E., and Latif, M. (1989). The Effect of Eurasian Snow Cover on Regional and Global Climate Variations. J. Atmos. Sci. 46, 661–686. doi:10.1175/1520-0469(1989)0462.0.CO;2
Blanford, H. F. (1884). On the Connection of the Himalaya Snowfall with Dry Winds and Seasons of Drought in India. Proc. Roy. Soc. Lond. 37, 3–22. doi:10.1098/rspl.1884.0003
Brodzik, M., and Armstrong, R. (2013). Data from: Northern Hemisphere EASE-Grid 2.0 Weekly Snow Cover and Sea Ice Extent, Version 4. National Snow and Ice Data Center. Available at: https://doi.org10.5067/P7O0HGJLYUQU.
Chen, Z., Wu, R., and Chen, W. (2014a). Distinguishing Interannual Variations of the Northern and Southern Modes of the East Asian winter Monsoon. J. Clim. 27, 835–851. doi:10.1175/JCLI-D-13-00314.1
Chen, Z., Wu, R., and Chen, W. (2014b). Impacts of Autumn Arctic Sea Ice Concentration Changes on the East Asian winter Monsoon Variability. J. Clim. 27, 5433–5450. doi:10.1175/JCLI-D-13-00731.1
Chen, Z., Wu, R., and Wang, Z. (2019). Impacts of Summer North Atlantic Sea Surface Temperature Anomalies on the East Asian Winter Monsoon Variability. J. Clim. 32, 6513–6532. doi:10.1175/JCLI-D-19-0061.1
Duchon, C. E. (1979). Lanczos Filtering in One and Two Dimensions. J. Appl. Meteorol. 18, 1016–1022. doi:10.1175/1520-0450(1979)018<1016:LFIOAT>2.0.CO;2
Eaton, B. (2011). User’s Guide to the Community Atmosphere Model CAM-5.1. NCAR. Available at: http://www.cesm.ucar.edu/models/cesm1.0/cam/docs/ug5_1/ug.html.
Fasullo, J. (2004). A Stratified Diagnosis of the Indian Monsoon-Eurasian Snow Cover Relationship. J. Clim. 17, 1110–1122. doi:10.1175/1520-0442(2004)017<1110:asdoti>2.0.co;2
Kanamitsu, M., Ebisuzaki, W., Woollen, J., Yang, S. K., Hnilo, J. J., Fiorino, M., et al. (2002). NCEP-DOE AMIP-II Reanalysis (R-2). Bull. Amer. Meteorol. Soc. 83, 1631–1643. doi:10.1175/bams-83-11-1631(2002)083<1631:nar>2.3.co;2
Lau, K. M., and Chang, C. P. (1987). “Planetary Scale Aspects of winter Monsoon and Teleconnections,” in Monsoon Meteorology. Editors C. P. Chang, and T. N. Krishnamurti (New York: Oxford University Press).
Lin, H., and Wu, Z. (2011). Contribution of the Autumn Tibetan Plateau Snow Cover to Seasonal Prediction of North American winter Temperature. J. Clim. 24, 2801–2813. doi:10.1175/2010JCLI3889.1
Liu, G., Ji, L. R., Sun, S. Q., and Xin, Y. F. (2013). A Discussion on the East Asian winter Monsoon index-differences between the East Asian winter Monsoon at the Mid-high Latitudes and that at the Low Latitudes (In Chinese). Chin. J. Atmos. Sci. 37, 755–764. doi:10.3878/j.issn
Liu, G., Ji, L. R., Sun, S. Q., and Xin, Y. F. (2012). Low- and Mid-high Latitude Components of the East Asian winter Monsoon and Their Reflecting Variations in winter Climate over Eastern China. Atmos. Ocean. Sci. Lett. 5, 195–200. doi:10.1080/16742834.2012.11446985
Liu, S., Wu, Q., Ren, X., Yao, Y., Schroeder, S. R., and Hu, H. (2017). Modeled Northern Hemisphere Autumn and winter Climate Responses to Realistic Tibetan Plateau and Mongolia Snow Anomalies. J. Clim. 30, 9435–9454. doi:10.1175/JCLI-D-17-0117.1
Liu, S., Wu, Q., Schroeder, S. R., Yao, Y., Zhang, Y., Wu, T., et al. (2020). Near-Global Atmospheric Responses to Observed Springtime Tibetan Plateau Snow Anomalies. J. Clim. 33, 1691–1706. doi:10.1175/JCLI-D-19-0229.1
Qian, Q., Jia, X., and Wu, R. (2019). Changes in the Impact of the Autumn Tibetan Plateau Snow Cover on the Winter Temperature over North America in the Mid‐1990s. J. Geophys. Res. Atmos. 124, 10321–10343. doi:10.1029/2019JD030245
Walland, D. J., and Simmonds, I. (1996). Modelled Atmospheric Response to Changes in Northern Hemisphere Snow Cover. Clim. Dyn. 13, 25–34. doi:10.1007/s003820050150
Wang, B., Wu, Z., Chang, C. P., Liu, J., Li, J., and Zhou, T. (2010). Another Look at Interannual-To-Interdecadal Variations of the East Asian winter Monsoon: the Northern and Southern Temperature Modes. J. Clim. 23, 1495–1512. doi:10.1175/2009JCLI3243.1
Wang, C., Yang, K., Li, Y., Wu, D., and Bo, Y. (2017a). Impacts of Spatiotemporal Anomalies of Tibetan Plateau Snow Cover on Summer Precipitation in Eastern China. J. Clim. 30, 885–903. doi:10.1175/JCLI-D-16-0041.1
Wang, Z., Wu, R., Chen, S., Huang, G., Liu, G., and Zhu, L. (2018). Influence of Western Tibetan Plateau Summer Snow Cover on East Asian Summer Rainfall. J. Geophys. Res. Atmos. 123, 2371–2386. doi:10.1002/2017JD028016
Wang, Z., Wu, R., Duan, A., and Qu, X. (2020). Influence of Eastern Tibetan Plateau spring Snow Cover on North American Air Temperature and its Interdecadal Change. J. Clim. 33, 5123–5139. doi:10.1175/JCLI-D-19-0455.1
Wang, Z., Wu, R., and Huang, G. (2017b). Low-frequency Snow Changes over the Tibetan Plateau. Int. J. Climatol 38, 949–963. doi:10.1002/joc.5221
Wang, Z., Wu, R., Zhao, P., Yao, S. L., and Jia, X. (2019). Formation of Snow Cover Anomalies over the Tibetan Plateau in Cold Seasons. J. Geophys. Res. Atmos. 124, 4873–4890. doi:10.1029/2018JD029525
Wu, Q., Hu, H., and Zhang, L. (2011). Observed Influences of Autumn-Early winter Eurasian Snow Cover Anomalies on the Hemispheric PNA-like Variability in winter. J. Clim. 24, 2017–2023. doi:10.1175/2011JCLI4236.1
Wu, R., and Kirtman, B. P. (2007). Observed Relationship of spring and Summer East Asian Rainfall with winter and spring Eurasian Snow. J. Clim. 20, 1285–1304. doi:10.1175/JCLI4068.1
Wu, T. W., and Qian, Z. A. (2003). The Relation between the Tibetan winter Snow and the Asian Summer Monsoon and Rainfall: An Observational Investigation. J. Clim. 16, 2038–2051. doi:10.1175/1520-0442(2003)016<2038:TRBTTW>2.0.CO;2
Xiao, Z., and Duan, A. (2016). Impacts of Tibetan Plateau Snow Cover on the Interannual Variability of the East Asian Summer Monsoon. J. Clim. 29, 8495–8514. doi:10.1175/JCLI-D-16-0029.1
Yasunari, T., Kitoh, A., and Tokioka, T. (1991). Local and Remote Responses to Excessive Snow Mass over Eurasia Appearing in the Northern Spring and Summer Climate. J. Meteorol. Soc. Jpn. 69, 473–487. doi:10.2151/jmsj1965.69.4_473
Zhao, H., and Moore, G. W. K. (2004). On the Relationship between Tibetan Snow Cover, the Tibetan Plateau Monsoon and the Indian Summer Monsoon. Geophys. Res. Lett. 31, L14204. doi:10.1029/2004GL020040
Keywords: East asian winter monsoon, tibetan plateau snow cover, persistence of snow cover anomalies, interdecadal change, aleutian low
Citation: Chen Z, Wu R and Wang Z (2021) Impact of Autumn-Winter Tibetan Plateau Snow Cover Anomalies on the East Asian Winter Monsoon and Its Interdecadal Change. Front. Earth Sci. 9:699358. doi: 10.3389/feart.2021.699358
Received: 23 April 2021; Accepted: 28 June 2021;
Published: 07 July 2021.
Edited by:
Yuqing Wang, University of Hawaii at Manoa, United StatesCopyright © 2021 Chen, Wu and Wang. This is an open-access article distributed under the terms of the Creative Commons Attribution License (CC BY). The use, distribution or reproduction in other forums is permitted, provided the original author(s) and the copyright owner(s) are credited and that the original publication in this journal is cited, in accordance with accepted academic practice. No use, distribution or reproduction is permitted which does not comply with these terms.
*Correspondence: Zhang Chen, Y2hlbnpoYW5nQGN1aXQuZWR1LmNu