 Xueling Liu1
 Jinkai Yan
- 1School of Geological Engineering and Geomatics, Chang’an University, Xi’an, China
- 2Chinese Academy of Geological Sciences, Beijing, China
- 3China Institute of Geo-Environmental Monitoring, Beijing, China
- 4Urban Construction School, Beijing City University, Beijing, China
In this study, a large-scale model test was performed to investigate the effect of the single-row and double-row micropiles on the landside stabilization. For two different testing configuration settings, the bending moment along the micropiles, failure mode, and force condition were captured and compared. It is found that the landslide thrust on piles was distributed in a triangular shape. The piles in the front row carried greater pressure than the piles in the rear row. The resistance of the sliding body behind the pile was distributed in a parabolic shape, and mainly concentrated on the middle of the pile. The piles were destroyed due to the combined shearing and bending impact applied near the slipping surface. The boundary of the failure zone was from the position of two times the pile diameter under the slipping surface to the position of two and a half times the pile diameter above the slipping surface. Under the action of the landslide, each row of piles deformed at the same time. The capability of landslide stabilization for double-row piles was better than that of a single-row pile. The sections of the pile above slide surface were mainly subjected to negative bending moments and were distributed mainly within the pile length range of one-third of the anti-sliding section above the sliding surface. The pile body of the embedded section located in the range of ten times the pile diameter below the sliding surface was subjected to a positive bending moment.
Introduction
Micropiles are defined as small-diameter, drilled piles composed of injected grout with some form of steel reinforcement placed in the center of grout to resist the load (Bruce et al., 1995; Bruce and Juran, 1997; Sun et al., 2013). The central reinforcing element is either a high-strength steel bar or a tube that is secured in the grout injected under high pressure to improve bonding with the surrounding soil. Micropiles can be virtually installed at any ground condition and at any inclination (William and Howe, 2010). Micropiles have been widely used in many applications of ground improvement to increase the bearing capacity and to reduce the settlement, particularly in strengthening existing foundations (Meyerhof and Division, 1976; FHWA, 2005). Micropiles have numerous advantages compared with the other ground improvement method, especially for the emergency risk-elimination and construction projects, including the rapid construction process, flexible configuration settings, and limited disturbance to the improved structures (Alnuaim et al., 2016). Therefore, the applications of micropiles have been rapidly increasing over the past few decades.
Recently, micropiles were used to reduce the probability of landslides or to prevent them. One of the major concern was to evaluate the lateral loads acting on the micropiles, which will provide crucial information for the design in practice. Commonly, the stability of reinforced by micropiles was analyzed through analytical and numerical methods by incorporating the stability of slopes without reinforcement with the resisting force provided by the stabilizing piles (Bransby and Springman, 1999; Mokwa and Duncan, 2001; Shahrour and Ata, 2002; Rollins Kyle et al., 2003; Richards and Rothbauer, 2004; Alnuaim et al., 2015). However, these methods can only provide the ultimate state, without the development of pile resistance with the soil movement. Thus, an in situ field model test was one of the important methods to better understand the micropile–slope movement reaction. For instance, Watanabe et al. (2017) and Hwang et al. (2017) performed a series of model test to study the bearing capacity of a micropile raft on slope stabilization. Still, more case studies relating to the slope stabilization with micropiles are interesting to the geotechnical community.
Because of a relatively large length–diameter ratio compared with that of traditional piles, the pattern of stress distribution and breaking mechanisms of the micropiles under the influence of a lateral force derived from a landslide sliding movement are also different from that of the traditional piles (Salgado et al., 2014; Han et al., 2015; Gianpiero, 2016). For landslide stabilization, the micropiles are mostly designed and constructed in rows of different layout configurations. Some other works have illustrated the stress distributions within a landslide or a foundation reinforced by micropiles (Yan et al., 2011; Bai et al., 2016; Zeng et al., 2020). However, the sliding force on the micropile or micropile group was still unclear. Thus, the stress distribution and failure mechanisms of an individual micropile in comparison with rows of micropile were further investigated in this research.
In this study, to further advance the current understanding on the bearing strength, improvement performance, and failure mechanism of the micropiles with different configuration settings, a large-scale physical model experiment was conducted to test the interaction between micropiles and landslide under a multistage loading process. The landslide model is made of loess, and the sliding surface was produced artificially so that the applied micropiles could play a critical contribution in the anti-sliding mechanism. For two different testing configuration settings, the distribution of bending resistance along the instrumented micropile, destruction occurrence on the body of micropile, and the improved performance of the landslide were captured and compared.
Testing Site Characterization and Micropiles for Remediation
Testing Site Characterization
The landslide model is mainly established by using the loess materials from Xi’an city, Shannxi Province, which is located on the Loess Plateau in China. Table 1 shows the basic physical and mechanical properties of the loess. The loess was compacted layer by layer to a target value with a density of 1.81 g/cm3 and the moisture content of approximately 15%. For each layer’s construction, the penetration test was performed after compaction to ensure that the relative density of landslide materials reached the design criterion; after the slope was filled, the slope surface was made according to the designed shape, and the excess soil was removed. In order to reduce the boundary effect, three through grooves were designed in the sliding body and filled with sand. Figure 1 shows the photo of the preparing stage of field experimentally.

TABLE 1. Basic physical and mechanical properties of the loess.
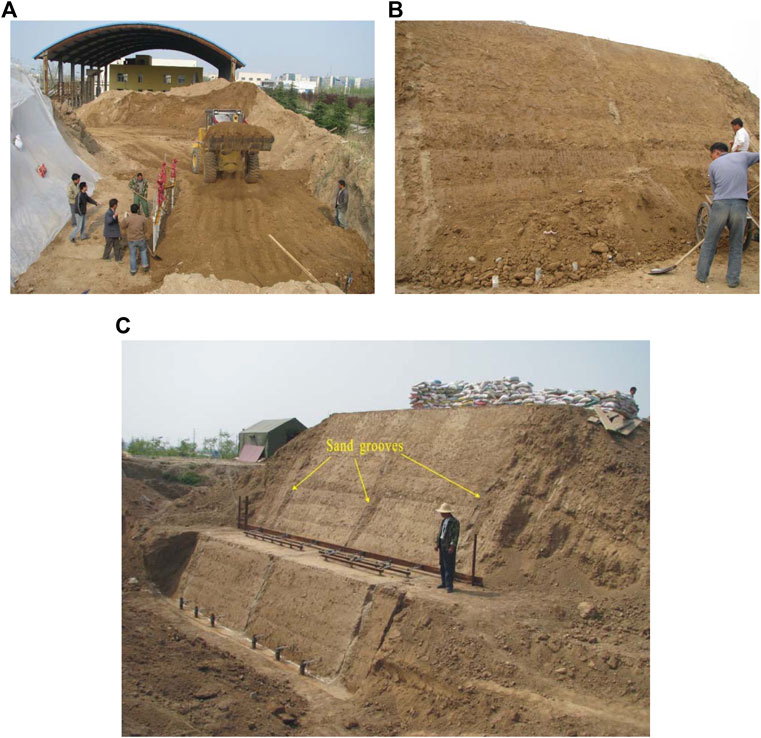
FIGURE 1. Manufacturing process of the sliding body: (A) layered filling of soil, (B) removing excess soil, and (C) the completed test model.
Slipping surface is an important issue in the model establishment to allow the inserted micropiles as anti-sliding stiffer elements to function appropriately to prevent the large deformation of the landslide model. The shape of the slipping surface is arc-shaped. After the completion of slipping bed, the slipping surface was made by covering the artificially made arc-shaped slipping bed with double layers of plastic membrane. On the basis of the no-pile test, we determined the load and the landslide thrust when the sliding body was in the ultimate equilibrium state using the reverse calculation: c = 3.5 kPa and φ = 16°.
The micropiles used in this study were made of concrete columns and reinforced with steel bars. The strength grade of the concrete columns and cement is C25 and 421-5R, respectively, based on the Chinese National Code. The total length of the concrete column is 4 m, and its diameter is 60 mm, corresponding to the length and diameter of 12 m and 180 mm in field, respectively. The strain gauge was then glued onto the micropile. During the backfill process, the soil among the inserted concrete columns should be compacted appropriately so that the installed earth pressure gauges can measure the earth pressure changes effectively.
Note that the model test was designed based on the similarity theory in comparison with the full-scale field test (Luo and Ge, 2008), with a geometric similarity ratio of 3 and the elastic modulus similarity ratio of 1. Hence, the similarity ratio of linear load on the pile body and concentrated force on the pile body were 3 and 9, respectively. Accordingly, the similarity ratio of stress and strain of the pile body was 1. The similarity ratio for the cross-sectional area of the pile body was 9.
Micropiles for Remediation
The cross sections and plan view for double rows model test are shown in Figures 2, 3, respectively. In the model, the micropiles were installed in the front part of the landslide. Two testing cases corresponding to single and double rows of the micropile setup were performed. For the single-row configuration (Case A), the distance between each micropile was 0.48 m, and totally, seven piles were installed. The top of the micropiles were connected together by using a steel bar. For further analysis, seven piles were labeled as D1 to D7 from the right to left. For the double-row configuration (Case B), totally seven piles were installed in two rows, and the distance among the pile in each row is 0.96 m. The vertical distance between the rows is 0.36 m. In each row, the piles were connected together using a steel bar. For further analysis, seven piles were also labeled as S1 to S7 from the right to the left.
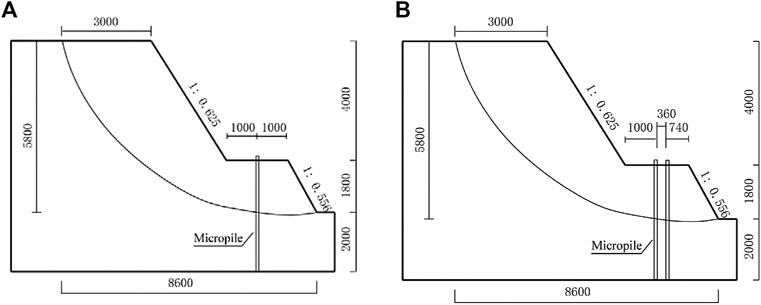
FIGURE 2. Cross sections of the models for two configurations: single row and double rows (unit: mm).
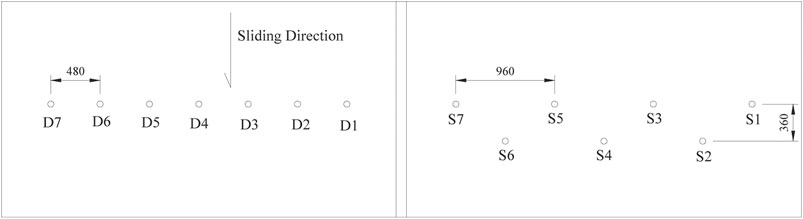
FIGURE 3. Plain view of the models for two configurations: single row and double rows (unit: mm).
Instrumentations and Load Applications
Pressure Measurements for the Installed Piles
The pressure gauges were the vibrating string earth pressure cell. To measure the earth pressure acting on the pile in different cases, for Case A (single-row configuration), pile D4 which is located in the middle of the landslide model was selected as the testing pile. Nine soil pressure gauges were applied along the pile depth in the vertical direction in the front and after the pile. For Case B (double-row configuration), piles S4 and S5 were selected as the testing piles, and nine soil pressure gauges were applied in the same manner as described in Case A. The layout of the pressure gauges in the model is depicted in Figure 4.
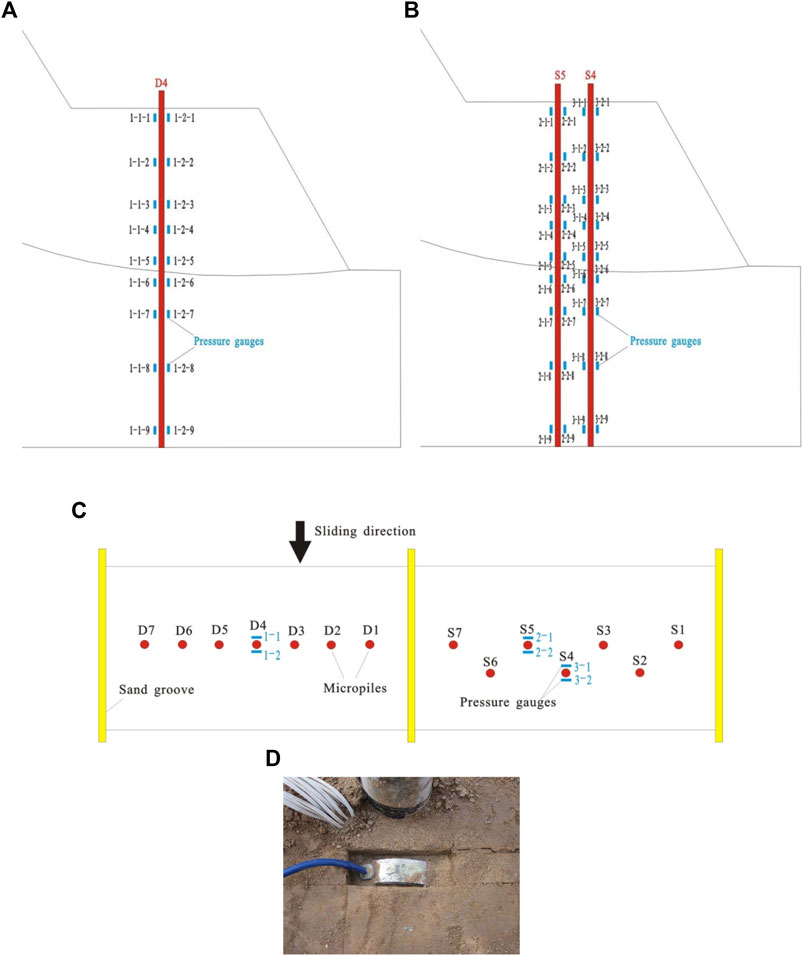
FIGURE 4. Layout of the pressure gauges in the model: (A) distribution of the pressure gauges in the vertical direction along the pile in a single-row model, (B) distribution of the pressure gauges in the vertical direction along the pile in a double-row model, (C) distribution of the pressure gauges in a plain view, and (D) embedded pressure gauges.
Strain Measurements of the Micropiles
To test the bending moment of the micropile, strain gauges were pasted in pairs before and after the longitudinal bar of the tested piles. The spacing of the strain gauges is 10 cm. After measuring the strains of different parts of the micropile, the bending moments can be obtained by Eq 1:
In the formula, M is the bending moment, N m; EI is the flexural rigidity of the micropile, N m2;
Displacement Measurements
In both cases, multiple displacement gauges were placed on the top of the piles as well as at the sliding surface. The displacement gauges were placed perpendicular to the sliding direction of the landslide, fixed with a steel beam anchored to the soil (Bian et al., 2019; Bian et al., 2020). The purpose is to observe the displacement of the pile group and slope deformation.
Load Applications
The layers of sandbags used as the multistage loading were placed on the top of the landslide model. To normalize the effect of the loading area, the load presented herein was expressed as load/area. Hence, the unit of load reported was expressed as kN/m2, that is, kPa. Each loading increment is 8 kPa, and the total loading is 40 kPa. Therefore, five stages of load were applied on the top of the landslide. It is important to note that before applying the next loading increment, the measurements of earth pressure, stress conditions of the piles, and displacement at various measuring position should remain stable under the current loading condition.
Results and Discussions
Failure Mechanisms of the Micropiles
Figures 5, 6 depicts the damage of micropile in single- and double-row configurations, respectively. Through excavation, it was found that the landslides slide along the artificially made slipping surface, and no other shear cracks were found inside the sliding body. The failure mechanisms for all tested piles were basically the same, and the major breakage all occurred in the pile segment near the slipping surface. The other part of the piles remains with the good integrity and vertical. For most testing piles, the broken segment was from 9 cm below the slipping surface to 15 cm above the slipping surface. Within this range, the piles were bended, and large cracks could be observed. The failure mechanism is the combination of shearing and bending failure. Especially for pile D5, the pile was mainly sheared to failure, and shearing deformation that occurred at the slipping surface was about 5 mm for the pile. For double-row pile configuration, the piles in the front rows were destroyed more severely than the piles in the rear row. To conclude the failure mechanisms of the row piles for the anti-sliding measure, for the same ratio of reinforcing bars, both the individual pile and piles in group could potentially fail by shearing and bending that occurred near the slipping surface.
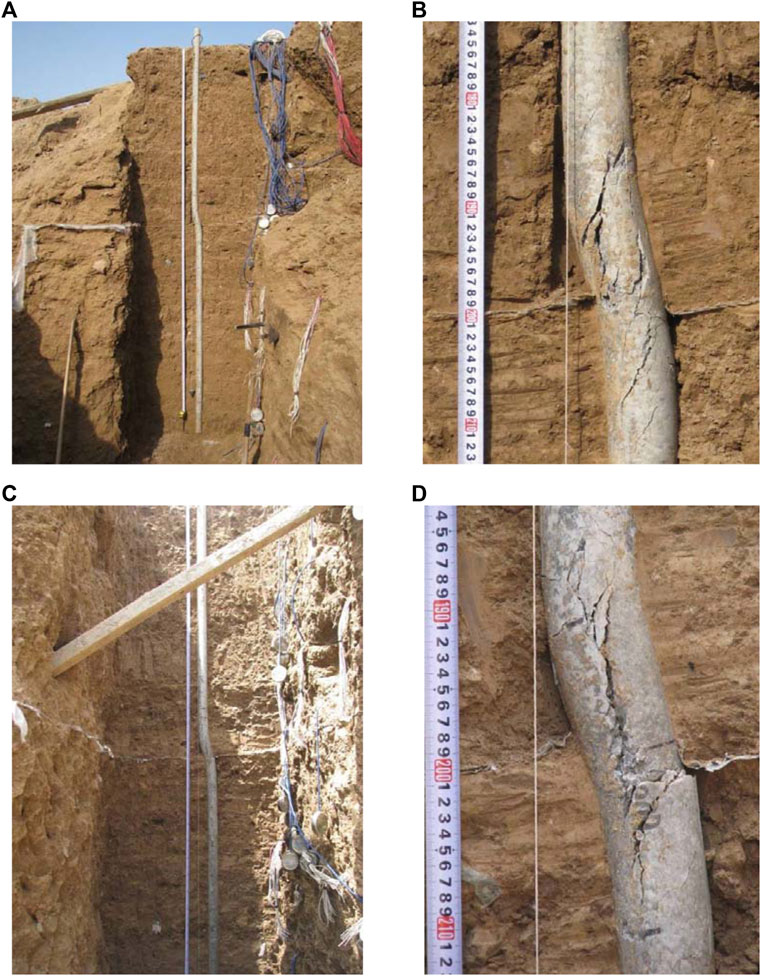
FIGURE 5. The damage of piles in single-row configuration: (A) overall damage of pile D6, (B) breakage of pile D6 near the slipping surface, (C) overall damage of pile D5, and (D) breakage of pile D5 near the slipping surface.
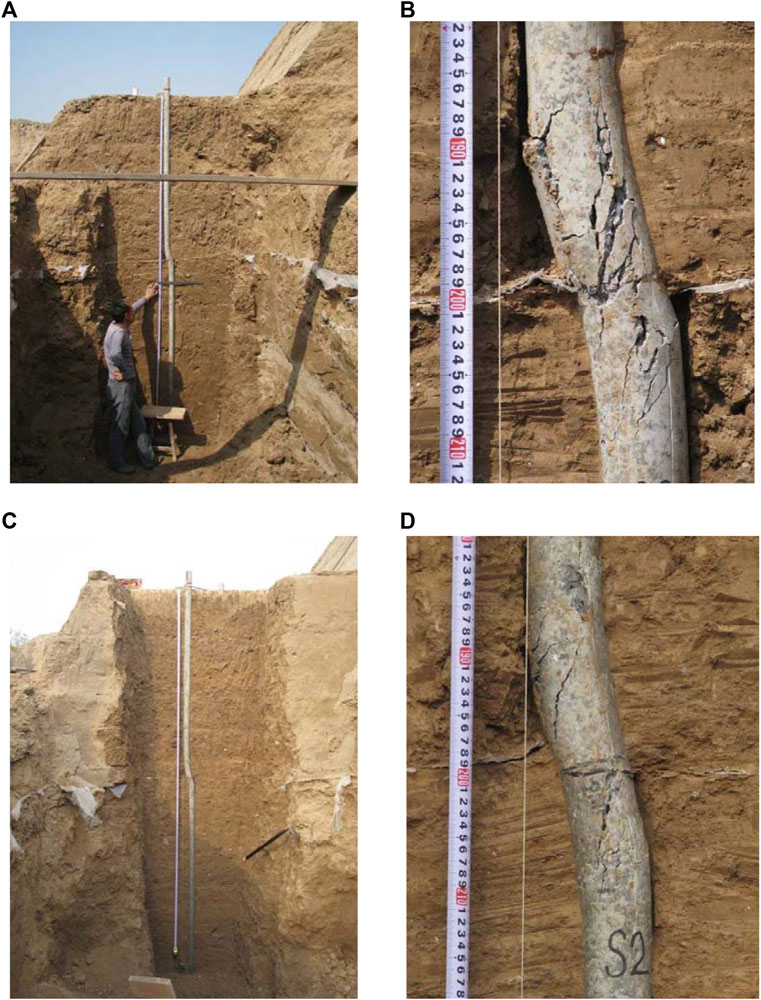
FIGURE 6. The damage of piles in double-row configuration: (A) overall damage of the piles in the front row, (B) breakage of the pile near the slipping surface in the front row, (C) overall damage of the piles in the rear row, and (D) breakage of the pile near the slipping surface in the rear row.
Variation of Earth Pressure
Figure 7 shows the horizontal earth pressure variations over time measured in the soil before and after pile D4, which is in the middle of the single row test. Figure 8 shows the distribution of earth pressure on pile D4. The section of the pile above the slipping surface was regarded as the anti-sliding segment. The section of the pile under the slipping surface was regarded as the anchoring section. Therefore, the earth pressure variation over time can be interpreted depending on the measuring positions and micropile configuration, such as 1) in front of the anti-sliding segment of the pile, 2) behind the anti-sliding segment of the pile, 3) in front of the anchoring section of the pile, and 4) behind the anchoring segment of the pile.
1) Distribution of the landslide thrust force on pile D4
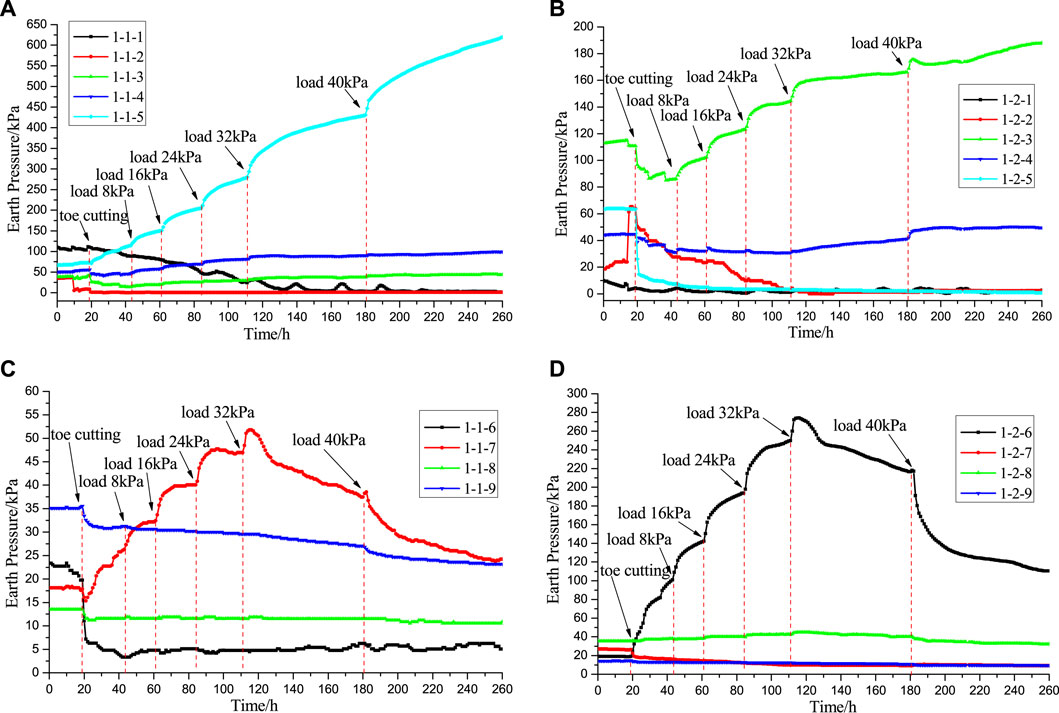
FIGURE 7. Earth pressure measured in front of and behind pile D4: (A) earth pressure in front of the anti-sliding segment of pile D4, (B) earth pressure behind the anti-sliding segment of pile D4, (C) earth pressure in front of the anchoring segment of pile D4, and (D) Earth pressure behind the anchoring segment of pile D4.
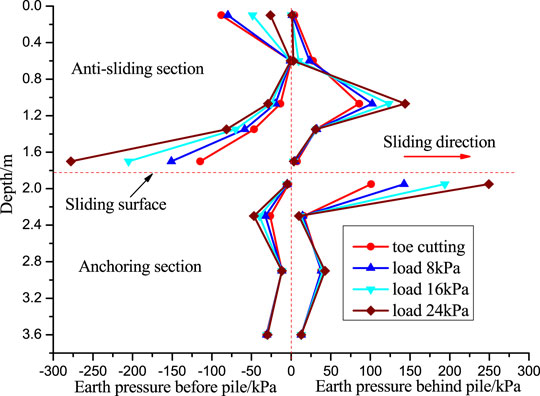
FIGURE 8. Distribution of the earth pressure on pile D4.
Distribution of the landslide thrust force on pile D4 is shown in Figures 7A,8, including measuring points 1-1-1, 1-1-2, 1-1-3, 1-1-4, and 1-1-5. After the toe of the landslide was excavated, the earth pressure value at the positions of 0.15 m (1-1-5) and 1.75 m (1-1-1) above the slipping surface started increasing and decreasing, respectively, which indicated that the pressure acting on the pile changed and certain deformations occurred to the piles. After loading was applied on the top of the landslide, gradual increases were observed from the measurements of earth pressure gauges placed at the position of 0.15 m above the slipping surface (1-1-5). This was caused by the compression of the soil in front of the pile near the sliding surface with the deformation of the micropile. During the loading process, the earth pressure values at the positions of 0.5 m (1-1-4) and 0.78 m (1-1-4) above the slipping surface increased slightly. The earth pressure value at the position of 1.75 m above the slipping surface continued decreasing in the loading process and approached to 0 when the total loading reached 32 kPa. No significant variations were made to the earth pressure at the position of 1.25 m (1-1-2) above the slipping surface during the loading process. Finally, the landslide thrust was distributed approximately in a triangular shape, and the earth pressure near the sliding surface was relatively large.
2) Resistance from the sliding body behind pile D4
Resistance from the sliding body behind pile D4 is shown in Figures 7B,14, including measuring points 1-2-1, 1-2-2, 1-2-3, 1-2-4, and 1-2-5. After excavating the toe of the landslide, the earth pressure of all measurement points decreased, which clearly indicated that the piles started to carry sliding pressure, and appeared to be deformed. After loading was applied on the top of the landslide, the earth pressure at the positions of 0.5 m above the slipping surface (1-2-4) remained approximately stable, and slightly increased when loading exceeded 32 kPa. At the position of 0.78 m above the slipping surface (1-2-3), the earth pressure gradually increased, which indicated that the pile deformed and compressed the soil in the rear. At the position of 1.25 m above the slipping surface (1-2-2), the earth pressure reduced gradually and basically reduced to zero when loading achieved 32 kPa. The earth pressure at the measuring point of 1.75 m above the sliding surface (1-2-1) was always close to zero. Overall, earth pressures measured in the soil close to the middle of loading segment were significant and varied largely during the loading process and were very small in the soil near the slipping surface and the pile top. The resistance of the sliding body behind the pile can be regarded as a parabolic distribution.
3) Resistance from the sliding bed in front of the pile D4
Resistance from the sliding bed in front of the pile D4 is shown in Figures 7C,14, including measuring points 1-1-6, 1-1-7, 1-1-8, and 1-1-9. After the slope toe excavation was completed, earth pressures increased at the positions of 0.45 m under the slipping surface (1-1-7) and decreased at the other three depths. After load was being applied, the earth pressure continuously increased at the depths of 0.45 m under the slipping surface, and remained roughly unchanged for the other three measuring depths. Under the action of loading, the landslide deformed, driving the pile body in the anti-sliding segment to deform along the sliding direction. In the early stage of loading, the micropile can be regarded as an elastic rod. Therefore, the pile body near 0.45 m below the sliding surface squeezed the sliding bed against the front edge, which caused the earth pressure at the position to increase. When the loading reached 32 kPa, the earth pressure at the depths of 0.45 m under the slipping surface suddenly reduced. It indicated that the micropile damaged at this time, and the deformation of pile recovered.
4) Resistance from the sliding bed behind pile D4
Resistance from the sliding bed behind pile D4 is shown in Figures 7D,14, including measuring points 1-2-6, 1-2-7, 1-2-8, and 1-2-9. The earth pressure measured at the position of 0.1 m below the slipping surface (1-2-6) intensively increased with the landslide toe excavation, and indicated the pile in the anchoring segment started deformation to compress the soil in the back under the sliding force. After the loading was applied, the earth pressure at 0.1 m below the sliding surface continued to increase until the loading reached 32 kPa and then it began to decrease rapidly. This indicated failure of the pile; accordingly, the earth pressure also reduced due to the rebounding influences. At the other positions (1-2-7, 1-2-8, and 1-2-9) along the depth, earth pressure values were much smaller and remained stable during the loading process. The resistance from the sliding bed behind the pile was concentrated mainly near the sliding surface.
As shown in Figures 9–12, pile S5 and pile S4 behaved in a similar way as pile D4. This earth pressure on the piles can be summarized as follows:
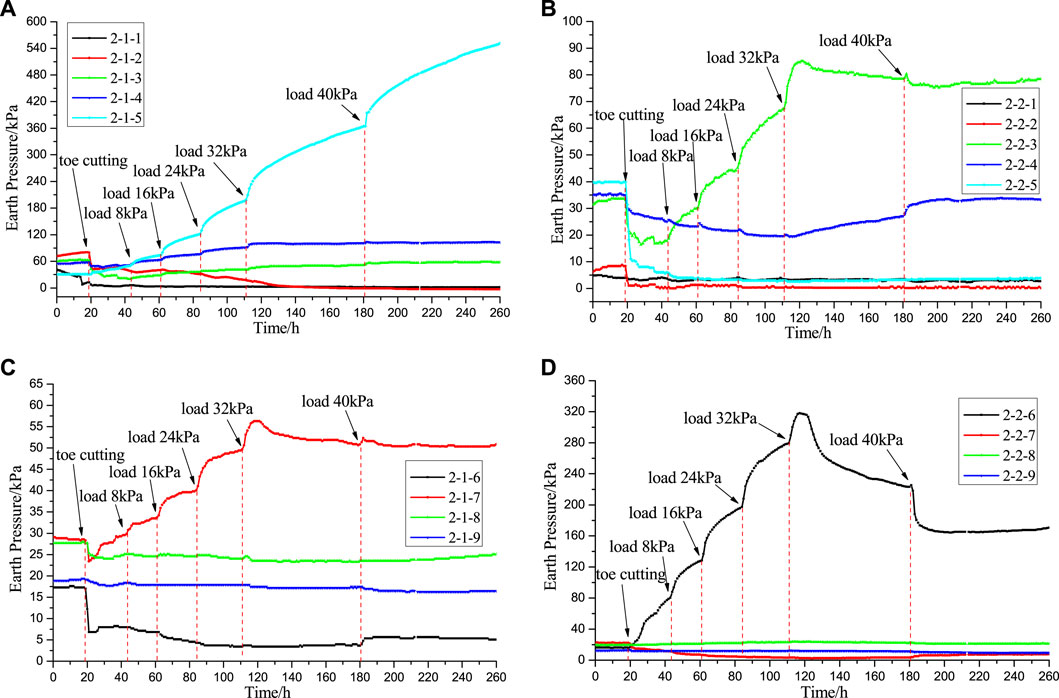
FIGURE 9. Earth pressure measured in front of and behind pile S5: (A) earth pressure in front of the anti-sliding segment of pile S5, (B) earth pressure behind the anti-sliding segment of pile S5, (C) earth pressure in front of the anchoring segment of pile S5, and (D) earth pressure behind the anchoring segment of pile S5.
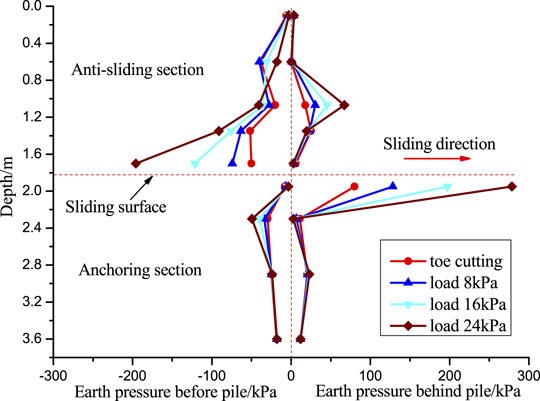
FIGURE 10. Distribution of the earth pressure on pile S5.
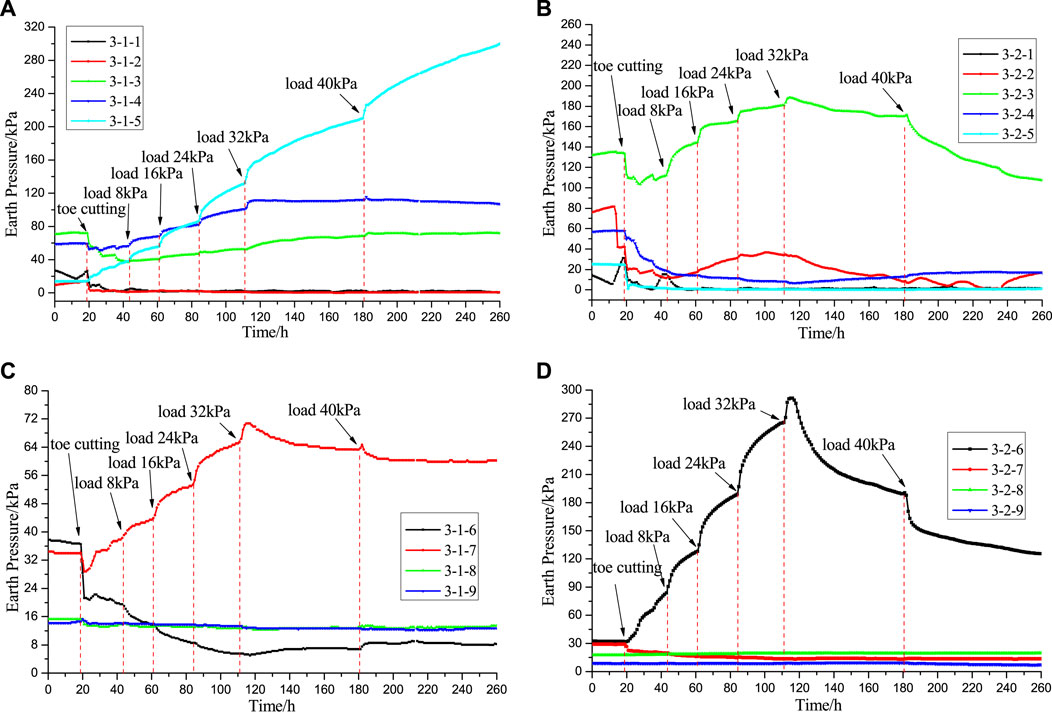
FIGURE 11. Earth pressure measured in front of and behind pile S4: (A) earth pressure in front of the anti-sliding segment of pile S4, (B) earth pressure behind the anti-sliding segment of pile S4, (C) earth pressure in front of the anchoring segment of pile S4, and (D) earth pressure behind the anchoring segment of the pile S4.
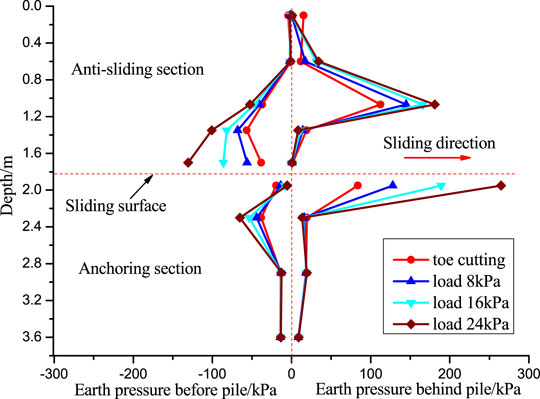
FIGURE 12. Distribution of the earth pressure on pile S4.
1) The landslide thrust on the micropiles was in an approximate triangular distribution, and the earth pressure near the sliding surface was larger. The landslide thrust on the pile of front row (pile S5) was larger than that on the pile of the rear row (pile S4).
2) The resistance of the sliding body behind the pile can be regarded as a parabolic distribution and mainly concentrated in the middle of the pile. The resistance of the sliding body behind the front pile was larger than that behind the rear pile.
3) The resistance of the sliding bed in front of the pile was relatively small, mainly located near 0.45 m under the sliding surface.
4) The resistance from anterior sliding bed was distributed mainly near the sliding surface. The earth pressure near the sliding surface varied greatly, whereas the earth pressure at the other measurement points varied slightly.
5) The earth pressure curves of the two rows of piles had the same change with time, which indicated that the two rows of piles deformed by pressure at the same time.
Variation of Displacement at Measurement Points
Figure 13 shows the displacement evolution during loading. The displacement at the top of pile and the toe of landslide increased slowly in the early stage of loading. As the load increased, the displacement changed faster. After each load, the displacement showed the law of rapid growth first and then gradually stabilized. The displacement at the toe of the landslide was greater than that at the top of the pile in two cases. Under the same load conditions, the displacement at the top of double-row piles was smaller than that at the top of a single-row pile, indicating that the anti-sliding effect of double-row piles was better than that of a single-row pile.
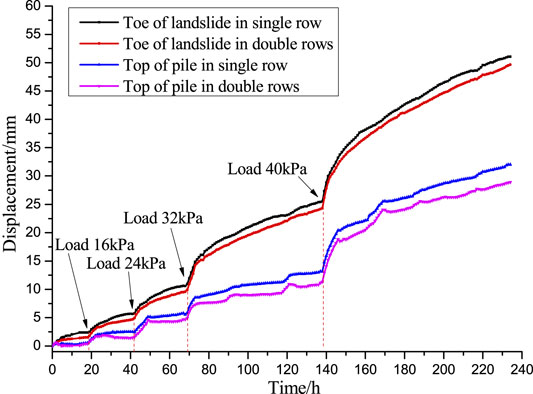
FIGURE 13. Displacement variation at the monitoring points.
Bending Moment of Pile
Based on strain gauge data, the bending moment distribution of each row of piles was obtained as shown in Figure 14.
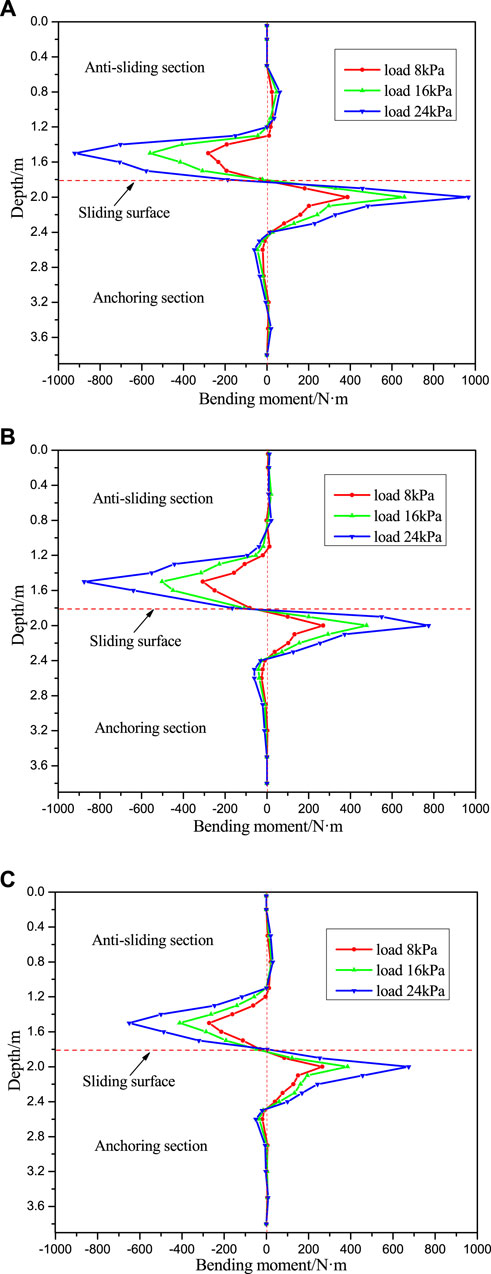
FIGURE 14. Bending moment of micropiles: (A) bending moment of pile D4, (B) bending moment of pile S5, and (C) bending moment of pile S4.
Although the bending moments of each row of piles were slightly different, the variation mode along the pile was the same. The anti-sliding sections of the pile body were mainly subjected to negative bending moments (positive tension on the sliding side and negative tension on the back side) and were distributed mainly within the pile length range of one-third of the anti-sliding section above the sliding surface (ten times the diameter of the pile). The maximum negative bending moment was at 0.3 m above the sliding surface (about five times the diameter of the pile). The pile body of the embedded section located in the range of 0.6 m below the sliding surface was subjected to a positive bending moment. The maximum positive bending moment occurred at 0.2 m below the sliding surface (about three times the diameter of the pile). The pile body from 0.6 m below the sliding surface to the bottom of the pile was subjected to a negative bending moment, while the pile body from 0.6 m above the sliding surface to the top of the pile was subjected to a positive bending moment, with a small magnitude.
Discussion
1) The effect of micropiles on the stability of slide slope: based on the Bishop method, the safety factor of the designed slope was 1 without the micropile when no surcharge was applied on the top of the slope. Once the double-row micropiles were implemented, the safety factor of the slope increased significantly. Table 2 shows the change in the safety factor of the slope at different surcharges. It can be observed that the safety factor of the slope increased about 20% when double-row micropiles were introduced without surcharge. When surcharge increased, the safety factor obviously decreased. At surcharge = 24 kPa, the safety factor declined to 1.0, corresponding to the critical state. This indicated that when double-row micropiles were implemented, the slope sustained 24 kPa surcharge by reinforcement with double-row micropiles. When the surcharge exceeded 24 kPa, the slope was unsafe with the safety factor lower than 1, showing a large displacement as shown in Figure 13. These findings confirmed that the influence of the micropile on landslide stabilization was significant and efficient.
2) Failure of micropiles: as shown in Figures 11,12,14, the failure mode of micropiles induced by landsides was mainly due to the coupled effect of bending and shearing near the shear surface. Hence, to increase the anti-bend and anti-shear stability of micropiles by adding more strengthened tendons near the slide surface was one of the efficient method to improve the safety factor of the slope in the design of micropiles on landslide stabilization. As illustrated in Figure 14, the area of reinforcement should be in the vicinity of eight times the micropile diameter around the slide surface.
3) Stress states of micropiles during landslide: during the design of micropiles, the determination of stress states was one of most important steps. Based on this model test, the landslide thrust on the micropiles was almost triangular distribution, while the anti-sliding force of micropiles distributed to be a parabolic curve. Hence, it is recommended to design the micropile based on these stress states in the field.

TABLE 2. hange in the safety factor of the slope at different surcharges.
Conclusion
In this study, the large-scale model test was performed to evaluate the single-row and double-row micropiles as anti-sliding measurements of a typical landslide. Following major conclusions can be made:
1) The safety factor of the slope increases from 1.0 to 1.21, when the double rows of micropiles are implemented. Moreover, the slope reinforced by a micropile can sustain 24 kPa surcharge on the top. This indicates that using micropiles to stabilize landslides is efficient.
2) The landslide thrust on piles was distributed in a triangular shape, and the earth pressure near the sliding surface was relatively large. The piles in the front row carried greater pressure than piles in the rear row.
3) The anti-sliding sections of the pile body were mainly subjected to negative bending moments and were distributed mainly within the pile length range of one-third of the anti-sliding section above the sliding surface. Hence, it is recommended to design the micropiles based on these stress states.
4) The failure mode of micropiles induced by landsides was mainly due to the coupled effect of bending and shearing near the shear surface in the vicinity of eight times the micropile diameter around the slide surface.
Data Availability Statement
The original contributions presented in the study are included in the article/Supplementary Material; further inquiries can be directed to the corresponding author.
Author Contributions
XL and JY analyzed, writing, and dealing with data; JY and LL conducted the model test; BT modified the formats. All authors have read and agreed to the published version of the manuscript.
Funding
The authors would like to give sincere thanks to the funding agencies that supported this research. This work was supported by the China Geological Survey Project (Grant nos. 1212010814016 and DD20190287), the Fundamental Research Funds for the Chinese Academy of Geological Science (no. JKY201909).
Conflict of Interest
The authors declare that the research was conducted in the absence of any commercial or financial relationships that could be construed as a potential conflict of interest.
Publisher’s Note
All claims expressed in this article are solely those of the authors and do not necessarily represent those of their affiliated organizations, or those of the publisher, the editors and the reviewers. Any product that may be evaluated in this article, or claim that may be made by its manufacturer, is not guaranteed or endorsed by the publisher.
References
Alnuaim, A. M., El Naggar, H., and El Naggar, M. H. (2015). Performance of Micropiled Raft in Sand Subjected to Vertical Concentrated Load: Centrifuge Modeling. Can. Geotech. J. 52 (1), 33–45. doi:10.1139/cgj-2014-0001
Alnuaim, A. M., El Naggar, M. H., and El Naggar, H. (2016). Numerical Investigation of the Performance of Micropiled Rafts in Sand. Comput. Geotechnics 77 (1), 91–105. doi:10.1016/j.compgeo.2016.04.002
Bai, M. Z., Du, Y. Q., Wang, X. Q., Qiu, S. M., and Tian, G. (2016). In Situ study on the Combined Strengthening Effects of Intensive Micropile Groups and Anchor-cable Ground Beam on Subgrade Slopes of Existing Roads. Int. J. Earth Sci. Eng. 9, 1038–1048.
Bian, X., Cui, Y. J., and Li, X. Z. (2019). Voids Effect on the Swelling Behaviour of Compacted Bentonite. Géotechnique 69 (7), 593–605. doi:10.1680/jgeot.17.p.283
Bian, X., Cui, Y. J., Zeng, L. L., and Li, X. Z. (2020). State of Compacted Bentonite inside a Fractured Granite cylinder after Infiltration. Appl. Clay Sci. 186, 105438. doi:10.1016/j.clay.2020.105438
Bransby, M. F., and Springman, S. (1999). Selection of Load-Transfer Functions for Passive Lateral Loading of Pile Groups. Comput. Geotechnics 24, 155–184. doi:10.1016/s0266-352x(99)00006-3
Bruce, D. A., and Juran, I. (1997). Drilled and Grouted Micropiles: State-Of-Practice Review (Washington, DC: US Federal Highway Administration. Publication FHWA-RD-96-017).
Bruce, D. A., DiMillio, A. F., and Juran, I. (1995). “Introduction to Micropiles: an International Perspective, Geotechnical Special Publication,” Proceedings of the Conference of the Geotechnical Engineering Division of the ASCE in Conjunction with the ASCE Convention, San Diego, CA, 50 Edn. (ASCE), 1–26.
FHWA (2005). Micropile Design and Construction Guidelines, Implementation Manual (United States: National Highway Institute, Department of Transportation, Federal Highway Administration).
Gianpiero, Russo. (2016). A Method to Compute the Non-linear Behaviour of Piles under Horizontal Loading. Soils and Foundations 56 (1), 33–43. doi:10.1016/j.sandf.2016.01.003
Han, F., Salgado, R., and Prezzi, M. (2015). Nonlinear Analyses of Laterally Loaded Piles - A Semi-analytical Approach. Comput. Geotechnics 70, 116–129. doi:10.1016/j.compgeo.2015.07.009
Hwang, T. H., Kim, K. H., Shin, J. H., and Jong-Ho, S. (2017). Effective Installation of Micropiles to Enhance Bearing Capacity of Micropiled Raft. Soils and Foundations 57, 36–49. doi:10.1016/j.sandf.2017.01.0031
Luo, X. Q., and Ge, X. R. (2008). Theory and Application of Model Test on Landslide. Beijing: China WaterPower Press. in Chinese.
Meyerhof, G. G., and Division, A. (1976). Bearing Capacity and Settlement of Pile Foundations. J. Geotechnical Eng. 102 (3), 195–228. doi:10.1061/ajgeb6.0000243
Mokwa, R. L., and Duncan, J. M. (2001). Laterally Loaded Pile Group Effects and P-Y Multipliers. ASCE J. Geotechnical Spec. Publ. 113, 728–742
Richards, T. D., and Rothbauer, M. J. (2004). “Lateral Loads on Pin Piles (Micropiles),” in Proceedings of sessions of the GeoSupport Conference: innovation and cooperation in the geo-industry, Orlando, Florida (ASCE), 158–174. doi:10.1061/40713(2004)7
Rollins Kyle, M., Johnson Steven, R., and Petersen Kris, T. (2003). “Static and Dynamic Lateral Load Behavior of Pile Groups Based on Full-Scale Testing[C],” in Proceedings of the International Offshore and Polar Engineering Conference, Honolulu, HI (International Society of Offshore ang Poalr Engineers).
Salgado, R., Tehrani, F. S., and Prezzi, M. (2014). Analysis of Laterally Loaded Pile Groups in Multilayered Elastic Soil. Comput. Geotechnics 62, 136–153. doi:10.1016/j.compgeo.2014.07.005
Shahrour, I., and Ata, N. (2002). Analysis of the Consolidation of Laterally Loaded Micropiles. Proc. Instit. Civil Eng. 6, 39–46. doi:10.1680/grim.2002.6.1.39
Sun, S. W., Wang, J. C., and Bian, X. L. (2013). Design of Micropiles to Increase Earth Slopes Stability. J. Cent. South. Univ. 20 (5), 1361–1367. doi:10.1007/s11771-013-1623-7
Watanabe, N., Hazarika, H., Sugahara, H., and Suzuki, Y. (2017). Reinforcing Effect of Multiple-Row Small Diameter Steel Pipe Pile on Slope Stability. Proc. 2nd Int. Conf. Adv. Pile Tech. Case Histories, Bali 1, B101-B108.
William, K., and Howe, S. M. (2010). Micropiles for Slope Stabilization. Biennial Geotechnical Semin. ASCE, 78–90. doi:10.1061/41144(391)8
Yan, J. K., Yin, Y. P., Men, Y. M., and Liang, J. (2011). Model Test Study of Landslide Reinforcement with Micropile Groups. China Civil Eng. J. 44, 120–128. (in Chinese).
Keywords: micropiles, landslide stabilization, experimental testing, anti-sliding, failure mode
Citation: Liu X, Yan J, Tong B and Liu L (2021) Evaluation of Micropiles With Different Configuration Settings for Landslide Stabilization Based on Large-Scale Experimental Testing. Front. Earth Sci. 9:693639. doi: 10.3389/feart.2021.693639
Received: 11 April 2021; Accepted: 23 June 2021;
Published: 27 July 2021.
Edited by:
Faming Huang, Nanchang University, ChinaReviewed by:
Ahmed Alnuaim, King Saud University, Saudi ArabiaChuncan He, Dongguan University of Technology, China
Hemanta Hazarika, Kyushu University, Japan
Copyright © 2021 Liu, Yan, Tong and Liu. This is an open-access article distributed under the terms of the Creative Commons Attribution License (CC BY). The use, distribution or reproduction in other forums is permitted, provided the original author(s) and the copyright owner(s) are credited and that the original publication in this journal is cited, in accordance with accepted academic practice. No use, distribution or reproduction is permitted which does not comply with these terms.
*Correspondence: Jinkai Yan, eWFuamlua2Fpc3dAMTYzLmNvbQ==