
95% of researchers rate our articles as excellent or good
Learn more about the work of our research integrity team to safeguard the quality of each article we publish.
Find out more
ORIGINAL RESEARCH article
Front. Earth Sci. , 16 June 2021
Sec. Structural Geology and Tectonics
Volume 9 - 2021 | https://doi.org/10.3389/feart.2021.688374
This article is part of the Research Topic Mountain Building View all 14 articles
 Kevin P. Furlong1*
 Eric Kirby2C. Gabriel Creason3Peter J. J. Kamp4Ganqing Xu4Martin Danišík4Xuhua Shi5Kip V. Hodges6
The utilization of thermal-chronological data to constrain mountain building processes exploits the links among rock uplift, exhumation, and cooling during orogenesis. Conceptually, periods of rapid uplift and associated denudation will lead to cooling of rocks as they approach Earth’s surface. The linkage between uplift and exhumation can be complex, but in practice exhumation is often assumed to directly track uplift. The reconstruction of temperature-time histories via thermochronologic systems provides a proxy method to relate the cooling of rock as it is exhumed toward the surface to orogenesis. For the rapid exhumation rates that can occur in active orogenic systems the thermal history will be complex as a result of heat advection, rates of propagation of thermal perturbations, and other processes that affect the cooling behavior. These effects become amplified as exhumation rates increase, and in regions experiencing exhumation rates greater than ∼0.2–0.3 mm/yr (0.2–0.3 km/Ma) simple assumptions of cooling through a constant geotherm will bias the subsequent interpretation. Here we explore, through a suite of generalized models, the impact of exhumation rate and duration on the resulting thermal history and apparent age results. We then apply lessons from these simple exhumation systems to data sets from the high-relief ranges along the eastern margin of the Tibetan Plateau to determine exhumation histories constrained by those data. The resulting exhumation histories provide constraints on the onset of Cenozoic exhumation, the subsequent pace of exhumation, and on the tectonic history of one of the major fault systems in the central Longmen Shan.
The utilization of thermal-chronological data to estimate rates and patterns of exhumation during mountain building exploits the links among rock uplift, exhumation, and cooling associated with crustal thickening during orogenesis. Conceptually, periods of rapid crustal thickening will be accompanied by rapid uplift, and associated denudation, which will lead to cooling of rocks as they approach Earth’s surface. The linkage between uplift and exhumation can be complex, as topographic relief evolves in response to rapid erosion and increased surface slope (Whipple et al., 1999; Montgomery and Brandon, 2002), but in practice exhumation is often assumed to directly track uplift (e.g., Bullen et al., 2003; Stockli et al., 2003). Our ultimate goal is to place constraints on the processes associated with mountain building, and in particular determine timing and rates of deformation associate with orogenesis. The evolution of a mountain system can be linked to processes of burial and exhumation, with assumptions of crustal thickening, fault movements and other kinematics. Those processes can be related to surface and near surface processes of uplift and exhumation.
Because neither uplift or exhumation is readily observed, the reconstruction of temperature-time histories via thermochronologic systems (Reiners and Brandon, 2006; Hodges, 2014) provides a proxy method to relate the cooling of rock, as it is exhumed toward the surface (e.g., Ehlers, 2005), to the evolution of the orogen. The link between the cooling experienced by a rock sample and the exhumation history is often assumed to be similarly direct (e.g., Liu et al., 2013; Lease et al., 2021), but for rapid exhumation rates, often occurring in active orogenic systems, the thermal history will differ from simple cooling with exhumation as a result of heat advection, propagation rates of thermal perturbations, and other processes that affect the cooling behavior (Moore and England, 2001; Braun, 2003; Ehlers, 2005). These effects become amplified as exhumation rates increase, and so although simple assumptions of constant temperature gradient may be adequate to describe a slowly eroding system, in regions experiencing exhumation rates greater than ∼0.2–0.3 mm/yr (0.2–0.3 km/Ma) such assumptions will bias the subsequent interpretation. Additionally, in most orogenic events, deformation is often unsteady, and the superimposition of time-varying uplift and exhumation influences the resultant evolution of crustal thermal structure.
Here we explore, through a suite of generalized models, the impact of exhumation rate and duration on the resulting thermal history and apparent age results. We then apply these lessons from simply exhuming systems to a data set from the high-relief ranges that demarcate the eastern margin of the Tibetan Plateau (e.g., Kirby et al., 2013) in order to determine exhumation histories involving non-steady rates of exhumation, constrained by that data. Comparison of the exhumation history to the results of a similar study from the nearby Pengguan Massif (Wang et al., 2012) provide constraints on the onset of Cenozoic exhumation, the subsequent pace of exhumation, and on the tectonic history of one of the major fault systems in the central Longmen Shan.
The Longmen Shan refers broadly to the collection of high mountain ranges that mark the eastern margin of the Tibetan Plateau adjacent to the Sichuan Basin (Figure 1). The tectonic evolution of this region remains enigmatic and has played a central role in debates over the role of lower crustal flow during plateau development (c.f., Clark and Royden, 2000; Hubbard and Shaw, 2009). Topographic relief between the peaks in the range and the adjacent basin exceeds 5–6 km (Clark and Royden, 2000; Kirby et al., 2002) along the mountain front and corresponds to an abrupt increase in crustal thickness from ∼40 km beneath the Sichuan Basin to >60 km beneath the plateau margin (Robert et al., 2010). The modern topographic front is coincident with the Longmen Shan Thrust Belt, a series of east-vergent thrust faults that developed during the Late Triassic—Early Jurassic Indosinian orogeny (Dirks et al., 1994; Burchfiel et al., 1995) and emplaced allochthonous rocks of the Songpan-Ganzi flysch basin atop the western margin of the Yangtze craton (Chen et al., 1994; Jia et al., 2006). These fault systems were reactivated during the Cenozoic growth of the Tibetan Plateau (Burchfiel et al., 1995; Jia et al., 2010), but most workers agree that Cenozoic shortening appears to be limited to ∼30–35 km (Burchfiel et al., 1995; Hubbard and Shaw, 2009; Hubbard et al., 2010). This observation, combined with the absence of a modern flexural basin (Burchfiel et al., 2008), suggests that present-day topography did not grow entirely by shortening and thickening of the upper crust (Royden et al., 1997; Royden et al., 2008).
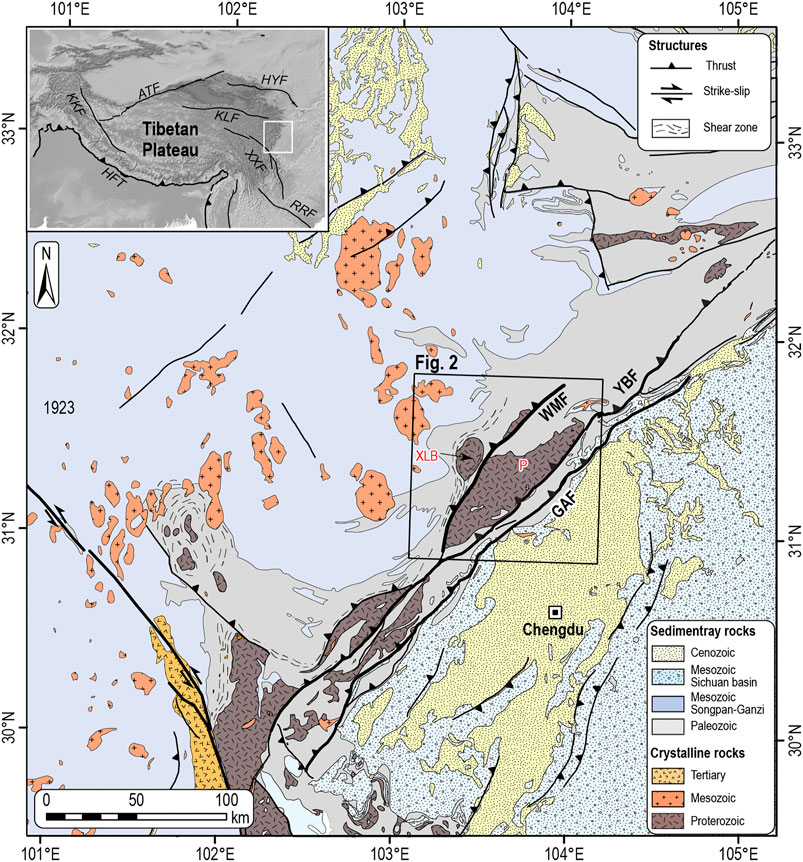
FIGURE 1. Tectonic setting of the eastern margin of the Tibetan Plateau adjacent to the Sichuan Basin. Geology after Kirby et al., 2002; Airaghi et al., 2018a. Primary fault systems in the Longmen Shan region are abbreviated as follows: GAF, Guanxian–Anxian Fault; YBF, Yingxiu–Beichuan Fault; WMF, Wenchuan–Maowen Fault. Inset map shows location of study area relative to the Tibetan Plateau and major active faults. HFT, Himalayan Frontal Thrust; KKF, Karakorum Fault; ATF, Altyn Tagh Fault; HYF, Haiyuan Fault; KLF, Kunlun Fault; XXF, Xianshuihe–Xiaojiang Fault; and RRF, Red River Fault.
The exhumation of rocks within the Longmen Shan, as recorded by thermochronology, plays a central role in the understanding of the timing and rates of growth of high topography (Arne et al., 1997; Xu and Kamp, 2000; Kirby et al., 2002; Wang et al., 2012) and places constraints on the total amount of Cenozoic slip along fault systems in the thrust belt (e.g., Godard et al., 2009; Wang et al., 2012; Tan et al., 2017; Ansberque et al., 2018; Shen et al., 2019). In addition, recent studies of the Mesozoic metamorphic conditions experienced during Indosinian crustal thickening (Airaghi et al., 2017; Airaghi et al., 2018a; Airaghi et al., 2018b) provide important constraints on depth and temperature of the rocks prior to the Cenozoic. These results are briefly summarized in terms of three tectonostratigraphic domains that are separated by major fault systems in the central Longmen Shan (Figure 1):
Along the western margin of the Sichuan Basin, autochthonous strata of the carbonate-dominated passive margin sequence (Burchfiel et al., 1995; Li et al., 2003) are deformed in a fold and thrust belt in the footwall of the Yingxiu-Beichuan fault (Figure 1). The rocks in this region exhibit no indication of elevated metamorphic conditions (Airaghi et al., 2017) and apatite fission-track ages are largely unreset (Arne et al., 1997). Partial resetting of fission-track ages appears to be confined to folds at the leading edge of the fold belt (Richardson et al., 2008).
In the hanging wall of the Yingxiu–Beichuan fault, crystalline basement rocks of the Pengguan Massif are imbricated in a series of thrust nappes that contain a strongly deformed stratigraphic package of metapelites and carbonates that are paraautochthonous relative to the sedimentary successions in the Sichuan Basin (Burchfiel et al., 1995). Nappe emplacement was associated with the development of a foreland basin of Late Triassic to early Jurassic age (Chen et al., 1994; Burchfiel et al., 1995; Chen and Wilson, 1996; Jia et al., 2006). Notably, basement rocks in the Pengguan Massif experienced a greenschist facies metamorphic event with temperatures between 250 and 300°C and pressures of ∼7 kbar at ca. 140 Ma (Airaghi et al., 2017), suggesting the possibility that the Yingxiu–Beichuan fault was reactivated at that time. Zircon fission-track ages from the massif yield ages >200 Ma (Wang et al., 2012), consistent with residence of these rocks below the closure temperature of ∼250–300°C (Reiners and Brandon, 2006). Systematic age-elevation relationships from thermochronologic systems with lower closure temperatures, however, yield important constraints on the exhumation of the massif (Wang et al., 2012). Although during early Cenozoic time, the region was characterized by modest rates of exhumation (∼100 m/Myr), exhumation rates increased dramatically around 30 Ma to ∼800 m/Myr, marking the onset of Cenozoic mountain-building in this range (Wang et al., 2012). Notably, variations in the thermochronologic data require a hiatus in exhumation, and a subsequent acceleration, in the Late Cenozoic (Wang et al., 2012). These data will be discussed further below.
The external zone of paraautochthonous nappes is separated from allochthonous strata of pelitic sediments and flysch of the Songpan-Ganzi terrane (Harrowfield and Wilson, 2005; Roger et al., 2011) by the Wenchuan–Maowen fault (Figures 1, 2). This sub-vertical fault is marked by a thick zone of fault gouge and cataclastic fabric (Burchfiel et al., 1995) that overprints the eastern margin of a shear zone that developed in the Late Triassic—Early Jurassic (Dirks et al., 1994). This regionally extensive zone of high strain is interpreted to reflect a mid-to-lower crustal décollement, that soles beneath the Songpan-Ganzi flysch and allowed emplacement of allochthonous units over the external nappe complex (Mattauer et al., 1992; Burchfiel et al., 1995; Airaghi et al., 2018a). Metamorphic conditions during fabric formation in the high strain zone surrounding the Xuelongbao and Tonghua massifs (Figures 1, 2) reached amphibolite facies (Dirks et al., 1994), with peak temperatures in excess of 530–580°C and pressures of 9–12 kbar (Airaghi et al., 2017; Airaghi et al., 2018b). This event was overprinted by retrograde metamorphism at greenschist facies, with temperatures of 350–400°C and pressures between 2 and 5 kbar (Airaghi et al., 2017; Airaghi et al., 2018b). The abrupt step in peak temperatures across the present-day trace of the Wenchuan–Maowen fault suggests that this fault marks a persistent structural boundary that accommodated differential exhumation during Mesozoic orogenesis (Airaghi et al., 2018a). Notably, however, rocks now exposed in basement massifs west of the Wenchuan–Maowen fault (the Xuelongbao and Tonghua massifs) appear to have resided at similar crustal levels by the late Cretaceous (ca. 140 Ma; Airaghi et al., 2018a). Young cooling ages for thermochronologic systems west of the Wenchuan–Maowen fault (Arne et al., 1997; Godard et al., 2009; Kirby et al., 2013; Creason et al., 2016; Tan et al., 2017; Shen et al., 2019) imply significant differential exhumation during the Late Cenozoic across this fault.
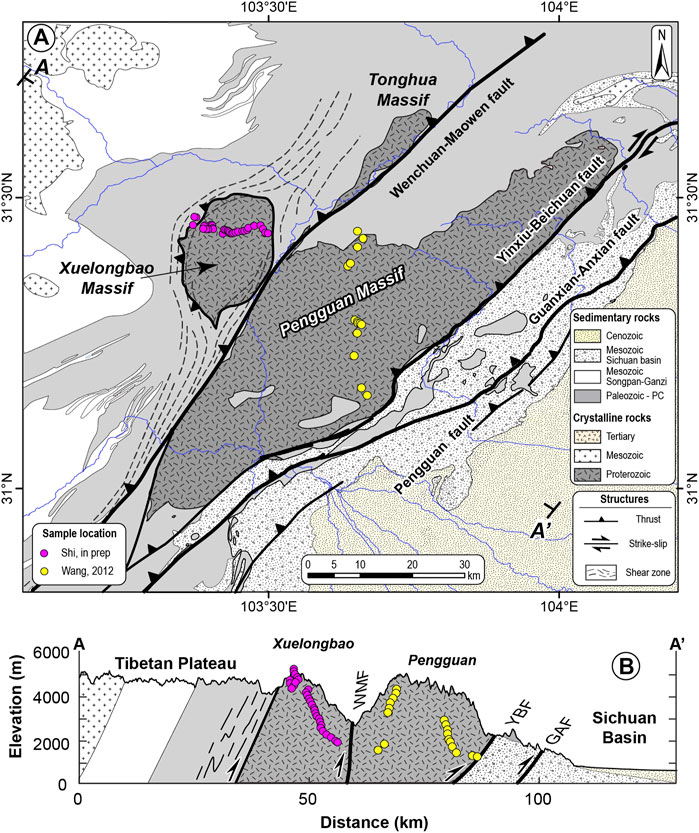
FIGURE 2. (A) Simplified geology of the Longmen Shan and western Sichuan Basin after Burchfiel et al., 1995; Kirby et al., 2002; Airaghi et al., 2018a. Sample locations of data used in this paper are shown in colored circles. Yellow—data from Wang et al., 2012 in the Pengguan Massif. Pink—data from Shi et al. (in preparation)1 from the Xuelongbao Massif. (B) Cross-section showing the location of sample transects relative to major structures in the Longmen Shan.
Despite these extensive studies of the exhumation history of rocks in the central Longmen Shan, several outstanding questions remain. First, the onset of rapid cooling associated with Cenozoic mountain building is not well-constrained in many places. Much of the allochthonous strata and many of the Triassic plutons that are exposed on the Tibetan Plateau west of the Longmen Shan appear to have experienced slow cooling and limited exhumation during the Cretaceous and early Tertiary (Kirby et al., 2002; Roger et al., 2004, Roger et al., 2011). These studies suggest that the onset of rapid cooling in the Late Cenozoic marks the onset of mountain building associated with the modern plateau. Although studies of lower-temperature thermochronologic systems reveal widespread, rapid exhumation during the Late Miocene to present (Kirby et al., 2002; Godard et al., 2009; Tan et al., 2017; Shen et al., 2019), few of these studies precisely determined when exhumation initiated. In the Pengguan Massif, a densely sampled age-elevation transect and multiple thermochronometers spanning closure temperatures from ∼250 to ∼60°C constrain this transition to around 30 Ma (Wang et al., 2012). A similar exhumation event in Oligocene - Early Miocene has been recognized in SE Tibet, along the Yulong Shan thrust belt (Zhang et al., 2016; Cao et al., 2019), but the regional significance remains uncertain. In the central Longmen Shan, whether Oligocene exhumation was confined to the external massifs (Wang et al., 2012) or whether it also occurred within the basement massifs west of the Wenchuan–Maowen fault is unresolved.
The second outstanding question centers on the pace and tempo of exhumation during Cenozoic time. Although it is clear that differential exhumation occurred across two of the primary fault systems in the central Longmen Shan (Yingxiu-Beichuan fault and Wenchuan–Maowen fault), the timing, duration, and rates of differential exhumation are not well known. Moreover, the significance of discrete, greenschist-grade shear zones along the western margins of the basement massifs remains enigmatic. These structures appear to have accommodated top-down-to-the-NW shear (Burchfiel et al., 1995; Tian et al., 2016), but the timing and magnitude of this extension are uncertain. Recent 40Ar/39Ar dating of white mica suggests that many of these fabrics may have been active in the late Cretaceous (Tian et al., 2016; Airaghi et al., 2018b; Xue et al., 2021). Determining differential exhumation histories among blocks has the potential to provide new insight into the question of how much shortening and crustal thickening these structures accommodated during Cenozoic development of the plateau.
Finally, one of the most challenging questions is to what extent the modern elevations in the eastern Tibetan Plateau reflect crustal thickening that occurred in Mesozoic time vs. during the Cenozoic. A number of workers have argued that the exceptionally slow cooling (1–3°C/Myr) and low exhumation rates (>10 m/Myr) during the Cretaceous (Kirby et al., 2002; Roger et al., 2011) is inconsistent with the modern topographic relief and must have occurred on a low-relief landscape. In contrast, the somewhat more modest rates of exhumation inferred for the Late Cretaceous - early Tertiary in the external Pengguan Massif (∼100 m/Myr; Wang et al., 2012; Airaghi et al., 2017) imply subdued relief at that time (Wang et al., 2012). Developing a more quantitative estimate of topographic relief and the histories of exhumation across the margin of the Tibetan Plateau and Sichuan Basin will help address the question of whether the present-day crustal thickness in eastern Tibet developed during flow and/or thickening of lower crust (Royden et al., 1997; Clark and Royden, 2000).
For orogenic belts that develop as a result of rapid uplift and exhumation, such as the eastern margin of Tibet, low-temperature thermochronology can provide primary constraints on the recent stages of the event. In such systems we can place timing and rate constraints on the exhumation (and associated uplift) typically involving rock passage through the upper 10 km of the crust. At exhumation rates of 1–2 mm/yr this represents the past 5–10 Ma. However, rates of orogenic activity and mountain building do not occur at constant rates; rather, they appear to occur in intervals of rapid uplift/exhumation interspersed with times of slower exhumation and thermal relaxation. Simple analyses of thermochronologic age data oftentimes assume constant geothermal gradients in depth or time and infer rates and timing of such events from the simple application of fixed geotherms to the apparent ages and closure temperatures for various low-T thermochronologic systems. Our modeling results indicate that for exhumation rates exceeding ∼100 m/Ma, such assumptions may significantly bias the interpretation.
Here we explore these non-steady state thermal effects and assess their role in biasing estimates of rates and timing of orogenesis in active systems experiencing relatively rapid exhumation such as the eastern margin of Tibet, New Zealand’s Southern Alps, and Taiwan. The generalized models presented here to explore these effects are intentionally kept simple to isolate the effects of exhumation rate on thermal evolution. Clearly, in applications to actual orogenic system (which we investigate later in this paper) exhumation rates vary through time. As a result, the transient effects from a later period of exhumation will be superimposed on non-steady state thermal conditions further complicating the evolution. However, with the intuition we develop through these simple models, we can better understand the observations from orogenic systems and better utilize more complex thermal model realizations.
To model these effects, we use a 1-D, numerical (finite difference) code that allows us to specify standard crustal geothermal properties (conductivity, diffusivity, radiogenic heat production), and act on that initial condition with periods of burial, exhumation, thrusting, and variations in basal heat flux. The code, TQTec, has been used in a variety of previous studies (e.g., Furlong and Edman, 1989; Furlong and Guzofski, 2000; Guzofski and Furlong, 2002; Wang et al., 2012; Furlong and Chapman, 2013; and; Piotraschke et al., 2015), and allows substantial flexibility in defining tectonic events and determining the resultant thermal history effects.
For analyzing the thermal effects of exhumation, we specify exhumation rates and timing in the models and calculate the evolving thermal regime. The upward advection of heat with exhumation (or downward with burial) is accomplished (in the finite-difference scheme) by explicitly removing (adding) finite thickness units at the top of the model at specified times and allowing the system to continue to thermally evolve. The specified boundary conditions are surface temperature, and a basal heat flow applied at a depth of 60 km, along with specifications of crustal material properties and the distribution of heat generation in the crust. For the simple models here, the conditions are:
These conditions, particularly the lack of a crustal heat production component, lead to an initial constant thermal gradient of 30°C/km throughout the model. The models are run for 50 Ma (model time), with exhumation starting at 45 Ma, and the models run forward in time until 0 Ma. When horizons being tracked reach the surface (depth = 0 km) their thermal histories continue at the assigned surface T. Note that models later in this paper that test the exhumation history of the Xuelongbao data use different initial and boundary conditions, appropriate for that setting.
We explore thermal histories for upper-crustal layers at exhumation rates of 0.5 mm/yr (km/Ma), 1.0, and 2.0 mm/yr. In each case the interval of exhumation begins 5 Ma after the start of the model, and continues as long as necessary to exhume 18 km of crust. That is at 0.5 mm/yr the exhumation lasts for 36 Ma, at 1 mm/yr - 18 Ma, and at 2 mm/yr - 9 Ma. Although the exhumation histories are extremely simple, even such simple assumptions lead to significant variations in the resulting thermal history (and hence thermochronologic observations).
Three aspects of the exhumation and thermal history are shown in Figure 3. Figure 3A records the exhumation history, tracking nine positions in the crust (2 km apart), initially spanning depths from 2 to 18 km. Figure 3B shows the resulting temperature history at the three exhumation rates for the points tracked. Figure 3C shows the Temperature–Depth (T–Z) history for each tracked horizon. It is important to remember that although the overall time interval for all models is 50 Ma, the interval of active exhumation (which brings all tracked units to the surface) represented in Figure 3C varies from 9 Ma for the most rapid (2 mm/yr) exhumation rate to 36 Ma for the slowest (0.5 mm/yr) exhumation rate. On the temperature plots we also indicate the approximate closure temperature for four standard low-T thermochronologic systems: 250°C for Zircon Fission Track (ZFT); 180°C for Zircon (U-Th)/He (ZHe); 120°C for Apatite Fission Track (AFT), and 60°C for Apatite (U-Th)/He (AHe) systems. We recognize these are simply approximations to actual closure and retention/annealing processes, but they serve as useful markers of approximate apparent ages.
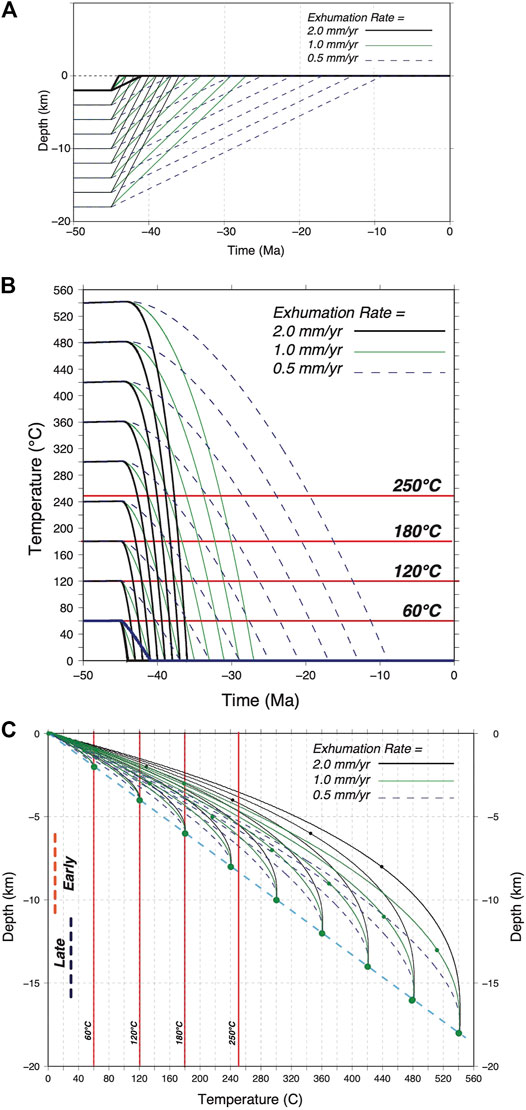
FIGURE 3. Results of simple numerical exhumation models on thermal structure and history. (A) Simple exhumation histories used in the models. Three rates of exhumation are explored [0.5, 1.0, and 2.0 mm/yr (km/Ma)]. Horizons at 2 km depth intervals from 2 to 18 km are monitored. (B) Temperature histories for the monitored units. Red lines labeled with temperatures indicate approximate closure T for specific low-T thermochronologic systems [60°C—Apatite (U-Th)/He; 120°C Apatite Fission Track; 180°C, Zircon (U-Th)/He]; and 250°C, Zircon Fission Track). (C) Temperature—depth histories for monitored units. Dashed blue line indicates initial crustal geotherm (75 mW/m2; k = 2.5 W/m-K; dT/dz = 30°C/km).
There are several things that are immediately clear in the results shown in these figures. For the three exhumation rates shown (0.5, 1.0, 2.0 mm/yr), the cooling history of the rock units does not simply follow along the initial (30°C/km) geotherm (blue dashed line in Figure 3C). In general, cooling rates are slower initially, particularly for the units that are more deeply buried. Over time, as the units approach the surface, cooling rates increase. This is a consequence of the geotherm (initially a simple constant T-gradient with depth) becoming perturbed by the exhumation and heat advection. The result, typical of most exhumation scenarios is initial exhumation along a low T-gradient increasing to a much higher T-gradient as rocks near Earth’s surface. The actual temperature path followed by a particular horizon is shown in Figure 3C, and it is clear that a non-linear temperature gradient trajectory is followed by each horizon.
As is discussed later, it should also be noted that the T–Z path followed by different horizons at the same exhumation rate, and over the same depth intervals differs. For example (using Figure 3C), for the same exhumation rate of 1 mm/yr, a rock horizon initially at 10 km depth would be at ∼220°C when it reached 5 km depth, whereas a unit starting at 16 km depth would be at ∼260°C when it reached that same 5 km depth. These effects are more exaggerated as the exhumation rate increases. As discussed later, this effect can introduce systematic bias into age-elevation vertical transects. The depth at which rock units may cross critical temperatures (and acquire their exhumation age) can vary as a result of whether reaching that depth is early or late in the exhumation event.
The key effect shown in these simple results, is that for the same initial geotherm, the depth at which horizons will cross critical temperatures (e.g., closure T or equivalent) will vary both as a function of exhumation rate at faster unroofing rates the critical T will be at shallower depths, and whether it is early or late in an exhumation event later in the event the critical T will be shallower. Both of these effects will potentially lead to interpretations of higher than actual exhumation rates, and/or an apparent increase in exhumation rate as the exhumation event proceeds.
During an exhumation event, even at relatively slow rates of 0.1–0.2 mm/yr, the temperature structure is perturbed by advection and assumptions of a constant temperature gradient are not met. Previous studies have described techniques to utilize analytical methods to approximate these effects (e.g., Moore and England, 2001; Willett and Brandon, 2013). However, such methods need to make significant assumptions about the duration and amount of exhumation events. Even in cases of relatively slow exhumation (0.1 mm/yr) it may take up to ∼100 Ma for the system to reach a dynamic steady state. Prior to that time the geotherm will be changing. These effects are magnified at higher exhumation rates, but the impact on interpretations of thermochronologic data are not always considered. Here we assess the impact of simple exhumation scenarios for the position of isotherms and the associated geotherm during significant exhumation events. These results represent the steady, single-event exhumation histories shown in Figure 3, and involve a total exhumation of 18 km. The duration of each event varies based on its exhumation rate. Figure 4 shows the evolution of isotherms and geotherms during single exhumation events from Figure 3 for exhumation at 0.5 mm/yr and 2.0 mm/yr; spanning typical ranges of exhumation rates for orogenesis. In these cases, significant upward movement of isotherms occurs during the main phase of exhumation. For example, during exhumation the 300°C isotherm moves upward (Figure 4) approximately 6 km in the 2.0 mm/yr case (i.e., an average rate of 0.67 mm/yr), and approximately 4.4 km in the 0.5 mm/yr case (∼0.12 mm/yr). If a constant temperature gradient is assumed, these effects can seriously bias the interpretation (as shown in Figure 5). In the case of the rapid exhumation model (2.0 mm/yr), the thermal regime is still far from equilibrium even after ∼35 Ma of thermal relaxation; the 300°C isotherm in this example is still elevated by more than 2 km (Figure 5). These effects are generally recognized for rapid exhumation, but are difficult to correct for with simple models linking depth to temperature during exhumation. There is also a general assumption that at exhumation rates less than ∼0.2 mm/yr these transient effects are minor. However even at a rate of 0.1 mm/yr, the 300°C isotherm will rise approximately 1 km during 3.6 km of exhumation; surface heat flow will increase by almost 15%. These effects will have the effect of biasing exhumation rates determined using methods that rely on the slope of age-elevation data, as those approaches require an assumption of constant depth of key isotherm during the time interval represented. Quantification of this effect is discussed below, but for studies of relatively shallow crustal exhumation associated with low-T thermochronometers, these effects may be a significant fraction of the total exhumation.
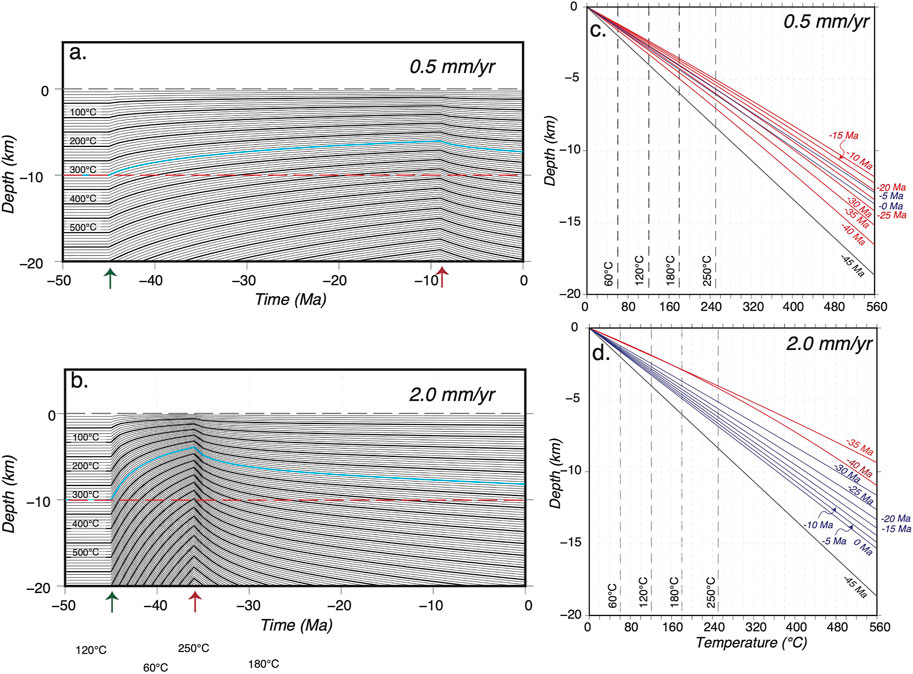
FIGURE 4. Transient thermal response to a single exhumation event. Comparison between slower (0.5 mm/yr) and faster (2.0 mm/yr) exhumation rates. Results are for models shown in Figure 3. In both cases total exhumation is 18 km. Arrows along time-line indicate the start (green) and end (red) of the exhumation event. Left panels (A,C) show the behavior of isotherms during and after exhumation. The blue line traces the 300°C isotherm; the red dashed line maps the 10 km depth level. Right panels (B,D) show geotherms at various times through the thermal evolution. Red geotherms are during the exhumation event and blue geotherms are after the end of exhumation when the thermal field is relaxing toward equilibrium.
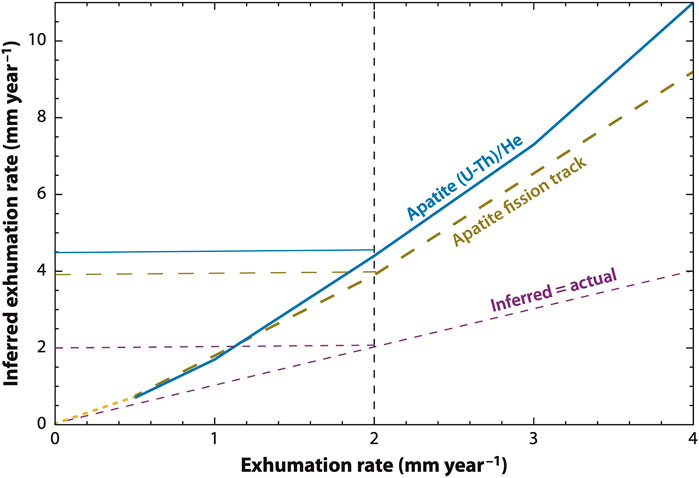
FIGURE 5. Inferred vs actual exhumation rates for models of simple exhumation. Models assumed a 25°C/km initial geotherm, 5°C surface temperature, and a 60°C closure T for Apatite (U-Th)/He and 120°C for Apatite Fission Track (Note: we also calculated the Apatite Fission Track results using a kinetic model of track annealing and got the same results.) At exhumation rates of 2 mm/yr (2 km/Ma), rates inferred using apparent age and an assumed geotherm will be approximately a factor of two greater than actual exhumation rates.
These results indicate several key points to consider in analyses of low-T thermochronologic data (Figure 4).
After long periods of continued exhumation, the thermal regime is still non-steady state, even at rates as low as 0.1 mm/yr. Assumptions of a constant geotherm during exhumation are almost never met.
Similarly, there is a long period of thermal relaxation after an exhumation event. For units in the upper crust (depth <10 km), this period of secular cooling lasts for tens of millions of years. Upper crustal units could cool through several characteristic closure temperatures during this relaxation phase, which might be interpreted as a period of continued exhumation.
This cooling behavior will be superimposed on later exhumation events perturbing them away from “single event” type behavior. That is the ongoing thermal evolution from previous events will influence the temperature history during a subsequent sequence of exhumation events.
This transient behavior during and following an exhumation event provides an important constraint in linking observed thermochronologic data to tectonic events. Although it makes it difficult to directly link a thermal history obtained from direct inversion of thermochronologic data, it does provide the opportunity to identify multiple events and periods of hiatus or slow exhumation during the evolution of an orogen.
These variations in thermal structure associated with exhumation rate that also may change during an exhumation event, can lead to systematic bias in the results. For example, the assumption of a simple constant geotherm (25°C/km, surface T of 5°C), will lead to an increasing over-estimation of the exhumation rate as the actual exhumation rate increases (Furlong and Chapman, 2013). In Figure 5 we show the results for various exhumation rates, and the apparent exhumation rate one would infer using the Apatite low-T systems ((U-Th)/He, Fission Track). At low exhumation rates the over-estimate is relatively small. As actual exhumation rates increase, the apparent or inferred exhumation rate becomes 2–3 times larger than the actual rates.
As noted above (Figures 3B,C), there are differences in cooling rates between periods early in an exhumation event, and later in the same event. Using these simple exhumation histories, we can explore how this effect may be manifest in vertical age transects using various low-T thermochronometers. In general, having thermochronologic data along a vertical transect mitigates many of the issues related to the evolution of the crustal geothermal during exhumation or burial. Implicit however in using the slope of the age-elevation vertical profile is the assumption that the depths of critical temperatures remain constant during the period recorded by the thermochronologic data. During an exhumation event, the geotherm through the upper crust will become increasingly steep (Figure 4). This effect can also be seen in Figures 3B,C where units shallower in the crustal section cross critical temperatures at greater depths (and lower cooling rates) than units that started the exhumation process at greater depths.
In particular, units that are higher in the vertical profile will tend to show lower apparent exhumation rates than units that were initially deeper, and units whose age is acquired earlier in the exhumation event will have lower apparent exhumation rates than those later in the event. For a vertical section that captures the early parts of the event, the result would be an apparent increase in exhumation rate over time, as seen in the 180°C curves in Figure 6. Irrespective of the initial horizon depth, the inferred exhumation rate is lower than actual for deeper (higher T) samples in the early stages of the event, and that effect is greatest at the shallower levels.
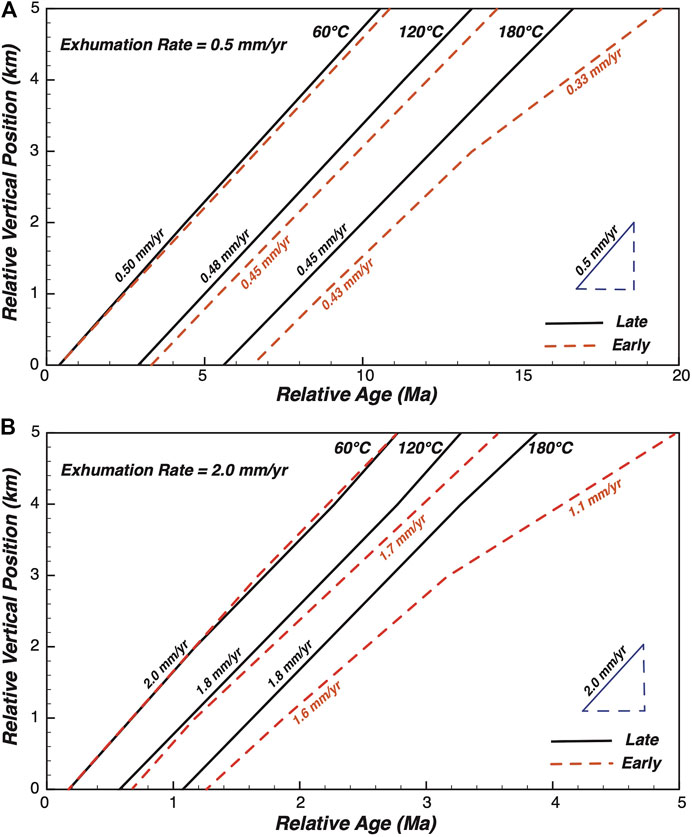
FIGURE 6. Apparent Exhumation Rate determined from vertical age-elevation profiles for a range of thermochronologic closure temperatures and relative time of age acquisition during the exhumation event. The 5-km depth intervals for samples used to generate this figure (early vs. late) is indicated on the T–z plot (Figure 3C).
For example, in Figure 6B, for a vertical section for which we had data from multiple low-T thermochronologic systems, we see that the lowest T system (shallowest, youngest, and hence latest in the exhumation event) best reflects the actual exhumation rate of 2.0 mm/yr, while the higher T systems (which will record ages deeper and earlier in the exhumation event), underestimate the exhumation rate, implying a substantially lower exhumation rate (almost 50% decrease) during the earliest part of the event (1.1 mm/yr in the 180°C case for the shallowest units that acquired their age earliest, compared to the actual rate of 2.0 mm/yr). This effect may be wrongly interpreted to reflect either an acceleration in exhumation rate, or the capturing of a partial retention/annealing zone in the data.
Although the model results shown here are for very simple exhumation histories and might represent only one segment of actual multi-stage exhumation history associated with the development of an orogen, they allow us to identify and isolate various effects that may bias our interpretations of low-T thermochronologic data. For analyzing the tectonic evolution of an actual orogen (as is discussed for a case study in eastern Tibet later) we can use the same modeling approach, but incorporate the effects of multiple exhumation/burial events with differing rates and exhumation amounts, along with periods of relative hiatus in the evolution, (e.g., Wang et al., 2012). From these simple analyses we develop a set of points that should be considered in most interpretations of exhumation associated with mountain building.
Thermochronologic data can be interpreted by assuming a depth to the closure temperature, and dividing that assumed depth by age to get an exhumation rate (e.g., Lease et al., 2021), such an approach implicitly assumes that rock cooling during uplift and exhumation will occur along a simple geotherm (c.f., Figure 3C). In cases of slow exhumation (i.e., <∼0.1–0.2 mm/yr) this assumption is approximately met, and the impact of a non-stationary geotherm on the inferred exhumation rates is minimal. However, at exhumation rates more typical of active orogenic systems (>0.5 mm/yr), an assumption of a fixed geotherm can lead to significantly over-estimated exhumation rates, by a factor of two or greater. This effect is most pronounced for lower-T thermochronologic systems, where the closure temperature and depth are at shallower levels (Figure 5).
Age-elevation profiles can mitigate many of the issues associated with low-T thermochronology. When multiple thermochronologic systems, with different closure temperatures, are available, age-elevation profiles can provide the best estimates of actual exhumation history. However simple interpretation tools, such as linear fits to age-elevation profiles, may lead to misleading results. Our simple modeling shows that such simple linear fits will often-times underestimate the actual exhumation rates, particularly for the slightly higher-T thermochronologic systems such as zircon (U-Th)/He system (nominal closure temperature of ∼180°C, Reiners and Brandon, 2006). This effect of underestimating the actual exhumation rate is amplified early in the exhumation history, and for units that acquire apparent ages at shallower levels (Figure 5). This combined with effects that lead to apparent increases in exhumation rates closer to the surface can lead to an interpretation of an increase in exhumation rate as the event proceeds (moving from higher-T to lower-T thermochronometers, and higher in the vertical section to lower in the vertical section). Because of its effects on the observed apparent age, this change in slope of the age-elevation profile at higher elevations may also be interpreted to reflect that those samples had resided in (near the bottom of) a partial annealing/retention zone prior to the initiation of the exhumation event.
Most orogenic events likely do not proceed as simple single-stage tectonic events with a constant-rate exhumation/uplift history. Rather, it is more common for an orogenic event to wax and wane in intensity with intervals of rapid uplift and/or exhumation separated by periods of limited tectonic activity, all within the lifetime of an orogenic event. It is these details of orogenic evolution that are key to understanding the underlying tectonic drivers and feedbacks between the tectonics and the resulting geologic signature left in the rock record. Moving from observations of apparent ages to estimates of the actual tectonic history is a major target of studies utilizing low-T thermochronologic systems to evaluate thermal histories.
There are a range of possible methods to move from observed, apparent age data to the causative tectonic or exhumation history. As discussed above, simple estimates of exhumation rate, typically using individual sample ages, or vertical age-elevation profiles can be used to estimate exhumation rates averaged over specified time intervals. This is often done assuming a background heat flow or geothermal gradient, which is used to map from temperature to depth, in order to move from a closure temperature to a closure depth and exhumation rate. Additionally, apparent age data from multiple thermochronologic systems, with differing temperature sensitivities and closure temperatures, can be analyzed (oftentimes with an inversion methodology), estimating a time-temperature history for the samples (e.g., Gallagher, 2012). To convert from such a time-temperature history to an exhumation (or uplift) history requires mapping the temperatures to their equivalent depths. This can be done assuming a constant or specified geotherm over the time interval of interest (e.g., Lease et al., 2021). There are also methods available to approximate the transient effects and link thermal histories to equivalent exhumation or uplift histories (e.g., Willett and Brandon, 2013), but these approaches generally work best for single-stage exhumation events.
As shown above, even at relatively low exhumation rates (<0.1–0.2 mm/yr), the crustal geotherm can be significantly perturbed as a result of heat advection with the exhumation/burial events. How this affects multi-stage exhumation is more complex than in the simple single-stage models shown above. To develop a sense of the style of these effects, their time lags, and the magnitudes of the effects, we have modeled a multi-stage exhumation event, and compared the actual (modeled) exhumation and thermal histories with those that would be obtained assuming constant heat flow or thermal gradient during the event.
This difference between a simple linkage between cooling rate and exhumation rate presents problems for directly interpreting thermochronologic data. Standard approaches, many based on the early analyses of Stockli et al. (2000), Stockli et al. (2003), follow one of several routes. In cases where there is a vertical age-elevation profile (preferably with multiple low-T thermochronometers used), the slope of the age-elevation data can be assumed to represent the exhumation rate during the age interval considered. As shown in Figure 6, this slope may underestimate the exhumation rate, and also will vary for the same exhumation event depending on when during the exhumation event (early vs. late) that the age data are acquired. These perturbations are least pronounced for the lower-T age systems.
Another approach is to utilize an age data-thermal history inversion tool (e.g., Ketcham, 2005; Gallagher, 2012), which construct time-temperature histories that will produce the observed age (and in fission track analyses also the track length distribution) for a multi-system sample. To convert this temperature history to an exhumation/uplift history, a range of assumptions of the temperature gradient need to be made. Although the T histories obtained through these inversions may produce the observed ages, transforming these T-histories to uplift/exhumation histories requires a number of assumptions about the crustal thermal structure. As seen in Figure 3, the T-history (for the same exhumation history) varies significantly both as a function of depth, and time during an exhumation event. Assuming a constant crustal geotherm (temperature gradient) during rapid exhumation is not consistent with actual crustal thermal processes. Additionally, periods of slow exhumation or hiatus are hard to discern with this approach, as during a hiatus after a period of rapid exhumation, the crustal thermal regime will continue to cool, but following this approach, that additional cooling might be interpreted as further exhumation.
To illustrate these principles, we use a densely sampled age-elevation transect from the Xuelongbao Massif, in the central Longmen Shan (Figures 1, 2) to explore the effects variations in exhumation history. The massif is composed primarily of granodiorite and tonalite plutonic rocks of Neoproterozoic age (748 ± 7 Ma; Zhou et al., 2006) in intrusive contact with Mesoproterozoic schists and paragneisses along its eastern and southern margins (Zhou et al., 2006). Sheared Paleozoic units form a carapace around the western and northern margins of the massif. We collected an age-elevation transect that spans elevations from ∼1,600 m at the base of the massif to nearly the summit just below 5,500 m (Figure 7). These data have been described in Kirby et al. (2013), Creason et al. (2016), and Shi et al. (2018), and complete analytical details are in Shi et al. (in preparation)1. We describe briefly the primary results and trends in these data that motivate the thermal models. Although other data exist from this massif (e.g., Godard et al., 2009; Tan et al., 2017; Shen et al., 2019), we focus on this single data set here for simplicity. The Godard et al. (2009) data set includes Zircon (U-Th)/He age results for samples from locations near the samples of this study. These data lie between and compliment the AFT and ZFT results shown in Figure 7, as expected based on the relative closure temperatures of these systems. However, the vertical extent of these data is limited and do not substantively inform the exhumation history.
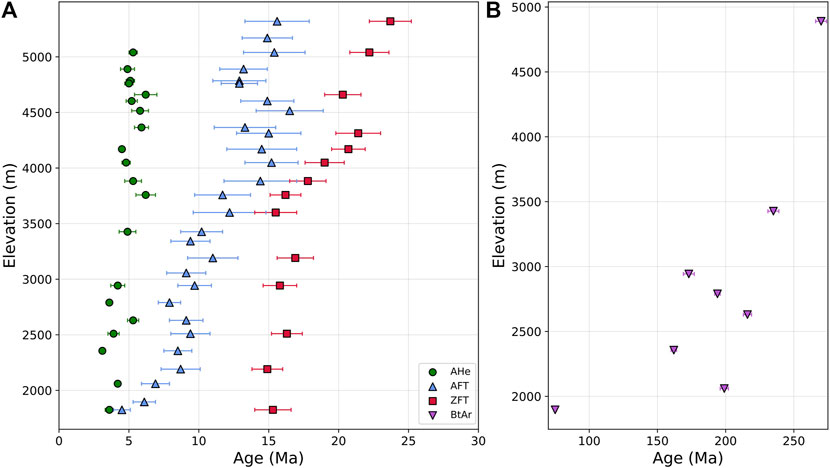
FIGURE 7. Age-Elevation data from the Xuelongbao Massif analyzed in this study. (A) Apatite (U-Th)/He (AHe), Apatite Fission Track (AFT), and Zircon Fission Track (ZFT) data (with 1σ uncertainties). (B) Biotite Ar/Ar (BtAr) data (with 2σ uncertainties).
One of the key aspects of thermochronologic studies that seek to characterize the onset of mountain building is the need to estimate the initial depth and thermal conditions at the start of the tectonic event. For regions experiencing relatively limited exhumation, this is typically estimated from the break in slope of age-elevation data for low-temperature thermochronometers such as AHe or AFT (e.g., Clark et al., 2005; Ehlers, 2005). However, in regions subjected to rapid and/or deeper exhumation, age-elevation arrays may be relatively uniform (see AHe data in Figure 7), and the slope of the line only provides a guide to exhumation rate, if heat advection in the shallow crust can be reasonably modeled (as discussed above). In these cases, the application of multiple thermochronometers with a range of closure temperatures can provide significantly improved information regarding the pace and tempo of cooling and exhumation, as the age difference between different thermochronometers contains information about both the rate and timing of exhumation.
In the Xuelongbao massif, 40Ar/39Ar ages of biotite exhibit significant scatter, but generally define a trend of increasing age with elevation (Figure 7, right panel). Notably, a cluster of samples exhibit ages between ∼150 and ∼200 Ma, which are consistent with temperature estimates for the regrograde, greenschist facies metamorphic conditions experienced by the nearby cover sequence (Airaghi et al., 2018a). In our data, the lowest elevation sample yields an age of ∼75 Ma, providing an indication of relatively slow cooling following peak metamorphic temperatures, similar to ages observed in the southern Longmen Shan along strike (Tian et al., 2016). Thus, these data imply that the ∼4 km crustal section currently exposed in the massif resided at or near ∼350°C (Grove and Harrison, 1996; Reiners and Brandon, 2006) until at least the latest Cretaceous. This allows us to constrain the initial temperatures and depths for the thermal models.
Significant cooling (and exhumation) is recorded by systematic age-elevation relationships in ZFT (closure T of ∼230–250°C, Reiners and Brandon, 2006), AFT (closure T of ∼110 –120°C, Ketcham et al., 1999), and AHe (closure T of ∼60°C, Flowers et al., 2009) systems. Importantly, we do not expect a significant effect of radiation damage on the systematics of He retention in apatite (Flowers et al., 2009) for such young samples that cooled rapidly from well above temperatures where such damage anneals (Shi et al. (in preparation)1). These data reveal three important characteristics of the cooling history that any exhumation model needs to honor. First, there is a break in slope of the ZFT data at ∼3,500 m elevation that marks an apparent increase in exhumation rate. Second, ZFT ages are nearly invariant (at ∼ 15 Ma) with elevation below this point, and AFT ages are similar at higher elevations. As we discuss below, this is characteristic of rapidly cooled crustal sections, but is rarely observed in transects with more limited topographic relief. Third, AFT ages from the lowermost samples are nearly the same age as paired AHe samples. This requires a second relatively recent period of accelerated cooling and exhumation, as explained below.
To guide the development of exhumation history models to help explain the data in the Xuelongbao vertical transect, we can place constraints on the initial conditions (timing and temperature) of the units exposed and sampled. As described above we have age data from four thermochronologic systems (Apatite (U-Th)/He and Fission Track (AHe and AFT); Zircon Fission Track (ZFT); and Biotite Ar/Ar) (BtAr). With the exception of the BtAr data, all samples indicate young ages (<30 Ma) indicating the vertical section sampled was all hotter (deeper) than the ZFT total annealing T of approximately 250°C. The BtAr data generally show old ages ranging from about 270–150 Ma, indicating those samples were likely cooler than the partial retention temperatures for BtAr. However, one sample near the base of the transect (i.e., initially most deeply buried) has an apparent age of ∼75 Ma. We interpret that the apparent age of this sample could represent partial retention, indicating it was initially (i.e., at the 100 Ma start of our modeling) near the top of the partial retention zone, and thus all samples were at a temperature of <∼350°C, with the lowest elevation sample at ∼350°C.
This helps provide a constraint on the initial depth and thermal gradient of the modeled section—the initial ∼4 km section was located at depths spanning a temperature range of approximately 350–250°C. Using this information to guide multiple modeling simulations, we have found that geotherm conditions that produce a temperature gradient of ∼25°C/km or less at initial the depths of samples (assumed heat flow of ∼75 mW/m2, with upper crustal radiogenic heat production of 2.0 μW/m3, and thermal conductivity of approximately 2.5 W/(m-K), at the time of model initiation (∼100 Ma) provide the most consistent results and are what are shown in the following.
The nearly 4 km vertical extent of our low-T thermochronologic data allow us to develop a thermal—tectonic history for the Xuelongbao region, delineating a sequence of well-constrained exhumation events since ∼30 Ma. We show the results from three of those models that provide good fits to specific aspects of the data, and also provide examples of the trade-offs and constraints provided by the data.
Before comparing these model results to the observed age-elevation profiles for the Xuelongbao Massif, it is instructive to explore the effects of the differences in such multi-stage exhumation histories for the thermal evolution of rocks initially residing at different crustal levels (Table 1). Figure 8 shows exhumation models and resulting thermal evolution histories for three related models that produce synthetic age-elevation profiles that share characteristics with those we observe in our data. These three models have common exhumation histories from their initiation at 100 Ma (only the time interval after 50 Ma is shown in the figures) until the start of enhanced exhumation at 27 Ma. From 27 Ma until 15 Ma they share the same 2-stage exhumation (which, we will see, is constrained by the ZFT data). The three models differ in terms of the exhumation/uplift history since 15 Ma. The simplest model (Figure 8A) has a single constant-rate exhumation event for 15–0 Ma, whereas the other two models (Figures 8B,C) break that time interval into two events—a slower event initially (15–6 Ma), followed by a more rapid exhumation from 6 to 0 Ma. Models shown in Figures 8B,C differ only slightly in the relative rates of the two events (same total exhumation). They both differ from the simple (Figure 8A) history by having an extended interval (∼9 Ma in duration) of low exhumation separating two intervals of rapid exhumation. The introduction of this relative hiatus in exhumation is motivated by the separation in timing of the upper and lower elevation AFT results. This hiatus is similar to the exhumation history we previously modeled in the Pengguan Massif (Wang et al., 2012); this study concluded that the uplift of that region was accomplished over two time intervals, separated by a period of slower exhumation.
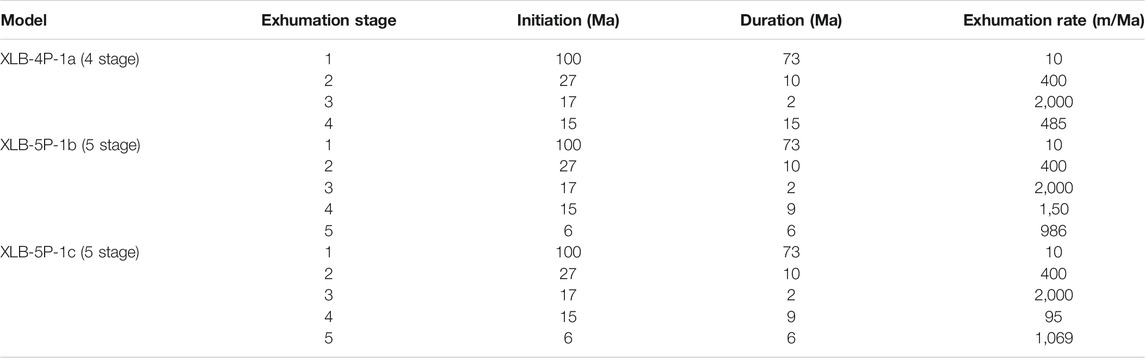
TABLE 1. Exhumation models.
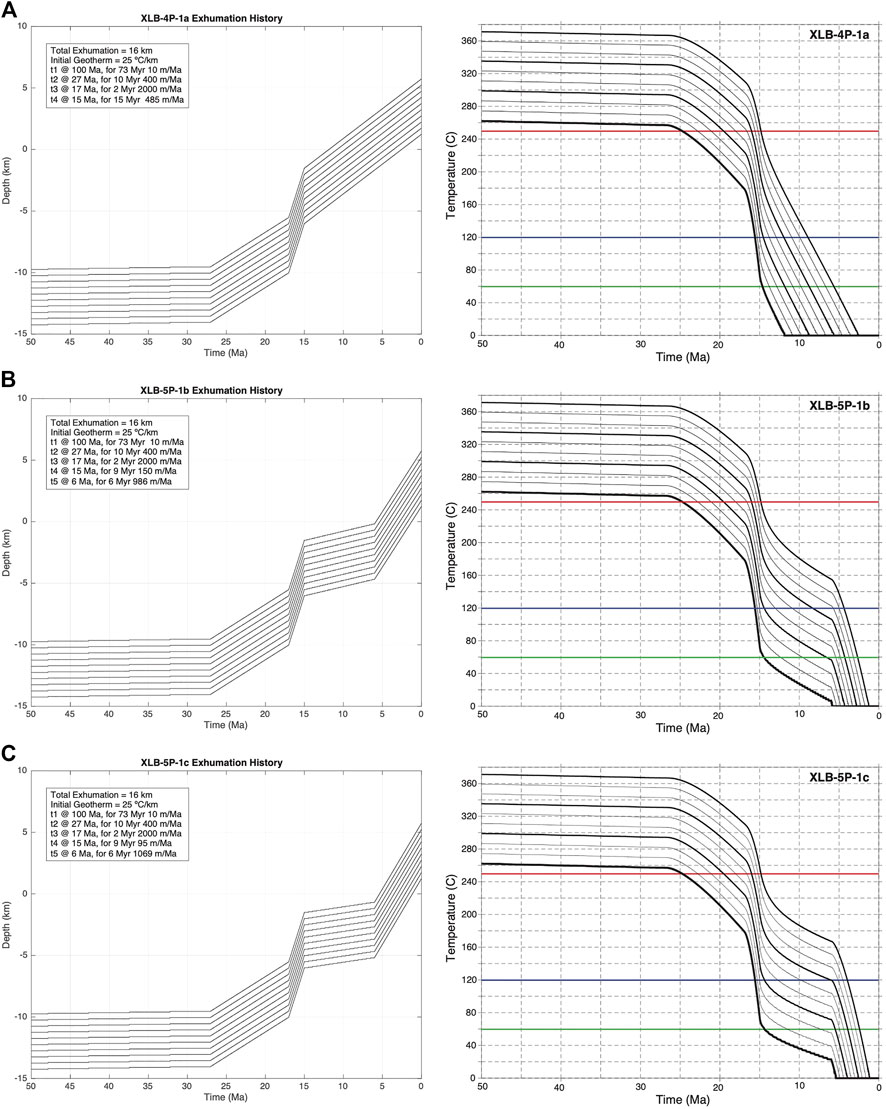
FIGURE 8. Exhumation (left) and thermal (right) histories for three tectonic scenarios used to satisfy the observed Age - Elevation vertical profiles for the Xuelongbao transect Details in Table 1. All scenarios involve approximately 16 km of exhumation over the past 100 Ma. The exhumation prior to 15 Ma is the same for each model, but differs since that time. Horizons shown represent the range of initial depths and their final positions that are consistent with the elevation and extent of the samples evaluated. Samples reach a surface T of 0°C when they reach of depth of 0 km, and remain at that T during the rest of their history (i.e., at depths above 0 km). (A) Simple 4-stage exhumation history with constant exhumation rate since 15 Ma. (B) 5 stage exhumation history with post-15 Ma separated into two exhumation periods (15–6 and 6–0 Ma). (C) 5 stage exhumation history as in panel (B) with slightly slower exhumation rates in the 15–6 Ma interval and slightly faster rates in the 6–0 Ma interval. Implications of these variations in exhumation history are seen in the model fits of Figure 9 (Note: Deepest buried units in exhumation plot are top curves in Temperature plots).
The primary thermal effect of this change from a constant exhumation over the past 15 MA to a 2-stage (slow/fast) exhumation (compare Figures 8A–C) is that the shallowest (highest elevation) rock units will pass through the AFT closure T (blue line at 120°C in Figure 8—right panels) during the 17–15 Ma period of rapid exhumation, and an increasing delay moving to deeper samples (lower elevation) for that particular thermochronometer age. The more subtle difference between the models shown in Figures 8B,C, primarily produces small changes in the relative ages of the lowest-T thermochronometers. These thermal histories can then be mapped into apparent ages for different thermochronologic systems based on closure temperatures and AFT track-length annealing kinetics. Those synthetic age-elevation profiles can then be compared with our observations (Figure 9).
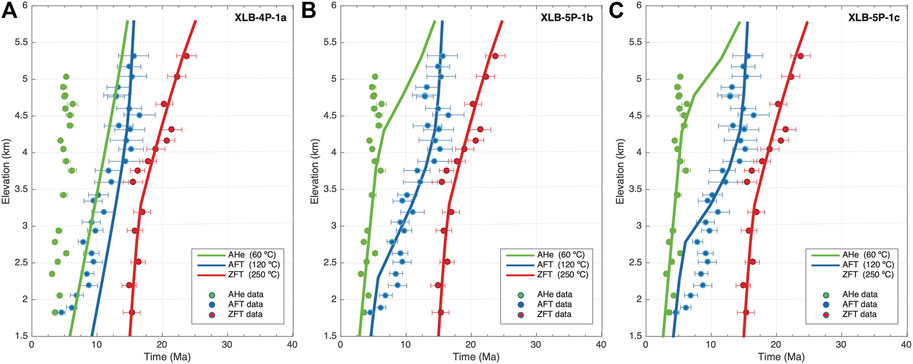
FIGURE 9. Model results for exhumation histories shown in Figure 8 and Table 1. (A) simple 4-stage exhumation history satisfies age-elevation data with apparent ages older than ∼15 Ma. (B) 5-stage exhumation history with 2-stage exhumation since 15 Ma. (C) 5-stage exhumation history similar to panel (B), with slight modifications to rates during each of the post-15 Ma exhumation stages.
The simpler model (XLB-4P-1a) involves a 2-stage exhumation history between 27 and 15 Ma, followed by a single stage exhumation event from 15 to 0 Ma. A focus of this simpler model is to constrain the initiation of exhumation affecting the Xuelongbao Massif. That initial period of exhumation is recorded in the higher-T (ZFT) age-elevation results (Figure 9). At the time of initiation of this stage of exhumation the rocks sampled were at depths of >15 km and so there is a time delay between the onset of exhumation and when cooling reaches the depth of the samples. We have found that with exhumation beginning approximately 27 Ma, we best match the ∼24 Ma age of the highest-elevation ZFT sample, while also fitting the slope of the age-elevation profile. These data (ZFT) also show an increase in the slope of the age-elevation data (for rocks initially more deeply buried) starting at approximately 17 Ma. This motivates the modeled increase in exhumation at 17 Ma, lasting ∼2 Ma. Part of the difference in age-elevation slope of the ZFT data between the older (higher in the section) and the younger (lower in the section) data is a consequence of the apparent increase in exhumation between older/deeper and younger/shallower cooling (cf. Figure 5), but that effect is not sufficient to explain the entire observed change in slope. The rapid exhumation between 17 Ma and 15 Ma is also motivated by the AFT observations for the samples above elevation 3.75 km. As seen in Figure 8, the higher elevation samples will pass through the approximate AFT closure during this interval of rapid exhumation, ending at ∼15 Ma. The distinct age-offset between these higher elevation AFT results, and the shallower results is one indication of the hiatus in exhumation starting at ∼15 Ma. All models share this same exhumation history prior to 15 Ma, but the poor fit of this model (XLB-4P-1a) to the lower-elevation AFT results and the AHe results indicate that a simple constant exhumation since 15 Ma is not able to satisfy the observations, indicating the need for a more complex exhumation history since 15 Ma.
In the simpler model (Figure 9A), with a single post-15 Ma exhumation history, we see that both the lower elevation AFT data and the AHe data are poorly fit by the temperature history. In particular there is not sufficient age separation between the AHe and AFT results, (and also the lower elevation AFT and ZFT data). This separation and the change in slope of the AFT profile at elevations below ∼3.5 km implies that there is a hiatus or other slowing of cooling for a period of time. This led us to the more complex models, which divide the last 15 Ma of exhumation into two stages, in which we have an interval of slow exhumation (hiatus) followed by faster exhumation (Figures 8B,C and 9B,C). Including this interval of reduced exhumation is required to produce the observed age separation. This is a similar effect to what we saw in the Pengguan analyses (Wang et al., 2012), although the timing of the hiatus in this case is more recent.
The subtle difference in the rates of the slow-to-faster exhumation since 15 Ma (Figures 8B,C and 9B,C) produces small, but perhaps important, differences in the fit of the synthetic age-elevation profiles to the observed data. In particular the model with the slightly slower initial exhumation, followed by slightly faster 2nd-stage exhumation better fits the entire extent of the AHe data, but indicates younger ages than observed for the lower elevation AFT data. Certainly, more complex exhumation histories could be derived that slightly change the fits, but that is not the intent of this current analysis. Our primary goal in these modeling analyses is not to simply “fit the data”; rather, our intent is to demonstrate the interactions among the superimposed exhumation events and develop insight into the rates, timing, and amount of exhumation that occurred in building this orogen, which we then can use to inform our interpretations of its tectonic evolution.
The thermal history of the crust during multiple exhumation events is hard to characterize by simple patterns of behavior. The effects of heat advection, time lags in cooling, and the superposition of secular and active cooling processes combine to create thermal histories that may produce thermochronologic signatures that may be superficially misleading. As we see in the set of models applied to the data set from the Xuelongbao Massif, although age elevation profiles appear relatively straightforward, a simple exhumation history (Figures 8A and 9A) does not fit the suite of data. In particular, the age differences observed among the three chronometers require a reduction in exhumation rate post-15 Ma, after a period of rapid exhumation. As seen in the subtle differences between model fits for XLB-5P-1b and XLB-5P-1c (Figures 8B,C and 9B,C), details of that slow-down or hiatus can produce potentially measurable effects. Focusing on the thermal evolution for model XLB-5P-1c (Figure 10), we see several key aspects of a multi-stage exhumation history; similar to what was seen in Figure 4.
Even at relatively slow exhumation rates, there is advection of heat and a slight shallowing of isotherms.
During the interval immediately following the rapid mid-Miocene exhumation (17–15 Ma), there is a relaxation of the thermal field leading to a deepening of isotherms. This is partially offset by the upward advection effects of the continued (albeit substantially slower) exhumation during the post-15 Ma period.
As seen in Figures 8C and 10, rock units within the observed thermochronologic data set will acquire their apparent ages during intervals when both the exhumation rates are changing significantly (∼0.1–1.0 mm/yr) and the geothermal gradient (heat flow) is varying by 50% or more.
Although the 15 and 0 Ma geotherms are very similar (Figure 10), between 15 Ma and the present the gradient changes substantially (from 130 mW m−2 at 15 Ma to 85 mW m−2 at 10 Ma, returning to 120 mW m−2 at 0 Ma).
This superposition of changing exhumation rates and geotherms is difficult to account for in many of the tools used to link thermal histories to exhumation/uplift histories.
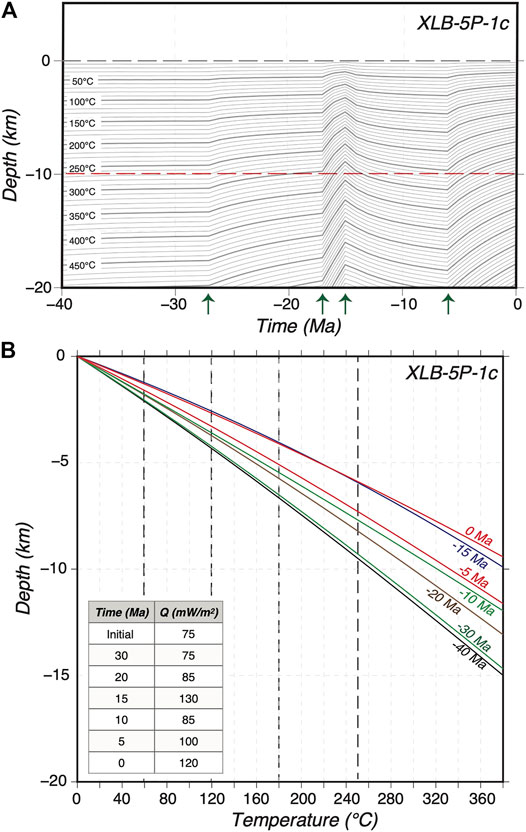
FIGURE 10. Isotherm and geotherm histories for multi-stage exhumation history. (A) Isotherm evolution for exhumation history given by Model XLB-5P-1c. Times of changes in exhumation rates are indicated by arrows. Red dashed line indicates depth of 10 km. Depth to 300°C isotherm varies by approximately 4 km during this tectonic history. (B) Geotherms at selected times during thermal evolution. Table indicates surface heat flow for each geotherm shown.
The exhumation histories modeled here, the associated thermal histories, and the resulting fits to the observed age-elevation profiles provide an estimate of the rock uplift history of the Xuelongbao Massif and the hanging wall of the Wenchuan–Maowen Fault (WMF). We can use that history to develop tectonic scenarios for the development of this orogen. In particular, by combining these results, with our previous results for the uplift/exhumation history of the Pengguan Massif (Wang et al., 2012) we can develop a broader regional model of orogen evolution, and in particular constrain the relative exhumation histories of these two major massifs and the amount and timing of vertical displacement along WMF that separates the two massifs (Figure 11).
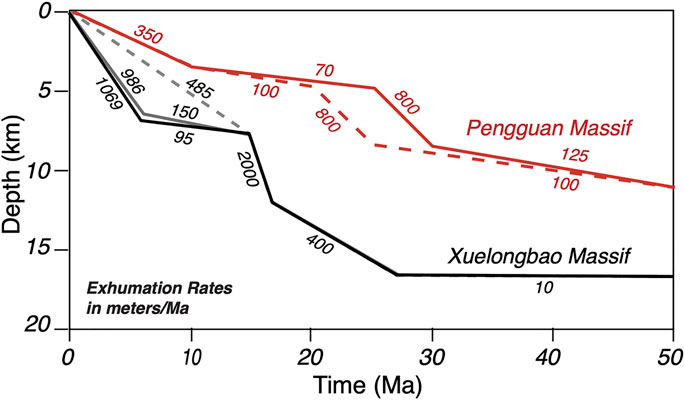
FIGURE 11. Modeled Exhumation Histories for the Pengguan Massif (Wang et al., 2012) and the Xuelongbao Massif (this study) since 50 Ma. Exhumation rates (meters/Ma) for each exhumation stage are labeled on the graph. The two curves for the Pengguan Massif model reflect the range of models determined in that study. The three curves for the Xuelongbao model are the three models presented in Figures 8, 9.
The exhumation histories of the two adjacent massifs show similarities in duration of exhumation and approximate timing of the initiation of the modern period of more rapid exhumation (∼30–27 Ma). The exhumation of the Xuelongbao Massif has brought a significantly deeper crustal section to the surface as compared to the exhumation of the Pengguan Massif (16 vs. 10 km, minimum initial depth), and the extreme relief (3.5–4.0 km) and the availability of a range of thermochronologic systems allow the identification of specific stages of exhumation. The similarity in the onset of exhumation for the two massifs indicates that mountain building and the growth of the present-day relief along the topographic margin of the plateau began ∼30 Ma. Similarly rapid exhumation occurred along the Yulong Shan thrust belt in SE Tibet (Zhang et al., 2016; Cao et al., 2019) around the same time and points to regional shortening along the eastern margin of Tibet. However, whether crustal thickening was confined to the thrust belt, or whether it was widespread beneath the eastern plateau cannot yet be distinguished from this data.
Of particular importance in piecing together a tectonic history for the region are the differences in exhumation history between the two major massifs (Figure 11). Between ∼30 and 15 Ma, it appears that the Pengguan region (in the external zone of the thrust belt) experienced faster uplift initially while the results from the Xuelongbao region indicate an acceleration in exhumation at ∼17 Ma, at a time when the Pengguan region was unroofing more slowly. Both regions underwent periods of reduced exhumation during the Miocene, followed by a subsequent increase in exhumation during the Late Miocene. Overall rates of exhumation for the Xuelongbao Massif are higher, resulting in the exposure a deeper crustal section and the full resetting of the Zircon FT samples (Figure 7). In contrast, un-reset Zircon FT samples from the Pengguan massif (Wang et al., 2012) reflect residence of these rocks at shallower crustal levels. Prior to the Neogene start of exhumation, both massifs appear to have experienced similar background thermal regimes, with a common tectonic history prior to the activation of the faults (e.g., Airaghi et al., 2018a) such that the differences in thermal history reflect differential exhumation across the WMF (Shen et al., 2019).
The two exhumation histories we have obtained (Pengguan and Xuelongbao massifs) allow us to place constraints on rates and timing of activities on the various major fault systems in the region (Figure 2B). From the Wang et al. (2012) study we can primarily place constraints on the uplift rates associated with the faults to the east of the Pengguan Massif. Between ∼30 and 20 Ma, our modeling showed there was an ∼5 Ma interval with rapid exhumation and thus inferred rapid uplift along those frontal faults at a rate of approximately 0.8 mm/yr (0.8 km/Ma). During this time, exhumation rates in the Xuelongbao region are lower, most likely indicating little differential motion across the WMF and lower exhumation, perhaps because the site is more distant from the mountain front. To convert these exhumation (uplift) rates to fault slip rates requires knowledge of faults attitude. For assumed high angle thrust fault orientations (at least at shallow crustal levels), the exhumation rates we have determined should be scaled by factors of ∼1.4 (45° dip) to 1.15 (60° dip) to estimate slip rates on the faults.
The WMF may have begun significant motion at about 20 Ma (when higher exhumation rates relative to the Pengguan begin in Xuelongbao; Figure 11), with differential vertical motion along that fault at a rate of ∼0.3 mm/yr (0.3 km/Ma). Continued exhumation in the Pengguan Massif suggests that the frontal faults (Yingxui-Beichuan fault) remained active but perhaps at more modest rates of ∼0.1 mm/yr (0.1 km/Ma). By ∼ 17 Ma, the exhumation rate in the Xuelongbao Massif accelerated to an extremely high value of >1.9 mm/yr (1.9 km/Ma), with uplift (at ∼0.1 mm/yr) continuing on the frontal faults. At approximately 15 Ma, the fault systems appear to dramatically slow or enter into a hiatus (lasting ∼ 5–10 Ma), where exhumation rates are much lower. The observed data could be explained by no motion on the WMF during this time and all uplift occurring on the frontal faults at a rate of ∼0.1 mm/yr (0.1 km/Ma).
Over the past 6–10 Ma, both the frontal faults and the WMF are inferred to accommodate significant rates of displacement relative to the unexhumed margin of the Sichuan Basin. During that time, the frontal faults appear to have accommodated differential exhumation of ∼0.35 mm/yr (0.35 km/Ma), and differential exhumation across the WMF appears to be >0.6 mm/yr (0.6 km/Ma) in the past ∼6 Ma. These results imply that, of the 6–8 km of difference in crustal level exposed between the Pengguan and Xuelongbao Massifs, approximately 4 km was differentially exhumed over a very short period of time (∼2 Ma) in the middle Miocene. Whether this substantial rate of dip-slip motion occurred along the entire WMF at this time, or was restricted to the central Longmen Shan is unclear from these data sets. Numerous other studies present low-T thermochronologic evidence for late Miocene to Recent exhumation further south along the southern Longmen Shan (Arne et al., 1997; Xu and Kamp, 2000; Kirby et al., 2002; Godard et al., 2009; Ansberque et al., 2018; Tan et al., 2017; Tian et al., 2013, Tian et al., 2018), although it is not clear whether these record the same temporal history as we find for this study or in Wang et al. (2012).
These rates of multiple mm/yr of sustained fault motion are high for intra-crustal faults, and likely reflect significant displacements on mid-crustal structures at depth. The analyses we have done here do not allow us to specify details of those mid-to-lower crustal tectonics, but these results do allow us to reach some specific conclusions about the evolution of this region.
Prior ∼30 Ma, rocks currently exposed in the Xuelongbao Massif resided near the middle crust at depth levels between 15 and 17 km. Thus, our results are consistent with greater exhumation of the hanging wall of the Wenchuan–Maowen fault (Tan et al., 2017; Shen et al., 2019) relative to rock units exposed in the Pengguan Massif (Wang et al., 2012).
Average exhumation rates since 30 Ma for the region are at least 0.5 mm/yr (0.5 km/Ma), sufficiently high to perturb the thermal history and preclude simple mapping of cooling rate to exhumation rate. Periods of very high exhumation rates (perhaps as high as 2 mm/yr) introduce significant biases into interpretations using standard approaches to analyzing vertical age-elevation profiles.
The application of thermal modeling approaches (explicitly incorporating exhumation) for analyzing the apparent age data allows us to isolate periods of rapid and slower exhumation, which we are able to link to periods of activity on major structures in the region.
The original contributions presented in the study are included in the article/Supplementary Material, further inquiries can be directed to the corresponding author.
KF and EK conceived and designed the project, analyzed data, accomplished the modeling, and wrote the paper. CGC did preliminary modeling to constrain models used in Figures 8 and 9. Contributions to the data shown in Figure 7 are as follows: XS organized and executed the field sampling; PK oversaw the (U-Th)/He and FT analyses; GX did the whole mineral separations and the AFT and ZFT analyses; MD did the (U-Th)/He analyses; KVH did the Ar/Ar analyses.
The authors declare that the research was conducted in the absence of any commercial or financial relationships that could be construed as a potential conflict of interest.
The authors thank the two reviewers of this paper for very insightful and helpful reviews. This research was supported by NSF grants EAR-1757581 (to KF) and EAR-0911587 (to KF and EK). Research funding for the acquisition of FT and Helium thermochronology data were provided by the New Zealand Government - MBIE Contract: CONT-42907-EMTR-UOW (to PK).
1Shi, X., Kirby, E., Furlong, K., Creason, G., Kamp, P., Xu, G., Danišík, M., Wang, G., He, J., Fan, C., Xu, G., Su, Z., and Wang, E., in preparation, Protracted Exhumation from Oligocene to Present in the Xuelongbao Massif.
Airaghi, L., de Sigoyer, J., Guillot, S., Robert, A., Warren, C. J., and Deldicque, D. (2018a). The Mesozoic Along-Strike Tectonometamorphic Segmentation of Longmen Shan (Eastern Tibetan Plateau). Tectonics 37, 4655–4678. doi:10.1029/2018TC005005
Airaghi, L., de Sigoyer, J., Lanari, P., Guillot, S., Vidal, O., Monié, P., et al. (2017). Total Exhumation across the Beichuan Fault in the Longmen Shan (Eastern Tibetan Plateau, China): Constraints from Petrology and Thermobarometry. J. Asian Earth Sci. 140, 108–121. doi:10.1016/j.jseaes.2017.04.003
Airaghi, L., Warren, C. J., de Sigoyer, J., Lanari, P., and Magnin, V. (2018b). Influence of Dissolution/reprecipitation Reactions on Metamorphic Greenschist to Amphibolite Facies mica40Ar/39Ar Ages in the Longmen Shan (Eastern Tibet). J. Metamorph Geol. 36, 933–958. doi:10.1111/jmg.12420
Ansberque, C., Godard, V., Olivetti, V., Bellier, O., de Sigoyer, J., Bernet, M., et al. (2018). Differential Exhumation across the Longriba Fault System: Implications for the Eastern Tibetan Plateau. Tectonics 37, 663–679. doi:10.1002/2017TC004816
Arne, D., Worley, B., Wilson, C., Chen, S. F., Foster, D., Luo, Z. L., et al. (1997). Differential Exhumation in Response to Episodic Thrusting along the Eastern Margin of the Tibetan Plateau. Tectonophysics 280, 239–256. doi:10.1016/s0040-1951(97)00040-1
Braun, J. (2003). Pecube: a New Finite-Element Code to Solve the 3D Heat Transport Equation Including the Effects of a Time-Varying, Finite Amplitude Surface Topography. Comput. Geosci. 29, 787–794. doi:10.1016/s0098-3004(03)00052-9
Bullen, M. E., Burbank, D. W., and Garver, J. I. (2003). Building the Northern Tien Shan: Integrated Thermal, Structural, and Topographic Constraints. J. Geol. 111, 149–165. doi:10.1086/345840
Burchfiel, B. C., Chen, Z., Liu, Y., and Royden, L. H. (1995). Tectonics of the Longmen Shan and Adjacent Regions, central China. Int. Geol. Rev. 37, 661–735. doi:10.1080/00206819509465424
Burchfiel, B. C., Royden, L. H., van der Hilst, R. D., Hager, B. H., Chen, Z., King, R. W., et al. (2008). A Geological and Geophysical Context for the Wenchuan Earthquake of 12 May 2008, Sichuan, People's Republic of China. GSA Today 18, 4–11. doi:10.1130/gsatg18a.1
Cao, K., Wang, G., Leloup, P. H., Mahéo, G., Xu, Y., van der Beek, P. A., et al. (2019). Oligocene-Early Miocene Topographic Relief Generation of Southeastern Tibet Triggered by Thrusting. Tectonics 38, 374–391. doi:10.1029/2017TC004832
Chen, S. F., and Wilson, C. J. L. (1996). Emplacement of the Longmen Shan Thrust-Nappe Belt along the Eastern Margin of the Tibetan Plateau. J. Struct. Geol. 18, 413–430. doi:10.1016/0191-8141(95)00096-v
Chen, S. F., Wilson, C. J. L., Luo, Z. L., and Deng, Q. D. (1994). The Evolution of the Western Sichuan Foreland Basin, Southwestern China. J. Southeast Asian Earth Sci. 10, 159–168. doi:10.1016/0743-9547(94)90016-7
Clark, M. K., and Handy Royden, L. (2000). Topographic Ooze: Building the Eastern Margin of Tibet by Lower Crustal Flow. Geology 28, 703–706. doi:10.1130/0091-7613(2000)028<0703:tobtem>2.3.co;2
Clark, M. K., House, M. A., Royden, L. H., Whipple, K. X., Burchfiel, B. C., Zhang, X., et al. (2005). Late Cenozoic Uplift of southeastern Tibet. Geol 33, 525–528. doi:10.1130/g21265.1
Creason, C. G., Shi, X., Shi, X., Kirby, E., Furlong, K. P., Wang, G., et al. (2016). Rapid Exhumation along the Longmen Shan Sustained for >30 Ma: Implications for Mountain Building along the Eastern Margin of Tibet. Geol. Soc. America Abstr. Programs 48, 7. doi:10.1130/abs/2016AM-284775
Dirks, P. H. G. M., Wilson, C. J. L., Chen, S., Luo, Z. L., and Liu, S. (1994). Tectonic Evolution of the NE Margin of the Tibetan Plateau; Evidence from the central Longmen Mountains, Sichuan Province, China. J. Southeast Asian Earth Sci. 9, 181–192. doi:10.1016/0743-9547(94)90074-4
Ehlers, T. A. (2005). Crustal thermal Processes and the Interpretation of Thermochronometer Data. Rev. Mineral. Geochem. 58, 315–350. doi:10.2138/rmg.2005.58.12
Flowers, R. M., Ketcham, R. A., Shuster, D. L., and Farley, K. A. (2009). Apatite (U-Th)/He Thermochronometry Using a Radiation Damage Accumulation and Annealing Model. Geochim. Cosmochim. Acta 73, 2347–2365. doi:10.1016/j.gca.2009.01.015
Furlong, K. P., and Chapman, D. S. (2013). Heat Flow, Heat Generation, and the Thermal State of the Lithosphere. Annu. Rev. Earth Planet. Sci. 41, 385–410. doi:10.1146/annurev.earth.031208.100051
Furlong, K. P., and Edman, J. D. (1989). “Hydrocarbon Maturation in Thrust Belts: Thermal Considerations,” in Origin and Evolution of Sedimentary Basins and Their Energy and Mineral Resources, AGU Geophys. Mon. (Stanford: Stanford University Press), 137–144.
Furlong, K. P., and Guzofski, C. (2000). “Thermal Rheological Evolution of the Franciscan Crust: Implications for Earthquake Processes,” in Proceedings of the 3rd Conference on Tectonic Problems of the San Andreas Fault System. Editors G. Bokelmann, and R. L. Kovach (Stanford: Stanford University Press), 112–127.
Gallagher, K. (2012). Transdimensional Inverse thermal History Modelling for Quantitative Thermochronology. J. Geophys. Res. Solid Earth 117, B2. doi:10.1029/2011jb008825
Godard, V., Pik, R., Lave, J., Cattin, R., Tibari, B., de Sigoyer, J., et al. (2009). Late Cenozoic Evolution of the central Longmen Shan, Eastern Tibet: Insight from (U-Th)/He Thermochronometry. Tectonics 28, 121. doi:10.1029/2008tc002407
Grove, M., and Harrison, T. M. (1996). 40Ar (Super *) Diffusion in Fe-Rich Biotite. Am. Mineral. 81, 940–951. doi:10.2138/am-1996-7-816
Guzofski, C. A., and Furlong, K. P. (2002). Migration of the Mendocino Triple junction and Ephemeral Crustal Deformation: Implications for California Coast Range Heat Flow. Geophys. Res. Lett. 29 (1), 12-1–12-4. doi:10.1029/2001gl013614
Harrowfield, M. J., and Wilson, C. J. L. (2005). Indosinian Deformation of the Songpan Garzê Fold Belt, Northeast Tibetan Plateau. J. Struct. Geol. 27, 101–117. doi:10.1016/j.jsg.2004.06.010
Hodges, K. V. (2014). “Thermochronology in Orogenic Systems,” in Treatise on Geochemistry. 2nd Edition (Stanford: Stanford University Press), 281–308. doi:10.1016/B978-0-08-095975-7.00308-9
Hubbard, J., and Shaw, J. H. (2009). Uplift of the Longmen Shan and Tibetan Plateau, and the 2008 Wenchuan (M = 7.9) Earthquake. Nature 458, 194–197. doi:10.1038/nature07837
Jia, D., Li, Y., Lin, A., Wang, M., Chen, W., Wu, X., et al. (2010). Structural Model of 2008 Mw 7.9 Wenchuan Earthquake in the Rejuvenated Longmen Shan Thrust belt, China. Tectonophysics 491, 174–184. doi:10.1016/j.tecto.2009.08.040
Jia, D., Wei, G., Chen, Z., Li, B., Zeng, Q., and Yang, G. (2006). Longmen Shan Fold-Thrust belt and its Relation to the Western Sichuan Basin in central China: New Insights from Hydrocarbon Exploration. Bulletin 90, 1425–1447. doi:10.1306/03230605076
Ketcham, R. A., Donelick, R. A., and Carlson, W. D. (1999). Variability of Apatite Fission-Track Annealing Kinetics; III, Extrapolation to Geological Time Scales. Am. Mineral. 84, 1235–1255. doi:10.2138/am-1999-0903
Ketcham, R. A. (2005). Forward and Inverse Modeling of Low-Temperature Thermochronometry Data. Rev. Mineral. Geochem. 58, 275–314. doi:10.2138/rmg.2005.58.11
Kirby, E., Furlong, K. P., Cook, K., Ouimet, W., Shi, X., Wang, E., Kamp, P. J. J., and Hodges, K. V. (2013). “On the Extent and Significance of Oligocene Mountain Building in Eastern Tibet: Eos Trans,” in AGU, Fall Meet. Suppl., Abstract T22E-01.
Kirby, E., Reiners, P. W., Krol, M. A., Whipple, K. X., Hodges, K. V., Farley, K. A., et al. (2002). Late Cenozoic Evolution of the Eastern Margin of the Tibetan Plateau: Inferences from 40Ar/39Ar and (U-Th)/He Thermochronology. Tectonics 21, 1-1–1-20. doi:10.1029/2000tc001246
Lease, R. O., Haeussler, P. J., Witter, R. C., Stockli, D. F., Bender, A. M., Kelsey, H. M., et al. (2021). Extreme Quaternary Plate Boundary Exhumation and Strike Slip Localized along the Southern Fairweather Fault, Alaska, USA. Geology 49, 602–606. doi:10.1130/G48464.1
Li, Y., Allen, P. A., Densmore, A. L., and Qiang, X. (2003). Evolution of the Longmen Shan Foreland basin (Western Sichuan, China) during the Late Triassic Indosinian Orogeny. Basin Res. 15, 117–138. doi:10.1046/j.1365-2117.2003.00197.x
Liu, J., Zhang, P., Lease, R. O., Zheng, D., Wan, J., Wang, W., et al. (2013). Eocene Onset and Late Miocene Acceleration of Cenozoic Intracontinental Extension in the North Qinling Range-Weihe Graben: Insights from Apatite Fission Track Thermochronology. Tectonophysics 584, 281–296. doi:10.1016/j.tecto.2012.01.025
Mattauer, M., Malavieille, J., Calassou, S., Lancelot, J., Roger, R., Hao, Z., et al. (1992). Le chaine Triassique de Songpan-Garze (Ouest Sichuan et est Tibet): Une chaine de plissement-decollement sur marge passive. Comptes Rendus de L’Academie Des Sci. 314, 619–626.
Montgomery, D. R., and Brandon, M. T. (2002). Topographic Controls on Erosion Rates in Tectonically Active Mountain Ranges. Earth Planet. Sci. Lett. 201, 481–489.
Moore, M. A., and England, P. C. (2001). On the Inference of Denudation Rates from Cooling Ages of Minerals. Earth Planet. Sci. Lett. 185, 265–284. doi:10.1016/s0012-821x(00)00380-0
Piotraschke, R., Cashman, S. M., Furlong, K. P., Kamp, P. J. J., Danišík, M., and Xu, G. (2015). Unroofing the Klamaths-Blame it on Siletzia? Lithosphere 7 (4), 427–440. doi:10.1130/l418.1
Reiners, P. W., and Brandon, M. T. (2006). Using Thermochronology to Understand Orogenic Erosion. Annu. Rev. Earth Planet. Sci. 34, 419–466. doi:10.1146/annurev.earth.34.031405.125202
Richardson, N. J., Densmore, A. L., Seward, D., Fowler, A., Wipf, M., Ellis, M. A., et al. (2008). Extraordinary Denudation in the Sichuan Basin: Insights from Low-Temperature Thermochronology Adjacent to the Eastern Margin of the Tibetan Plateau. J. Geophys. Res.-Solid Earth 113, 21. doi:10.1029/2006jb004739
Robert, A., Zhu, J., Vergne, J., Cattin, R., Chan, L. S., Wittlinger, G., et al. (2010). Crustal Structures in the Area of the 2008 Sichuan Earthquake from Seismologic and Gravimetric Data. Tectonophysics 491, 205–210. doi:10.1016/j.tecto.2009.11.010
Roger, F., Jolivet, M., Cattin, R., and Malavieille, J. (2011). Mesozoic-Cenozoic Tectonothermal Evolution of the Eastern Part of the Tibetan Plateau (Songpan-Garzê, Longmen Shan Area): Insights from Thermochronological Data and Simple thermal Modelling. Geol. Soc. Lond. Spec. Publications 353, 9–25. doi:10.1144/SP353.2
Roger, F., Malavieille, J., Leloup, P. H., Calassou, S., and Xu, Z. (2004). Timing of Granite Emplacement and Cooling in the Songpan-Garzê Fold Belt (Eastern Tibetan Plateau) with Tectonic Implications. J. Asian Earth Sci. 22, 465–481. doi:10.1016/s1367-9120(03)00089-0
Royden, L. H., Burchfiel, B. C., King, R. W., Wang, E., Chen, Z., Shen, F., et al. (1997). Surface Deformation and Lower Crustal Flow in Eastern Tibet. Science 276, 788–790. doi:10.1126/science.276.5313.788
Royden, L. H., Burchfiel, B. C., and van der Hilst, R. D. (2008). The Geological Evolution of the Tibetan Plateau. Science 321, 1054–1058. doi:10.1126/science.1155371
Shen, X., Tian, Y., Zhang, G., Zhang, S., Carter, A., Kohn, B., et al. (2019). Late Miocene Hinterland Crustal Shortening in the Longmen Shan Thrust belt, the Eastern Margin of the Tibetan Plateau. J. Geophys. Res. Solid Earth 124, 11972–11991. doi:10.1029/2019JB018358
Shi, X., Kirby, E., Furlong, K., Creason, G., Kamp, P., Xu, G., Wang, G., He, J., Fan, C., Xu, G., Su, Z., and Wang, E. (2018). “Protracted Cenozoic Exhumation in the Hanging wall of the Longmen Shan Thrust belt: Implications for Fault System Architecture and Evolution,” in International Conference for the Decade Memory of the Wenchuan Earthquake, Chengdu, China.
Stockli, D. F., Dumitru, T. A., McWilliams, M. O., and Farley, K. A. (2003). Cenozoic Tectonic Evolution of the White Mountains, California and Nevada. Geol. Soc. America Bull. 115 (7), 788–816. doi:10.1130/0016-7606(2003)115<0788:cteotw>2.0.co;2
Stockli, D. F., Farley, K. A., and Dumitru, T. A. (2000). Calibration of the Apatite (U-Th)/He Thermochronometer on an Exhumed Fault Block, White Mountains, California. Geology 28 (11), 983–986. doi:10.1130/0091-7613(2000)028<0983:cotaut>2.3.co;2
Tan, X.-B., Xu, X.-W., Lee, Y.-H., Lu, R.-Q., Liu, Y., Xu, C., et al. (2017). Late Cenozoic Thrusting of Major Faults along the central Segment of Longmen Shan, Eastern Tibet: Evidence from Low-Temperature Thermochronology. Tectonophysics 712-713, 145–155. doi:10.1016/j.tecto.2017.05.016
Tian, Y., Kohn, B. P., Gleadow, A. J. W., and Hu, S. (2013). Constructing the Longmen Shan Eastern Tibetan Plateau Margin: Insights from Low-Temperature Thermochronology. Tectonics 32, 576–592. doi:10.1002/tect.20043
Tian, Y., Kohn, B. P., Phillips, D., Hu, S., Gleadow, A. J. W., and Carter, A. (2016). Late Cretaceous-Earliest Paleogene Deformation in the Longmen Shan Fold-And-Thrust belt, Eastern Tibetan Plateau Margin: Pre-Cenozoic Thickened Crust? Tectonics 35, 2293–2312. doi:10.1002/2016TC004182
Tian, Y., Li, R., Tang, Y., Xu, X., Wang, Y., and Zhang, P. (2018). Thermochronological Constraints on the Late Cenozoic Morphotectonic Evolution of the Min Shan, the Eastern Margin of the Tibetan Plateau. Tectonics 37, 1733–1749. doi:10.1029/2017TC004868
Wang, E., Kirby, E., Furlong, K. P., van Soest, M., Xu, G., Shi, X., et al. (2012). Two-phase Growth of High Topography in Eastern Tibet during the Cenozoic. Nat. Geosci 5, 640–645. doi:10.1038/NGEO1538
Whipple, K. X., Kirby, E., and Brocklehurst, S. H. (1999). Geomorphic Limits to Climate-Induced Increases in Topographic Relief. Nature 401, 39–43.
Willett, S. D., and Brandon, M. T. (2013). Some Analytical Methods for Converting Thermochronometric Age to Erosion Rate. Geochem. Geophys. Geosyst. 14 (1), 209–222. doi:10.1029/2012GC004279
Xu, G., and Kamp, P. J. J. (2000). Tectonics and Denudation Adjacent to the Xianshuihe Fault, Eastern Tibetan Plateau: Constraints from Fission Track Thermochronology. J. Geophys. Res. 105, 19231–19251. doi:10.1029/2000jb900159
Xue, Z., Lin, W., Chu, Y., Faure, M., Chen, Y., Ji, W., et al. (2021). An Intracontinental Orogen Exhumed by Basement-Slice Imbrication in the Longmenshan Thrust Belt of the Eastern Tibetan Plateau. GSA Bull. 11, 24. doi:10.1130/B35826.1
Zhang, H., Oskin, M. E., Liu-Zeng, J., Zhang, P., Reiners, P. W., and Xiao, P. (2016). Pulsed Exhumation of interior Eastern Tibet: Implications for Relief Generation Mechanisms and the Origin of High-Elevation Planation Surfaces. Earth Planet. Sci. Lett. 449, 176–185. doi:10.1016/j.epsl.2016.05.048
Zhou, M.-F., Yan, D.-P., Wang, C.-L., Qi, L., and Kennedy, A. (2006). Subduction-related Origin of the 750 Ma Xuelongbao Adakitic Complex (Sichuan Province, China): Implications for the Tectonic Setting of the Giant Neoproterozoic Magmatic Event in South China. Earth Planet. Sci. Lett. 248, 286–300. doi:10.1016/j.epsl.2006.05.032
Keywords: thermo-chronology, modeling mountain building processes, temperature histories during exhumation, Longmen Shan, Xuelongbao Massif, Pengguan Massif
Citation: Furlong KP, Kirby E, Creason CG, Kamp PJJ, Xu G, Danišík M, Shi X and Hodges KV (2021) Exploiting Thermochronology to Quantify Exhumation Histories and Patterns of Uplift Along the Margins of Tibet. Front. Earth Sci. 9:688374. doi: 10.3389/feart.2021.688374
Received: 30 March 2021; Accepted: 28 May 2021;
Published: 16 June 2021.
Edited by:
A. Alexander G. Webb, The University of Hong Kong, Hong KongReviewed by:
Yuntao Tian, Sun Yat-Sen University, ChinaCopyright © 2021 Furlong, Kirby, Creason, Kamp, Xu, Danišík, Shi, Hodges. This is an open-access article distributed under the terms of the Creative Commons Attribution License (CC BY). The use, distribution or reproduction in other forums is permitted, provided the original author(s) and the copyright owner(s) are credited and that the original publication in this journal is cited, in accordance with accepted academic practice. No use, distribution or reproduction is permitted which does not comply with these terms.
*Correspondence: Kevin P. Furlong, a3BmMUBwc3UuZWR1
Disclaimer: All claims expressed in this article are solely those of the authors and do not necessarily represent those of their affiliated organizations, or those of the publisher, the editors and the reviewers. Any product that may be evaluated in this article or claim that may be made by its manufacturer is not guaranteed or endorsed by the publisher.
Research integrity at Frontiers
Learn more about the work of our research integrity team to safeguard the quality of each article we publish.