 Ning Cao
 Gen Li
 Meiyan Rong5
 Jinyi Yang
- 1Key Laboratory of Climate, Resources and Environment in Continental Shelf Sea and Deep Sea of Department of Education of Guangdong Province, Guangdong Ocean University, Zhanjiang, China
- 2College of Oceanography, Hohai University, Nanjing, China
- 3CMA-GDOU Joint Laboratory for Marine Meteorology, South China Sea Institute of Marine Meteorology, Guangdong Ocean University, Zhanjiang, China
- 4Southern Marine Science and Engineering Guangdong Laboratory (Zhuhai), Zhuhai, China
- 5College of Ocean and Meteorology, Guangdong Ocean University, Zhanjiang, China
With the continued global warming, quantifying the risks of human and social-economic exposure to extremely high temperatures is very essential. The simulated extreme high-temperature days (EHTDs) with a maximum temperature higher than 35°C (38°C, 40°C) in Southern China during 1980–1999 and 2080–2099 are analyzed using the NEX-GDDP dataset. By comparing the climatology of the two scenario periods, the multi-model ensemble mean patterns show that EHTDs will greatly increase at the end of the 21st century, and its center at 35°C is projected to shift to Guangxi from Jiangxi. Model diversities are fairly small, and the spread increases with T-level rises. EOF analysis shows that the 100-years warming will impact the southern part greater than the northern part. Trend patterns exhibit comparable results to models, but with a relatively large spread. The population and economy exposure to extremely high temperatures are calculated, showing that they both will experience a large increase in future projected decades. In historical decades, the growth of population and Gross Domestic Product have dominated the increasing exposure risks, but these effects weaken with the T-level increases. In future decades, climate change plays a leading role in affecting the exposure, and its effect strengthens with the T-level increases. For historical to future changes, the dominant contributor to population exposure changes is the climate factor (74%), while substantially 90% contribution to economy exposure changes is dominated by the combined effects of climate and economy growth.
1 Introduction
Global climate change is already being associated with increases in the incidence of severe and extreme weather, heavy flooding, and wildfires—phenomena that threaten homes, dams, transportation networks, and other facets of human infrastructure, and it has been a social, economical, and environmental matter of great concern across the world. A sustained warming climate has been shown to exacerbate and trigger certain climate extremes (Easterling et al., 2000), such as heat waves with greater intensity, longer-lasting time, and/or higher frequency (Karl and Trenberth, 2003; Meehl and Tebaldi, 2004), and such extreme events have been known to produce notable impacts on human mortality, regional economies, and ecosystems (Meehl and Tebaldi, 2004). In addition, the societal infrastructure is becoming more sensitive to weather and climate extremes, which would be exacerbated by climate change (Easterling et al., 2000). Developing countries with limited abilities to adapt to these changes are likely to suffer more from the economic impacts of climate change, as well as being the least able to adapt to new climatic conditions, and are expected to suffer disproportionately.
Temperatures are increasing on a global scale revealed by multisource observational data and scenarios simulated data (Sillmann et al., 2013; Blumberg, 2014; Zuo et al., 2015; Zhao and Zhou, 2019; Xu et al., 2020), but at the regional level, the story gets complicated. Owing to different responses to internal variability and anthropogenic influence, climate extreme changes have distinct regional characteristics (Zhao and Zhou, 2019). It is known that extremely hot summers have been increasingly reported in China, and far-reaching social-economic impacts have been caused by such events (Sun et al., 2014). There have been studies on extreme temperature across China using observational data (Ding et al., 2010; Ye et al., 2013; Yin et al., 2014; Pi et al., 2020), and simulated data under both historical and future scenarios (Yang et al., 2014; Dong et al., 2015; Yang et al., 2015; Huang et al., 2016; Wang et al., 2016; Li et al., 2019). In future projections, East Asia manifests severer warming than the global mean under the 1.5°C/2°C warming level (Hu et al., 2017; Lin et al., 2018; Zhao and Zhou, 2019). The fraction of land area with extremely hot summers in China is believed to increase much greater than for the global land surface as a whole (Leng et al., 2016). Chou et al. (2019) found that during 2000–2015, the increasing trend in droughts has shifted gradually from north to south, and the increasing trend in extreme precipitation has shifted gradually from south to north.
Two major downscaling methods, dynamical and statistical, have been developed since the pioneering work of Giorgi (1990). For the regional study, the dynamical downscaling approach, using limited-area regional climate models (RCMs) nested to GCMs, provides a physical-based approximation on finer scales (Bao and Wen, 2017). Zhu et al. (2020) conducted dynamic downscaling to produce a regional dataset that incorporated the period 1986–2100 for central Asia and found it significantly improves the simulation for the mean and extreme climate over central Asia. Statistical downscaling method, on the other hand, plays an important role in performing longer (up to more than 100 years) downscaling work for much larger domains (Bao and Wen, 2017), which is used in the production of NASA Earth Exchange Global Daily Downscaled Projections (NEX-GDDP) dataset that is used in this study.
The Southern China Region mainly comprised of five provinces of Guangdong (GD), Guangxi (GX), Fujian (FJ), Jiangxi (JX), Hunan (HN), and two special administrative regions of Hongkong and Macao, has witnessed rapid economic development and rapid expansion of urban land, which has led to huge urban areas that population and economy highly gather around. The five provinces and two special administrative regions hold more than 300 million people right now. Provinces in Southern China are generally wetter with warmer temperatures than northern regions. Winter is very short, which runs from January to March, but typically very cold with relatively higher humidity. The rainy season lasts from April through September, when temperatures and humidity peak. Along the southeastern coast, in Fujian and Guangdong, the typhoon season lasts from July through September, causing huge losses due to its impacts such as floods, mudflows, and landslides.
The recently published development plan of the Guangdong-Hong Kong-Macao Greater Bay Area (GDHKMC Bay Area) refers to the Chinese government’s scheme to link the cities of Hong Kong, Macau, and nine cities in Guangdong province into an integrated economic and business hub. The Greater Bay Area, taken as a whole, forms the world’s largest mega-city at 66 million people, and 2.0 trillion dollars Gross Domestic Product (GDP, data source: CGTN). In the background of accelerating the building of the Belt and Road, Southern China will be one of the extremely important core regions.
For thermal health hazards, to determine thermal stress, several factors, including air temperature, wind velocity, water vapor pressure, short- and long-wave radiant fluxes, physiological strain, behavior, and the autonomous human thermoregulatory system, need to be considered (Pappenberger et al., 2015). There are more than 100 indices used to assess thermal health hazards. A universal thermal climate index (UTCI) provided by ERA5-HEAT dataset (Napoli et al., 2020) which describes how the human body experiences atmospheric conditions, specifically air temperature, humidity, ventilation, and radiation, is introduced to present the past and current human thermal stress and discomfort in outdoor conditions (See detail in Supplementary Figure 1).
Under a warmer climate system, how will climate change affect the risks of social-economic exposure to extreme high-temperature, especially in the world’s largest mega-city of the Greater Bay Area where population and business gather around? This is a topic that matters a lot. Therefore, it is necessary to understand how much risk of such extreme events that human and social-ecosystem will suffer in the foreseeable future, and try to figure out what people can do to reduce the risk. Based on this, the objective of this work is to quantify projected changes of extremely high temperature from the last 20 years in the 20th century to the last 20 years in the 21st century within Southern China, using the historical scenario and the high-emissions “RCP8.5” global warming scenario simulated daily maximum temperature by climate models. The climatological changes and trend changes are analyzed, and model diversities are also validated. The population and economy exposures are calculated, and possible causes of related changes are discussed.
2 Data and Methods
The study focuses on Southern China Region that is defined as an area of 106°–122°E and 20°–30°N. Two comparable periods of historical 1980–1999 and RCP8.5 warming scenario 2080–2099 are specially analyzed. There is no universal definition of an extreme high-temperature day (EHTD), which varies in different studies. In this work, we use a simple thresholding method and adopt three temperature levels (T-levels) of daily maximum temperature above 35°, 38°, and 40°C. The annual EHTDs at these three levels during the historical period of 1980–1999 and RCP8.5 scenario (Riahi et al., 2011) period of 2080–2099 are calculated using the daily maximum temperature data.
We used two main datasets: 1) The daily maximum temperature data from the NASA Earth Exchange Global Daily Downscaled Projections (NEX-GDDP) dataset; 2) The spatial explicit socioeconomic data including population density and GDP data (with a spatial resolution of
The NEX-GDDP dataset comprises downscaled climate scenarios for the globe that are derived from the General Circulation Model (GCM) runs conducted under the Coupled Model Intercomparison Project phase 5 (CMIP5) and across two of the four greenhouse gas emissions scenarios known as Representative Concentration Pathways (RCPs). The bias-correction spatial disaggregation (BCSD) method (Wood et al., 2004; Thrasher et al., 2012) was used to generate this dataset on the basis of 21 CMIP5 model simulations (Thrasher et al., 2013), with a global spatial resolution of
The GGI (Greenhouse Gas Initiative) scenario database documents the results of a set of greenhouse gas emission scenarios that were created using the IIASA Integrated Assessment Modeling Framework and previously documented in a special issue of the Technological Forecasting and Social Change, including three “baseline” scenarios of different socioeconomic and technological developments, A2r, B1, and B2. The A2r scenario in IIASA-GGI represents a major numerical revision that reflects the most recent long-term demographic outlook with a corresponding lowering of future world population growth.
The population density and GDP data used in this work are based on the A2r scenario. Meanwhile, many scenario assumptions and outcomes of the RCP8.5 including demographic and economic trends or assumptions about technological change are based upon or derived directly from the A2r scenario (Riahi et al., 2007, 2011). That is why we chose RCP8.5 projections in the NEX-GDDP dataset in this work. They can well match with each other when we consider the future population and economy exposure to extremely high temperatures.
The population and economy exposure to extremely high temperatures are defined as the product of decadal mean EHTDs times the population density and GDP data. As is known, a matrix for a specified time of such datasets including population density and GDP data can reflect the mean state of the variable in the previous decade (10 years). So the decades of 1980–1989 (referred as 1980s), 1990–1999 (1990s), 2080–2089 (2080s), and 2090–2099 (2090s) are calculated respectively. Take the 1980s as an example, the population exposure to extremely high temperature equals the product of the population density in 1990 times 1980–1989 mean EHTDs, with a unit of people
To quantitatively evaluate the models’ diversities in representing the period mean state, the Taylor diagram (Taylor, 2001), which can provide a visual framework for comparing model simulation results to Multi-model ensemble (MME) mean, is used. In addition, the Inter-model EOF analysis method (Li and Xie, 2012; Cao et al., 2015) is introduced to capture the major patterns of model diversities in representing the 100-years changes of EHTDs at three T-levels. All trends throughout the article are calculated using the linear ordinary least-square method.
3 Results
3.1 Climatological Change of EHTDs and Model Diversities
The multiannual mean EHTDs at T-35°C, T-38°C, and T-40°C levels averaged over the historical period of 1980–1999, and the RCP8.5 scenario period 2080–2099 within Southern China, based on Multi-model ensemble (MME) mean of all 21 models in NEX-GDDP dataset, are presented in Figure 1.
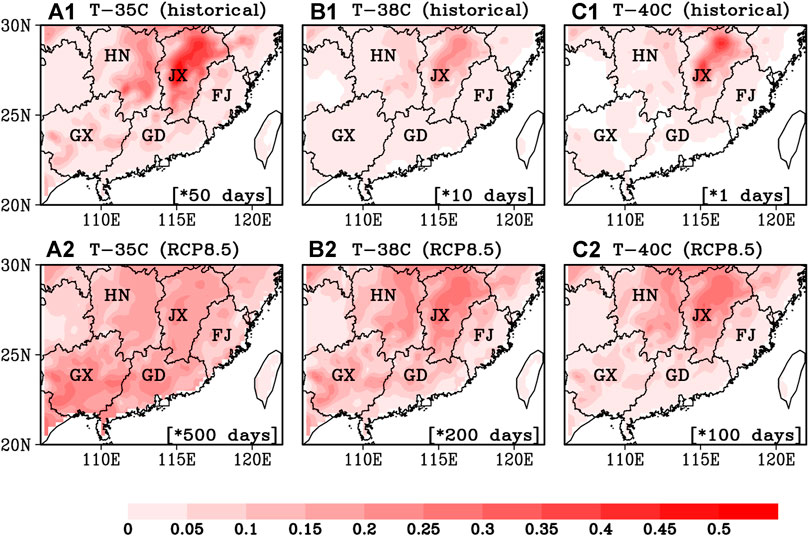
FIGURE 1. All 21 models (in NEX-GDDP dataset) MME mean EHTDs at different T-levels averaged over historical period of 1980–1999, and RCP8.5 period of 2080–2099, within Southern China Region. To gain better visibility, the patterns in the figures are the results of dividing a factor shown on the bottom into the real variable data.
For the historical scenario period 1980–1999 (a1, b1, and c1), it is evident that the EHTDs at each level mainly occur in Jiangxi province, where the T-35°C EHTDs cover more than half a month per year, about 2 days in one year reach the T-38°C level, and days above 40°C hardly exist. By contrast, for the RCP8.5 scenario period of 2080–2099 (a2, b2, and c2), there is a great increase of EHTDs at all three levels, indicating the direct effect of global warming at a scenario of comparatively high greenhouse gas emissions. Based on this high emission scenario, people in Southern China will on average suffer about 2–4 months above 35°C per year, about 1 month above 38°C per year, and half a month above 40°C per year, in the last 20 years of the 21st century. What is noteworthy is that the T-35°C EHTDs max value center is projected to shift to the Pan-Beibu Gulf region, covering the land area of Guangxi province, Leizhou Peninsula. Meanwhile, the T-38°C and the T-40°C EHTDs max value centers still locate in Jiangxi province, although the max value center in Guangxi province also can be significant in some way.
Model diversity in reproducing a climate state has been always a noteworthy problem. To quantify these diversities, Taylor Diagrams are introduced in Figure 2 to show the model biases apart from MME mean (marked as REF on the x-axis) in simulating the EHTDs at different levels averaged over the historical period of 1980–1999, and RCP8.5 period of 2080–2099, within Southern China Region. In these two diagrams, the angular distance from the x-axis denotes the pattern-correlation coefficient between each model output and MME mean. That is, the distance between each simulation and MME mean quantifies the degree of coincidence of EHTDs simulated by the models against the MME mean. The centered root-mean square error (RMSE) between the model-simulated and MME mean patterns are proportional to the distance to the point on the x-axis identified as “REF.” Models simulating patterns of climatology (period mean) that agree well with the MME mean will lie nearest the “REF” point.
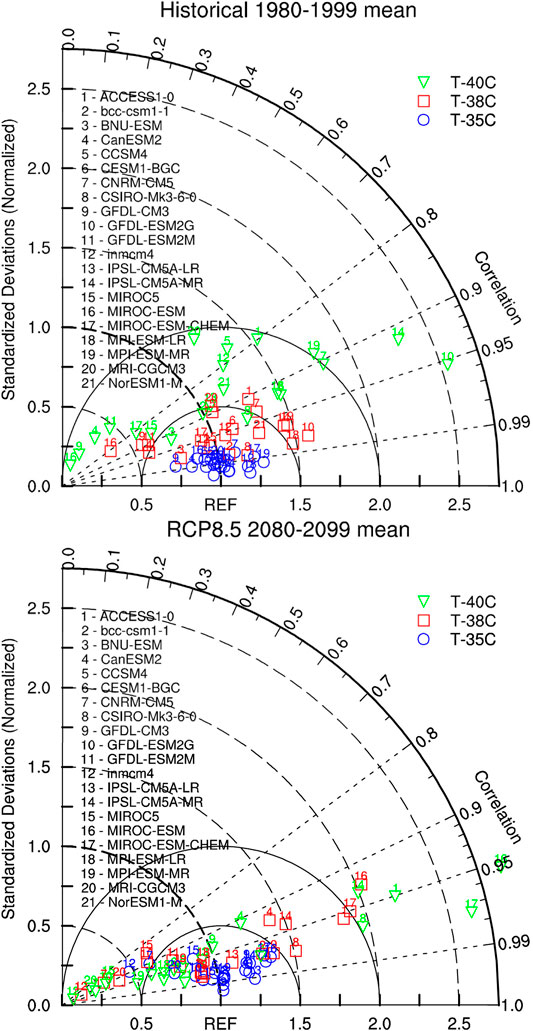
FIGURE 2. Taylor diagram showing model biases apart from MME mean (marked as REF) in simulating the EHTDs at different levels averaged over historical period of 1980–1999, and RCP8.5 period of 2080–2099.
For the historical 1980–1999 period mean (illustrated in Figure 2), patterns of T-35°C EHTDs simulated by 21 models (marked as blue circles) show relatively small diversities from the MME mean, with very high pattern-correlation coefficients ranging from 0.9869 (ACCESS1-0) to 0.9974 (BNU-ESM), and standard deviations ratios ranging from 0.7250 (GFDL-CM3) to 1.2776 (MPI-ESM-MR). When the temperature level rises to T-38°C, the model diversities become more significant, showing pattern-correlation coefficients ranging from 0.8114 (MIROC-ESM) to 0.9864 (CSIRO-Mk3-6-0), and standard deviations ratios ranging from 0.3769 (MIROC-ESM) to 1.5809 (GFDL-ESM2G). Furthermore, at T-40°C EHTDs, the pattern-correlation coefficients range from 0.3771 (MIROC-ESM) to 0.9541 (GFDL-ESM2G), and standard deviation ratios range from 0.1401 (MIROC-ESM) to 2.5430 (GFDL-ESM2G).
Then it comes to RCP8.5 scenario 2080–2099 period mean (illustrated in Figure 2), which shows that almost all models projected EHTDs patterns at all three T-levels highly correlate to the MME mean pattern, with pattern-correlation coefficients above 0.80 at T-35°C level, the pattern-correlation coefficients range from 0.8950 (inmcm4) to 0.9958 (BNU-ESM), and standard deviations ratios range from 0.4737 (inmcm4) to 1.3491 (MIROC-ESM), indicating that most models show pretty good agreement with the MME mean pattern. Then at T-38°C level, the model diversities are enlarged, with pattern-correlation coefficients ranging from 0.8518 (MIROC5) to 0.9799 (CCSM4), and standard deviation ratios ranging from 0.1393 (inmcm4) to 2.0309 (MIROC-ESM). Finally at T-40°C level, the pattern-correlation coefficients range from 0.8650 (MRI-CGCM3) to 0.9835 (NorESM1-M), and standard deviation ratios range from 0.0794 (inmcm4) to 2.8961 (MIROC-ESM).
Thus, Figure 2 mainly presents model diversities in simulating the climatological mean EHTDs during the historical period 1980–1999 and RCP8.5 scenario period 2080–2099, based on the MME mean pattern. We can conclude that in both periods for most models, the model diversities apart from MME mean are fairly small (with relatively high pattern-correlation coefficients and standard deviations ratios closing to 1.0), and with the T-level of EHTDs rises from 35°C to 38°C, and to 40°C, the diversities of these models are enlarged. To further quantify the climatological 100-years changes (2080–2099 mean minus 1980–1999 mean) at three T-levels, an inter-model EOF analysis method is introduced, as is shown in Figure 3 and Figure 4. Traditional EOF analysis (or PCA) is performed using the raw climatological mean EHTDs changes data calculated from model outputs, and each data is a three-dimensional matrix, in which the x-axis denotes longitude, the y-axis denotes latitude, and the third dimension denotes not time but “Model number.” All EOF patterns and PCs are normalized through multiplying or dividing by the square root of eigenvalues.
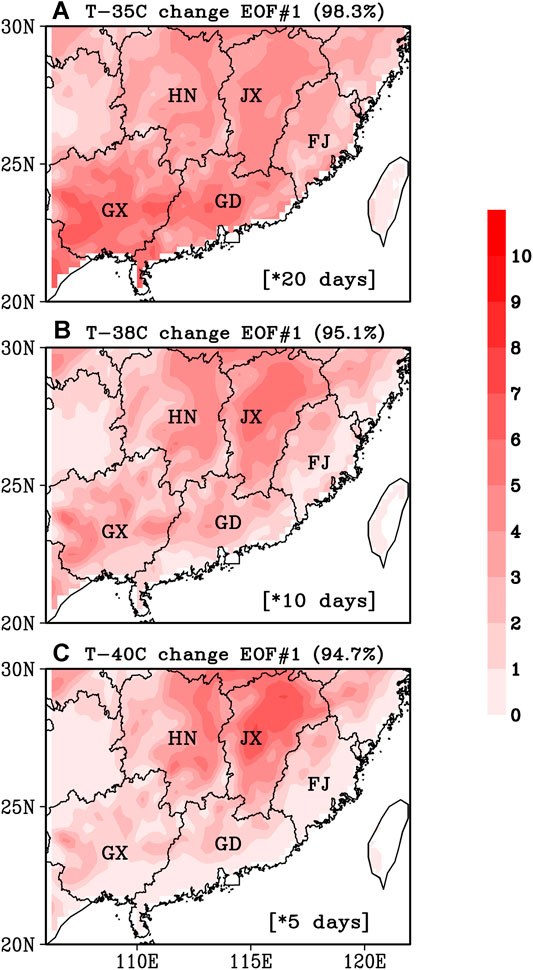
FIGURE 3. The spatial patterns of the first EOF mode at three different T-levels by performing Inter-model EOF analysis on a 100-years change of the EHTDs between historical 1980–1999 period and RCP8.5 2080–2099 period. To gain better visibility, the patterns in the figures are the results of dividing a factor shown on the bottom into the real variable data.
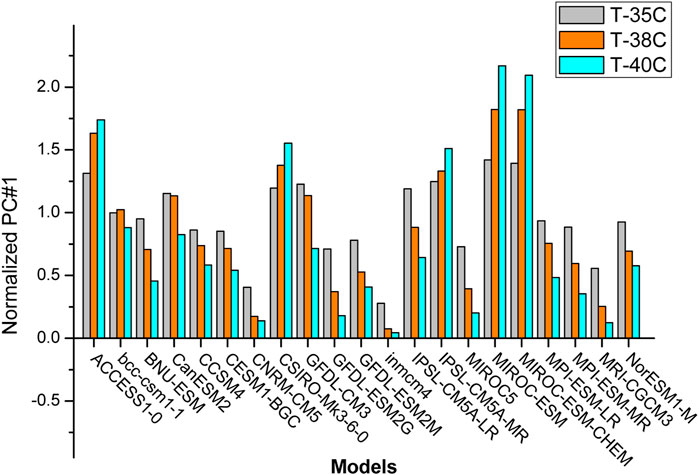
FIGURE 4. The PCs of the first EOF mode at three different T-levels corresponding to Figure 3.
Figure 3 shows the spatial patterns of the first mode captured by inter-model EOF analysis for three T-level EHTDs of 35°, 38°, and 40°C, with the explained variance ratios of 98.3, 95.1, and 94.7%, respectively. Generally speaking, all models show regional warming patterns as a common feature. At T-35°C level, the first principal component (illustrated in Figure 3A) represents a south–north pattern, indicating that the 100-years warming will impact the southern part (about 25°N southward) greater than the northern part, especially in northern Guangdong, entire Guangxi, and Pan-Beibu Gulf region including the Leizhou Peninsula, southern Guangxi, which means that people in these regions will suffer 100 and more days above 35°C at the end of the current century. At T-38°C level, the first principal components (illustrated in Figure 3B) represent a warming pattern with generally two centers of Jiangxi and Guangxi provinces, where people will experience 50 more days above 38°C at the end of the current century. While for T-40°C level (illustrated in Figure 3C), the pattern indicates that Jiangxi province will keep hold of the leading position of extreme high-temperature days occurring, and 20 more days of temperature above 40°C will appear in places such as Jiangxi, Hunan provinces, causing serious harm to human health.
The corresponding PCs of EOF patterns shown in Figure 3 are presented in Figure 4, in which the bar charts are used for 21 models at three T-levels. As we used the raw climatological mean EHTDs changes data calculated from model outputs to perform inter-model EOF analysis, the PCs are unsurprisingly positive for all models. As to the three EOF patterns in Figure 3, the significance of the corresponding mode can be quantified through the amplitude of PCs. There are two points that should be noticed in this figure: 1) For most models (15 of 21, BNU-ESM, CanESM2, CCSM4, CESM1-BGC, CNRM-CM5, GFDL-CM3, GFDL-ESM2G, GFDL-ESM2M, inmcm4, IPSL-CM5A-LR, MIROC5, MPI-ESM-LR, MPI-ESM-MR, MRI-CGCM3, and NorESM1-M) the amplitude decreases with the T-level rises, while there are 5 models (ACCESS1-0, CSIRO-Mk3-6-0, IPSL-CM5A-MR, MIROC-ESM, and MIROC-ESM-CHEM) showing the opposite trend, and the rest 1 model (bcc-csm1-1) has no such trend; 2) There is no remarkable difference between the sequences of models based on the amplitudes of PC#1 at three T-levels, which means that the amplitude differences between T-levels for a particular model are generally smaller than the differences between models at a particular T-level.
3.2 Historical and Future Projected Trends of the EHTDs
Trends are very important in climate research and are ubiquitous in the climate system, even in a fully coupled model. To improve climate prediction and diagnosis using models, linear trend analysis is performed on the EHTDs at three T-levels in Southern China Region during the historical scenario period 1980–1999 and RCP8.5 scenario period 2080–2099, which is the last 20 years of the 20th century and the 21st century respectively. The local linear trends calculated from the MME mean EHTDs data are shown in Figure 5, and the regional mean linear trends of each model simulation are listed in Supplementary Table 1.
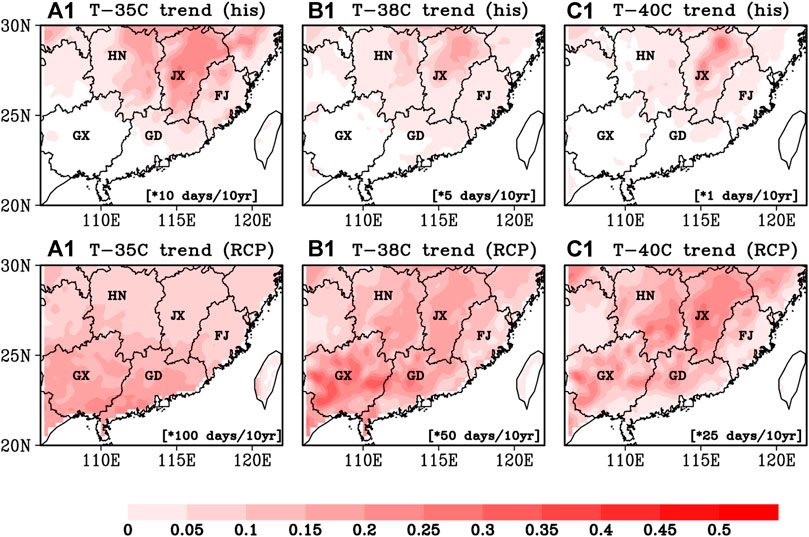
FIGURE 5. Local linear trends of MME mean EHTDs at three T-levels during historical period of 1980–1999, and RCP8.5 period of 2080–2099. To gain better visibility, the patterns in the figures are the results of dividing a factor shown on the bottom into the real variable data.
For historical scenario period 1980–1999 shown in Figure 5 a1, b1, and c1, similar features are captured, showing that the EHTDs increasing mainly occurs in Jiangxi province, with trends of about 1.0 (0.5, 0.1) days per decade at T-levels of 35°C (38°C, 40°C), compared with the regional mean results of 0.37 (0.07, 0.01) days per decade. When the time comes to the last 20 years of the 21st century under the RCP8.5 scenario, however, the trend patterns (illustrated in Figure 5 a2, b2, and c2) are projected to change a lot. One typical feature is the significant increase of EHTDs in Guangxi and Guangdong provinces, especially in the Pan-Beibu Gulf region, and the disappearance of the warming center featured by the historical scenario in Jiangxi province, although there can be seen that the T-40°C level pattern shows a multicenter structure. The projected increase of EHTDs in these warming centers is about 18.0 (10.0, 4.0) days per decade, compared with the regional mean results of 9.46 (5.09, 2.05) days per decade, at T-levels of 35°C (38°C, 40°C).
Supplementary Table 1 and Taylor Diagrams of local trend patterns (not shown) simulated by 21 models can tell us that the diversities are quite large with either positive or negative values, especially for the historical scenario period 1980–1999 in which regional mean trends range from −1.09 (MIROC5) to 2.84 (MPI-ESM-MR) at T−35°C level, from −0.12 (MIROC5) to 0.48 (IPSL-CM5A-MR) at T-38°C level, and from −0.01 (CNRM-CM5) to 0.09 (IPSL-CM5A-MR) at T-40°C level. For the RCP8.5 scenario period 2080–2099, by comparison, the regional mean trends feature overall positive at three T-levels except for a few models such as GFDL-ESM2M, MIROC at T-35°C level, GFDL-ESM2M at T-38°C level, and CNRM-CM5, GFDL-ESM2M, and GFDL-ESM2G at T-40°C level.
By the combined consideration Figure 5 and Supplementary Table 1, we can conclude that the EHTDs increase mainly in Jiangxi province during 1980–1999, while at the end of the 21st century, models projected that the warming center will shift to Guangxi and western Guangdong, where people will suffer more hot days with max temperatures above 35°C in a year, indicating huge risks of human health and economic activity in these regions.
3.3 Population and Economy Exposure to Extremely High Temperature
The above analysis on the projected changes of extreme high-temperature days within Southern China is designed to quantify the future risk of demography and economics with the global climate warming caused by increasing concentrations of greenhouse gases produced due to human activity such as fossil fuel burning and deforestation. Historical and projected population density and GDP (measured at Market Exchange Rates), based on the A2r scenario data from the IIASA GGI Scenario Database Version 2.0, provide data every 10 years from 1990 through 2100.
Supplementary Figures 2 and 3 show the patterns and changes of population density and GDP between 1990 and 2000 and 100-years later 2090 and 2100. In 1990 and 2000 (Supplementary Figure 2a1 and a2), the population density in Southern China mainly ranges from 200 to 500 people (regional mean 270 in 1990, and 300 in 2000) per square kilometer, except that in Pearl River Delta, Chongqing, Changsha, western Taiwan with more than 500 people per square kilometer, and except some areas in Guangxi, Jiangxi Provinces with less than 200 people per square kilometer. By comparison, 100 years later, in 2090 and 2100 (Supplementary Figure 2b1 and b2), the Matthew Effect in population migration boosted by rapid urbanization is undoubtedly revealed, which is more evident by combining the patterns of 100-years changes (2090 minus 1990, and 2100 minus 2000) as illustrated in Supplementary Figure 2c1 and c2. Despite the overall growth of population (regional mean 361 people per square km in 2090, and 377 people per square km in 2100), these figures clearly show that more people will migrate from Fujian, Jiangxi, Guangxi provinces to Guangdong and Hunan provinces, at the end of the 21st century. Similar features can be captured in GDP patterns and changes in Supplementary Figure 3. The Southern China Region has been experiencing a dramatic increase in GDP, in which the regional mean GDP changes from 2.70 thousand US$1990 per hectare (ha, or
To study heat hazards concerning human health and economic activities, the exposure risks changes from the reference period to a projected period are of great importance. Furthermore, what factors cause such changes should be quantitatively analyzed. Thus, the population exposure and economy exposure to extremely high temperatures for three temperature levels are calculated and analyzed. Figures 6–8 separately present the population and economy exposure to extremely high temperature larger than 35°C (38°C, 40°C) for historical decades of the 1980s, 1990s, and projected exposures under RCP8.5 climate scenario and A2r population scenario for future decades of the 2080s and 2090s. Through comparative analysis of the population and GDP exposure to extremely high temperatures during these four decades, both exposure risks have experienced a large increase. Regional mean results show that population exposure changes from 1.14 thousand people
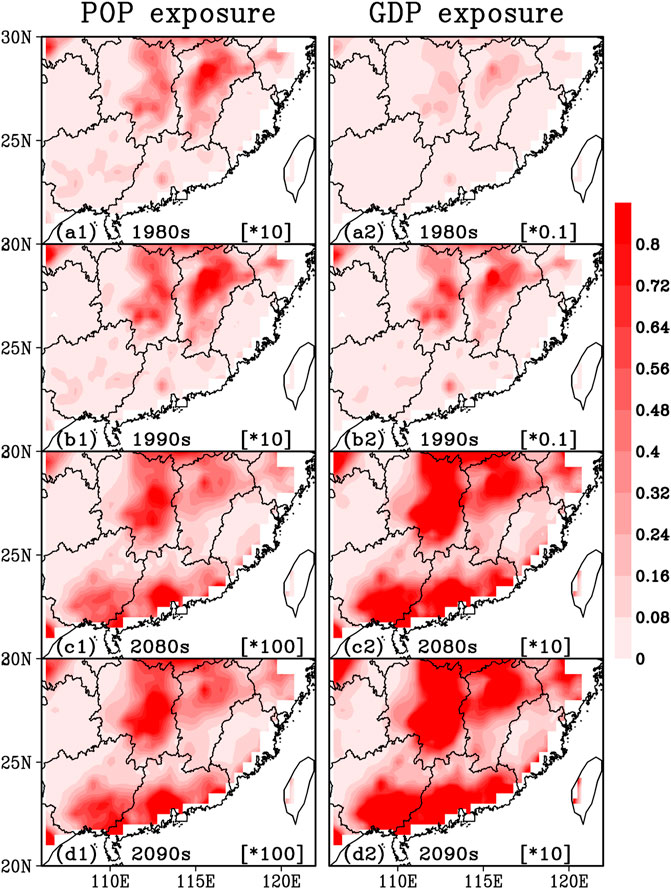
FIGURE 6. Population and economy exposure to temperature larger than 35°C for historical decades of the 1980s, the 1990s, and projected exposures under RCP8.5 climate scenario and A2r population scenario for future decades of the 2080s and the 2090s. The colorbar for population exposure has a unit of thousand people
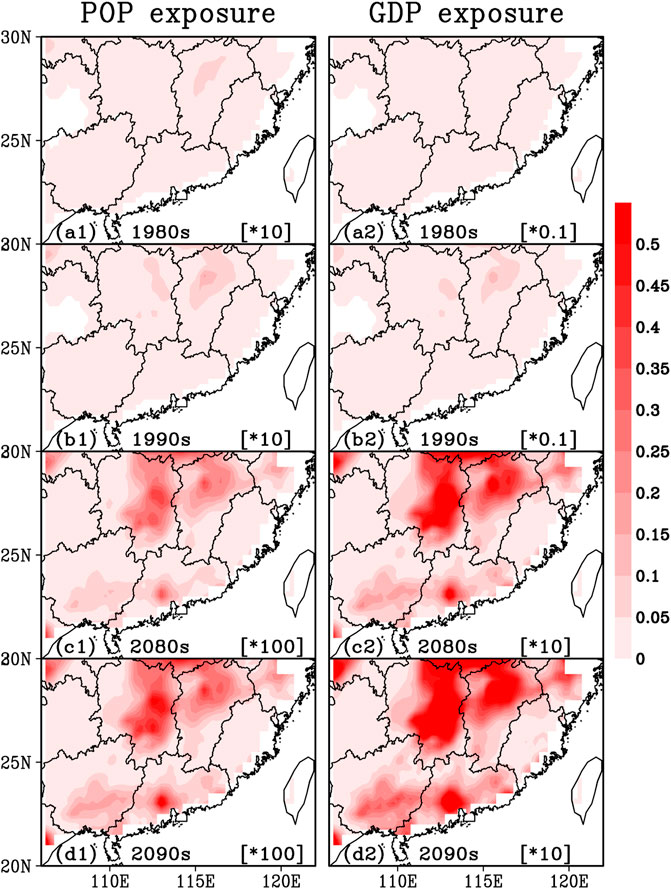
FIGURE 7. Same as Figure 6, but for exposure to temperature larger than 38°C.
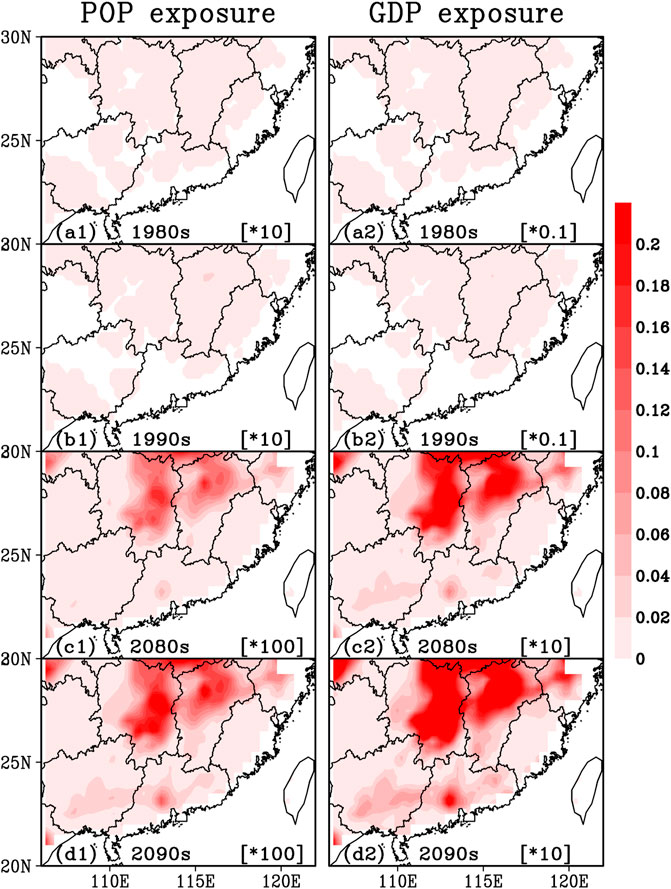
FIGURE 8. Same as Figure 6, but for exposure to temperature larger than 40°C.
3.4 Possible Driving Processes of Exposure Changes
According to the definition of the population and economy exposure to extremely high temperatures, the projected changes of exposure risks can be caused by different factors. Not only the climate factors (i.e., EHTDs), but also the population size, population migration, and economy fluctuations will impact these changes, as well as the combined effect by two or more factors. How do these effects contribute to the total exposure changes? This section will present some results.
For regional mean, the perturbation method is used to analyze the relative contribution of each factor. The results are shown in Table 1 and Table 2, which show analysis of factors affecting changes in population and economy exposure to extremely high temperature in Southern China.
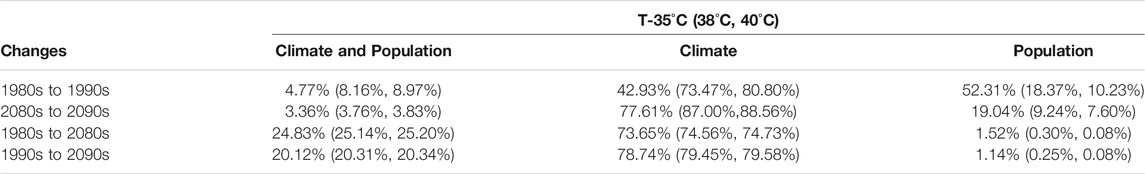
TABLE 1. Analysis of factors affecting changes in population exposure to extremely high temperature in Southern China.
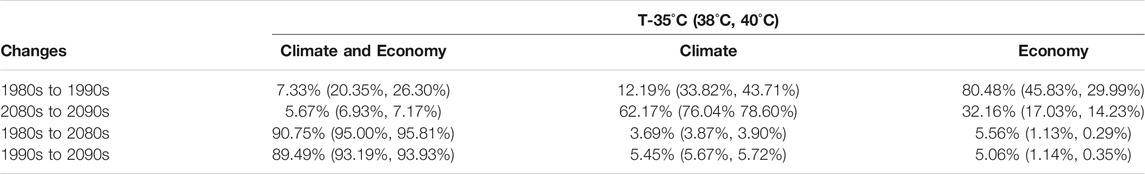
TABLE 2. Analysis of factors affecting changes in economy exposure to extremely high temperature in Southern China.
First, in Table 1, considering the extreme temperature larger than 35°C, during historical decades, population exposure changes from the 1980s to the 1990s are mainly caused by the population growth (accounting for 52%), followed by the EHTDs increase (43%). During projected decades, from the 2080s to the 2090s, the EHTDs increase explains 78% of the population exposure changes. For the 100-years changes, from the 1980s to the 2080s (and from the 1990s to the 2090s), the population growth has slowed down, and the population exposure changes are both dominated by the climate change factor, accounting for 74 and 79% contribution. When considering the T-38°C and T-40°C levels population exposure, similar conclusions can be summarized, except for the historical decadal change from the 1980s to the 1990s, in which the climate change factor accounts for 73 and 81 percent of the exposure changes, much larger than other factors.
The relative contribution of relevant factors resulting in the changes of economy exposure to extremely high temperature can also be analyzed following the same line, as is shown in Table 2. For T-35°C level, historical decadal change from the 1980s to the 1990s is mainly resulted from the economy growth (80%), followed by the climate factor (12%) and the combined effect (7%), while the projected decadal change from the 2080s to the 2090s is mainly controlled by climate factor (62%), followed by the economy factor (32%) and the combined effect (6%). The 100 years change of exposure from the 1980s to the 2080s and from the 1990s to the 2090s are both dominated by the combined effect of climate and economic factors (91 and 89%). When considering the T-38°C and T-40°C levels economy exposure, the relative contributions of climate and economy factors have changed for decadal change in both historical and projected periods. For higher T-level, in historical decades from the 1980s to the 1990s, the effect of climate factor increases (12%, to 34%, to 44% for T-35°, 38°, and 40°C respectively) while the effect of economy factor decreases (80%, to 46%, to 30%), and in future projected decades, the effect of climate factor increases (62%, to 76%, to 79%) while the effect of economy factor decreases (32%, to 17%, to 14%). There is no distinct effect of T-levels on the percentage (substantially higher than 90%) of the total exposure change for 100 years change.
4 Summary and Discussion
4.1 Summary
To quantify the future risks of human and economic exposure to extremely high temperature within Southern China, the yearly extreme high-temperature days (EHTDs) during historical scenario period 1980–1999 and RCP8.5 scenario period 2080–2099 calculated from daily maximum temperature data obtained from the NEX-GDDP dataset including 21 CMIP5 models outputs are analyzed from two aspects of climatological changes and trend changes. Taylor Diagrams and inter-model EOF analysis methods are used to quantify the model diversities in simulating historical and projected climatological mean states. The corresponding population and GDP densities of A2r scenario data from the IIASA GGI Scenario Database Version 2.0 are also used to calculate the population and economy exposure to extremely high temperatures, and the possible physical processes are discussed according to the results of factor analysis.
For climatological mean state, by comparing the historical period and RCP8.5 scenario period, the multi-model ensemble mean patterns show that EHTDs will experience a large increase at the end of the 21st century, and the T-35°C EHTDs center is projected to shift to Pan-Beibu Gulf region from Jiangxi province, but not for the T-38°C and T-40°C centers. Taylor diagrams presenting model diversities in simulating the climatological mean EHTDs show that model diversities apart from MME mean are fairly small, and the diversities increase with the T-level of EHTDs rises. Inter-Model EOF analysis shows that principal mode of EHTDs change at T-35°C level represents a south-north pattern, indicating that the 100-years warming will impact the southern part (about 25° N southward) greater than the northern part, while for T-38°C level, the first principal mode represents a warming pattern with generally two max value centers of Jiangxi and Guangxi provinces, and for T-40°C level, the pattern indicates that Jiangxi will still be the core region where extreme high-temperature day arises. For trend changes, the EHTDs increase mainly in Jiangxi province during historical decades, while models projected that the warming center will shift to Guangxi and western Guangdong, where people will suffer more extremely hot days, indicating large risks of human health and economic activity in these regions.
Using population and GDP densities of A2r scenario data, the population and economy exposure to extremely high temperatures are calculated. Results show that both these two exposure risks have experienced a large increase in the future projected decades. In historical decades, the growth of population and GDP have dominated the increasing exposure risks, but these effects weaken with the T-level increases. However, in future decades, climate change plays a leading role in affecting the exposure, and its effect strengthens with the T-level increases. It is worth noting that, for the exposure change from historical decades to future decades, the dominant contributor to population exposure changes is the climate factor (74%), followed by the combined contribution (25%), while substantially higher than 90% contribution to economy exposure changes is provided by the combined effects of climate and economy growth.
4.2 Discussion
This study provides a quantitative evaluation of future projected population and economy exposure risks to extremely high temperatures in Southern China under a scenario of comparatively high greenhouse gas emissions. In the foreseeable future, with rapid urbanization and economic growth, Southern China will attract more people and businesses, and maintain sustained and fast economic growth and social development. So this study can help the public to better understand the future risks, and help policymakers to take actions in advance to reduce the possible risks, and prompt people to pay more attention to risk management.
Similar analysis can be performed using the globally downscaled climate dataset in other regions with different meteorological and social-economic situations. Meanwhile, there are some limitations in the current work. First, the heat hazard for human health is preferably quantified in humidity-related temperature indices (Kovats and Hajat, 2008), such as wet-bulb temperature (Sherwood and Huber, 2010) or heat index (Anderson et al., 2013). In the study region of this work, humidity diversities are significant, especially along the coastal regions. How the humidity diversities influence the temperature level relating to human and economic exposure needs to be studied in detail using other datasets. Second, the up-to-date model outputs of CMIP6 models have been released, so what figure the new dataset will show to us needs to be studied, and the consistencies and discrepancies in CMIP5 and CMIP6 results also need to be addressed.
Data Availability Statement
The datasets presented in this study can be found in online repositories. The names of the repository/repositories and accession number(s) can be found below: The daily maximum temperature data from NEX-GDDP for this study can be found in the NASA Earth Exchange Global Daily Downscaled Projections [https://www.nccs.nasa.gov/services/data-collections/land-based-products/nex-gddp]. The spatial explicit socio-economic data including population density and Gross Domestic Product (GDP) data is obtained from the International Institute for Applied System Analysis (IIASA) GGI Scenario Database Version 2.0, 2009 [https://www.iiasa.ac.at/web-apps/ggi/GgiDb].
Author Contributions
Conceptualization, NC and GL; Data curation, NC; Formal analysis, NC, MR, JY; Funding acquisition, FX; Methodology, NC; Writing–original draft, NC; Writing–review and editing, GL.
Funding
This work was funded by the Guangdong Basic and Applied Basic Research Foundation (2019B1515120018), the National Key R&D Program of China (2018YFA0605604), the National Natural Science Foundation of China (42075036, 41875071, 41831175), the project of Enhancing School with Innovation of Guangdong Ocean University (230419053), the Fundamental Research Funds for the Central Universities (B210201015), and the program for scientific research start-up funds of Guangdong Ocean University (R17056).
Conflict of Interest
The authors declare that the research was conducted in the absence of any commercial or financial relationships that could be construed as a potential conflict of interest.
Publisher’s Note
All claims expressed in this article are solely those of the authors and do not necessarily represent those of their affiliated organizations, or those of the publisher, the editors and the reviewers. Any product that may be evaluated in this article, or claim that may be made by its manufacturer, is not guaranteed or endorsed by the publisher.
Acknowledgments
The authors acknowledge the use of model-simulated data supplied by model-developing institutes which participate the CMIP5 project, and the advanced support from institutes which provide the NEX-GDDP products and IIASA GGI Scenario Database. The authors would like to thank the editor and three reviewers for their constructive comments which considerably improved the manuscript.
Supplementary Material
The Supplementary Material for this article can be found online at: https://www.frontiersin.org/articles/10.3389/feart.2021.686865/full#supplementary-material
References
Anderson, G. B., Bell, M. L., and Peng, R. D. (2013). Methods to Calculate the Heat index as an Exposure Metric in Environmental Health Research. Environ. Health Perspect. 121, 1111–1119. doi:10.1289/ehp.1206273
Bao, Y., and Wen, X. (2017). Projection of china’s Near-And Long-Term Climate in a New High-Resolution Daily Downscaled Dataset Nex-Gddp. J. Meteorol. Res. 31, 236–249. doi:10.1007/s13351-017-6106-6
Blumberg, G. (2014). Assessing the Potential Impact of Heat Waves in Cities: Implications for hazard Preparation and Planning. Proced. Econ. Finance 18, 727–735. doi:10.1016/S2212-5671(14)00996-4
Cao, N., Ren, B., and Zheng, J. (2015). Evaluation of Cmip5 Climate Models in Simulating 1979–2005 Oceanic Latent Heat Flux over the pacific. Adv. Atmos. Sci. 32, 1603–1616. doi:10.1007/s00376-015-5016-8
Chou, J., Xian, T., Dong, W., and Xu, Y. (2019). Regional Temporal and Spatial Trends in Drought and Flood Disasters in china and Assessment of Economic Losses in Recent Years. Sustainability 11, 55. doi:10.3390/su11010055
Ding, T., Qian, W., and Yan, Z. (2010). Changes in Hot Days and Heatwaves in china during 1961-2007. Int. J. Climatology 30, 1452–1462. doi:10.1002/joc.1989
Dong, S., Xu, Y., Zhou, B., and Shi, Y. (2015). Assessment of Indices of Temperature Extremes Simulated by Multiple Cmip5 Models over china. Adv. Atmos. Sci. 32, 1077–1091. doi:10.1007/s00376-015-4152-5
Easterling, D. R., Meehl, G. A., Parmesan, C., Changnon, S. A., Karl, T. R., and Mearns, L. O. (2000). Climate Extremes: Observations, Modeling, and Impacts. Science 289, 2068–2074. doi:10.1126/science.289.5487.2068
Giorgi, F. (1990). Simulation of Regional Climate Using a Limited Area Model Nested in a General Circulation Model. J. Clim. 3, 941–963. doi:10.1175/1520-0442(1990)003
Hu, T., Sun, Y., and Zhang, X. (2017). Temperature and Precipitation Projection at 1.5 and 2c Increase in Global Mean Temperature. Chin. Sci. Bull. 62, 3098–3111. doi:10.1360/N972016-01234
Huang, D., Zhang, L., and Gao, G. (2016). Changes in Population Exposure to High Temperature under a Future Scenario in china and its Influencing Factors. Acta Geographica Sinica (in Chinese) 71, 1189–1200. doi:10.11821/dlxb201607008
Karl, T. R., and Trenberth, K. E. (2003). Modern Global Climate Change. Science 302, 1719–1723. doi:10.1126/science.1090228
Kovats, R. S., and Hajat, S. (2008). Heat Stress and Public Health: A Critical Review. Annu. Rev. Public Health 29, 41–55. doi:10.1146/annurev.publhealth.29.020907.090843
Leng, G., Tang, Q., Huang, S., and Zhang, X. (2016). Extreme Hot Summers in china in the Cmip5 Climate Models. Climatic Change 135, 669–681. doi:10.1007/s10584-015-1576-y
Li, G., and Xie, S.-P. (2012). Origins of Tropical-wide Sst Biases in Cmip Multi-Model Ensembles. Geophys. Res. Lett. 39, 2012GL053777. doi:10.1029/2012GL053777
Li, J., Wang, A., Guo, D., and Wang, D. (2019). Evaluation of Extreme Temperature Indices over china in the Nex-Gddp Simulated by High-Resolution Statistical Downscaling Models. Acta Meteorologica Sinica (in Chinese) 77, 579–593. doi:10.11676/qxxb2019.032
Lin, L., Wang, Z., Xu, Y., Zhang, X., Zhang, H., and Dong, W. (2018). Additional Intensification of Seasonal Heat and Flooding Extreme over china in a 2c Warmer World Compared to 1.5c. Earth’s Future 6, 968–978. doi:10.1029/2018EF000862
Meehl, G. A., and Tebaldi, C. (2004). More Intense, More Frequent, and Longer Lasting Heat Waves in the 21st century. Science 305, 994–997. doi:10.1126/science.1098704
Napoli, C. D., Barnard, C., Prudhomme, C., Cloke, H. L., and Pappenberger, F. (2020). Era5-heat: a Global Gridded Historical Dataset of Human thermal comfort Indices from Climate Reanalysis. Geosci. Data J. doi:10.24381/cds.553b7518
Pappenberger, F., Jendritzky, G., Staiger, H., Dutra, E., Giuseppe, F. D., Richardson, D. S., et al. (2015). Global Forecasting of thermal Health Hazards: the Skill of Probabilistic Predictions of the Universal thermal Climate index (Utci). Int. J. Biometeorology 59, 311–323. doi:10.1007/s00484-014-0843-3
Pi, Y., Yu, Y., Zhang, Y., Xu, C., and Yu, R. (2020). Extreme Temperature Events during 1960–2017 in the Arid Region of Northwest china: Spatiotemporal Dynamics and Associated Large-Scale Atmospheric Circulation. Sustainability 12, 1198. doi:10.3390/su12031198
Riahi, K., Grübler, A., and Nakicenovic, N. (2007). Scenarios of Long-Term Socio-Economic and Environmental Development under Climate Stabilization. Technol. Forecast. Soc. Change 74, 887–935. doi:10.1016/j.techfore.2006.05.026
Riahi, K., Rao, S., Krey, V., Cho, C., Chirkov, V., Fischer, G., et al. (2011). Rcp 8.5—a Scenario of Comparatively High Greenhouse Gas Emissions. Climatic Change 109, 33. doi:10.1007/s10584-011-0149-y
Sherwood, S. C., and Huber, M. (2010). An Adaptability Limit to Climate Change Due to Heat Stress. Proc. Natl. Acad. Sci. United States America 107, 9552–9555. doi:10.1073/pnas.0913352107
Sillmann, J., Kharin, V. V., Zhang, X., Zwiers, F. W., and Bronaugh, D. (2013). Climate Extremes Indices in the Cmip5 Multimodel Ensemble: Part 1. Model Evaluation in the Present Climate. J. Geophys. Res. Atmospheres 118, 1716–1733. doi:10.1002/jgrd.50203
Sun, Y., Zhang, X., Zwiers, F. W., Song, L., Wan, H., Hu, T., et al. (2014). Rapid Increase in the Risk of Extreme Summer Heat in Eastern china. Nat. Clim. Change 4, 1082–1085. doi:10.1038/nclimate2410
Taylor, K. E. (2001). Summarizing Multiple Aspects of Model Performance in a Single Diagram. J. Geophys. Res. Atmospheres 106, 7183–7192. doi:10.1029/2000JD900719
Thrasher, B., Maurer, E. P., McKellar, C., and Duffy, P. B. (2012). Technical Note: Bias Correcting Climate Model Simulated Daily Temperature Extremes with Quantile Mapping. Hydrol. Earth Syst. Sci. 16, 3309–3314. doi:10.5194/hess-16-3309-2012
Thrasher, B., Xiong, J., Wang, W., Melton, F., Michaelis, A., and Nemani, R. (2013). Downscaled Climate Projections Suitable for Resource Management. Eos, Trans. Am. Geophys. Union 94, 321–323. doi:10.1002/2013EO370002
Wang, Z., Lin, L., Yang, M., and Xu, Y. (2016). The Effect of Future Reduction in Aerosol Emissions on Climate Extremes in china. Clim. Dyn. 47, 2885–2899. doi:10.1007/s00382-016-3003-0
Wood, A. W., Leung, L. R., Sridhar, V., and Lettenmaier, D. P. (2004). Hydrologic Implications of Dynamical and Statistical Approaches to Downscaling Climate Model Outputs. Climatic Change 62, 189–216. doi:10.1023/B:CLIM.0000013685.99609.9e
Xu, Y., Wu, X., Kumar, R., Barth, M., Gao, C. D. M., Lin, L., et al. (2020). Substantial Increase in the Joint Occurrence and Human Exposure of Heatwave and High–Pm Hazards over South Asia in the Mid-21st century. AGU Adv. 1, e2019AV000103. doi:10.1029/2019AV000103
Yang, H., Pan, J., and Zhang, L. (2015). Characteristics of Regional High Temperature and Heat Wave Events over china under Sres A2 Scenario. J. Meteorol. Environ. Sci. (in Chinese) 31, 51–59.
Yang, S., Feng, J., Dong, W., and Chou, J. (2014). Analyses of Extreme Climate Events over china Based on Cmip5 Historical and Future Simulations. Adv. Atmos. Sci. 31, 1209–1220. doi:10.1007/s00376-014-3119-2
Ye, D., Yin, J., Chen, Z., Zheng, Y., and Wu, R. (2013). Spatiotemporal Change Characteristics of Summer Heatwaves in china in 1961-2010. Adv. Clim. Change Res. (in Chinese) 9, 15–20. doi:10.3969/j.issn.1673-1719.2013.01.003
Yin, H., Donat, M. G., Alexander, L. V., and Sun, Y. (2014). Multi-dataset Comparison of Gridded Observed Temperature and Precipitation Extremes over china. Int. J. Climatology 35, 2809–2827. doi:10.1002/joc.4174
Zhao, S., and Zhou, T. (2019). Are the Observed Changes in Heat Extremes Associated with a Half-Degree Warming Increment Analogues for Future Projections? Earth’s Future 7, 978–992. doi:10.1029/2019EF001237
Zhu, X., Wei, Z., Dong, W., Ji, Z., Wen, X., Zheng, Z., et al. (2020). Dynamical Downscaling Simulation and Projection for Mean and Extreme Temperature and Precipitation over central Asia. Clim. Dyn. 54, 3279–3306. doi:10.1007/s00382-020-05170-0
Keywords: extreme heat, CMIP5 scenarios, southern China, NEX-GDDP, exposure risks
Citation: Cao N, Li G, Rong M, Yang J and Xu F (2021) Large Future Increase in Exposure Risks of Extreme Heat Within Southern China Under Warming Scenario. Front. Earth Sci. 9:686865. doi: 10.3389/feart.2021.686865
Received: 28 March 2021; Accepted: 28 June 2021;
Published: 02 August 2021.
Edited by:
Tomas Halenka, Charles University, CzechiaReviewed by:
Dimitrios Melas, Aristotle University of Thessaloniki, GreeceChao Li, East China Normal University, China
Rong Yu, Chinese Academy of Meteorological Sciences, China
Copyright © 2021 Cao, Li, Rong, Yang and Xu. This is an open-access article distributed under the terms of the Creative Commons Attribution License (CC BY). The use, distribution or reproduction in other forums is permitted, provided the original author(s) and the copyright owner(s) are credited and that the original publication in this journal is cited, in accordance with accepted academic practice. No use, distribution or reproduction is permitted which does not comply with these terms.
*Correspondence: Gen Li, bGlnZW5AaGh1LmVkdS5jbg==