
94% of researchers rate our articles as excellent or good
Learn more about the work of our research integrity team to safeguard the quality of each article we publish.
Find out more
ORIGINAL RESEARCH article
Front. Earth Sci. , 26 July 2021
Sec. Quaternary Science, Geomorphology and Paleoenvironment
Volume 9 - 2021 | https://doi.org/10.3389/feart.2021.684365
This article is part of the Research Topic Late Quaternary Hydrological, Paleoenvironmental and Geomorphological Processes in the Tibetan Plateau and Its Adjacent Areas View all 21 articles
 Weiming Liu1,2
 Zhen Zhou3
 Liqin Zhou1,4
 Xiaoqing Chen1,2*
 Brian Yanites5Yanlian Zhou1,4Xuemei Li1Xiaogang Zhang1
The southeastern Tibetan Plateau has been deeply dissected by major rivers and their tributaries into high-relief topography with deep gorges. In this region, most hillslope gradients in the high-relief areas approach a threshold value, and landslides are the dominant surface erosion process. For this work, we analyzed the hillslope erosion process by determining the excess topography from the threshold hillslope. Slope analysis found a similar normal distribution of slope values for six large drainage basins with different lithology, precipitation, and tectonic settings. Overall, 82% of the slopes in our study area were 30 ± 5°, so this was taken as a reasonable range of threshold hillslope angles. We determined that the excess topography calculated for different threshold values all occur along major fluvial inner gorges. We found a linear relationship between excess topography and the mean erosion rate in drainage basins, which indicates that hillslope erosion, especially landslides, is the main erosion process. In contrast, the correlation between excess topography and the slope is only found for low-relief topography. This suggests that excess topography is a better metric than the slope to reflect the spatial distribution of erosion rates in the southeastern Tibetan Plateau. In addition, for a threshold value of 30°, we collected data from 4,430 landslides and found that 71% of these landslides had occurred in an area of excess topography. This implies that most recent landslides did not reduce the slope below the threshold value. As a result, the potential for future landslides remains high in areas where landslides have recently occurred.
Hillslopes usually occupy the main area of mountain ranges which are formed by the downcutting of rivers and glaciers during uplift (Burbank, 2002; Roering et al., 2005; Korup et al., 2010). When the orogen approaches a topographic steady state, a hillslope will continue to steepen in response to increasing rates of river/glacier incision. This leads to diffusive erosion and shallow landslides and, finally, to bedrock landslides. After these processes have occurred, the hillslope gradient will not increase further, which is known as the threshold hillslope (Montgomery, 2001; Burbank, 2002). Under this condition, slope erosion is dominated by bedrock landslides. This not only maintains a steep slope but also limits relief height (Schmidt and Montgomery, 1995), affects valley morphology (Densmore et al., 1997), and prevents river incision because of the landslide debris load in the channel (Ouimet et al., 2007; Korup et al., 2010). Landslides also cause the hillslope gradient to decrease over a relatively short timescale (Roering et al., 2005; Korup et al., 2007). Although landslides dominate erosion processes in several mountain ranges (Hovius et al., 1998; Larsen and Montgomery, 2012), more studies are needed to understand the role of landslides in landscape evolution.
The Tibetan Plateau covers an area of 2.6 × 10⁶ km2. With an average altitude of more than 4,000 m, it is the highest plateau on Earth (Zhang et al., 2002). Overall, the most prominent geomorphic features of the Tibetan Plateau are very flat interiors and steep, abrupt margins (Fielding et al., 1994). The southeastern margin, however, has low topographic gradients and a gradual change in elevation (Clark and Royden, 2000; Clark et al., 2006). This topography allows large amounts of water vapor from monsoons to penetrate deep into the plateau. The precipitation from this is the origin of some famous rivers, including the Yangtze River, the Lancang River, and the Nu River (Figure 1). The incision of these rivers and their main tributaries form deep valleys and low-relief landscape dissection (Clark et al., 2006; Yang et al., 2015). The threshold hillslopes, rapid erosion, and frequent landslides of this area (Ouimet et al., 2007; Ouimet et al., 2009; Henck et al., 2011; Zhang et al., in press) make this an ideal area to study the role of landslides in mountain range evolution.
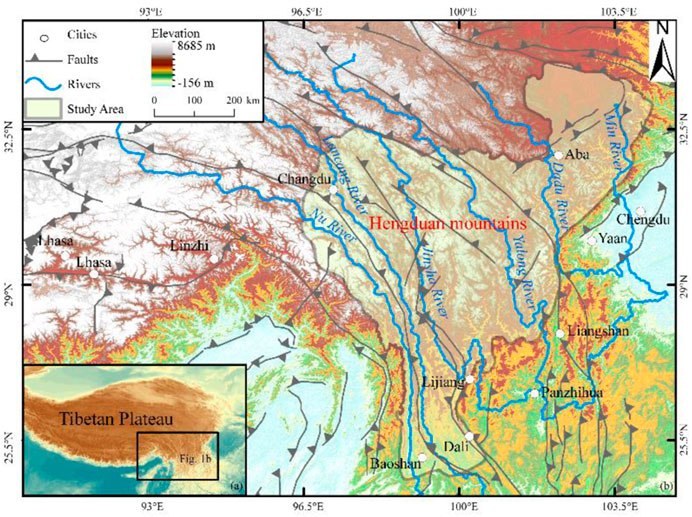
FIGURE 1. Overview of the southeastern Tibetan Plateau. The fault locations are from the study by Taylor and Yin (2009).
At present, landslide inventories in large regions are mainly performed via remote sensing, and some uncertainties remain. For example, estimates of the number of landslides caused by the 2008 Wenchuan earthquake, which, as seismic landslides, are relatively easy to identify, vary from 50,000 to 190,000 (Gorum et al., 2011; Parker et al., 2011; Xu et al., 2014). In addition, there are also large differences in estimates of the volume of these landslides (Li et al., 2014). Excess topography refers to the potentially unstable rock mass that is above the threshold hillslope. This is a quantitative calculation that can approximate landslide erosion (Blöthe et al., 2015; Campforts et al., 2017). In this work, we apply the excess topography model to the southeastern Tibetan Plateau. The distribution of excess topography and its relation with landslides are then used to assess the importance of slope erosion to geomorphic evolution.
The study area is limited to the traditionally defined Hengduan Mountain area. There are six mountains and six rivers, from the western Gaoligong Mountains to the eastern Min River (Figure 1). The region spans 24°40ʹ–34°00ʹ N and 96°20ʹ–104°30ʹ E, and covers 360,000 km3 (Zhang et al., 1997). The southeastern Tibetan Plateau has been separated into several blocks by a series of large strike-slip and thrust faults formed by the convergence of India and Eurasia (Xu et al., 2003). In the northern region, the Min River, the Dadu River, and the Yalong River, all tributaries of the Yangtze River, incise deep gorges. The Jinsha River (upstream of the Yangtze River), the Lancang River, and the Nu River flow in parallel for thousands of kilometers in the southern region, which is called the “Three Rivers region.” Large landslides frequently inundate these river valleys (Liu et al., 2019; Liu et al., 2021).
We first calculated the slope values and then systematically analyzed the slope distribution after removing the relatively flat non-slope component that is far away from the channels. Reasonable threshold hillslopes were obtained using slope distributions over 1° intervals of each river basin (Montgomery, 2001; Korup and Schlunegger, 2007). The excess topography was then calculated following the method of Blöthe et al. (2015). First, the height (
where z is the real elevation of the topography,
The elevation of excess topography zE can then be obtained by subtracting the elevation of the threshold hillslope surface from the real surface elevation as follows:
The calculated excess topography is shown in Figure 2.
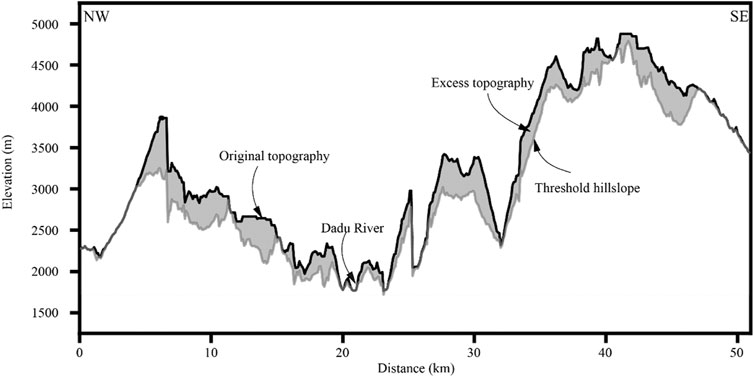
FIGURE 2. Schematic diagram of excess topography. The black line represents the DEM elevation profile, the gray line represents the threshold hillslope surface under 30°, and the gray shaded part represents excess topography.
Among the widely used global digital elevation models (DEMs), only the shuttle radar topography mission (SRTM) and Tan dem-x provide radar data with high elevation accuracy (Rodríguez et al., 2006; Vassilaki and Stamos, 2020). However, after the early free use of Tan dem-x data, it is now difficult to apply for free data (https://tandemx-science.dlr.de/). Therefore, the SRTM is the most widely used in the calculation of geomorphic parameters (Yang et al., 2015; Adams et al., 2020). The geomorphic indexes are analyzed using 30-m SRTM, from the United States Geological Survey (https://earthexplorer.usgs.gov/), and are calculated using TopoToolbox 2 software (Schwanghart and Scherler, 2014).
To analyze the relationship between excess topography and landslides, landslide information was collected from GeoCloud, an online geological database (http://geocloudsso.cgs.gov.cn/) established by the China Geological Survey. Data on 4,430 landslides were collected by local governments in the study area, including the name, type, location, and other disaster information. In addition, 62 erosion rates calculated using in situ10Be in river sand quartz were collected from the OCTOPUS database (Codilean et al., 2018) (Supplementary Table S1). For these, the data from the Min River are primarily from the study by Godard et al. (2010), the data from the Dadu River and the Yalong River are from the study by Ouimet et al. (2009), and the remaining data are from the study by Henck et al. (2011).
All slope values are between 0° and 89°, with an average of 25° (Figure 3). The slope values in the gorges are generally higher than those of the planation far away from the river valley. If a hillslope reaches the threshold, the real slope is given by a normal distribution because it is randomly distributed around the threshold slope. Previous studies have used the mode value to determine the threshold slope (Montgomery, 2001; Korup and Schlunegger, 2007). From the histogram of slope values for each drainage, the Min River, the Dadu River, and the Lancang River all have normal distributions, and the mode values for them are 32°, 33°, and 26°, respectively.
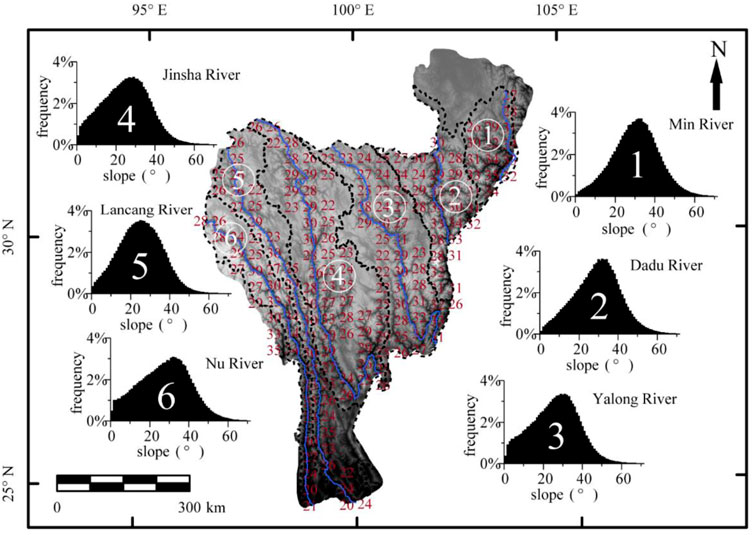
FIGURE 3. Slope of the study area and the slope frequency distribution of each river drainage.
The slope values of the Yalong River, the Jinsha River, and the Nu River, however, have negative skew distributions because of low planation with low slope values. These have the mode values of 29°, 29°, and 32°, respectively. The slope mode values of the six major river basins are all approximately 30° and between 30 ± 5°. A reasonable range of threshold hillslope angles in this study is thus 30 ± 5°. The ranges of the threshold slope values determined for other mountain ranges, such as the Olympic Mountains, the Southern Alps of New Zealand, and the eastern Himalayas, are all also 30 ± 5°, similar to our study area (Montgomery, 2001; Korup and Schlunegger, 2007; Larsen and Montgomery, 2012).
To determine whether different slope values affect the distribution of excess topography, we calculated the volume of excess topography above slope values of 30°, 35°, 40°, and 45°. With an increase in the slope angle, the excess topography volume decreased substantially; the calculated values were 11.6 × 10³ km3, 5.25 × 10³ km3, 2.19 × 10³ km3, and 0.95 × 10³ km3, respectively, which are inversely proportional to the slope angle. The spatial distribution characteristics of the excess topography are similar. However, most of them are concentrated in high-relief areas and valleys (Figure 4). Therefore, slope values do not affect the distribution of excess topography. We focus on excess topography above 30° for this analysis. The thickness of the excess topography differs substantially and ranges from 0 to 2,680 m, with an average of 32.2 m. As with the slope, excess topography is mainly distributed along the channel in the middle and lower reaches of the major rivers.

FIGURE 4. Excess topography under different threshold hillslopes ((A–D) are 30°, 35°, 40°, and 45°, respectively).
To further analyze the correlation between excess topography and the erosion rate, we took the erosion rate of a 10Be sampling site as the center and calculated the excess topography volume and the average slope value within 5 km. The results are shown in Supplementary Table S1. The excess topography volume is widely variable, similar to the erosion rate, and ranges from 0.01 to 18.03 km3. Moreover, there is a clear positive correlation between excess topography and the erosion rate (the correlation coefficient is 0.83, Figure 5A). We have 62 erosion rate values, and the critical value of the correlation coefficient is at a level of 0.001 is 0.41. Therefore, the value 0.83 indicates a linear correlation between excess topography and the erosion rate. This indicates that erosion in the study area is mainly driven by slope erosion. However, the correlation between the slope and the erosion rate is not clear, with a coefficient of only 0.0001 (Figure 5B). This demonstrates that excess topography can better reflect the erosion rate than the slope.
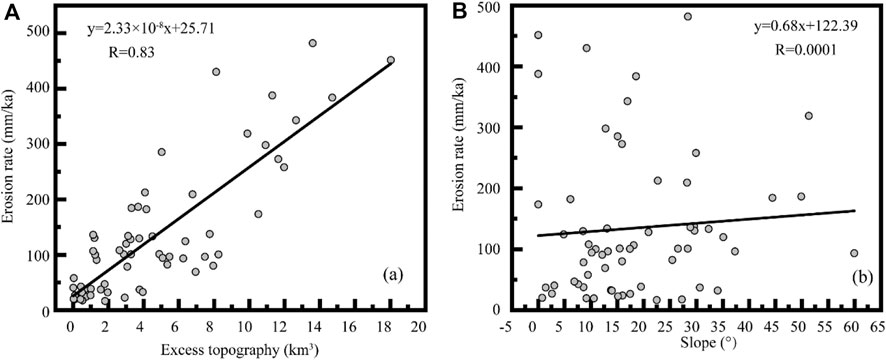
FIGURE 5. (A) Correlation between the erosion rate and the excess topography volume in the study area. (B) Correlation between the erosion rate and the slope in the study area.
Because the erosion rate of the slope is a response to the tectonic uplift, it can quickly adjust. When the uplift rate is high, slope erosion can restrain the increase in topographic relief. This makes the slope values in different regions converge to the threshold hillslope (Burbank, 2002). The excess topography is an extension of the threshold hillslope. When the mountain reaches the threshold hillslope, it should conform to the linear correlation between excess topography and erosion rates.
For example, the slope erosion rate of the eastern Himalayan syntaxis increases more than ten times within 150 km to accommodate the extremely large difference in erosion rates inferred from thermochronometry data, but the slope does not change considerably (Larsen and Montgomery, 2012; Roering, 2012). Continuous tectonic uplift and river undercutting always create topographic relief and provide an opportunity for slope erosion. Excess topography thus continuously exists, and the mountain is in dynamic balance. The formulas for calculating excess topography show that the calculated volume is determined by the slope and the local relief. Both are critical factors that determine the erosion rate (Montgomery and Brandon, 2002). A small change in the slope will cause a major difference in the excess topography, and excess topography indicates the volume of potential landslides. Although it is not clear how long the potential landslide represented by the excess topography will erode, the linear relationship with the erosion rate indicates that the excess topography is more indicative of changes in erosion rates than the slope.
Among the 4,430 landslides studied, 3,146 landslides occurred in excess topography, which is more than 71%. A total of 1,518 landslides were located within excess topography with a height greater than 50 m. This encompassed an area of only 6.7 × 10⁴ km2. The area in which the height of the excess topography is less than 5 m is about 1.67 × 10⁵ km2, and only 554 landslides were recorded. In addition, the landslides that did not occur in an area of excess topography were mostly located in the southeast of the study area (Figure 6). We suggest that the rock strength in the southeastern region is substantially lower because of higher rainfall, resulting in a lower threshold slope value.
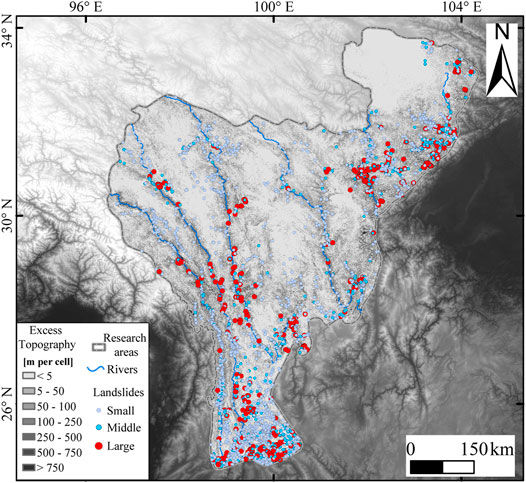
FIGURE 6. Distribution of landslides in excess topography.
Although exact occurrence times are not given in the landslide data, they all occurred between 1949 and 2014. The SRTM-DEM data we used were collected in 2000. Therefore, many of the landslides occurred before the DEM data collection. This indicates that although the landslides occurred and caused a decline in the hillslope, most of them did not reduce the slope below the threshold hillslope. This is consistent with the observation that 75% of the landslides in the western margin of the Himalaya–Karakoram ranges occurred in excess topography (Blöthe et al., 2015).
This is because in the formation of a landslide, a potential slip plane forms first, and the weakness plane subsequently penetrates to form a slip plane. The formation of this weakness plane is related to lithology, fracture development, and so on. In addition, when a slope is steeper, it is under a higher degree of shear stress, and a slip plane forms more readily. Therefore, a landslide is usually not able to reduce the slope below the threshold hillslope. A second landslide is thus likely to occur (Ghazvinian et al., 2010). In other words, existing excess topography requires multiple landslides to be eroded away, and an area with excess topography is at high risk of landslides. Theoretically, when the slope is larger, the same mass of rock is subject to a greater sliding force. Therefore, the slope is an important index in landslide susceptibility identification (Reichenbach et al., 2018). The excess topography represents a steep hillslope, which is prone to future landslides.
We have calculated the slope and excess topography in the southeastern margin of the Tibetan Plateau and analyzed the relationship between landslides and the erosion rate. From this, we propose the following conclusions:
1) In the study area, the slope value is generally 30 ± 5°, which accounts for about 82% of the total area. The modes of the six river drainage slopes are between 26° and 33°, which are also close to 30°. Therefore, 30 ± 5° can be used as a reasonable value range for the threshold hillslope. The amount of excess topography is inversely proportional to the value of the threshold hillslope, and it is spatially distributed mainly along the river channels. The highest values are inside the gorge. The average thickness of excess topography for a slope above 30° is 32.2 m, with a total volume of 11.6 × 10³ km3.
2) The correlation coefficient between the excess topography and the erosion rates on the millennium scale reaches 0.69, which indicates a clear positive correlation. This relationship suggests that erosion is mainly driven by landslides resulting from excess topography. In addition, more than 71% of the 4,430 landslides observed in the study area occurred in excess topography. This implies that landslides generally cannot decrease the slope below the threshold hillslope, allowing for the occurrence of future landslides.
The raw data supporting the conclusions of this article will be made available by the authors, without undue reservation.
XC and WL designed the research; ZZ, LZ, and YZ performed the research; WL, ZZ, XC, BY, XL, and XZ analyzed data; and WL, LZ, BY, and XC wrote the manuscript.
This work was supported by the National Natural Science Foundation of China (grant nos. 41941017, 42071017, 41771023, and 41807448).
Author ZZ was employed by China Railway Eryuan Engineering Group Co., Ltd.
The remaining authors declare that the research was conducted in the absence of any commercial or financial relationships that could be construed as a potential conflict of interest.
All claims expressed in this article are solely those of the authors and do not necessarily represent those of their affiliated organizations, or those of the publisher, the editors and the reviewers. Any product that may be evaluated in this article, or claim that may be made by its manufacturer, is not guaranteed or endorsed by the publisher.
The authors thank Wolfgang Schwanghart for help analyzing parameters and reviewers for constructive comments and suggestions. A special acknowledgment should be expressed to the China–Pakistan Joint Research Center on Earth Sciences that supported the implementation of this study. We thank Katherine Armstrong, PhD, from Liwen Bianji (Edanz) (www.liwenbianji.cn/), for editing the English text of a draft of this manuscript.
The Supplementary Material for this article can be found online at: https://www.frontiersin.org/articles/10.3389/feart.2021.684365/full#supplementary-material
Adams, B. A., Whipple, K. X., Forte, A. M., Heimsath, A. M., and Hodges, K. V. (2020). Climate Controls on Erosion in Tectonically Active Landscapes. Sci. Adv. 6, eaaz3166. doi:10.1126/sciadv.aaz3166
Blöthe, J. H., Korup, O., and Schwanghart, W. (2015). Large Landslides Lie Low: Excess Topography in the Himalaya-Karakoram Ranges. Geology 43, 523–526. doi:10.1130/g36527.1
Burbank, D. W. (2002). Rates of Erosion and Their Implications for Exhumation. Mineral. Mag. 66, 25–52. doi:10.1180/0026461026610014
Campforts, B., Schwanghart, W., and Govers, G. (2017). Accurate Simulation of Transient Landscape Evolution by Eliminating Numerical Diffusion: the TTLEM 1.0 Model. Earth Surf. Dynam. 5, 47–66. doi:10.5194/esurf-5-47-2017
Clark, M. K., and Royden, L. H. (2000). Topographic Ooze: Building the Eastern Margin of Tibet by Lower Crustal Flow. Geol 28, 703–706. doi:10.1130/0091-7613(2000)28<703:tobtem>2.0.co;2
Clark, M. K., Royden, L. H., Whipple, K. X., Burchfiel, B. C., Zhang, X., and Tang, W. (2006). Use of a Regional, Relict Landscape to Measure Vertical Deformation of the Eastern Tibetan Plateau. J. Geophys. Res. 111, a–n. doi:10.1029/2005JF000294
Codilean, A. T., Munack, H., Cohen, T. J., Saktura, W. M., Gray, A., and Mudd, S. M. (2018). OCTOPUS: an Open Cosmogenic Isotope and Luminescence Database. Earth Syst. Sci. Data 10, 2123–2139. doi:10.5194/essd-10-2123-2018
Densmore, A. L., Anderson, R. S., McAdoo, B. G., and Ellis, M. A. (1997). Hillslope Evolution by Bedrock Landslides. Science 275, 369–372. doi:10.1126/science.275.5298.369
Fielding, E., Isacks, B., Barazangi, M., and Duncan, C. (1994). How Flat Is Tibet? Geol 22, 163–167. doi:10.1130/0091-7613(1994)022<0163:hfit>2.3.co;2
Ghazvinian, A. H., Taghichian, A., Hashemi, M., and Mar’ashi, S. A. (2010). The Shear Behavior of Bedding Planes of Weakness between Two Different Rock Types with High Strength Difference. Rock Mech. Rock Eng. 43, 69–87. doi:10.1007/s00603-009-0030-8
Godard, V., Lavé, J., Carcaillet, J., Cattin, R., Bourlès, D., and Zhu, J. (2010). Spatial Distribution of Denudation in Eastern Tibet and Regressive Erosion of Plateau Margins. Tectonophysics 491, 253–274. doi:10.1016/j.tecto.2009.10.026
Gorum, T., Fan, X., van Westen, C. J., Huang, R. Q., Xu, Q., Tang, C., et al. (2011). Distribution Pattern of Earthquake-Induced Landslides Triggered by the 12 May 2008 Wenchuan Earthquake. Geomorphology 133, 152–167. doi:10.1016/j.geomorph.2010.12.030
Henck, A. C., Huntington, K. W., Stone, J. O., Montgomery, D. R., and Hallet, B. (2011). Spatial Controls on Erosion in the Three Rivers Region, southeastern Tibet and Southwestern China. Earth Planet. Sci. Lett. 303, 71–83. doi:10.1016/j.epsl.2010.12.038
Hovius, N., Stark, C. P., Tutton, M. A., and Abbott, L. D. (1998). Landslide-driven Drainage Network Evolution in a Pre-steady-state Mountain belt: Finisterre Mountains, Papua New Guinea. Geol 26, 1071–1074. doi:10.1130/0091-7613(1998)026<1071:lddnei>2.3.co;2
Korup, O., Clague, J. J., Hermanns, R. L., Hewitt, K., Strom, A. L., and Weidinger, J. T. (2007). Giant Landslides, Topography, and Erosion. Earth Planet. Sci. Lett. 261, 578–589. doi:10.1016/j.epsl.2007.07.025
Korup, O., Densmore, A. L., and Schlunegger, F. (2010). The Role of Landslides in Mountain Range Evolution. Geomorphology 120, 77–90. doi:10.1016/j.geomorph.2009.09.017
Korup, O., and Schlunegger, F. (2007). Bedrock Landsliding, River Incision, and Transience of Geomorphic Hillslope-Channel Coupling: Evidence from Inner Gorges in the Swiss Alps. J. Geophys. Res. 112, F03027. doi:10.1029/2006JF000710
Larsen, I. J., and Montgomery, D. R. (2012). Landslide Erosion Coupled to Tectonics and River Incision. Nat. Geosci 5, 468–473. doi:10.1038/ngeo1479
Li, G., West, A. J., Densmore, A. L., Jin, Z., Parker, R. N., and Hilton, R. G. (2014). Seismic Mountain Building: Landslides Associated with the 2008 Wenchuan Earthquake in the Context of a Generalized Model for Earthquake Volume Balance. Geochem. Geophys. Geosyst. 15, 833–844. doi:10.1002/2013gc005067
Liu, W., Zhou, L., Chen, X., Zhou, Z., Wolfgang, S., Hu, X., et al. (2021). The marks of the Dam on the River Elevation Profile of Yalong River basin (In Chinese with English Abstract). Earth Sci. Front. 28, 59–70. doi:10.13745/j.esf.sf.2020.9.1
Liu, W., Carling, P. A., Hu, K., Wang, H., Zhou, Z., Zhou, L., et al. (2019). Outburst Floods in China: A Review. Earth-Science Rev. 197, 102895. doi:10.1016/j.earscirev.2019.102895
Montgomery, D. R., and Brandon, M. T. (2002). Topographic Controls on Erosion Rates in Tectonically Active Mountain Ranges. Earth Planet. Sci. Lett. 201, 481–489. doi:10.1016/s0012-821x(02)00725-2
Montgomery, D. R. (2001). Slope Distributions, Threshold Hillslopes, and Steady-State Topography. Am. J. Sci. 301, 432–454. doi:10.2475/ajs.301.4-5.432
Ouimet, W. B., Whipple, K. X., and Granger, D. E. (2009). Beyond Threshold Hillslopes: Channel Adjustment to Base-Level Fall in Tectonically Active Mountain Ranges. Geology 37, 579–582. doi:10.1130/g30013a.1
Ouimet, W. B., Whipple, K. X., Royden, L. H., Sun, Z., and Chen, Z. (2007). The Influence of Large Landslides on River Incision in a Transient Landscape: Eastern Margin of the Tibetan Plateau (Sichuan, China). Geol. Soc. America Bull. 119, 1462–1476. doi:10.1130/b26136.1
Parker, R. N., Densmore, A. L., Rosser, N. J., de Michele, M., Li, Y., Huang, R., et al. (2011). Mass Wasting Triggered by the 2008 Wenchuan Earthquake Is Greater Than Orogenic Growth. Nat. Geosci 4, 449–452. doi:10.1038/ngeo1154
Reichenbach, P., Rossi, M., Malamud, B. D., Mihir, M., and Guzzetti, F. (2018). A Review of Statistically-Based Landslide Susceptibility Models. Earth-Science Rev. 180, 60–91. doi:10.1016/j.earscirev.2018.03.001
Rodríguez, E., Morris, C. S., and Belz, J. E. (2006). A Global Assessment of the SRTM Performance. Photogramm. Eng. Remote Sens. 72, 249–260. doi:10.14358/PERS.72.3.249
Roering, J. J., Kirchner, J. W., and Dietrich, W. E. (2005). Characterizing Structural and Lithologic Controls on Deep-Seated Landsliding: Implications for Topographic Relief and Landscape Evolution in the Oregon Coast Range, USA. Geol. Soc. America Bull 117, 654–668. doi:10.1130/b25567.1
Schmidt, K. M., and Montgomery, D. R. (1995). Limits to Relief. Science 270, 617–620. doi:10.1126/science.270.5236.617
Schwanghart, W., and Scherler, D. (2014). Short Communication: TopoToolbox 2 - MATLAB-Based Software for Topographic Analysis and Modeling in Earth Surface Sciences. Earth Surf. Dynam. 2, 1–7. doi:10.5194/esurf-2-1-2014
Taylor, M., and Yin, A. (2009). Active Structures of the Himalayan-Tibetan Orogen and Their Relationships to Earthquake Distribution, Contemporary Strain Field, and Cenozoic Volcanism. Geosphere 5, 199–214. doi:10.1130/ges00217.1
Vassilaki, D. I., and Stamos, A. A. (2020). TanDEM-X DEM: Comparative Performance Review Employing LIDAR Data and DSMs. ISPRS J. Photogramm. Remote Sens. 160, 33–50. doi:10.1016/j.isprsjprs.2019.11.015
Xu, C., Xu, X., Yao, X., and Dai, F. (2014). Three (Nearly) Complete Inventories of Landslides Triggered by the May 12, 2008 Wenchuan Mw 7.9 Earthquake of China and Their Spatial Distribution Statistical Analysis. Landslides 11, 441–461. doi:10.1007/s10346-013-0404-6
Xu, X., Wen, X., Zheng, R., Ma, W., Song, F., and Yu, G. (2003). Pattern of Latest Tectonic Motion and its Dynamics for Active Blocks in Sichuan-Yunnan Region. China. Sci. China Earth Sci. 46, 210–226. doi:10.1360/03yd9056
Yang, R., Willett, S. D., and Goren, L. (2015). In Situ low-relief Landscape Formation as a Result of River Network Disruption. Nature 520, 526–529. doi:10.1038/nature14354
Zhang, R., Zheng, D., Yang, Q., and Liu, Y. (1997). Physical Geography of Hengduan Mountain Region (in Chinese with English Abstract). Beijing: Science Press, 151.
Zhang, Y., Li, B., and Zheng, D. (2002). A Discussion on the Boundary and Area of the Tibetan Plateau in China (In Chinese with English Abstract). Geographical Res. 21, 1–8. doi:10.3321/j.issn:1000-0585.2002.01.001
Zhang, Y., Liu, X., Wu, R., Guo, C., and Ren, S. (in press). Research on Cognization, Characteristics, Age and advance of Ancient Landslides along the Deep-Cut Valleys on the Eastern Tibetan Plateau, China (In Chinese with English Abstract). Earth Sci. Front. 28, 94–105. doi:10.13745/j.esf.sf.2020.9.10
Keywords: excess topography, landslides, hillslope erosion, potential landslides, southeastern Tibet
Citation: Liu W, Zhou Z, Zhou L, Chen X, Yanites B, Zhou Y, Li X and Zhang X (2021) Analysis of Hillslope Erosion Based on Excess Topography in Southeastern Tibet. Front. Earth Sci. 9:684365. doi: 10.3389/feart.2021.684365
Received: 23 March 2021; Accepted: 28 June 2021;
Published: 26 July 2021.
Edited by:
Xiangjun Liu, Northwest Normal University, ChinaCopyright © 2021 Liu, Zhou, Zhou, Chen, Yanites, Zhou, Li and Zhang. This is an open-access article distributed under the terms of the Creative Commons Attribution License (CC BY). The use, distribution or reproduction in other forums is permitted, provided the original author(s) and the copyright owner(s) are credited and that the original publication in this journal is cited, in accordance with accepted academic practice. No use, distribution or reproduction is permitted which does not comply with these terms.
*Correspondence: Xiaoqing Chen, eHFjaGVuQGltZGUuYWMuY24=
Disclaimer: All claims expressed in this article are solely those of the authors and do not necessarily represent those of their affiliated organizations, or those of the publisher, the editors and the reviewers. Any product that may be evaluated in this article or claim that may be made by its manufacturer is not guaranteed or endorsed by the publisher.
Research integrity at Frontiers
Learn more about the work of our research integrity team to safeguard the quality of each article we publish.