
94% of researchers rate our articles as excellent or good
Learn more about the work of our research integrity team to safeguard the quality of each article we publish.
Find out more
ORIGINAL RESEARCH article
Front. Earth Sci. , 04 August 2021
Sec. Geohazards and Georisks
Volume 9 - 2021 | https://doi.org/10.3389/feart.2021.684084
This article is part of the Research Topic The New Frontiers of Earthquake Early Warning Systems View all 22 articles
 Angela Schlesinger1*
 Jacob Kukovica1
 Andreas Rosenberger1
 Martin Heesemann1
 Benoît Pirenne1Jessica Robinson1
 Michael Morley2
Southwestern British Columbia (BC) is exposed to the highest seismic hazard in Canada. Ocean Networks Canada (ONC) has developed an Earthquake Early Warning (EEW) system for the region. The system successfully utilizes offshore cabled seismic instruments in addition to land-based seismic sensors and integrates displacement data from Global Navigation Satellite Systems (GNSS). The seismic and geodetic data are processed in real-time onsite at 40 different stations along the coast of BC. The processing utilizes P-wave and S-wave detection algorithms for epicentre calculations as well as incorporation of geodetic and seismic displacement data into a Kalman filter to provide magnitude estimates. The system is currently in its commissioning phase and has successfully detected over 60 earthquakes since being deployed in October 2018. To increase the coverage of the EEW system, we are in the process of incorporating detection parameters from neighbouring networks (e.g., the Pacific Northwest Seismic Network (PNSN)) to provide additional information for future event notifications.
Earthquake Early Warning (EEW) systems rapidly detect and characterize earthquakes to generate alerts so that protective action can be taken before strong ground shaking occurs. Currently, EEW systems operated in Mexico, Japan, South Korea, Taiwan and the United States provide public alerts for some areas with acute seismic hazard. Allen and Melgar (2019) provide a review of currently operational systems and the rapid development that took place over the last 10 years. In comparison to traditional observation-based seismology, the problem setting for an EEW system is different because of the limited time available to make an accurate earthquake detection. The time needed to analyze the full-waveform seismic data over the total duration of an earthquake cannot be afforded; hence algorithms to estimate the location and magnitude of an earthquake are based on the initial P-wave arrival times. In Canada, the southwestern coast of British Columbia (BC) and Vancouver Island are situated tens of kilometres east of the locked portion of the Cascadia Subduction Zone (CSZ) where the Juan de Fuca plate is subducting beneath the North American plate; exposing the region to the highest seismic hazard in the country (Adams et al., 2019). This imposes a great demand for an EEW system that could provide timely notifications for damaging earthquakes, including tsunamigenic megathrust events.
In 2015 Ocean Networks Canada (ONC), in collaboration with Natural Resources Canada (NRCan) (1975), started developing an EEW system for southwestern BC that currently consists of 32 land-based stations and eight seafloor stations (Figure 1). The EEW system combines land-based seismic sensors with seafloor-installed seismic instruments that are connected to ONC’s subsea cabled network (NEPTUNE: North-East Pacific Time-series Undersea Networked Experiments). NEPTUNE is the world’s first multi-node cabled ocean observatory consisting of an 800 km cable loop that drapes across the CSZ (Barnes and Tunnicliffe, 2008). Seismic sensors located at nodal points along the cabled network on top and seaward of the inter-seismically locked portion of the CSZ aim to contribute to more accurate results of offshore earthquake locations and may also lead to more rapid detection times for some events.
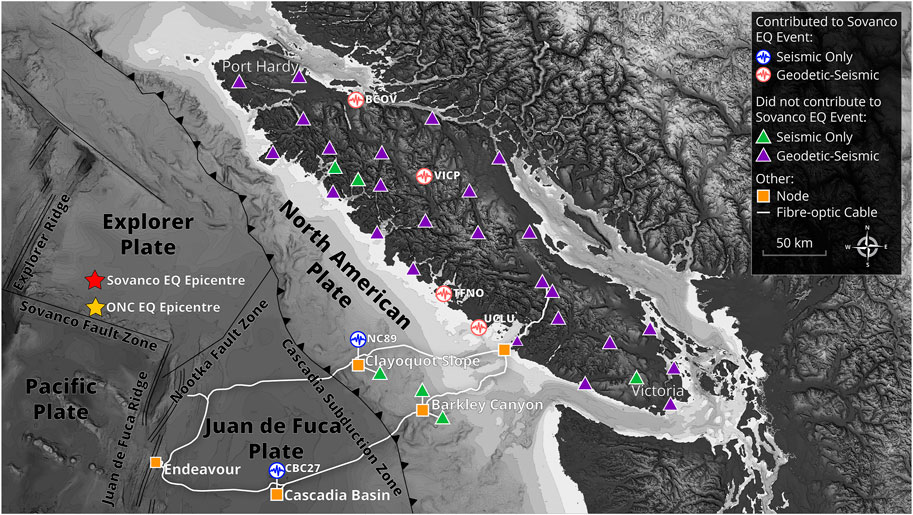
FIGURE 1. Overview map of EEW sites. Purple triangles display sites that have both GNSS and seismic instruments. Green triangles represent sites that only have seismic instruments deployed. The red star marks the location of the M6.6 Sovanco earthquake from October 22, 2018 as identified in the NRCan earthquake catalog. The yellow star displays the location calculated by our EEW system for the same event (see Preliminary Results). Circles with waveform symbols display the geographic locations of sites that contributed to the first notification of this event as described in Preliminary Results. Triangles are stations that did not contribute to detection of the Sovanco earthquake. Data sources: Plate margin boundaries are obtained from Hyndman and Wang, 1995. Digital Elevation model derived from Ryan et al., 2009 NRCAN topography, and Canadian Hydrographic Service bathymetry.
The addition of seafloor seismic instrumentation into a real-time warning system has only been successfully implemented in Japan. The Dense Oceanfloor Network System for Earthquakes and Tsunamis (DONET1) was first installed in 2006 with a series of cabled seafloor nodes that connect various seismic instruments and pressure sensors to monitor the hypocentral region of the Nankai Through, Japan. The Seafloor Observation Network for Earthquakes and Tsunamis (S-net) was installed following the damaging Mw 9.0 Tohoku earthquake and tsunami in 2011. This additional network consists of 150 pressure gauges deployed along the Japan Trench linked by fiber-optic cables (Yamamoto et al., 2016; Wang and Satake, 2021).
By incorporating 3-axial accelerometers to co-located Global Navigation Satellite System (GNSS) stations onshore, the accuracy of calculated magnitudes from P-wave displacements can be significantly improved (Crowell et al., 2009; Bock et al., 2011; Melgar et al., 2013; Niu and Xu, 2014; Li 2015). In collaboration with the Federal Government’s (Natural Resources Canada (NRCan), 1975), its Canadian Hazard Information Service (CHIS), and the Canadian Geodetic Survey, land-based seismic stations have been added and upgraded with geodetic instruments to acquire accurate geospatial displacement information on-site.
Precise point positioning (PPP) algorithms use corrections from the Canadian Spatial Reference System to allow for centimeter-level precision of ground displacements (Rosenberger et al., 2018; Hembroff et al., 2019). Data are then analyzed by applying a Kalman filter (Kalman, 1960; Smyth and Wu, 2007; Bock et al., 2011; Rosenberger et al., 2018) that combines the geodetic and seismic displacement values. The computational complexities involved in reliably combining real-time acceleration and geodetic data streams make ONC’s implementation unique as it takes advantage of the co-location of the two instrument types, the on-site processing of the raw data streams, and the minimal data latency of all sensors. Ongoing research into the viability and contribution of geodetic information in an EEW system is under development by various groups such as Geng et al. (2013), Murray et al. (2018), Goldberg et al. (2019), Ruhl et al. (2019), and Hodgkinson et al. (2020).
In addition to the presence of offshore seismic and pressure sensors located across the locked portion of the subduction zone, the most significant aspect of the EEW system is the capability to process real-time waveform acceleration data and GNSS observations on-site at each onshore station, after which the relevant detection information is sent to a central server to associate detections and issue notifications. This is not common practice in other EEW systems where the full-waveform seismic data from each station are sent via network to a central processing location (e.g., ShakeAlert; Wurman et al., 2007; Hartog et al., 2016; Kohler et al., 2018; Kohler et al., 2020). The specific topographical, geological, and environmental challenges of Vancouver Island increase the difficulty and cost to ensure a reliable, high-bandwidth network coverage to all deployed locations. With on-site processing of seismic and geodetic data, and by transmitting only parametric information to a central server (associator), bandwidth efficiency is greatly improved and operational costs are reduced, alleviating the need for an extensive communication infrastructure.
The EEW system is now successfully operating in testing mode with over 60 successful detections to date. Within this paper we only focus on the detected events between October 2018 and October 2020.
Several algorithms which determine the epicentre of an event from just the first arrival times of a wave (in the case of earthquakes, the P-wave) have initially been developed in acoustical engineering rather than in seismology (Friedlander, 1987; Schau and Robinson, 1987; Huang and Benesty, 2000; Pirinen et al., 2003; Pirinen, 2006; Gillette and Silverman, 2008).
With the arrival of a P-wave at an individual seismic station, the earthquake detection processing is initiated. The seismic signal is processed onsite with a polarization filter and detection algorithms utilizing short time average, long time average ratios (STA/LTA). P-wave detection parameters from at least four seismic stations within a given time window are processed using two independent algorithms to calculate the earthquake epicentre; Direct Grid Search (DGS) and Linearized Least Squares (LLS) (see Figure 2 and Magnitude Estimates).
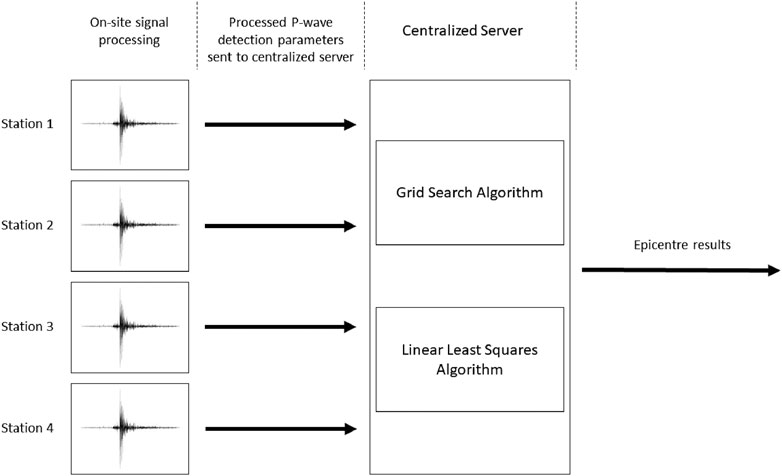
FIGURE 2. Schematic representation of the EEW detection process. The waveform data are processed on site and the detection parameter are sent to a centralized server. There the two algorithms, Direct Grid Search (DGS) and Linearized Least Squares (LLS) method are independently calculating an epicentre location. A more detailed schematic for the EEW system is shown in Figure 4.
We describe the implemented methods for epicentre and magnitude calculations in the following sections.
EEW systems are dependent on the rapid identification of P-waves and S-waves that arrive at a seismic station. P-wave particle motions exhibit small incidence angles and approximately linear polarization in the direction of propagation (Aki and Richards, 2002; Rosenberger, 2010; Rosenberger, 2019). Hence, P-waves can be distinguished from background noise, or other seismic waves such as S-waves, through polarization filtering. The mathematical approach is discussed in more detail in Rosenberger (2010).
Transient signals within the background noise are detected at each station using STA/LTA ratios (Allen, 1982; Küpperkoch et al., 2012; Rosenberger, 2019). An STA/LTA detector works by computing the ratio of two moving-averages with different sizable time window lengths ΔT such that
where
When four or more stations within the network detect a P-wave within a given time window of 120 s, two independent algorithms calculate the earthquake epicentre. Within the DGS algorithm, the region of interest is overlain by a grid of geographical coordinates of appropriate resolution (0.15° × 0.15°; ∼15 km) (Moni and Rickard, 2009; Rosenberger et al., 2019a). The current grid limits are set to be within 46°N and 52.2°N, and 131.75°W and 123°W. The hypocentre depth is fixed at 25 km, which is approximately the depth of the down-dip limit of partial locking of the CSZ (as discussed in McCrory et al., 2004; Wang and Trehu, 2016; Bilek and Lay, 2018). The potential epicentre of an earthquake can be determined with a grid-search based on the time differences of P-wave arrivals (TDOAs) at seismic stations (N). For each grid point, the hyperbolic intersection forward problem is computed and the possible source location based on two stations at a time is computed (i.e., the TDOA between stations 1 and 2, the TDOA between stations 2 and 3, etc … ). The sum of these values at each grid point indicates the maximum likelihood estimate of the source location. The DGS algorithm, from our experience during the commissioning phase, has proven to be very robust in the presence of errors. Additionally, a staggered grid approach, which is described in more detail by Rosenberger et al. (2019a), is used to improve the results and decrease computation times by starting with the larger cell size (0.15°; ∼15 km) and gradually decreasing the overlain grid size (0.05°; ∼5 km). To account for the quality (further referred to as quality factor) of the solution the root-mean-square (RMS) value from all TDOA combinations is calculated as
where
The LLS algorithm follows a method suggested by Gillette and Silverman (2008) as a “one step” source location calculation based on TDOA. The basic algorithm provides two source station coordinates from initially four seismic stations which have detected the signal. By expressing the location problem as a set of linear equations, the epicentre can be resolved by calculating the obtained inverse matrix. As described in Gillette and Silverman (2008) using a singular value decomposition (SVD) to compute the inverse matrix is justified by the fact that for arbitrary source-receiver geometries the matrix may have a high condition number (γ)
The problem is ill-conditioned, meaning small errors in the data may cause large errors in the solution.
The quality of the best solution for the LLS method depends on the choice of the reference sensor r, as the one yielding the smallest product of condition number and TDOA residual:
Further details on ONC’s implementation of the DGS and LLS algorithms can be found in Rosenberger et al. (2019a).
When epicentre results from both methods converge within less than 80 km, an earthquake event is reported with the epicentre location being the mean of both results. A constant initial P-wave velocity of 7,000 m/s is used for the DGS and LLS epicentre calculations (Rosenberger et al., 2019a). The results are refined by testing if smaller or larger velocities would produce a more accurate epicentre based on the quality indicators within these two algorithms. The most accurate epicentre result is determined based on P-wave velocities between 6,000 m/s and 8,000 m/s with an incremental step-size of 500 m/s.
In the last 10 years several research publications have discussed methods that incorporate the information contained in the first few seconds of a P-wave record to estimate reliable event magnitudes quickly (e.g. Kuyuk and Allen, 2013). This is an area of active research and in consequence there is no single, generally accepted set of methods. Additionally, seismologists engaged in EEW research propose a variety of empirical scaling relationships to address different tectonic settings.
For earthquakes with smaller moment magnitudes (M; <M5) two independent algorithms are applied in the EEW system to estimate the magnitude; one based on the frequency content of the early seismic signal (Lockman and Allen, 2007; Wurman et al., 2007), the other based on initial displacement amplitudes (Kuyuk and Allen, 2013). The first algorithm based on Wurman et al. (2007) uses empirically derived scaling relationships incorporating the maximum predominant period
The second method relies on the peak amplitude information of the P-wave displacement (PD), which is derived from the vertical component waveform data. Again the first 4 s of the P-waveform are utilized to retrieve the absolute maximum value (Kuyuk and Allen, 2013). The empiric relationship between the peak displacement (PD) and the epicentral distance (R) to an individual station (i) gives the magnitude estimate,
Kuyuk and Allen (2013) state that this relationship is valid globally and not restricted to one particular tectonic setting.
For larger earthquakes (≥M6), the magnitude estimates will be continuously updated using data from the unbiased displacements over the total duration of the earthquake (Crowell et al., 2013). Assuming the magnitude can be determined from the GNSS data (see next sections), it will be selected as the estimated event magnitude value, otherwise the magnitude will be solely computed from the seismic data.
More recent research shows that incorporating real-time displacement data from GNSS will provide more robust magnitude estimates and updates during a large earthquake (Crowell et al., 2009; Crowell et al., 2013; Hodgkinson et al., 2020; Melgar et al., 2020). The technique to integrate a GNSS component into a seismic station is relatively new and currently only a small number of sites with collocated instruments exist world-wide. The algorithms for the joint processing of seismic and GNSS data to-date have been verified with recorded data in offline experiments (Bock et al., 2011; Melgar et al., 2013; Niu and Xu, 2014; Li, 2015). During large earthquakes greater than M5, these data will provide more reliable magnitude estimates in the early stages of a developing earthquake, especially a megathrust event. The initial algorithms developed within ONC for an EEW system using only acceleration data have been extended to incorporate GNSS data to produce an unbiased displacement time series (Rosenberger, 2019).
In general, accelerometer data provide the high frequency information while applying a high-pass filter to remove any bias. The low frequency content of the derived displacement data is reconstructed when incorporating the GNSS data. Adding these data provide the system with two magnitude parameters – peak displacement (PD) and peak ground displacement (PGD) (Crowell et al., 2013) - that are derived from processing the GNSS data using three separate instances of PPP functions (Zumberge et al., 1997; Collins et al., 2009; Geng et al., 2013; Melgar et al., 2020; Hodgkinson, et al., 2020). The three PPP instances produce independent data streams referred to as the Orbit, Floating-point, and Integer ambiguity solutions based on their increase in accuracy, respectively.
Unbiased displacement values are computed by combining the individual displacement values retrieved from each separate PPP stream with the incoming acceleration values from the seismic instrument, applying a Kalman filter. The two horizontal displacement values are used to calculate the PD, whereas the horizontal and vertical displacement values provide the PGD.
Although the incorporation of GNSS data presents challenges, the solution yields reliable results with added redundancy. Crowell et al. (2013) described empirical relationships for geodetic derived PD and PGD values as,
where R is the hypocentral distance in units of kilometres. PD and PGD displacements are in units of centimetres. For larger events (>M6) the final magnitude estimate from the PGD scaling relationship (Eq. (2.8)) will be prioritized over all other magnitude estimates in the EEW system (Rosenberger et al., 2019c).
ONC in collaboration with NRCan experimentally proved the viability of combining GNSS measurements with acceleration data by using the test system consisting of a Nanometrics Titan SMA accelerometer and GNSS antenna both attached to a rotating base with a radius of 50 cm (Figure 3) (Rosenberger, 2018). The mechanical system, designed by engineers at NRCan, keeps the orientation of the accelerometer fixed in one directionwhile the platform rotates. The unbiased displacement time-series from real-time PPP and acceleration data were obtained with the system conducting six experiments with varying rotational periods between 2.0 and 12.5 s (Rosenberger, 2018). Acceleration data was subjected to a 0.075–5 Hz band-pass filter before processing to replicate real-time conditions in the online processing. Positional results from the Kalman filter matched well with an average standard deviation (STD) of 0.83 cm.
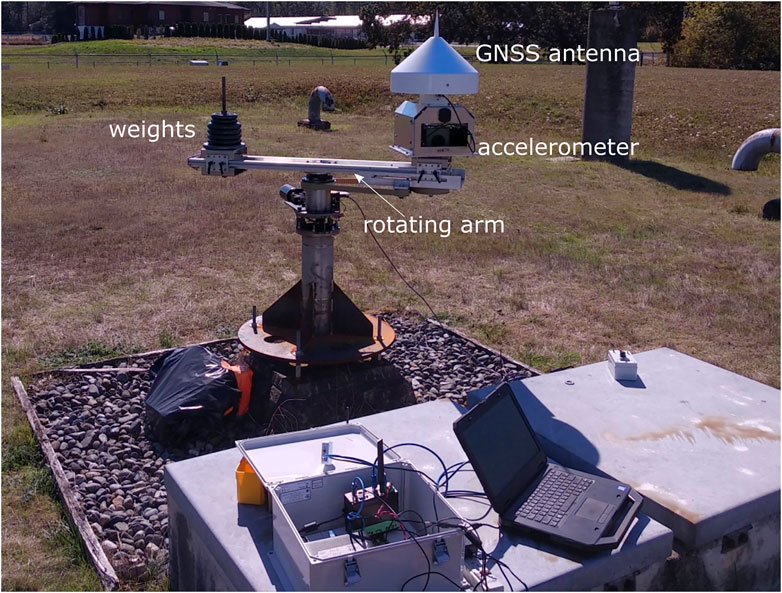
FIGURE 3. The rotating system of an accelerometer and GNSS antenna used for testing the EEW detection algorithms. The base holding the antenna and accelerometer does not change relative orientation while testing. The plan and design was developed by Natural Resources Canada (NRCan) (1975) and the Geodetic Survey of Canada (GSC).
Each land-based station hosts an accelerometer and a fitlet2 computer; a small fanless high-performance mini PC. Additionally, most land-based sites are equipped with GNSS antennas and receivers to obtain the GNSS data. The three-component raw acceleration waveform data are recorded continuously with a 100 Hz sample rate and sent to the fitlet computer, where the detection algorithms (see P- and S-wave Detection) are deployed to compute P-wave and S-wave detection times as well as the seismic Berkeley parameters:
All data are sent from each site (fitlet computer on land-based stations; Port Alberni shore station server for subsea instruments) to the ONC data centre located at the University of Victoria, BC (UVic) and to a redundant data centre in Kamloops, BC. Data are then evaluated (associated), archived, and event notifications are sent out (Figure 4).
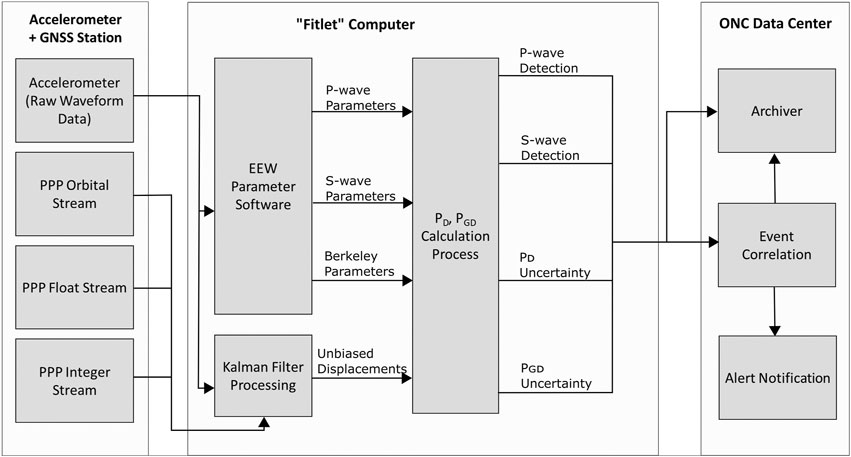
FIGURE 4. Schematic overview of data flow from one land-based site to the event association in ONC’s data centre. The raw acceleration data are processed to obtain the detection times of P-wave and S-wave onsets and the seismically derived Berkeley parameters. The raw acceleration data and the data from the three PPP streams are combined in the Kalman Filter algorithm to obtain unbiased displacement values. These unbiased displacements are correlated with the Berkeley parameter values and the P-wave and S-wave detection times to compute an epicenter and magnitude estimate for the detected event. Parameter data from all sites that detected an event are sent to ONC's data center where the event is associated, archived, and event notifications are sent out.
The robustness and accuracy of the algorithms applied in the EEW system were tested by simulating a large number (>2000) of magnitude M7 earthquakes (Rosenberger et al., 2019b). However, only the epicentre algorithms were tested at this stage. Simulations of GNSS displacement data were not available at the time of testing. The simulated earthquakes were placed at a hypocentral depth of 20 km on individual points of a regular geographical grid (UTM Zone 10N projection) with a grid cell size of 15 km by 15 km. The grid encompasses the locked zone of the CSZ as outlined in Gao et al. (2018). For a limited number of stations in the EEW system, an epicentral distance was calculated for each simulated event. The theoretical arrival times of P-wave and S-wave were computed based on a spherical Earth model travel-time algorithm using the TauP-toolkit hosted at IRIS (see Acknowledgements and Data Resources). The seismic Berkeley parameters, PD and
In this testing approach the first arrivals of four and then ten stations were used in the event association to simulate the progression of time as more stations detected the event. The condition number γ for the matrix inversion of the LLS algorithm serves as a first proxy for the quality of a solution. Figure 5 shows results of the first four stations that detected an event from anywhere in the geographic region. Higher condition numbers (>30) represent areas where an epicentre was more difficult to calculate from P-waves arriving at these few stations. The geographical locations of these poorly constrained regions (yellow to red) are in alignment with the seismic sensor distribution of the network (Figure 5; yellow circles; Note: The testing was performed prior to all EEW stations being deployed hence the sparse distribution.).
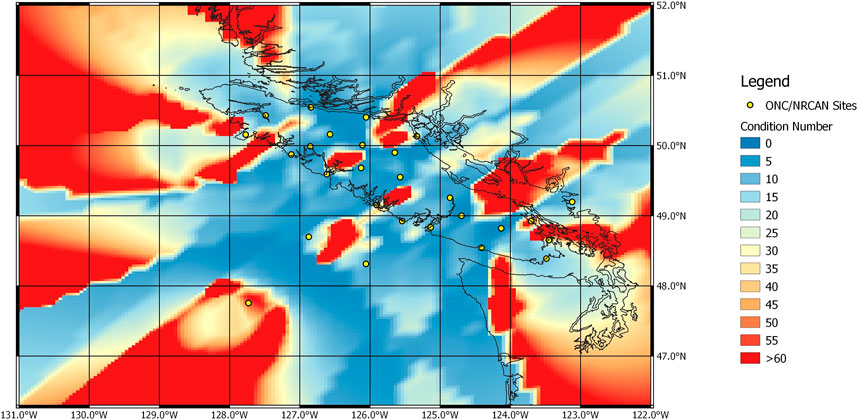
FIGURE 5. Results from the LLS algorithm for the first four stations that detected an event located anywhere in the geographic region. Condition numbers greater than 30 are connected predominately to regions where the relative base-line of the respective four station array is short. Yellow circles mark the location of the seismic stations that were included in the modelling approach.
Waiting for ten stations to detect the same event shows a rapid improvement in quality of the solution (Figure 6). However, the condition numbers for events occurring underneath most of Vancouver Island and less than 200 km offshore from central Vancouver Island only showed slight improvements when including more stations in the detection algorithms.
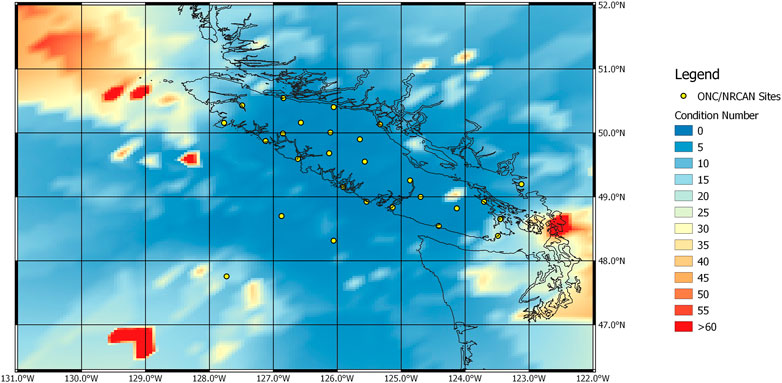
FIGURE 6. Results from the LLS algorithm for the first ten stations that detected an event located anywhere in the geographic region. Condition numbers greater than 30 are connected predominately to regions where the relative base-line of the respective 10 station array is short. Yellow circles mark the location of the seismic stations that were included in the modelling approach.
High condition numbers amplify errors in the real-time data and affect epicentre relocations as well as magnitude estimates. Figure 7 represents spatial errors between true (simulated) and calculated epicentre locations obtained from the averaged solution of the DGS and the LLS algorithms. The results represent the event association from P-wave arrival detections at the first ten stations. Areas with greater distance errors (>30 km) are related to the station array consisting of the first ten stations having increased uncertainty within the Gaussian function utilized by the DGS algorithm as the distances between sources and stations increases (Rosenberger et al., 2019a).
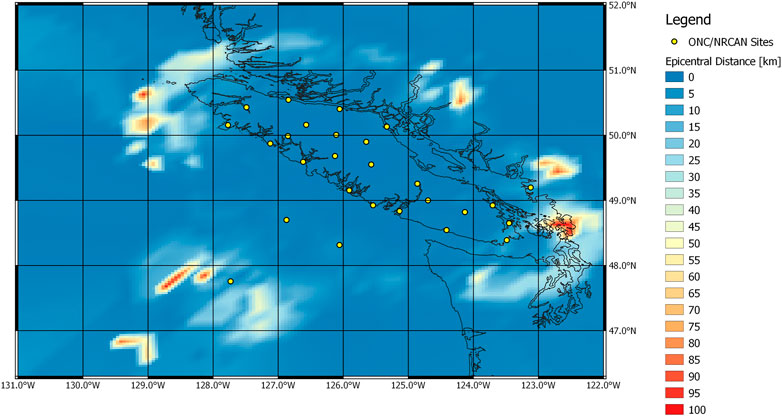
FIGURE 7. The distribution of errors in epicentral distances from the combined algorithms after the first ten stations have detected the P-wave arrival. Yellow circles mark the location of the seismic stations that were included in the modelling approach.
While the EEW system was only partially installed and algorithms were still under development, the first successful event detection occurred in late 2018, when a series of seismic events along the Sovanco Fracture Zone (red star; Figure 1) was detected. According to the NRCan earthquake catalog the first earthquake (M6.1) occurred at 05:39:35 (UTC) on October 22, 2018. The hypocentre was located 218 km SW off the northern tip of Vancouver Island at a depth of 11 km. The first EEW event notification was sent after the P-wave was detected on six stations within the network (see Figure 1; contributing sites are indicated with round symbols). The detections were made within 45 s after the origin time (Figure 8). The notification was issued 4 s later (49 s after the origin time). The initial magnitude reported by the EEW system was M6.6 and later updated to M6.75. The calculated epicentre from the EEW system (yellow star, Figure 1) was within 30 km of the epicentre reported in the NRCan catalog (red star, Figure 1). This event is so far the only earthquake detected within the EEW system that used the unbiased displacements from GNSS for magnitude calculations, due to all other detected events being of magnitudes less than M6. It is important to note the first P-wave from this event was detected on two subsea stations, Clayoquot Slope Bullseye (NC89) and Cascadia Basin (CBC27); 8 s prior to the first land-based station detecting the same event (Figure 8). This allowed for the EEW system to begin classifying the earthquake earlier than if the system relied solely on detections from land based stations. Three aftershocks within the geographical range of the first detection were also recorded by the EEW system and confirmed as successful detections based on results from the NRCan and USGS catalogs.
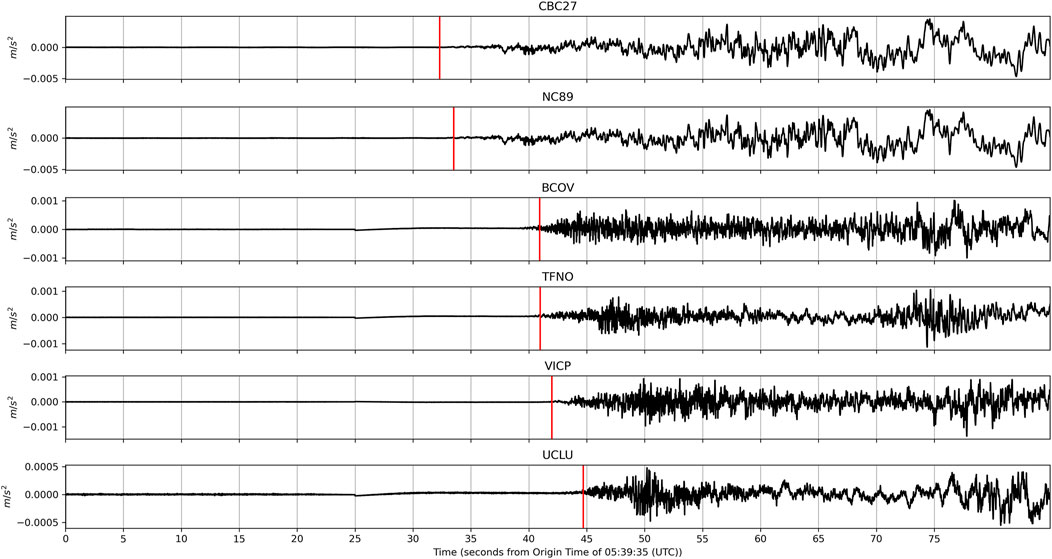
FIGURE 8. Waveforms that contributed to the first notification for the Sovanco earthquake that happened on October 22, 2018. Time is given in seconds after the origin time (5:39:35 UTC) as identified in the NRCan catalog. The first two waveforms were recorded at offshore stations (CBC27: Cascadia Basin: ODP Site 1027, NC89: Clayoquot Slope—ODP Site 889) while the following four traces were recorded onshore (BCOV: Beaver Cove, TFNO: Tofino, UCLU: Ucluelet, VICP: Victoria Peak). Site locations are shown in Figure 1. The parametric data from these sites can be obtained from Ocean Networks Canada Society (2021). Raw waveform data from the subsea instruments can be obtained from Ocean Networks Canada, (2009).
This EEW system does not deliver warnings to the general public but rather notifications of a detected event that occurred within the current grid boundaries of the EEW system. The notification is a small data package that conforms to the Common Alerting Protocol (CAP) format. It details the earthquake epicentre coordinates, the magnitude estimate, the estimated event origin time, and the number of stations that contributed to the detection.
The notification is sent to each subscriber, assumed to be an operator of critical infrastructure or responsible authority in charge of important assets. The distributed software architecture implemented by ONC allows each subscriber to run codes, triggered by the arrival of the notification package, to calculate the time left before shaking starts and the expected Modified Mercalli Intensity (MMI) for their specific locations of concern. Subscribers have the ability to utilize the newly calculated information to trigger their own automated event response workflow based on safety protocols they have designed. For example, a mass transit operator could calculate the MMI for the different locations of their trains across their network and determine the best course of action to maximize the safety of their passengers. ONC aims to reliably provide messages for earthquakes of M4 and greater that are relevant for the region.
Observations made in empirical tests and associated real-time detections show good initial performance of the system. The first successful event detection for the Sovanco earthquake series shows the EEW system can detect earthquake events occurring further offshore from Vancouver Island with a magnitude of >M6. The calculated magnitude values and epicentre locations aligned with those reported by the NRCan and USGS catalogs. Following this first successful event detection, improvements on the algorithms and the overall EEW system were implemented with many subsequent earthquake events successfully detected between October 22, 2018 and October 20, 2020 with magnitudes ranging from M1.7 to M6.5 as confirmed with the NRCan and USGS catalogs.
It should be noted that the system currently is not designed to report for events outside of the grid boundaries or for magnitudes smaller than M4. Even though smaller events might get detected with the sensors distributed within the ONC network and an event association could have been declared, these results will not be considered validated.
Figure 9A shows the distribution of magnitude errors over time (magnitude errors are represented by color and circle size). Magnitudes prior to April 2019 were mostly over-estimated with the EEW system, whereas more recent event notifications tend to slightly underestimate the earthquake magnitude. The black dotted line in Figure 9A indicates the current magnitude threshold for which ONC intents to send out reliable notifications. Further improvement to the station network and synthetic system testing will hopefully improve the magnitude calculations. Events detected with the EEW system that were identified in the NRCan catalog were given priority over the events identified in the USGS catalog. Figure 9B shows errors in final epicentre location compared to catalog epicentres from NRCan and USGS for the same events as shown in the panel above. Smaller errors in magnitude (smaller circles) tend to correlate with more accurate epicenter locations. Figure 9C shows the spatial distribution using the same events and symbols as above. Black lines connect the EEW epicentres (shown as colored circles) to the epicentre locations from the NRCan and USGS catalogs (shown as black points with priority given to events catalogued by NRCan).
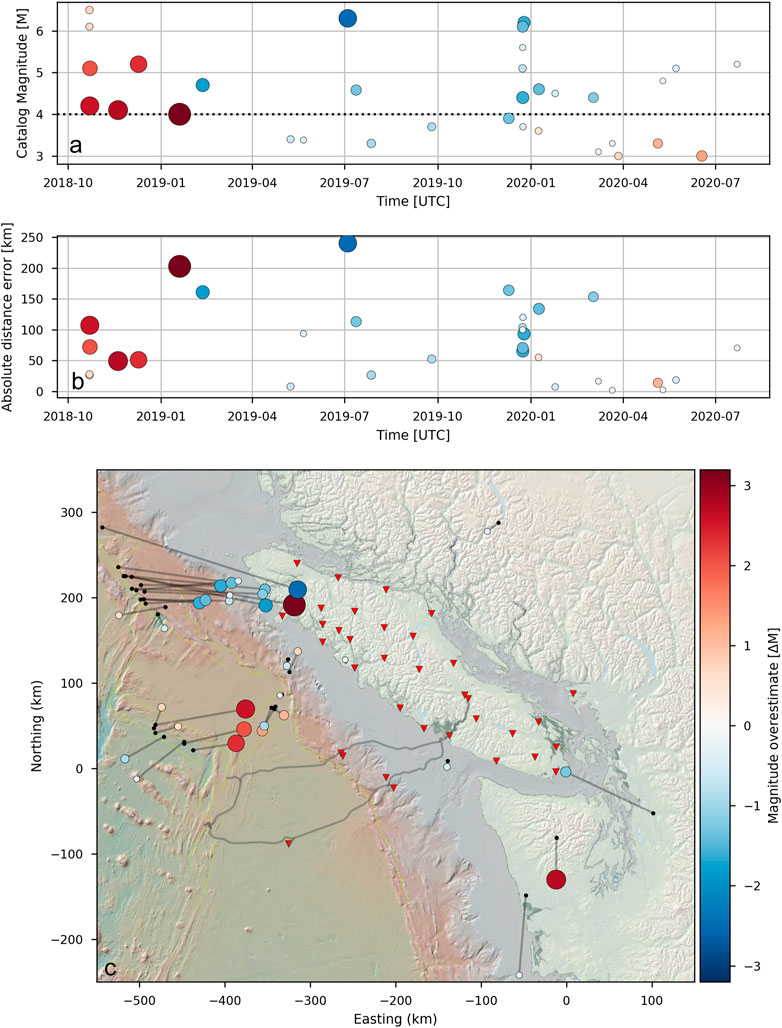
FIGURE 9. (A) Time series of magnitude errors of the final EEW system event notification in relation to the same events detected and cataloged by NRCan or USGS (priority was given to NRCan cataloged events). The magnitude error is represented by the colour and the size of the circles. The black dotted line highlights our goal of generating reliable notifications for relevant events of ≥M4. (B) Time-series of epicentral distance errors for the same events and represented by the same symbols as in (A). (C) Map view of the events shown in (A) and (B). We only show events recorded by the EEW system between October-2018 and October-2020 with magnitudes ≥ M3. The EEW system generated epicentres (colored circles) and the reference epicenter locations retrieved from NRCan or USGS (black dots) are connected by lines.
The spatial distribution of location errors aligns with the findings of our test results described in Algorithm Testing. The epicentre locations of events especially to the north-west and south-east of the network are not well constrained. This is well demonstrated by a series of events that took place on the southern section of the Queen Charlotte Fault Zone. The locations that our EEW system estimates for these events are systematically too close to the network, resulting in underestimated magnitudes. All earthquakes that occurred close to the shoreline or underneath Vancouver Island were successfully detected with significantly smaller epicentre differences and closer magnitude estimates. The NRCan and USGS catalogs contain no events ≥ M3.5 with epicenters on Vancouver Island or the CSZ offshore Vancouver Island that were missed by our EEW system during the studied time range.
Over the next couple of years, the EEW system will undergo a more thorough system testing which will incorporate simulated events that represent megathrust rupture earthquakes using the approach detailed in Melgar et al., 2016. Additionally, improvements to the EEW network are underway, mostly to reduce overall system latency. On average, there is a 2.5 s latency that comprises the computation time on the fitlet computers at the various sites and the data transfer from each site to the two servers in operation within the system. The ∼400 km distance between these servers is intentional in case of catastrophic damage occurring in one of the cities. The latency of the processed PPP streams arriving at the server locations is slightly larger, hence their data incorporation into the magnitude computation increases the latency of the magnitude parameters on average to 5 s after a P-wave detection occurred at any individual station. However, if the PPP streams are not utilized in the magnitude computation, only the seismic derived Berkeley parameters are applied and the latency decreases.
Latency issues pose integral challenges to achieve high efficiency and accuracy of a system; however, there are approaches used to overcome latency. Firstly, added network densification increases the number of stations that can contribute to detection. Station failures affect latency, and so by adding more stations, system-wide internal redundancy can be improved. Additionally, volatile weather conditions cannot be ignored. Weather varies greatly across Vancouver Island, where most of the land-based stations are located. The winter months are especially harsh, adding difficulty and challenges to maintaining instrument uptime. Consequently, station outages and data latencies can be mitigated by densifying the station network and increasing local station reliability with resilient power supply systems and multiple data paths.
Lastly, it is beneficial to identify site-specific characteristics that impact the instrument response to a seismic signal. As seismic waves travel through the subsurface, changes in ground velocity greatly affect the ground shaking observed by accelerometers, or the travel time for a P-wave to reach a station. Applying constant parameters across the entire system could skew the calculated magnitudes or epicentres if a station does not account for amplification factors that affect the recording. We intend to test the detection algorithms with simulated earthquake events overlain by measured noise floor values for urban sites to identify limits in our detection approach.
To increase its coverage, the modular EEW system architecture has allowed us to incorporate detection parameters from neighbouring networks. Through the Pacific Northwest Seismic Network (PNSN), additional P-wave and S-wave detection times and seismic Berkeley parameters are streamed to the ONC server and contribute to earthquake event associations, and conversely the parameters extracted from our sensors are made available to PNSN. Validation of these station contributions to limit erroneous detections is currently underway.
The EEW system developed by ONC in collaboration with NRCan has been successfully operating in test mode since September 2018. It’s ability to incorporate offshore seismic stations thanks to ONC’s NEPTUNE cabled observatory, to correlate geospatial GNSS data with collocated acceleration data, and to calculate real-time onsite earthquake detection parameters makes this EEW system one of the more advanced systems in the world. The addition of underwater seismic stations contributes to a potential decrease in warning time for offshore events when compared to purely land-based seismic networks as shown for the Sovanco earthquake event detection. The combination of seismic and geodetic data is leading-edge technology that was experimentally validated using a controlled test setup (section 2.5.2) and the first successful M6 earthquake detections on October 22, 2018. Lastly, on-site computations of P-wave detections and displacement values greatly reduce the overall bandwidth usage for an EEW system and allow for efficient and immediate implementation of the Kalman filter to combine accelerometer and GNSS-based ground displacement data. Algorithm testing has shown the station distribution within the area of interest is adequate for detecting earthquake events that occur ∼120 km offshore and underneath Vancouver Island. In addition, tests have shown that four stations are sufficient for reliably calculating an earthquake epicentre when using the LLS and DGS algorithms. The EEW system still needs to be further tested and improved to enhance its reliability and detection accuracy. Upgrades to the systems infrastructure (e.g. improved power supplies and communication links) will increase the system reliability. Performing site-specific characterizations will improve the overall accuracy and further densifying the EEW network would increase the number of contributing sites available for an event detection. This could reduce the detection time, as well as add more redundancy to the overall network.
Currently ONC, and its partners at Natural Resources Canada, are performing the commissioning of the system. At this time, reviews on the current status of the system are on-going and concerns mentioned in the Discussion and Conclusions sections are being addressed. To increase the coverage of the EEW system, work on incorporating detection parameters from neighbouring networks such as the Pacific Northwest Seismic Network (PNSN) is under way with the objective of providing additional information for events close to the southern border of the detection grid.
Real-time and historical earthquake parameter data from the accelerometer and PPP streams in the context of this project can be obtained by visiting http://data.oceannetworks.ca/PlottingUtilitydata.oceannetworks.ca. Parameter data from instruments that contributed to the Sovanco earthquake event detection can be obtained from Ocean Networks Canada Society (2021). The raw acceleration waveform data from instruments that contributed to the Sovanco event shown in this article can be obtained from IRIS (Ocean Networks Canada, 2009). The raw acceleration waveform data from shared NRCan sites can be obtained from Natural Resources Canada (NRCAN Canada, 1975). Both the ONC and IRIS data archives are World Data System (https://www.worlddatasystem.org/) certified science data repositories. The TauP calculation toolkit can be accessed from IRIS (http://services.iris.edu/irisws/traveltime/docs/1/builder/).
AS, JK, AR, and MH contributed to conception and design of the study. AR provided the initial concept and methods. AS wrote the first draft of the manuscript. MH provided the scientific oversight. BP and JR are the projects managers and contributed to reviewing the finalized manuscript. MM contributed to reviewing the final manuscript. All authors contributed to manuscript revision, read, and approved the submitted version.
The authors declare that the research was conducted in the absence of any commercial or financial relationships that could be construed as a potential conflict of interest.
All claims expressed in this article are solely those of the authors and do not necessarily represent those of their affiliated organizations, or those of the publisher, the editors and the reviewers. Any product that may be evaluated in this article, or claim that may be made by its manufacturer, is not guaranteed or endorsed by the publisher.
We would like to thank Emergency Management BC, part of the Government of the Province of British Columbia and the Federal Government of Canada for funding the project through the Canada Safety and Security Program. This work is the result of collaborations between ONC and the Canadian Hazard Information Service (CHIS), the Canadian Geodetic Service (CGS) and the Geological Survey of Canada (GSC with staff located at the Pacific Geoscience Centre), all within the Canadian Federal Government’s (Natural Resources Canada (NRCan), 1975). Additional institutions key to the success of this project include the Canadian and United States Navies; the Canadian Coast Guard; the Pacific Northwest Seismic Network (PNSN); Ocean Exploration Trust; Shared Services Canada; ProTrans; BC Hydro; the Pacheedaht First Nation; Mosaic Forest Management; various provincial and municipal authorities; Public Safety Canada; and the Defence Research and Development Department. The authors would also like to acknowledge key people inside ONC and NRCan including Paul Collins (CGS), Joe Henton (CGS), Eli Ferguson (ONC), Bob Crosby (ONC), Ryan Key (ONC), Teron Moore (ONC), and Deg Hembroff (ONC). Lastly, thank you to the numerous staff members within ONC and NRCan that were involved in installing equipment, implementing software, troubleshooting issues, and managing this large undertaking. Finally, we would like to thank the two anonymous reviewers, who provided thoughtful comments and recommendations that significantly improved the quality of this manuscript.
1https://www.jamstec.go.jp/donet/e/.
2https://fit-iot.com/web/products/fitlet2/.
Adams, J., Allen, T., Halchuk, S., and Kolaj, M. (2019). “Canada’s 6th Generation Seismic hazard Model, as Prepared for the 2020 National Building Code of Canada,” in Proceedings in: 12th Canadian Conference on Earthquake Engineering, Quebec City, June 17–20, 2019.
Aki, K., and Richards, P. G. (2002). Quantitative Seismology. second edition. Sausalito CA: University Science Books.
Allen, R. (1982). Automatic Phase Pickers: Their Present Use and Future Prospects. Bull. Seismol. Soc. America 72 (6), 225–242. doi:10.1785/bssa07206b0225
Allen, R. M., and Kanamori, H. (2003). The Potential for Earthquake Early Warning in Southern California. Science 300, 786–789. doi:10.1126/science.1080912
Allen, R. M., and Melgar, D. (2019). Earthquake Early Warning: Advances, Scientific Challenges, and Societal Needs. Annu. Rev. Earth Planet. Sci. 47, 361–388. doi:10.1146/annurev-earth-053018-060457
Barnes, C. R., and Tunnicliffe, V. (2008). “Building the World's First Multi-Node Cabled Ocean Observatories (NEPTUNE Canada and VENUS, Canada): Science, Realities, Challenges and Opportunities,” in Conference proceedings in: OCEANS 2008 MTS/IEEE Kobe-Techno-Ocean, Kobe, Japan, April 8–11, 2008. doi:10.1109/OCEANSKOBE.2008.4531076
Bilek, S. L., and Lay, T. (2018). Subduction Zone Megathrust Earthquakes. Geosphere 14 (4), 1468–1500. doi:10.1130/GES01608.1
Bock, Y., Melgar, D., and Crowell, B. W. (2011). Real-time strong-motion Broadband Displacements from Collocated GPS and Accelerometers. Bull. Seismol. Soc. America 101 (6), 2904–2925. doi:10.1785/0120110007
Collins, P., Henton, J., Mireault, Y., Héroux, P., Schmidt, M., Dragert, H., and Bisnath, S. (2009). “Precise point Positioning for Real-Time Determination of Co-seismic Crustal Motion,” in 22nd International Technical Meeting of the Satellite Division of the Institute of Navigation 2009, 1876–1885. ION GNSS 2009.
Crowell, B. W., Bock, Y., and Squibb, M. B. (2009). Demonstration of Earthquake Early Warning Using Total Displacement Waveforms from Real-Time GPS Networks. Seismol. Res. Lett. 80 (5), 772–782. doi:10.1785/gssrl.80.5.772
Crowell, B. W., Melgar, D., Bock, Y., Haase, J. S., and Geng, J. (2013). Earthquake Magnitude Scaling Using Seismogeodetic Data. Geophys. Res. Lett. 40 (23), 6089–6094. doi:10.1002/2013GL058391
Friedlander, B. (1987). A Passive Localization Algorithm and its Accuracy Analysis. IEEE J. Oceanic Eng. 12 (1), 234–245. doi:10.1109/joe.1987.1145216
Gao, D., Wang, K., Insua, T. L., Sypus, M., Riedel, M., and Sun, T. (2018). Defining Megathrust Tsunami Source Scenarios for Northernmost Cascadia. Nat. Hazards 94, 445–469. doi:10.1007/s11069-018-3397-6
Geng, J., Bock, Y., Melgar, D., Crowell, B. W., and Haase, J. S. (2013). A New Seismogeodetic Approach Applied to GPS and Accelerometer Observations of the 2012 Brawley Seismic Swarm: Implications for Earthquake Early Warning. Geochem. Geophys. Geosyst. 14 (7), 2124–2142. doi:10.1002/ggge.20144
Gillette, M. D., and Silverman, H. F. (2008). A Linear Closed-Form Algorithm for Source Localization From Time-Differences of Arrival. IEEE Signal. Process. Lett. 15, 1–4. doi:10.1109/LSP.2007.910324
Goldberg, D. E., Melgar, D., and Bock, Y. (2019). Seismogeodetic P‐wave Amplitude: No Evidence for Strong Determinism. Geophys. Res. Lett. 46 (20), 11118–11126. doi:10.1029/2019GL083624
Hartog, J. R., Kress, V. C., Malone, S. D., Bodin, P., Vidale, J. E., and Crowell, B. W. (2016). Earthquake Early Warning: ShakeAlert in the Pacific Northwest. Bull. Seismol Soc. America 106 (4), 1875–1886. doi:10.1785/0120150261
Hembroff, D., Farrugia, J. J., Schlesinger, A., Kreimer, N., and Kulin, I. (2019). “Initial Implementation and Performance of a Cascadia Subduction Zone Earthquake Early Warning System for British Columbia,” in Poster in: AGU Fall Meeting, San Francisco, California, December 9–13, 2019.
Hodgkinson, K. M., Mencin, D. J., Feaux, K., Sievers, C., and Mattioli, G. S. (2020). Evaluation of Earthquake Magnitude Estimation and Event Detection Thresholds for Real-Time GNSS Networks: Examples from Recent Events Captured by the Network of the Americas. Seismol. Res. Lett. 91, 1628–1645. doi:10.1785/0220190269
Huang, Y., and Benesty, J. (2000). “Passive Acoustic Source Location for Video Camera Steering,” in Conference Proceedings in: Acoustics, Speech, Signal Processing International Conference, Istanbul, Turkey, June 5–7, 2000.
Hyndman, R. D., and Wang, K. (1995). The Rupture of Cascadia Great Earthquakes from Current Deformation and the Thermal Regime. J. Geophys. Res. Solid Earth 100 (B11). doi:10.1029/95JB01970
Kalman, R. E. (1960). A New Approach to Linear Filtering and Prediction Problems. J. Basic Eng. 82, 35–45. doi:10.1115/1.3662552
Küpperkoch, L., Meier, T., and Diehl, T. (2012). “New Manual of Seismological Observatory Practice (NMSOP-2) (Chapter 16),” in Potsdam: Deutsches GeoForschungszentrum GFZ; IASPEI. Editor P. Borman Potsdam, Germany: GFZ German Research Center for Geosciences. doi:10.2312/GFZ.NMSOP-2
Kohler, M. D., Cochran, E. S., Given, D. D., Guiwits, S., Neuhauser, D., Hensen, I., et al. (2017). Earthquake Early Warning ShakeAlert System: West Coast Wide Production Prototype. Seismol. Res. Lett. 89 (1). doi:10.1785/0220170140
Kohler, M. D., Smith, D. E., Andrews, J., Chung, A. I., Hartog, R., Henson, I., et al. (2020). Earthquake Early Warning ShakeAlert 2.0: Public Rollout. Seismol. Res. Lett. 91 (3). doi:10.1785/0220190245
Kuyuk, H. S., and Allen, R. M. (2013). A Global Approach to Provide Magnitude Estimates for Earthquake Early Warning Alerts. Geophys. Res. Lett. 40 (24), 6329–6333. doi:10.1002/2013GL058580
Li, X. (2015). Real-time High-Rate GNSS Techniques for Earthquake Monitoring and Early Warning, (Doctoral Dissertation). Berlin, Germany: Technische Universität.
Lockman, A. B., and Allen, R. M. (2007). Magnitude-Period Scaling Relations for Japan and the Pacific Northwest: Implications for Earthquake Early Warning. Bull. Seismological Soc. America 97 (1B), 140–150. doi:10.1785/0120040091
McCrory, P. A., Blair, L., Oppenheimer, D. H., and Walter, S. R. (2004). Depth to the Juan de Fuca Slab Beneath the Cascadia Subduction Margin: A 3-D Model for Sorting Earthquakes, 91. Reston, VA: U.S. Geological Survey, 22.
Melgar, D., Bock, Y., Sanchez, D., and Crowell, B. W. (2013). On Robust and Reliable Automated Baseline Corrections for strong Motion Seismology. J. Geophys. Res. Solid Earth 118 (3), 1177–1187. doi:10.1002/jgrb.50135
Melgar, D., LeVeque, R. J., Dreger, D. S., and Allen, R. M. (2016). Kinematic Rupture Scenarios and Synthetic Displacement Data: An Example Application to the Cascadia Subduction Zone. J. Geophys. Res. Solid Earth 121, 6658–6674. doi:10.1002/2016JB013314
Melgar, D., Melbourne, T. I., Crowell, B. W., Geng, J., Szeliga, W., ScrivnerSantillan, C. M., et al. (2020). Real-Time High-Rate GNSS Displacements: Performance Demonstration during the 2019 Ridgecrest, California, Earthquakes. Seismol. Res. Lett. 91 (4), 1943–1951. doi:10.1785/0220190223
Moni, A., and Rickard, S. (2009). “Comparison of Localization Algorithms Using Attenuation Estimates,” in Digital Signal Processing Workshop and 5th IEEE Signal Processing Education Workshop, Marco Island, Florida, January 4–7, 2009 (IEEE), 42–47. DSP/SPE 2009.
Murray, J. R., Crowell, B. W., Grapenthin, R., Hodgkinson, K., Langbein, J. O., Melbourne, T., et al. (2018). Development of a Geodetic Component for the U.S. West Coast Earthquake Early Warning System. Seismol. Res. Lett. 89 (6), 2322–2336. doi:10.1785/0220180162
Natural Resources Canada (NRCAN Canada). (1975). Canadian National Seismograph Network [Data set]. International Federation of Digital Seismograph Networks.
Niu, J., and Xu, C. (2014). Real-time Assessment of the Broadband Coseismic Deformation of the 2011 Tohoku-Oki Earthquake Using an Adaptive Kalman Filter. Seismol. Res. Lett. 85 (4), 836–843. doi:10.1785/0220130178
Ocean Networks Canada. (2009). NEPTUNE Seismic Stations [Data set]. International Federation of Digital Seismograph Networks.
Ocean Networks Canada Society. (2021). Collection: An Earthquake Early Warning System for Southwestern British Columbia Enables Detection of Sovanco Fracture Zone Seismic Events in 2018 (Version 1.0). Ocean Networks Canada Society.
Pirinen, T., Pertilä, P., and Visa, A. (2003). “Toward Intelligent Sensors - Reliability for Time Delay Based Direction of Arrival Estimates,” in Conference Proceedings in: Acoustics, Speech, Signal Processing International Conference, Hong Kong, April 6–10, 2003, 197–200. doi:10.1109/ICASSP.2003.1199902
Pirinen, T. W. (2006). “A Lattice Viewpoint for Direction of Arrival Estimation Using Quantized Time Differences of Arrival,” in Conference Proceedings in: Acoustics, Speech, Signal Processing International Conference, Toulouse, France, May 14–19, 2006.
Rosenberger, A. (2018). Observations from the September 19, 2018 Test with Titan Accelerometer and GNSS Antenna on the HERB Device. Technical Report. Victoria, BC: ONC, University of Victoria. Version 0.1. doi:10.5281/zenodo.4774346
Rosenberger, A., Banville, S., Collins, P., Henton, J., and Ferguson, E. (2018). Kalman Filter Algorithm for the Joint Processing of GNSS PPP and Accelerometer Data, EEW Parameters from the Unbiased Displacement Time-Series. Technical Report. ONC, University of Victoria. Version 0.9. doi:10.5281/zenodo.4774348
Rosenberger, A., Collins, P., Henton, J., Ferguson, E., Pirenne, B., and Schlesinger, A. (2019c). Extensions to the WARN Associator, Integrating Magnitude Estimates Based on Parameters from Unbiased Displacements. Version 0.4. Technical report ONC, University of Victoria. doi:10.5281/zenodo.4774315Rosenberger
Rosenberger, A., Crosby, B., Ferguson, E., Leech, B., MacArthur, M., Schlesinger, A., et al. (2019a). Epicenter Location and Association of Events from P-Wave On-Set Times, Magnitude Estimation. Technical Report. ONC, University of Victoria. Version 2.1. doi:10.5281/zenodo.4774330
Rosenberger, A., Ferguson, E., and Schlesinger, A. (2019b). Testing the Associator: Simulating Seismic Events. Technical Report. ONC, University of Victoria. Version 0.3. doi:10.5281/zenodo.4815165
Rosenberger, A. (2010). Real-time Ground-Motion Analysis: Distinguishing P and S Arrivals in a Noisy Environment. Bull. Seismol. Soc. America 100 (3), 1252–1262. doi:10.1785/0120090265
Rosenberger, A. (2019). Three Component Accelerometer Signal Processing for WARN. Technical Report. ONC, University of Victoria. Version 0.6. doi:10.5281/zenodo.4774354
Ruhl, C. J., Melgar, D., Chung, A. I., Grapenthin, R., and Allen, R. M. (2019). Quantifying the Value of Real‐Time Geodetic Constraints for Earthquake Early Warning Using a Global Seismic and Geodetic Data Set. J. Geophys. Res. Solid Earth 124 (4), 3819–3837. doi:10.1029/2018JB016935
Ryan, W. B. F., Carbotte, S. M., Coplan, J., O'Hara, S., Melkonian, A., Arko, R., et al. (2009). Global Multi-Resolution Topography (GMRT) Synthesis Data Set, Geochem. Geophys. Geosyst. 10, Q03014. doi:10.1029/2008GC002332
Schau, H., and Robinson, A. (1987). Passive Source Localization Employing Intersecting Spherical Surfaces from Time-Of-Arrival Differences. IEEE Trans. Acoust. Speech, Signal. Process. 35 (8), 1223–1225. doi:10.1109/tassp.1987.1165266
Smyth, A., and Wu, M. (2007). Multi-rate Kalman Filtering for the Data Fusion of Displacement and Acceleration Response Measurements in Dynamic System Monitoring. Mech. Syst. Signal Process. 21, 706–723. doi:10.1016/j.ymssp.2006.03.005
Trnkoczy, A. (2012). “Understanding and Parameter Setting of STA/LTA Trigger Algorithm,” in New Manual of Seismological Observatory Practice (NMSOP-2). Potsdam: Deutsches GeoForschungszentrum GFZ; IASPEI. Editor P. Borman. Potsdam, Germany: GFZ German Research Center for Geosciences. doi:10.2312/GFZ.NMSOP-2
Wang, K., and Tréhu, A. M. (2016). Invited Review Paper: Some Outstanding Issues in the Study of Great Megathrust Earthquakes-The Cascadia Example. J. Geodynamics 98, 1–18. doi:10.1016/j.jog.2016.03.010
Wang, Y., and Satake, K. (2021). Real-Time Tsunami Data Assimilation of S-Net Pressure Gauge Records during the 2016 Fukushima Earthquake. Seismol. Res. Lett. 92, 2145–2155. doi:10.1785/0220200447
Wurman, G., Allen, R. M., and Lombard, P. (2007). Toward Earthquake Early Warning in Northern California. J. Geophys. Res. 112, B08311. doi:10.1029/2006JB004830
Yamamoto, N., Hirata, K., Aoi, S., Suzuki, W., Nakamura, H., and Kunugi, T. (2016). Rapid Estimation of Tsunami Source Centroid Location Using a Dense Offshore Observation Network. Geophys. Res. Lett. 43 (9), 4263–4269. doi:10.1002/2016GL068169
Keywords: earthquake early warning, Cascadia subduction zone, subsea instrumentation, global navigation satellite system, onsite processing, British Columbia, Canada, earthquake hazard
Citation: Schlesinger A, Kukovica J, Rosenberger A, Heesemann M, Pirenne B, Robinson J and Morley M (2021) An Earthquake Early Warning System for Southwestern British Columbia. Front. Earth Sci. 9:684084. doi: 10.3389/feart.2021.684084
Received: 22 March 2021; Accepted: 20 July 2021;
Published: 04 August 2021.
Edited by:
Angela Isobel Chung, University of California, Berkeley, United StatesReviewed by:
Garry Rogers, Geological Survey of Canada, CanadaCopyright © 2021 Schlesinger, Kukovica, Rosenberger, Heesemann, Pirenne, Robinson and Morley. This is an open-access article distributed under the terms of the Creative Commons Attribution License (CC BY). The use, distribution or reproduction in other forums is permitted, provided the original author(s) and the copyright owner(s) are credited and that the original publication in this journal is cited, in accordance with accepted academic practice. No use, distribution or reproduction is permitted which does not comply with these terms.
*Correspondence: Angela Schlesinger, c2NobGVzaW5AdXZpYy5jYQ==
Disclaimer: All claims expressed in this article are solely those of the authors and do not necessarily represent those of their affiliated organizations, or those of the publisher, the editors and the reviewers. Any product that may be evaluated in this article or claim that may be made by its manufacturer is not guaranteed or endorsed by the publisher.
Research integrity at Frontiers
Learn more about the work of our research integrity team to safeguard the quality of each article we publish.