- 1College of Civil Engineering and Architecture, Guilin University of Technology, Guilin, China
- 2Geotechnical Engineering Company, Wuhan Surveying-Geotechnical Research Institute Metallurgical Corporation of China Ltd, Wuhan, China
- 3Hunan Non-Ferrous Institute of Engineering Prospecting Co., Ltd, Changsha, China
Thixotropy is a hot topic in the field of rheology of dispersed systems. Studying the quantitative index and evaluation method for thixotropy of clay is of great significance to evaluate the safety of foundation under long-term load. To explore the index system and classification methods for the thixotropy of clay, unconfined compressive strength tests were carried out on three groups of undisturbed soil and remolded soil that were cured at different times after remodeling of the Zhanjiang Formation in China to obtain the unconfined compressive strength values of the samples and establish the relationship between unconfined compressive strength and curing time of the remodeled soil. The concept of thixotropic sensitivity is introduced to reflect the relationship between thixotropy and structure. According to the relationship between thixotropy sensitivity and curing time and its logarithmic value, two indexes of structural recovery coefficient K and structural recovery index Ke were established to evaluate the thixotropy of structural clay in the Zhanjiang Formation. Following the structural classification method of soil, the boundary values of structural recovery coefficients KI and KII are calculated to classify the thixotropy of soil. When the value of K is less than that of KI, the thixotropy of soil is weak. When the value of K is greater than that of K but less than that of KII, the thixotropy of soil is moderate. When the value of K is greater than that of KII, the thixotropy of soil is strong. The method is used to discuss the thixotropy of soil in the literature, and the rationality of the method is verified. Results show that this method can be used to preliminary classify the thixotropy of soil.
Introduction
Thixotropy of clay refers to the phenomenon that when soil is disturbed its original structure is destructed and its mechanical strength drops sharply. After the disturbance stopped, part of the mechanical strength of soil gradually recovers with lapsing time (Mitchell, 1961; Díaz-Rodríguez and Santamarina, 1999; Feng et al., 2004; Li et al., 2010). Boswell (1948) found that thixotropy was widely present in sedimentary deposits, except for clean sand, through investigation of a large amount of sedimentary deposits. Further studies by Kruyt (1952) indicated that thixotropy generally exists in clay-water systems. Under the influence of the thixotropy of soil, the strength and deformation characteristics of soil show strong time dependence (Shahriar and Jadid, 2018; Shahriar et al., 2018; Al-Janabi and Aubeny, 2019; Kamil and Aljorany, 2019; Ruge et al., 2019; Alam et al., 2020). Thixotropic evaluation of soil is one of the key problems in safety evaluation of foundation engineering under long-term load.
The thixotropy of clay is generally measured by studying the variation rule in yield stress (Landrou et al., 2018), strength (Chan, 2015), viscosity (Jeong et al., 2015), and ratio of strength (Zhang et al., 2014b; Wang et al., 2015; Al-Rubaiee and Al Salami, 2020) with time after clay has been disturbed to reflect thixotropy. Du et al. (2020) proposed a model to explain the effect of ionic strength on the thixotropy and yield stress of sodium montmorillonite gel by reflecting the thixotropic behavior of sodium montmorillonite through change in yield stress increment with time. Shahriar et al. (2016) studied the variation law in the shear strength of clay with time and found that the thixotropy of soil was not obvious when water content was above the liquid limit, and that the strength of clay increased significantly with time when water content was below the liquid limit. Larson and Wei (2019) reviewed the research progress in thixotropy and accompanying rheological phenomenon and pointed out that the change in viscosity with time can reflect the strength of thixotropy. Zhang et al. (2017b) defined the thixotropic strength ratio of clay as the ratio between the strength at time t after disturbance and the strength at time 0 after disturbance, and compared the thixotropic strength ratio of clay in different regions. These studies have established the indicators to reflect the thixotropy of clay, which has laid a foundation for quantitative description and evaluation of thixotropy. However, these studies have not discussed how to compare the thixotropy of different types of soil with different degrees of thixotropy, and there is a lack of classification methods for different types of soil with different degrees of thixotropy.
The thixotropy of clay has a great influence on engineering practice (Kul'chitskii, 1975; Lutenegger, 2017; Al-Janabi and Aubeny, 2019). Engineering problems such as strength growth of filling soil (Chan, 2015; Tsugawa et al., 2017), bearing capacity of pile foundation in clay layer (Shen et al., 2005; Abu-Farsakh et al., 2015; Rosti, 2016; Karlsson et al., 2019; Gong et al., 2020), and time effect of anchoring force of anchor bolt (Zhang N. et al., 2017) are closely related to the thixotropy of soil. For soil with strong thixotropy, strength recovery is quite obvious after resting. If the influence of thixotropy is ignored, the calculation results of bearing capacity and settlement would have a large deviation from measured value, and the applicability of traditional experience and theory would become a problem. The establishment of thixotropy evaluation method can provide a basis for solving practical engineering problems. The clay in the Zhanjiang Formation features strong structural property (Shen et al., 2013b), high plasticity (Zhang et al., 2014a), micro permeability (Zhang et al., 2012), strong acidity due to oxidation hydrolysis (Zhang et al., 2017a), spatial distribution difference (Shen et al., 2013a), creep property (Kong et al., 2012), thixotropy (Zhang et al., 2017b), etc., and it is an extremely abnormal type of soil with special properties resulting in rare engineering characteristics. At present, there is no classification method to measure the thixotropy of Zhanjiang Formation clay, and the engineering circle cannot determine the impact of clay thixotropy in the engineering practice. To explore the index system and classification methods for evaluating the thixotropy of Zhanjiang Formation clay, unconfined compressive strength tests were carried out on three groups of undisturbed soil and remolded soil that were cured at different times after remodeling of the Zhanjiang Formation in China to obtain the unconfined compressive strength values of the samples and establish the relationship between the unconfined compressive strength and the curing time of the remodeled soil. According to the relationship between unconfined compressive strength and curing time, an index to evaluate the thixotropy of clay was proposed, and a method to evaluate the thixotropy of clay was established using the index. Based on the results of unconfined compressive strength tests, the relatively preliminary evaluation method proposed in this study provides a reference for comparison and classification of different types of soil with different thixotropic properties.
Unconfined Compressive Strength Test
Through existing regional geological data and engineering geological surveys, typical strata are selected for investigation, drilling, and sampling. Three groups of undisturbed soil samples, 1, 2, and 3, from Zhanjiang Formation clay were obtained from Baosteel Zhanjiang Iron and Steel Base, which is located in Donghai island, Zhanjiang City, Guangdong province, China. The thixotropy of soil at different depths is different (Li et al., 2010). To obtain soil samples with different thixotropy degrees, different depths were selected for sampling. The depth for soil sampling for sample groups 1, 2, and 3 is 2–3, 6–9, and 19.25–20.05 m, respectively. Sampling was carried out using a stainless steel open thin-walled sampler with an inner diameter of 100 mm, wall thickness of 2 mm, cutting edge angle of 60°, and length of 300 mm. The upper end of the sampler was connected with a drill stem by screws and was provided with an exhaust (drain) hole and a spherical valve to release air and water pressure during sampling, prevent water from reentering, and maintain a vacuum above the soil sample during lifting. Basic physical properties, such as natural moisture content, natural density, and specific gravity of structural clay from the Zhanjiang Formation were tested by drying, ring knife, and specific gravity flask methods. The test methods were based on the relevant provisions of Articles 5.2, 6.2, and 7.2 of “Standard for Geotechnical Test Methods” (GB/T50123-2019, China), and the test results are shown in Table 1.
The undisturbed soil was dried and crushed using a 0.5-mm sieve. Then, according to the density and moisture content of the undisturbed soil, a cylindrical remolded soil sample with a diameter of 39.1 mm and a height of 80 mm was prepared by taking the soil samples with a particle size of <0.5 mm. For sample preparation, water requirement is calculated according to the moisture content of undisturbed soil and dry soil, and the moisture content of the soil samples is configured into the moisture content of undisturbed soil. Then, according to the density of the undisturbed soil and the volume of the samples, the mass of the soil required for a sample was calculated. Weigh the required soil for a sample and put it into a cylindrical sample preparation with a diameter of 39.1 mm and rammed the soil to a height of 80 mm. According to this method, remolded soil samples with density and moisture content same as those of the undisturbed soil were obtained by compaction. The sample preparation method shall refer to the relevant provisions of Articles 4.3.1 and 4.4.2 of “Standard for Geotechnical Test Methods” (GB/T50123-2019, China). After the completion of sample preparation, two samples from each group were taken. The mass of the samples were weighed. The density of the samples was calculated according to mass and volume. The moisture content of the samples was tested by drying method. The density and moisture content of the samples were averaged. The results are shown in Table 2.
It can be seen from Table 2 that the moisture content and density of the remolded samples are basically the same as those of the undisturbed soil. To keep the moisture content constant, the samples were wrapped using a preservative film and placed in PVC tubes. Lids were put on the tubes. The tubes were sealed with wax and then stored in an airtight moisturizing jar for curing. Room temperature was controlled at 25 ± 2°C. As suggested in research studies that soil strength recovery is fast at the initial stage and slow at the later stage (Feng et al., 2004; Li et al., 2010), we set the curing time at 0, 1, 7, 30, and 60 days. Unconfined compressive strength tests were carried out on undisturbed soil samples and remolded soil samples with different curing times. The test method was according to the relevant provisions of Article 20 of “Standard for Geotechnical Test Methods” (GB/T50123-2019, China). The curves of relationship between axial strain and axial stress of the samples are shown in Figure 1.
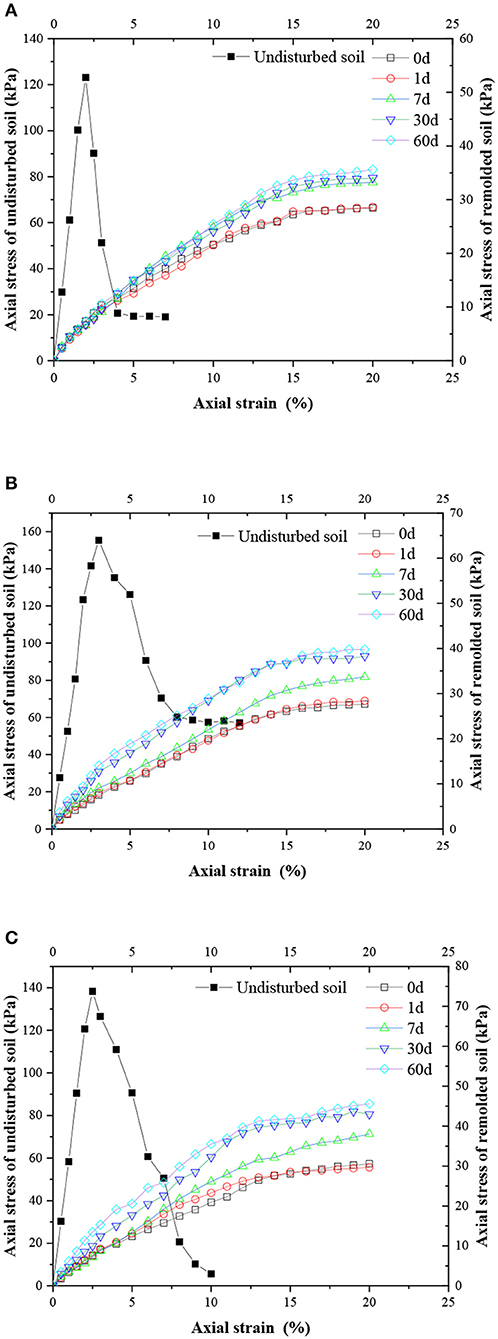
Figure 1. The curve of relationship between axial strain and axial stress of the samples. (A) Curve of relationship between axial strain and axial stress of soil sample 1. (B) Curve of relationship between axial strain and axial stress of soil sample 2. (C) Curve of relationship between axial strain and axial stress of soil sample 3.
In Figure 1, the peak stress of the three groups of undisturbed soil samples and stress resulting in 15% strain of remolded soil samples is the unconfined compressive strength of undisturbed soil samples and remolded soil samples, as shown in Table 3. The curve of relationship between unconfined compressive strength and curing time of remolded soil samples is established, as shown in Figure 2.
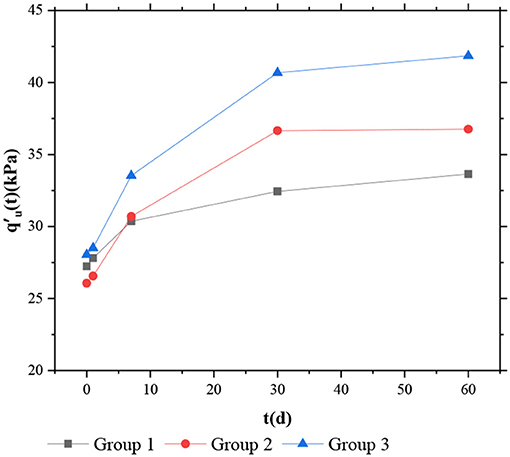
Figure 2. Curve of relationship between unconfined compressive strength and curing time of remolded soil samples.
As can be seen from Table 3, the mechanical properties of soil samples changed remarkably before and after remodeling, which was caused by structural destruction o and abrupt reduction in strength of the soil. According to the ratio of unconfined compressive strength of undisturbed soil samples to remolded soil samples curing for 0 day, the sensitivity value for groups 1, 2, and 3 was 4.52, 5.96, and 4.93, respectively. The three sets of soil were highly sensitive and had strong structural properties. With the lapsing of curing time, the unconfined compressive strength of the remolded soil samples gradually increased. When the remolded soil samples were cured for 0–60 days, the unconfined compressive strength of remolded soil sample 1 increased by 6.4 from 27.24 to 33.64 kPa, the increment of which was 23.49% of that of 0 day. The unconfined compressive strength of remolded soil sample 2 increased by 10.7 from 26.06 to 36.76 kPa, the increment of which was 41.09% of that of 0 day. The unconfined compressive strength of remolded soil sample 3 increased by 13.81 from 28.04 to 41.85 kPa, the increment of which was 49.25% of that of 0 day. This shows that Zhanjiang Formation clay has strong thixotropy. Zhang et al. (2014b) reported an increase in the unconfined compressive strength of remolded clay for 500 days. After 500 days, the strength of the soil was 2.89 times the initial strength, as shown in Figure 3.
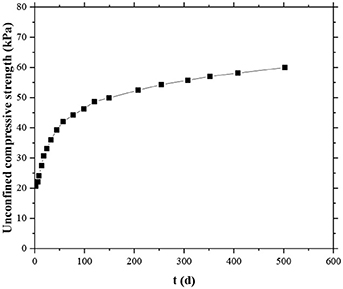
Figure 3. Curve of relationship between unconfined compressive strength and curing time of remolded soil samples [modified from Zhang et al. (2014b)].
It can be seen from Figures 2, 3 that the influence of thixotropy can make the strength of soil recover to a certain extent after structural failure. It can be seen from Figure 2 that the unconfined compressive strength of remolded soil samples increased rapidly in the period of 0–7 days, slowed down in 7–30 days, and tended to be stable in 30–60 days. The thixotropy of Zhanjiang Formation clay suggested that thixotropic recovery was faster in the early stage, and slowed down and turned stable in the later stage. Natural soil strength loss after disturbance and the strength recovery process caused by thixotropy after standing is a process in which the initial structure is destroyed into a dispersed one, and the structure tends to flocculate because of change in the force field of interaction between attractive and repulsive forces in particles. This process requires the movement of particles, water, and ions in a time-dependent manner. In reference Zhang et al. (2017b), the relationship between energy and grain spacing in the thixotropic process is given, as shown in Figure 4.

Figure 4. Energy–distance curves for thixotropic soil [modified from Mitchell (1961)]: (A) at initial, undisturbed configuration, ER = EA, flocculation structure, (B) during remolding, ER > EA, repulsive energy barrier prevents flocculation, and (C) at rest in the thixotropy, ER < EA, particles attempt to flocculate.
The interaction in soil–water–electrolyte system resulted in the formation of double electric layers on the surface of clay particles. When the two particles were close to each other to a certain distance, the double electric layers overlapped each other to produce an interactive force field. As shown in Figure 4, curve ER represents the increase in repulsive energy when two particles get close to each other. The curve EA shows how attractive energy changes. With repulsion as positive and attraction as negative, curve ET represents the relation between total potential energy and particle spacing. When particles are far apart, the attraction is dominant, the curve is below the horizontal axis, and the total potential energy is negative. As the distance between particles gets closer, the repulsive force takes effect, and the total potential energy rises to a positive value. When it reaches a certain distance, the total potential energy reaches its maximum, and an energy peak EMAX appears. The rise of potential energy means that the two particles cannot get any closer, or they will separate after getting closer. When the peak energy EMAX is passed, the potential energy drops rapidly, which means that the particles flocculate. It can be seen from Figure 4A that the intergranular attraction and repulsion of the undisturbed clay are in an equilibrium and stable state. When the soil is disturbed, external energy is applied to the soil system. Disturbance energy from the outside makes the initial structure of the soil break and the flaky clay disperse, which means that the repulsion between the particles resulting from the internal forces of the double electric layer and the external energy help the structure to disperse. Due to the effect of external forces, the force energy between particles is at a high level, the ions in the adsorption water layer and double electric layer will redistribute, and the microstructure will be reorganized. However, once the disturbance stops, the energy from the outside that causes the internal repulsion between particles to form a dispersed structure is consumed, so the repulsion between particles decreases, and the structure adaptively adjusts to adapt to the new force field, and particles shift and get close to each other. When the attractive force exceeds the repulsive force (Figure 4C) and the intergranular force exceeds the energy peak EMAX, the particles will flocculate. If the particles close to each other consume part of the energy and fail to cross the energy peak, the interaction between the soil particles will also reach a new inter-particle equilibrium. At this time, the structure will try to adjust to a new state of lower energy, and the structure will gradually develop from dispersed to flocculated one, and the strength of the soil will also gradually increase with time.
The Thixotropy Indexes of Clay
It can be seen from the above tests that the strength of soil varies with time while its structure changes with time during the thixotropic process. The index reflecting soil structure is sensitivity St, which is a constant value for a kind of soil, and the sensitivity St cannot describe the change in soil structure with time. To do so, the concept of thixotropic sensitivity is introduced, and that of soil is defined as
where St(t) is the thixotropic sensitivity, dimensionless; qu is the unconfined compressive strength of the undisturbed soil sample in kPa; is the unconfined compressive strength of the remolded soil sample at the curing time t in kPa.
It can be seen from Formula (1) that the value of thixotropic sensitivity at 0 day after remolding is equal to the value of sensitivity, namely,
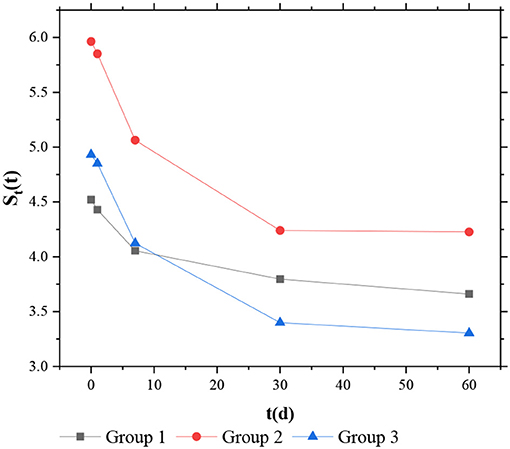
The thixotropic sensitivity of soil reflects the change in soil structure with time after disturbance. qu is constant, the larger (the closer to qu), the smaller the thixotropic sensitivity St(t), and consequently the greater the structural recovery of the disturbed soil. According to Table 3, the value St(t) of each curing time can be calculated, and the relationship curve of thixotropic sensitivity and curing time is established, as shown in Figure 5.
As shown in Figure 5, the thixotropic sensitivity decreases with lapsing of the curing time. In the period 0–7 days, the thixotropic sensitivity decreases rapidly; in the period 7–30 days, the decrease in speed slows down; and in the period 30–60 days, the thixotropic sensitivity tends to be stable. The same trend can be obtained from the data in the literature (Zhang et al., 2014b), as shown in Figure 6.
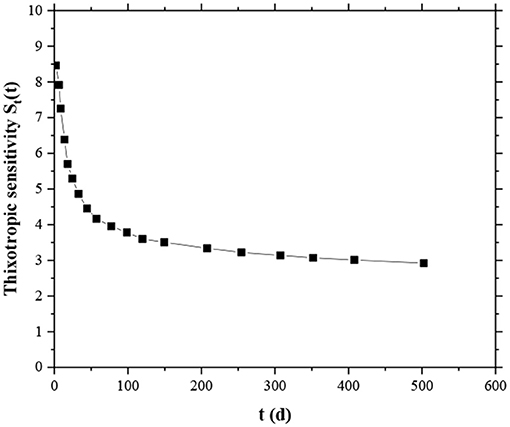
Figure 6. Curve of relationship between thixotropic sensitivity and curing time [modified from Zhang et al. (2014b)].
The shape of the St(t) − t relationship curve may vary with different clays. The steeper the curve, the more obvious the reduction of thixotropic sensitivity within the same period, and therefore the stronger the thixotropy of the soil; conversely, the more stable the curve, the weaker the thixotropy of the soil. Therefore, the tangent slope at any point on the curve represents the intensity degree of the thixotropy of the soil at the corresponding time t, namely,
where K is the structural recovery coefficient of soil in days−1. The minus sign indicates that thixotropic sensitivity decreases with increase in curing time. The greater the value of K, the stronger the thixotropy of soil, and conversely, the weaker the thixotropy of soil. Since the tangent slope at each point on the St(t) − t curve is different, the secant slope at certain periods t1and t2 can be chosen to measure the thixotropy intensity degree of soil, namely,
where K is the structural recovery coefficient of soil in days−1; t1 and t2 are the curing times in days; St(t1) and St(t2) are the thixotropic sensitivity corresponding to t1 and t2, dimensionless.
It can also be seen from Figure 4 that the thixotropic recovery of Zhanjiang Formation clay tends to be stable at a curing time of 60 days. t1 = 1 day and t2 = 60 days are taken as substitution into Formula (4) to calculate the structural recovery coefficient K1, K2, and K3 of groups 1, 2, and 3, which are 0.0143, 0.0289, and 0.0271 day−1, respectively, and then
It can be determined that the thixotropy of soil sample 2 is stronger than that of soil samples 1 and 3. The thixotropy of soil sample 3 is stronger than that of soil sample 1, so the structural recovery coefficient K can be used to measure the thixotropy intensity degree of soil.
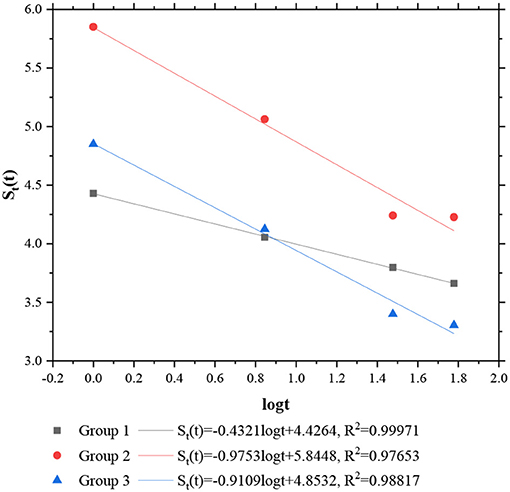
In order to further explore the change in thixotropic sensitivity of Zhanjiang Formation clay with time, the thixotropic sensitivity St(t) and the curing time t were studied in the semi-logarithmic coordinate, and the relation of St(t) − logt was curve fitted by selecting logt as the basic function. Since logt is meaningless at 0, and, according to Table 3, the calculated values of St(0) and St(1) of the three groups of the soil samples have little change, the error between these two can be ignored. Therefore, the data with the curing time of 1, 7, 30, and 60 days are chosen for fitting, and the results are shown in Figure 7. The same process was performed for the data of the literature (Zhang et al., 2014b), as shown in Figure 8.
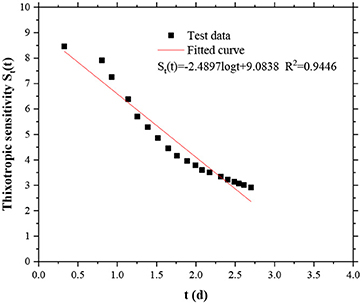
Figure 8. Relationship between thixotropic sensitivity St(t) and logt [modified from Zhang et al. (2014b)].
As shown in Figures 7, 8, the R2 of the three groups of soil are close to 1, indicating a good fitting degree. Thixotropic sensitivity St(t) decreases with increase in logt, and there is a linear relationship between them:
where Ke is defined as the structural recovery index of soil, dimensionless, representing the change in thixotropic sensitivity caused by every one logarithmic period (10 times) of change in curing time; St(1) is the thixotropic sensitivity of curing time of 1 day, dimensionless.
Similar to the structural recovery coefficient K, the greater the value of Ke, the stronger the thixotropy of the soil will be, and conversely, the weaker the thixotropy of the soil will be. Supposing Ke1, Ke2, and Ke3 correspond to the structural recovery index of soil samples 1, 2, and 3, respectively, according to the fitting results (as shown in Figure 7), the values of Ke1, Ke2, and Ke3 are 0.4321, 0.9753, and 0.9109, respectively, then
Therefore, it can be determined that the thixotropy of soil sample 2 is stronger than that of soil samples 1 and 3 and that the thixotropy of soil sample 3 is stronger than that of soil sample 1, so the structural recovery index Ke can be used to measure the thixotropy intensity degree of soil. From the above discussion, it can be seen that the structures of soil samples 1, 3, and 2 are enhanced in turn. The stronger the structure of soil is, the higher the attractive energy between particles is. After disturbance, particles are more likely to form a flocculating structure, and strength recovery is more obvious than in soil with lower sensitivity.
By discussing the differences and similarities between the two indexes, we can see that, after the introduction of the concept of thixotropic sensitivity St(t), the structural recovery coefficient K has been defined as the secant slope of the St(t) − t relationship curve, which is determined by selecting a certain period [t1, t2] to evaluate thixotropy, and the value of the recovery coefficient K is related to the selected time period, while the structural recovery index Ke is the slope of the straight line St(t) − logt, obtained by curve fitting through the data of unconfined compressive strength tests of the Zhanjiang Formation clay. For the same kind of Zhanjiang Formation clay, the value of Ke is fixed and independent of time. Both of them can be used to measure the thixotropy intensity degree of Zhanjiang Formation clay.
Evaluation Method of Thixotropy
Studies have shown that soil thixotropy is closely related to structure, and highly structural soil tends to have strong thixotropy (Zhang et al., 2020), and that thixotropic recovery is usually faster in the early stage, slower in the later stage, and finally tends to be stable (Feng et al., 2004; Li et al., 2010). According to the classification method of structure of clay, the thixotropy grading method was established. When considering thixotropy classification, the time interval [0, t] of thixotropy index should be selected from 0 to a certain resting time t of thixotropy stability. According to the above definitions of thixotropic sensitivity St(t) and structural recovery coefficient K, if t1 = 0 day, t2 = t, then
where K is the structural recovery coefficient of soil in days−1; t1 and t2 are the resting times in days; St(t2) and St(t2) are the thixotropic sensitivity corresponding to t1and t2, dimensionless; t is a certain curing time of thixotropic stability, the upper limit of the evaluation interval [0, t] in days; St(0) and St(t) are thixotropic sensitivity corresponding to 0 day and t, dimensionless.
According to Equation (7), for the same kind of soil, the structural recovery coefficient K and the sensitivity St are one-to-one corresponding in the evaluation interval [0, t]. Therefore, thixotropy of soil can be classified by referring to the classification method of structure of clay. In engineering practice, according to sensitivity, the structure of clay can be divided into three categories: low sensitivity (1 ≤ St ≤ 2), medium sensitivity (2 < St ≤ 4), and high sensitivity (4 < St), among which the limit value of sensitivity St is 2 and 4. Referring to the above classification method, K and KII are set as the limit value of the structural recovery coefficient K for the classification of thixotropy. According to Equation (7), we get
where KIis the value of the structural recovery coefficient K when St = 2, dimensionless; t is the upper limit of the evaluation interval [0, t] in days; St(t) is the thixotropic sensitivity corresponding to t, dimensionless; and KIIis the value of the structural recovery coefficient K when St = 4, dimensionless.
The classification method of soil thixotropy intensity degree is shown in Table 4.
To verify the rationality of the thixotropy classification method, the thixotropy of soil was discussed by referring to the data of literature, as shown in Table 5.
It can be seen from Table 5 that this method can preliminary classify the thixotropy of soil, which can provide reference for the thixotropy classification of soil. However, this method is only a preliminary classification of thixotropy of soil from the perspective of macroscopic strength, and it considers only a single parameter and does not discuss the classification of soil from the aspect of microscopic mechanism of thixotropy, so it still needs further exploration and verification.
Conclusion
In this study, unconfined compressive strength tests were carried out on three groups of undisturbed soil and remolded soil that were cured at different times after remolding of the Zhanjiang Formation in China to get the unconfined compressive strength values of the samples and establish the relationship between the unconfined compressive strength and curing time of remodeled soil. The thixotropy of clay in the Zhanjiang Formation can be measured by structural recovery coefficient and structural recovery index, and a classification method of thixotropy is given.
(1) The Zhanjiang Formation clay has obvious thixotropy. After 60 days of curing, the strength recovery of the remolded soil in the three groups accounts for 23.49, 49.25, and 41.09% of the initial strength, respectively.
(2) The thixotropy of soil can make the strength of soil recover somewhat after structural failure, but this strength recovery is relatively limited. Therefore, for the foundation soil with high sensitivity and strong structure, the engineering disaster caused by the strength loss caused by construction disturbance should not be ignored.
(3) The thixotropy of structural clay in the Zhanjiang Formation can be measured by the structural recovery coefficient K and the structural recovery index Ke. The larger the structural recovery coefficient K and the structural recovery index Ke are, the stronger the thixotropy of soil will be, and vice versa.
(4) Following the method of the structural classification method of soil, the boundary values of structural recovery coefficient KIand KII are calculated to classify the thixotropy of soil. When the value of K is less than that of KI, the thixotropy of soil is weak. When the value of K is greater than that of KI and less than that of KII, the thixotropy of soil is moderate. When the value of K is greater than KII, the thixotropy of soil is strong.
Data Availability Statement
The original contributions presented in the study are included in the article/supplementary material, further inquiries can be directed to the corresponding author/s.
Author Contributions
BT: article writing and revision. BZ: experiment, data processing and article writing. LX: translation. JY: literature data collection and document editing.
Funding
This work was supported by the National Natural Science Foundation of China (41867035), the Guangxi Natural Science Foundation (2020GXNSFAA297199), and the the project of Guangxi Key Laboratory of Geotechnical Mechanics and Engineering (2016-A-01).
Conflict of Interest
BZ and LX are employed by Geotechnical Engineering Company, Wuhan Surveying-Geotechnical Research Institute Co., Ltd, MCC Group. JY is employed by Hunan Non-Ferrous Institute of Engineering Prospecting Co., Ltd.
The remaining author declares that the research was conducted in the absence of any commercial or financial relationships that could be construed as a potential conflict of interest.
Acknowledgments
We thank all authors for their contributions, the reviewers for valuable comments, and the Frontiers Editorial Office for improving the layout of this Research Topic.
References
Abu-Farsakh, M., Rosti, F., and Souri, A. (2015). Evaluating pile installation and subsequent thixotropic and consolidation effects on setup by numerical simulation for full-scale pile load tests. Can. Geotech. J. 52, 1734–1746. doi: 10.1139/cgj-2014-0470
Alam, M. K., Shahriar, A. R., Islam, M. S., Islam, N., and Abedin, M. Z. (2020). Experimental investigation on the strength and deformation aspects of thixotropic aging in reconstituted clays. Geotech. Geol. Eng. 39, 2471–2486. doi: 10.1007/s10706-020-01639-1
Al-Janabi, H. A., and Aubeny, C. P. (2019). “Experimecntal measurement of thixotropy and sensitivity in Gulf of Mexico Clay,” in The 29th International Ocean and Polar Engineering Conference. International Society of Offshore and Polar Engineers (Honolulu, HI).
Al-Rubaiee, A. K. H., and Al Salami, R. S. (2020). Determination of the sensitivity and thixotropic effects of clay soil for selected sites in Diwaniya City-Iraq. J. Southw. Jiaotong Univ. 55, 1–12. doi: 10.35741/issn.0258-2724.55.2.58
Boswell, P. G. H. (1948). A preliminary examination of the thixotropy of some sedimentary rocks. Q. J. Geol. Soc. 104, 499–526. doi: 10.1144/GSL.JGS.1948.104.01-04.23
Chan, C. M. (2015). Strength recovery of remolded dredged marine clay: thixotropic hardening vs. induced cementation. Electr. J. Geotechn. Eng. 20, 5847–5858. Available online at: http://eprints.uthm.edu.my/id/eprint/7419/
Díaz-Rodríguez, J. A., and Santamarina, J. C. (1999). “Thixotropy: the case of Mexico city soils,” in XI Pan American Conference on Soil Mechanics and Geotechnical Engineering (Brazil), 441–448.
Du, M., Liu, P., Wong, J. E., Clode, P. L., Liu, J., and Leong, Y. K. (2020). Colloidal forces, microstructure and thixotropy of sodium montmorillonite (SWy-2) gels: roles of electrostatic and van der Waals forces. Appl. Clay Sci. 195:105710. doi: 10.1016/j.clay.2020.105710
Feng, X. Li., Zhou, S. W., Lin, L., Liu, T., and Wu, S. Q. (2004). The Thixotropy of Silt in Huanghe Delta. Period. Ocean Univ. China 34, 1053–1056. doi: 10.16441/j.cnki.hdxb.2004.06.027
Gong, W., Li, L., Zhang, S., and Li, J. (2020). Long-term setup of a displacement pile in clay: an analytical framework. Ocean Eng. 218:108143. doi: 10.1016/j.oceaneng.2020.108143
Huo, H., Qi, L., Lei, H., and Yu, G. (2016). Analysis and experimental study on thixotropy of Tianjin soft clay. Chin. J. Rock Mech. Eng. 3, 631–637. doi: 10.13722/j.cnki.jrme.2015.0435
Jeong, S. W., Locat, J., Torrance, J. K., and Leroueil, S. (2015). Thixotropic and anti-thixotropic behaviors of fine-grained soils in various flocculated systems. Eng. Geol. 196, 119–125. doi: 10.1016/j.enggeo.2015.07.014
Kamil, A. S., and Aljorany, A. N. (2019). Thixotropic hardening of fao clay. J. Eng. 25, 68–78. doi: 10.31026/j.eng.2019.05.05
Karlsson, M., Yannie, J., and Dijkstra, J. (2019). Modeling aging of displacement piles in natural soft clay. J. Geotech. Geoenviron. Eng. 145:04019070. doi: 10.1061/(ASCE)GT.1943-5606.0002110
Kong, L. W., He, L. J., and Zhang, X. W. (2012). Creep model of Zhanjiang clay and plastic components with variable parameters. Rock Soil Mech. 3, 2241–2246. doi: 10.16285/j.rsm.2012.08.002
Kul'chitskii, G. B. (1975).Thixotropy of soils of the middle Ob region and its consideration when constructing pile foundations. Soil Mech. Found. Eng. 12, 168–170. doi: 10.1007/BF01707641
Landrou, G., Brumaud, C., Plötze, M. L., Winnefeld, F., and Habert, G. (2018). A fresh look at dense clay paste: Deflocculation and thixotropy mechanisms. Colloids Surf. A Physicochem. Eng. Asp. 539, 252–260. doi: 10.1016/j.colsurfa.2017.12.029
Larson, R. G., and Wei, Y. (2019). A review of thixotropy and its rheological modeling. J. Rheol. 63, 477–501. doi: 10.1122/1.5055031
Li, L. H., Chen, L., and Gao, S. Y. (2010). Experimental research on thixotropy of wetland soft soil in Cuihu. Rock Soil Mech. 31, 765–768. doi: 10.16285/j.rsm.2010.03.041
Lutenegger, A. J. (2017). “Aged undrained shear strength of remolded clays,” in Offshore Site Investigation Geotechnics 8th International Conference Proceeding (Society for Underwater Technology), 378–383. doi: 10.3723/OSIG17.378
Mitchell, J. K. (1961). Fundamental aspects of thixotropy in soils. Trans. Am. Soc. Civil Eng. 126, 1586–1620. doi: 10.1061/TACEAT.0008103
Rosti, F. (2016). Numerical Simulation of Pile Installation and Following Setup Considering Soil Consolidation and Thixotropy (LSU Doctoral dissertation). Available online at: https://digitalcommons.lsu.edu/gradschool_dissertations/3613
Ruge, J. C., Molina-Gómez, F., and Rojas, J. P. (2019). “Thixotropic behaviour study of clayey soils from the lacustrine deposits of Bogotá high plateau,” in 5th International Meeting for Researchers in Materials and Plasma Technology (5th IMRMPT) (San José de Cúcuta: IOP Publishing), 012050. doi: 10.1088/1742-6596/1386/1/012050
Shahriar, A. R., Abedin, M. Z., and Islam, M. A. (2016). “Factors affecting thixotropic hardening of Dhaka clays,” in Proceedings of the 1st Bangladesh Civil Engineering Summit (Dhaka).
Shahriar, A. R., Abedin, M. Z., and Jadid, R. (2018). Thixotropic aging and its effect on 1-D compression behavior of soft reconstituted clays. Appl. Clay Sci. 153, 217–227. doi: 10.1016/j.clay.2017.12.029
Shahriar, A. R., and Jadid, R. (2018). An experimental investigation on the effect of thixotropic aging on primary and secondary compression of reconstituted dredged clays. Appl. Clay Sci. 162, 524–533. doi: 10.1016/j.clay.2018.05.023
Shen, J. H., Wang, R., Zheng, Y., Han, J. Z., and Chen, X. D. (2013b). Research on regional microstructure characteristics of structural clay of Zhanjiang formation. Rock Soil Mech. 34, 1931–1936. doi: 10.16285/j.rsm.2013.07.043
Shen, J. H., Wang, R., and Zhu, C. Q. (2013a). Research on spatial distribution law of gray clays of Zhanjiang Formation. Rock Soil Mech. 34, 331–336+339. doi: 10.16285/j.rsm.2013.s1.073
Shen, S. L., Jiang, Y. Q., Cai, F. X., and Xu, Y. S. (2005). Mechanisms of property changes of soft clays around deep mixing column. Chin. J. Rock Mech. Eng. 24, 4320–4327.
Skemption, A. W., and Northey, R. D. (1952). The sensitivity of clays. Geotechnique 3, 30–53. doi: 10.1680/geot.1952.3.1.30
Tsugawa, J. K., Pereira, K. F., and Boscov, M. E. (2017). “Thixotropy of sludge from the Cubatão water treatment plant, Brazil,” in Geotechnical Frontiers 2017 (Orlando, FL), 842–851. doi: 10.1061/9780784480472.090
Wang, L., Cao, L., Li, L., Yang, L., Sun, T., Shi, P., et al. (2015).Vane Shear tedts on thixotropy of taihu lake and baimahu lake dredged slurries. J. Eng. Geol. 23, 548–553. doi: 10.13544/j.cnki.jeg.2015.03.025
Zhang, M., Yin, J., Wang, W., Zhao, S., and Tang, B. (2020). Influence of physical and mechanical properties of structural clay of Zhanjiang Formation on its thixotropy. J. Eng. Geol. 1–9. doi: 10.13544/j.cnki.jeg.2019-530
Zhang, N., Wu, H. N., Shen, J. S. L., Hino, T., and Yin, Z. Y. (2017). Evaluation of the uplift behavior of plate anchor in structured marine clay. Mar. Georesour. Geotechnol. 35, 758–768. doi: 10.1080/1064119X.2016.1240273
Zhang, X. W., Kong, L. W., Chen, C., Li, K. K., and Liu, Y. (2017a). Effects of hydrochemistry on structural strength of Zhanjiang formation clay. Chin. J. Geotech. Eng. 39, 1967–1975. doi: 10.11779/CJGE201711003
Zhang, X. W., Kong, L. W., Guo, A. G., and Tuo, Y. F. (2014a). Experiment study of pore distribution of strong structural clay under different consolidation pressures. Rock Soil Mech. 35, 2794–2800. doi: 10.16285/j.rsm.2014.10.005
Zhang, X. W., Kong, L. W., Guo, A. G., and Tuo, Y. (2012). Evolution of microscopic pore of structured clayin compression process based on SEM and MIP test. Chin. J. Rock Mech. Eng. 31, 406–412.
Zhang, X. W., Kong, L. W., Li, J., and Yang, A. W. (2014b). Microscopic mechanism of strength increase of clay during thixotropic process. Chin. J. Geotechn. Eng. 36, 1407–1413. doi: 10.11779/CJGE201408005
Keywords: clay, thixotropy, structure, thixotropy index, method for thixotropy evaluation
Citation: Tang B, Zhou B, Xie L and Yin J (2021) Evaluation Method for Thixotropy of Clay Subjected to Unconfined Compressive Test. Front. Earth Sci. 9:683454. doi: 10.3389/feart.2021.683454
Received: 21 March 2021; Accepted: 22 April 2021;
Published: 14 May 2021.
Edited by:
Faming Huang, Nanchang University, ChinaReviewed by:
Vivi Anggraini, Monash University Malaysia, MalaysiaMohammed Ali Mohammed Al-Bared, University of Technology Petronas, Malaysia
Copyright © 2021 Tang, Zhou, Xie and Yin. This is an open-access article distributed under the terms of the Creative Commons Attribution License (CC BY). The use, distribution or reproduction in other forums is permitted, provided the original author(s) and the copyright owner(s) are credited and that the original publication in this journal is cited, in accordance with accepted academic practice. No use, distribution or reproduction is permitted which does not comply with these terms.
*Correspondence: Bin Tang, dGFuZ2JpbkBnbHV0LmVkdS5jbg==
 Bin Tang
 Biaohe Zhou
 Liang Xie
 Jianfeng Yin


