 Hongxi Liu
 Yujun Yi2*
 Zhongwu Jin
- 1Advanced Institute of Natural Sciences, Beijing Normal University, Beijing, China
- 2State Key Laboratory of Water Environment Simulation and Pollution Control, School of Environment, Beijing Normal University, Beijing, China
- 3Chang Jiang River Scientific Research Institute, Wuhan, China
Changing climate has raised attention toward weather-driven natural hazards, such as rain-induced flash floods. The flooding model is an efficient tool used in flash flood warning and hazard management. More and more evidence showed significant impacts of sediment on hydrodynamics and flooding hazard of flash flood. But little information is available regarding flooding hazard sensitivity to sediment characteristics, which hampers the inclusion of sediment characteristics into the flash flood warning system and hazard management. This study used a 1D model to simulate flood hazards. After calibrating and validating the hydrodynamic model, we carried out simulations to test the sensitivity of flood hazard to sediment characteristics like inflow point, size distribution, and concentration. Our results showed that sediment from highly erosive slopes affects the flooding hazard more than sediment from watershed. This is particularly true when sediment particles are fine particles with a medium size of 0.06 mm. When medium particle size of sediment increased above 1 mm, most of the sediment particles are deposited in the river and we see little effect on flooding hazard downstream. Sediment concentration significantly influenced the flooding hazard but was less important than sediment inflow point and medium particle size. Our study suggested considering more characteristics than concentration when including sediment particles into the flash flood warning system.
Introduction
Flash floods are one of the most significant natural hazards and cause serious loss of life and economic damage. The average annual economic loss due to natural hazards in China has been estimated at $20 billion (Han et al., 2016). Thanks to hydraulic engineering, lowland floods are rarely associated with fatalities, except in cases of levee failures in China; in contrast, flash floods often result in loss of life (Chuang et al., 2009; Wang et al., 2017). In mountainous areas, the frequency and intensity of flash flood triggered by heavy rainfall are predicted to increase (Yin et al., 2018). Good understanding of the flow physics of flash flood is key to efficiently mitigate flash flood hazard as well as the base of series of structural and non-structural measures.
Physical experiments and numerical models both provide insights into the flow physics of flash floods. However, field- and experiment-based research studies over complex topography are costly and limited by spatial scales and require a number of facilities and advanced instruments for high-resolution measurements. Numerical models, on the other hand, offered an effective tool to advance our understanding of flash flood hydrodynamics by detailing distribution of water depths, flow velocities, and inundation process. With important roles of flood modeling in fields of water conservation projects, urban planning, and flash flood early warning systems (Testa et al., 2007; Siviglia and Crosato. 2016), models’ efficiency and accuracy are still far from satisfaction for some cases such as flash flood in mountainous areas because of neglecting sediment effects (Guan et al., 2013; Hooke 2019; Contreras and Escauriaza. 2020).
Steep slopes in mountainous regions promote soil erosion and result in high sediment concentration in flash floods. Impacts of a high amount of sediment on flooding hazard have been well-observed in the field (Hooke 2019). For instance, sediment deposition was observed to reach as high as over 7.5 m in a flash flood on July 28, 2001 in Sichuan (Liu et al., 2020). With these pieces of evidence, the importance of high sediment concentration has been recognized in simulating the hydrodynamics of flash floods (Guan et al., 2013; Hooke 2019). However, most models still regard flash floods as water fluid when modeling the flooding hazard due to limited data on sediment. Until recently, some studies included sediment in flash flood modeling and discussed their impacts on hydrodynamic or flooding hazard from four aspects: 1) moving bed load by flash floods changes river elevation and cross section, which in turn affects maximum water level and increases flooded area and time at partial sections (Song et al., 2019); 2) high sediment concentration increases density and viscosity of the water–sediment mixture and cause additional stresses. These stresses transform the rheological behavior of the mixture and increase advance of the flow front, water depth, and flooded area etc. (Contreras and Escauriaza 2020); 3) sediment increases flow resistance, reduces flow velocity, and increases the water level; 4) deposition of suspended sediment in flash flood increases river bed elevation, which causes higher water level and larger flooded areas than expected (Grozav et al., 2017).
Improved understanding of sediment effects on flash flood hydrodynamics helps promote our modeling ability on flash flood. However, with increasing realization of the importance of sediment in affecting flash flood hydrodynamics, sediment is still not included in the flash flood early warning system because there is lack of information about flooding hazard sensitivity to sediment characteristics. Sediment characteristics such as concentration and size distribution should affect the interaction between sediment and flash flood and change the resultant flooding hazard. Sediment inflow may as well complicate the hazard assessment of flash flood. Triggered by extreme rainfall, shallow landslides and debris flow possibly initiate along with flash flood. Increased sediment concentration may therefore come from watershed and highly erosive slopes along the river. For the latter case, an abrupt increase in sediment inflows to a certain point/reach of the river. Limited by transport capacity, some sediment particles deposit into the river and parts are transported to downstream. Deposited sediment particles elevate the river bed and water level and, in extreme cases, form landslide or debris dam, which completely change river dynamics (Parker et al., 2011; Fan et al., 2014). Transported sediment may be deposited when the transport capacity is decreased by slope or curvature change. Both deposited and transported sediment influence flooding hazard at certain ranges. Lacking such information may lead to an underestimation in hazard management.
This study aims at testing sensitivity of flooding hazard to sediment characteristics of inflow, medium particle size, and concentration by using a numerical model. In this way, we expect to recognize and suggest sediment-related indicators in the flash flood early warning system so as to improve the hazard management.
Materials and Methods
Study Sites
The study site (45°07′N, 5°52′E) is located in the Xihe River, Sichuan Province, Southwest China. The elevation decreases from northwest to southeast from 1,120 m to 3,868 m. The annual precipitation is 529–1,334 mm, and the mean annual temperature is 13.4–14.1°C. Rainfall mainly distributes from June to September. The area of watershed is 632 km2.
We have chosen the last 10 km of the Xihe River as our study area to simulate sediment impacts on hydrodynamics of flash flood. Landslides and debris flow induced by earthquakes take place quite often along the river (Figures 1B,C). The riverbed slope of our target area is 20%. Residents and farmlands distribute along the last 2 km of the research area. Based on the field interviews, the first floor of the buildings was inundated by flash flood in August 2020, and sediment deposition was observed to be 3 m when flash flood faded away (Figure 1D). A hydrological station is available at the outlet of the watershed, recording hourly rainfall, river discharge, and water level.
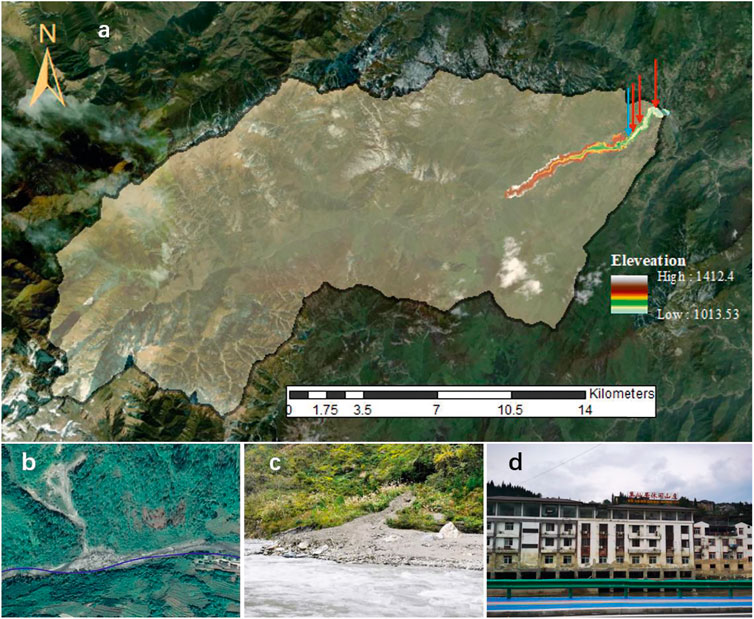
FIGURE 1. Overview of target watershed and simulated reach. (A) Satellite image of the Xihe watershed and the simulated reach. Background image of the terrain from © Google Earth. (B) Satellite image and (C) photo of debris inflow at Chainage 5,700 m. (D) Photo of flood mark of the residents at Chainage 9,500 m. Blue arrow indicated Chainage 5,700 m, where came the debris flow. Red arrows indicated Chainage 6,100, 7,100, and 9,500 m, which located near the residence.
Hydrodynamic Model—MIKE 11
In our analysis, we used the MIKE 11 model—calibrated and validated in the Xihe River hydrological data of two flash floods. The MIKE 11 model system consists of different submodules, including hydrodynamic, rainfall–runoff, and sediment transport submodules. The hydrodynamic submodule is the core of the modeling system. It uses an implicit, infinite difference scheme to compute unsteady flows in rivers and estuaries, and solves the vertically integrated equations for the conservation of continuity and momentum. The cross section of the research area was extracted from a DSM (digital surface model) map of 0.2 m resolution, covering the area with a length of 10453 m and width of 100 m. Following the method proposed by Gichamo et al. (2012), we extracted the cross section every 200 m along our target area, resulting in 50 cross sections (Supplementary Figure S1). First, we simulated baseflow physics and set a steady discharge of 1.8 m3 s−1 as the boundary condition. Q–h relationship was set as the other boundary condition. Both of them were obtained based on field measurement in dry season. Calibration of the hydrodynamic model was carried out manually through trial and error until satisfactory results were obtained. When the bed resistance was calibrated with a Manning coefficient of 0.05, water depth was 0.8 m, close to the measured value in the field.
After setting the steady state of baseflow, the rainfall–runoff submodules were added to the simulation. MIKE 11 supplies different submodules for rainfall–runoff simulation, such as NAM, UHM, SMAP, and urban. We chose NAM to simulate discharge of flash flood at the outlet of the watershed. NAM is a lumped, conceptual hydrological model to simulate runoff production under continuous rainfall. The submodule requires rainfall and evaporation as input. We simulated two flash floods coded by “20190820” and “20160826,” respectively. Rainfall data from the hydrological station were used as input, and discharge was used as the output to calibrate and validate the model. Because we focused on simulating flash floods, evaporation was set as 0 during the simulation process.
Due to the lack of sediment data, we did not specifically calibrate and validate the sediment submodule but used it in scenarios to test sensitivity of flooding hazard to sediment characteristics. Settings of the sediment size distribution of bed load and suspended load were taken from Qi et al. (2014) (Table 1). The parameter “theta critical” determines if river bed is eroded, thus is sensitive to river bed change by sediment. We used the steady state to calibrate this parameter. The discharge of 1.8 m3 s−1 with no inflow of sediment “theta critical” was calibrated to be 0.156, so no erosion appeared on the river bed.

TABLE 1. Sediment parameter setting in MIKE 11.
Model Calibration and Validation
Normally, hydrological models should be calibrated and validated based on long-term data. In this study, we aimed not to prove the ability of NAM for flash flood simulation. NAM was adopted to supply boundary conditions for the hydrodynamic model. Therefore, the model was calibrated and validated based on two flash flood events, which occurred on August 20, 2019 and August 26, 2016, respectively. Recorded rainfall and discharge is displayed in Supplementary Figure S2.
Model performance was assessed by comparing predicted values against observed data for hourly discharge. R2, modeling efficiency, coefficient of determination, and root-mean-square error were applied to evaluate model performance (model goodness of fit, GOF) (Loague and Green, 1991).
Modeling efficiency was calculated as follows:
coefficient of determination (CD) as follows:
where are the observed values, is the mean of the observed data, are the predicted values, and n is the number of samples.
EF indicates how well the predicted values correspond to the observed values. A value of 1 means a perfect one-to-one fit. Following the studies of Pansak et al. (2010) and (Lippe et al., 2014), an EF threshold of > 0.6 was used as the minimum performance criterion during model calibration procedures. CD is a measure of the proportion of the total variance of observed data explained by the predicted data; a value of 1 indicates a perfect prediction fit. We considered CD values between 0.5 and 2 during model calibration and estimation of validation success.
Results of model performance demonstrated that our model was able to reproduce the flash flood process, with an EF of 0.92 and 0.87 for calibration and validation, respectively (Figure 2). A summary of calibrated parameters from the rainfall–runoff submodule is listed in Table 2. Among these parameters, Lmax and Umax determine the flow peak; CK1,2 determines shape of the flow peak; and TIF determines time of the flow peak. We calibrated the simulated hydrograph by adjusting these four parameters. Others were taken as the default value.
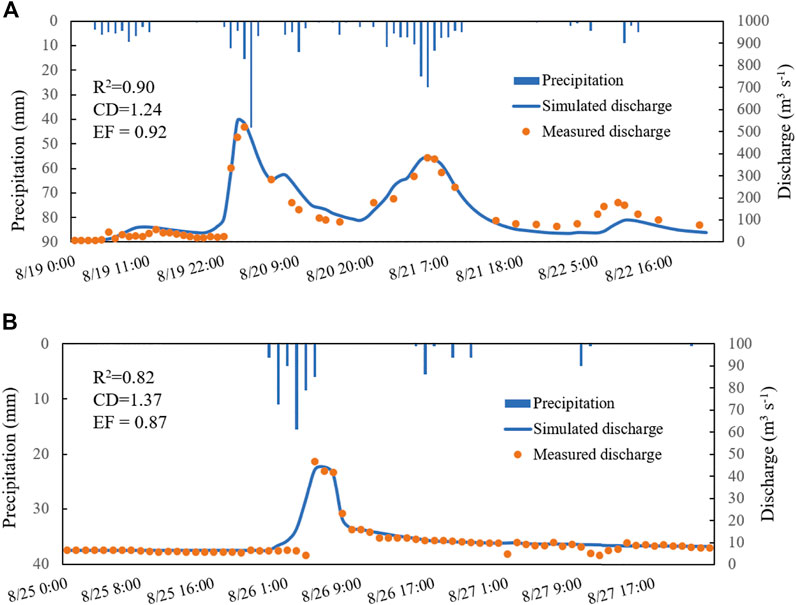
FIGURE 2. Model performance of (A) calibration of flooding on August 20, 2019, and (B) validation of flooding on August 26, 2016. EF: modeling efficiency. CD: coefficient of determination.
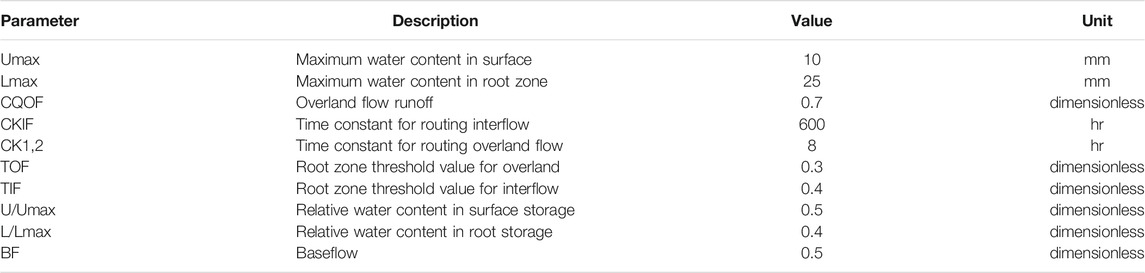
TABLE 2. Hydrologic submodel parameters and their input values obtained during calibration.
Scenarios Settings
We used the flash flood “20190820” with no sediment inflow as the baseline and set another six scenarios, each of which consisted of three sub-scenarios, to test the impact on flash flood hydrodynamics from (1) sediment concentration, (2) sediment particle size distribution, and (3) location of sediment inflow. The hydrological station continuously measured rainfall and discharge and occasionally measured sediment concentration. Highest sediment concentration in flash flood was recorded as 5%, so we set sediment concentration scenarios as 1, 3, and 5%. Sediment particle size was set to be 0.06, 1, and, 3 mm for different scenarios, corresponding to the suspended sediment and bed load of river flow and debris flow, respectively, measured by Qi et al., (2014). The location of sediment inflow was set to be 0 and 5,600 m, respectively. The former was to simulate the scenario that all sediment particles came from upstream; the latter was to simulate a sudden sediment increase from debris flow of the right bank of the river (Figures 1B,C). We set scenarios by considering the aforementioned factors. In total, we tested 18 scenarios. Among them, six scenarios showed river clogging whose effects cannot be correctly simulated by our model. We deleted these clogging scenarios from the result part. Valid scenarios are listed in Table 3. Analysis of variance (ANOVA) was used to calculate contribution of factors (sediment inflow point, medium particle size, and sediment concentration) to the variability of the flooding area.
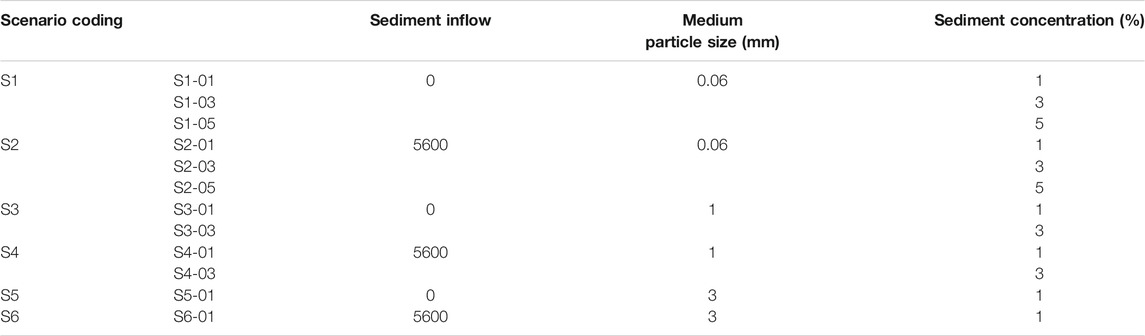
TABLE 3. Scenario runs to assess the sensitivity of flooding hazard to sediment characteristics.
Results
To evaluate the impacts of sediment on the flooding area and hazard of flash flood, we analyzed the following indicators including the following: (1) bed elevation, (2) water level, and (3) total flooded areas. For each indicator, we compared the simulated results of the reference scenario (no sediment) with the other scenarios. In this way, we expected to identify the influential features of sediment to the flash flood hydrodynamics and to incorporate this into the flash flood early warning system.
Bed Level Changes
Sediment inflow did not continuously influence bed elevation along the whole reach but affected certain range of length. When the sediment inflow was from the starting point or the point at Chainage 5,600 m of the reach, the total affected length ranged from 500 to 3,600 m, mainly depending on the sediment particle size distribution (Figure 3). When the median particle size was 0.06 m, 34% of the reach (3,600 m out of 10435 m) showed an increase in bed elevation, up to over 5 m high (Figures 3A,B). When the median particle size was 1 or 3 mm, equaling to that in debris flow, most sediment particles deposited within 50 m from the inflow, and increased the river bed above 15 m (Figures 3C–F).
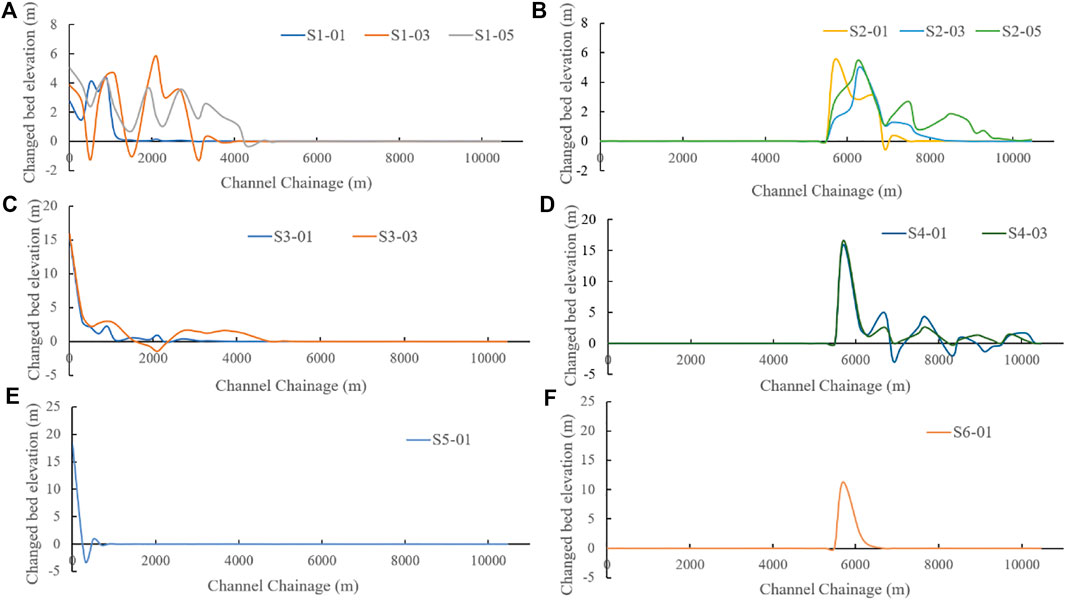
FIGURE 3. River bed change by different sediment input compared to simulation without sediment. (A), (C), (E) showed bed change when the inflow of sediment was at the beginning point of the reach with medium particle size of (A) 0.06, (C) 1, and (E) 3 mm. (D), (D), (F) showed bed change when sediment inflow was at Chainage 5,600 m with a medium particle size of (B) 0.06, (D) 1, and (F) 3 mm. Each sub-figure contained simulation results of different sediment concentration. When medium particle size of sediment particles increased to 1 mm, the river was clogged by 5% concentration. Therefore, (C) and (D) only showed results of concentration of 1 and 5%. The same results were obtained when medium particle size raised to 3 mm.
Sediment concentration showed little influence on the length of affected reach but increased deposition thickness. When sediment concentration increased from 1 to 5%, the highest deposition thickness increased by around 5 m at the median particle size of 0.06 mm (Figures 3A,B). When median particle size was more than 1 mm the river easily clogged (Figures 3C–F). For a median particle size of 1 mm and a sediment concentration of 5%, the river was totally clogged which led to a stop of model simulation. The same condition was observed when sediment concentration equaled to 3 and 5% at the median particle size of 3 mm. Therefore, simulation results were missing in these scenarios (Figures 3C–F).
Water Level at Residential Places Along the Xihe River
We focused on water levels of cross sections near the residence because these were most concerned by flooding hazard managers. Along the Xihe River, residents locate at banks of Chainage 6,100, 7,100, and 9,500 m (Figure 1). So our analysis on water level changes by sediment transport focused on these three points. When the inflow of sediment particles was at the starting point of the reach, no changes in the water level were observed at Chainage 6,100, 7,100, and 9,500 m (Supplementary Figure S3). When the inflow of sediment was at Chainage 5,600 m, the water level was highly influenced at Chainage 6,100 and 7,100 m but showed little change at Chainage of 9,500 m (Figures 4–6).
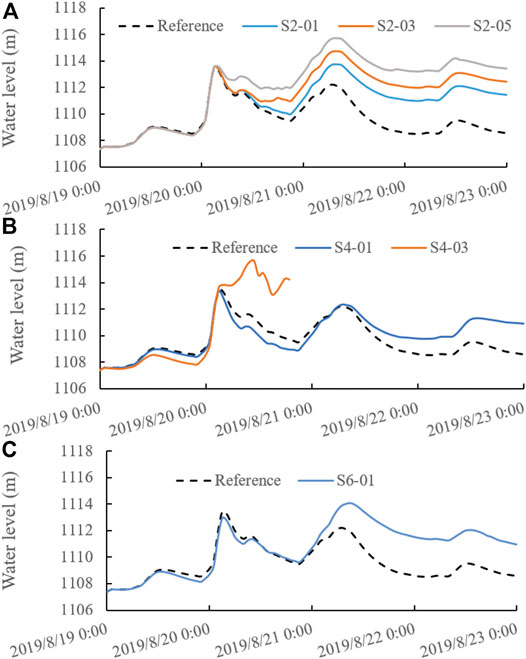
FIGURE 4. Affected water level at Chainage 6,100 m when sediment inflow was from 5,700 m with (A) medium particle size of 0.06 mm with concentration of 1, 3, and 5%; (B) medium particle size of 1 mm with a concentration of 1 and 3%. When concentration increased to 5%, the river was clogged, showing no simulation results; (C) medium particle size of 3 mm with concentration of 1%. When concentration increased to 3%, river was clogged, showing no simulation results.
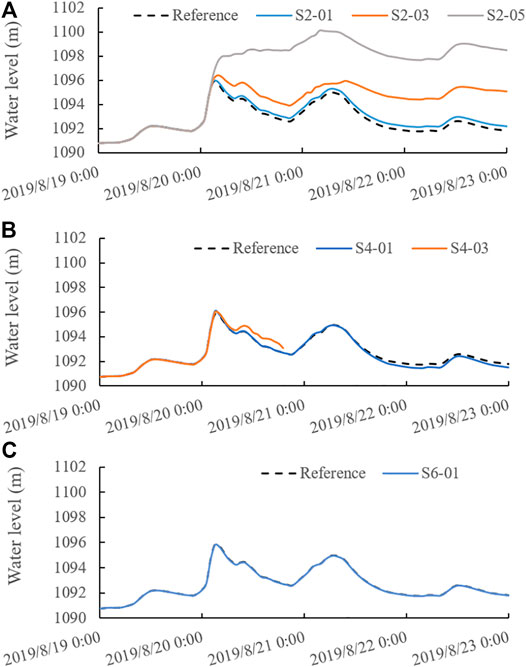
FIGURE 5. Affected water level at Chainage 7,100 m when sediment inflow was from 5,700 m with (A) medium particle size of 0.06 mm with concentration of 1, 3, and 5%; (B) medium particle size of 1 mm with concentration of 1 and 3%. When concentration increased to 5%, river was clogged, showing no simulation results; (C) medium particle size of 3 mm with concentration of 1%. When concentration increased to 3%, river was clogged, showing no simulation results.
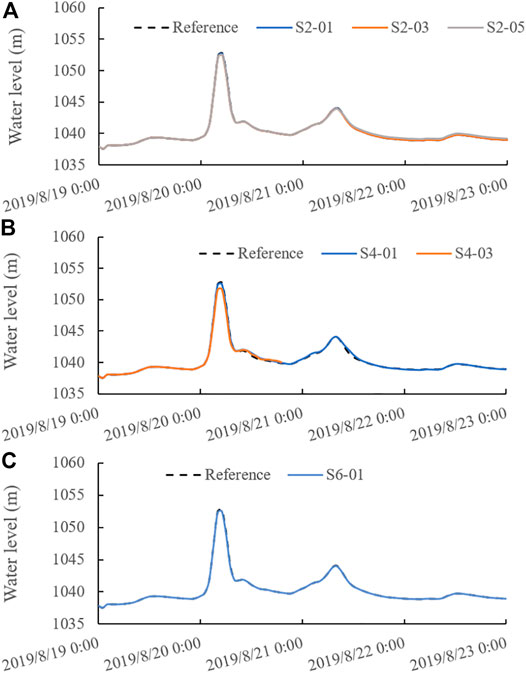
FIGURE 6. Affected water level at Chainage 9,500 m when sediment inflow was from 5,700 m with (A) medium particle size of 0.06 mm with concentration of 1, 3, and 5%; (B) medium particle size of 1 mm with concentration of 1 and 3%. When concentration increased to 5%, river was clogged, showing no simulation results; (C) medium particle size of 3 mm with a concentration of 1%. When concentration increased to 3%, the river was clogged, showing no simulation results.
At the condition of median particle size of 0.06 mm, the water level at Chainage 6,100 m raised by increasing sediment concentration, which appeared right after the first water level peak at 3:00 on 20th August (Figure 4A). The highest rise in the water level was 3 m by a sediment concentration of 1%, when the second rainfall event came. When the sediment concentration increased over 3%, the smaller rainfall event produced a higher water level than the former big event. The water level increased over 5 m under a sediment concentration of 5% after the first extreme rainfall event. When median particle size was 1 mm, the water level was less influenced than by a median particle size of 0.06 mm. First, it lowered by sediment inflow for the first rainfall event at a sediment concentration of 1% and then increased when the second rainfall came. The highest rise was 3 m (Figure 4B). When sediment concentration increased to 3%, the water level kept rising by the sediment inflow until the river was clogged (Figure 4B). The impact of sediment with a median particle size of 3 mm was similar to that of 1 mm. Because the river was clogged shortly after the simulation when sediment concentration was 3 and 5%, we only showed the simulation result of concentration of 1% (Figure 4C).
Impacts of sediment on the water level at Chainage 7,100 m were similar to but lower than that at Chainage 6,100 m (Figure 5). The water level slightly increased by 0.2 m for sediment of a median particle size of 0.06 mm and concentration of 1%. The raise in the water level increased to 3 and 7 m when sediment concentration increased to 3 and 5%, respectively (Figure 5A). If median particle size was 1 or 3 mm, either the water level at Chainage 7,100 m was little influenced or the river was gradually clogged by sediment inflow (Figures 5B,C). The water level at Chainage 9,500 m was little affected by sediment inflow from the point of Chainage 5,600 m (Figure 6).
Total Flooded Area
The total area in the watershed that is inundated for different sediment concentrations is depicted in Figure 7. No significant differences are noticed for most of the length of the reach. Major differences however appear in regions within approxmately 100 m away from the sediment inflow. Simulations with small median particle size (0.06 mm) highly increased the total flooded area by 3.5–15.6% under different sediment concentrations. For larger particle size, the affected area grows gradually compared to the clear water flooding case. Increments in the total area of 3–5% were observed for a median particle size of 1 mm. A slight decrease in the total area was observed for a median particle size of 3 mm. Sediment flow and median particle size best explained the variation in the total flood area, with contributions of 30 and 24%, respectively. Sediment concentration explained 12% of the variability in the total flood area (Table 4).
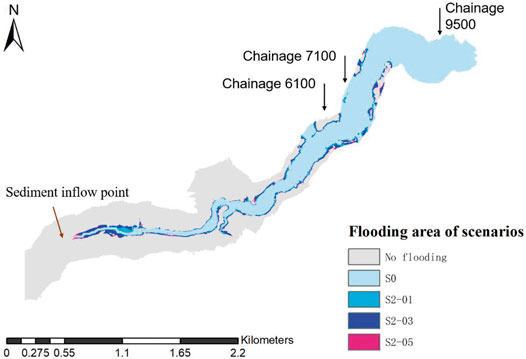
FIGURE 7. Flooding area of different simulated scenarios. S0 referred to scenario with no sediment inflow. S2-01 referred to scenario with sediment inflow at the Chainage 5,600 m, with medium particle size of 0.06 m of 1% concentration; S2-03 referred to scenario with sediment inflow at the Chainage 5,600 m, with medium particle size of 0.06 m of 3% concentration; S2-05 referred to scenario with sediment inflow at the Chainage 5,600 m, with a medium particle size of 0. m of 5% concentration.
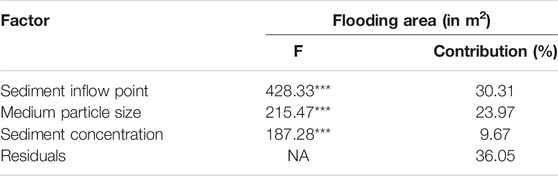
TABLE 4. Results of two-way ANOVA test on the effects of sediment characteristics (inflow, medium particle size, and concentration) on the flooding area. Asterisk indicates significant correlations (p < 0.001). NA: not applicable.
Discussion
Sediment is transported in two ways: (i) as bed load when particles roll, slide, or saltate along the cannel bed, and (ii) as suspended load when particles are supported by turbulent forces and move considerable distances without touching the channel bed. Impacts of sediment on flash flood hydrodynamics were proved in either way, separately (Song et al., 2019; Contreras and Escauriaza 2020). This study considered sediment transport by both forms and discussed sensitivity of flash flood hazard on sediment characteristics.
Our results evidenced that the sediment inflow location determined the affected range of the reach. Abrupt increase in sediment load significantly increased flooded area downstream. When sediment came from the watershed, flowing from the starting point of the reach, it hardly influenced flooding hazard around residence due to fast deposition in upstream. We further proved that when sediment particles from landslide or debris flow along the reach, finer particles had more influence on flooding hazard than coarser particles because sediment with coarser particles mostly deposited in the reach and had little influence on the flooded area downstream. Chen. (2009) demonstrated that sediment concentration downstream highly correlated with the landslide area in a watershed. Qi et al. (2014) clarified that fine particles from landslide or debris flow were transported and affected sediment concentration downstream, while coarse particles were deposited in the reach. This was supported by field observations of high amounts of fine sediment after flash floods. Our results were consistent with previous studies and field observations and called for attention on fine sediment from highly erosive slopes near residence, which were mainly responsible for increased flooding hazard downstream.
Sediment impacts on flooding mostly started after the discharge peak (Figures 4A, 5A). During the peak flow, sediment capacity of the flow is high, resulting in little deposition on the river bed. Shortly after the peak, sediment capacity decreased, leading to the deposition. This deposition increased roughness of the river bed, which in turn decreased flow velocity and promoted deposition (Guan et al., 2013). Such a process accumulated the sediment deposition and highly increased flooding hazard afterward. The second rainfall event did not show flooding hazard at the Chainage 6,100 m under no-sediment scenario. But when we considered a sediment concentration more than 3%, the rising water level reached 1,115 m and caused flooding. The sediment scenario simulation results coincided with flooding reported by the villagers. Flash flood warning systems mostly depend on rainfall thresholds calculated either from the model or history data (Bartholmes et al., 2009; Thielen et al., 2009) but seldom consider sediment. Our results proposed that sediment could possibly cause unexpected flooding hazard due to the rising river bed after an extreme rainfall event, as suggested by what was observed in the field (Wang et al., 2019; Liu et al., 2020). Despite high attentions on sediment concentration impacts on flash flood hydrodynamic, we do not suggest it as a good predictor of flooding warning system.
This study discussed the role of sediment characteristics such as inflow point, medium particle size, and concentration, when considering impacts of sediment on flooding hazard. It emphasizes the importance of considering fine sediment from highly erosive slopes near residence and proposes attentions on flooding hazards after an extreme rainfall event, but our results need to be read with caution due to some potential limitations. Although our model was calibrated and validated based on hydrological data, this was not the case when we included the sediment simulation because of limited data. The simulation should not be referenced as flooding hazard assessment but regarded as the sensitivity test of flooding hazard to sediment characteristics. In our scenario settings, we assumed a fixed ratio (i.e., 1, 3, 5%) of sediment to discharge. The ratio of 5% was estimated based on the highest concentration (4.1%) observed downstream and overestimated sediment concentration throughout the flood process (Figure 8). This also explained the overestimated water level (over 6 m) raised by 5% sediment concentration (Figures 4A, 5A). The model and scenario simulation need further verification when data are available.

FIGURE 8. Measured sediment concentration changing along flash flood discharge.
Conclusion
The primary emphasis of this work was to examine the sensitivity of flooding hazard on characteristics of sediment in flash flood. To simulate different scenarios, we employed the MIKE 11 suite to simulate the hydrodynamics of flash flood and then selected inflow point, medium particle size, and sediment concentration to test their impacts on flooding hazard, which was revealed by river bed elevation, water level, and flooded area.
The most important effects from sediment characteristics are observed to be the inflow location. Our simulation results showed a certain spatial range where sediment possibly changed the river bed and increased flooding hazard. When sediment inflow was from the inlet of the reach (i.e., Chainage 0 m), coarse particles deposited along the distance of 3,000 m away from the inlet and fine particles moved further downward. When sediment inflow was from a point along the reach (i.e., 5600 m) as a debris flow, it immediately deposited and increased the river bed. This is particularly true when sediment particles are fine particles with a medium size of 0.06 mm. Our study emphasizes the importance of fine sediment from erosive slopes on flooding hazard. We also observed that impacts of sediment on flooding hazard emerged after the discharge peak, thus proposing attention on flooding hazard after an extreme rainfall event.
Data Availability Statement
The raw data supporting the conclusions of this article will be made available by the authors, without undue reservation.
Author Contributions
HL: conceptualization, formal analysis, and writing; YY: supervision and conceptualization; and ZJ: data curation.
Funding
This research was financially supported by the National Key Research & Development Program of China (2019YFC1510700) and Beijing Natural Science Foundation (JQ19034).
Conflict of Interest
The authors declare that the research was conducted in the absence of any commercial or financial relationships that could be construed as a potential conflict of interest.
Publisher’s Note
All claims expressed in this article are solely those of the authors and do not necessarily represent those of their affiliated organizations, or those of the publisher, the editors, and the reviewers. Any product that may be evaluated in this article, or claim that may be made by its manufacturer, is not guaranteed or endorsed by the publisher.
Supplementary Material
The Supplementary Material for this article can be found online at https://www.frontiersin.org/articles/10.3389/feart.2021.683453/full#supplementary-material
References
Bartholmes, J. C., Thielen, J., Ramos, M. H., and Gentilini, S. (2009). The European Flood Alert System EFAS - Part 2: Statistical Skill Assessment of Probabilistic and Deterministic Operational Forecasts. Hydrol. Earth Syst. Sci. 13, 141–153. doi:10.5194/hess-13-141-2009
Chen, C.-Y. (2009). Sedimentary Impacts from Landslides in the Tachia River Basin, Taiwan. Geomorphology 105, 355–365. doi:10.1016/j.geomorph.2008.10.009
Chuang, S.-C., Chen, H., Lin, G.-W., Lin, C.-W., and Chang, C.-P. (2009). Increase in basin Sediment Yield from Landslides in Storms Following Major Seismic Disturbance. Eng. Geology. 103, 59–65. doi:10.1016/j.enggeo.2008.08.001
Contreras, M. T., and Escauriaza, C. (2020). Modeling the Effects of Sediment Concentration on the Propagation of Flash Floods in an Andean Watershed. Nat. Hazards Earth Syst. Sci. 20, 221–241. doi:10.5194/nhess-20-221-2020
Fan, X., Rossiter, D. G., van Westen, C. J., Xu, Q., and Görüm, T. (2014). Empirical Prediction of Coseismic Landslide Dam Formation. Earth Surf. Process. Landforms 39, 1913–1926. doi:10.1002/esp.3585
Gichamo, T. Z., Popescu, I., Jonoski, A., and Solomatine, D. (2012). River Cross-Section Extraction from the ASTER Global DEM for Flood Modeling. Environ. Model. Softw. 31, 37–46. doi:10.1016/j.envsoft.2011.12.003
Grozav, A., Beilicci, R., and Beilicci, E. (2017). “Modelling of Sediment Transport of the Mehadica River, Caras Severin County, Romania,” in IOP Conference Series: Materials Science and Engineering (IOP Publishing), 032030. doi:10.1088/1757-899x/245/3/032030IOP Conf. Ser. Mater. Sci. Eng.245
Guan, M., Wright, N., and Sleigh, P. (2013). “Modelling and Understanding Multiple Roles of Sediment Transport in Floods,” in Proceedings of the 35th IAHR World Congress (Tsinghua University Press).
Han, W., Liang, C., Jiang, B., Ma, W., and Zhang, Y. (2016). Major Natural Disasters in China, 1985-2014: Occurrence and Damages. Ijerph 13, 1118. doi:10.3390/ijerph13111118
Hooke, J. M. (2019). Extreme Sediment Fluxes in a Dryland Flash Flood. Sci. Rep. 9, 1686–1712. doi:10.1038/s41598-019-38537-3
Lippe, M., Marohn, C., Hilger, T., Dung, N. V., Vien, T. D., and Cadisch, G. (2014). Evaluating a Spatially-Explicit and Stream Power-Driven Erosion and Sediment Deposition Model in Northern Vietnam. Catena 120, 134–148. doi:10.1016/j.catena.2014.04.002
Liu, W., Tan, Q., and Wu, W. (2020). Forecast and Early Warning of Regional Bus Passenger Flow Based on Machine Learning. Math. Probl. Eng. 2020, 1–11. doi:10.1155/2020/6625435
Loague, K., and Green, R. E. (1991). Statistical and Graphical Methods for Evaluating Solute Transport Models: Overview and Application. J. contaminant Hydrol. 7, 51–73. doi:10.1016/0169-7722(91)90038-3
Pansak, W., Hilger, T., Lusiana, B., Kongkaew, T., Marohn, C., and Cadisch, G. (2010). Assessing Soil Conservation Strategies for upland Cropping in Northeast Thailand with the WaNuLCAS Model. Agroforest Syst. 79, 123–144. doi:10.1007/s10457-010-9290-2
Parker, R. N., Densmore, A. L., Rosser, N. J., de Michele, M., Li, Y., Huang, R., et al. (2011). Mass Wasting Triggered by the 2008 Wenchuan Earthquake Is Greater Than Orogenic Growth. Nat. Geosci 4, 449–452. doi:10.1038/ngeo1154
Qi, L., Wang, Z., and Wang, X. (2014). Earthquake Erosion and Sediment Transportation of Mianyuan River Basin. Bull. Soil Water Conservation 34, 1–6.
Siviglia, A., and Crosato, A. (2016). Numerical Modelling of River Morphodynamics: Latest Developments and Remaining Challenges. Adv. Water Resour. 93, 1–3. doi:10.1016/j.advwatres.2016.01.005
Song, Y., Zeng, X., Zhang, Y., An, C., Ma, M., and Fu, X. (2019). Effect of Sediment Transport on the Temporal and Spatial Characteristics of Flash Floods: A Case Study of "7.21. Flood Beijing J. Tsinghua Univ. (Science Technology) (Chinese) 59, 990–998.
Testa, G., Zuccalà, D., Alcrudo, F., Mulet, J., and Soares-Frazão, S. (2007). Flash Flood Flow experiment in a Simplified Urban District. J. Hydraulic Res. 45, 37–44. doi:10.1080/00221686.2007.9521831
Thielen, J., Bartholmes, J., Ramos, M.-H., and de Roo, A. (2009). The European Flood Alert System - Part 1: Concept and Development. Hydrol. Earth Syst. Sci. 13, 125–140. doi:10.5194/hess-13-125-2009
Wang, W., Godard, V., Liu-Zeng, J., Scherler, D., Xu, C., Zhang, J., et al. (2017). Perturbation of Fluvial Sediment Fluxes Following the 2008 Wenchuan Earthquake. Earth Surf. Process. Landforms 42, 2611–2622. doi:10.1002/esp.4210
Wang, X., Liu, X., and Zhou, J. (2019). Research Framework and Anticipated Results of Flash Flood Disasters under the Mutation of Sediment Supply. Adv. Eng. Sci. (Chinese) 51, 1–10.
Keywords: MIKE 11, flash flood warning, hydrodynamic modeling, sediment analysis, flooding hazard assessment
Citation: Liu H, Yi Y and Jin Z (2021) Sensitivity Analysis of Flash Flood Hazard on Sediment Load Characteristics. Front. Earth Sci. 9:683453. doi: 10.3389/feart.2021.683453
Received: 21 March 2021; Accepted: 05 August 2021;
Published: 28 September 2021.
Edited by:
Xiekang Wang, Sichuan University, ChinaReviewed by:
Ying Chen, Fujian Normal University, ChinaJoern Lauterjung, German Research Centre for Geosciences, Helmholtz Centre Potsdam,Germany
Copyright © 2021 Liu, Yi and Jin. This is an open-access article distributed under the terms of the Creative Commons Attribution License (CC BY). The use, distribution or reproduction in other forums is permitted, provided the original author(s) and the copyright owner(s) are credited and that the original publication in this journal is cited, in accordance with accepted academic practice. No use, distribution or reproduction is permitted which does not comply with these terms.
*Correspondence: Yujun Yi, WWl5dWp1bkBibnUuZWR1LmNu