 Wanzhang Wang1*
 Tilo von Dobeneck1
 Thomas Frederichs1
 Yang Zhang1
 Lester Lembke-Jene2
 Ralf Tiedemann2
 Michael Winklhofer3
 Dirk Nürnberg4
- 1MARUM—Center for Marine Environmental Sciences and Faculty of Geosciences, University of Bremen, Bremen, Germany
- 2AWI—Alfred Wegener Institute, Helmholtz Centre for Polar and Marine Research, Bremerhaven, Germany
- 3Institute for Biology and Environmental Sciences IBU, Research Center for Neurosensory Sciences, Carl von Ossietzky University Oldenburg, Oldenburg, Germany
- 4GEOMAR Helmholtz Centre for Ocean Research Kiel, Kiel, Germany
Non-carbonaceous abyssal fine-grained sediments cover vast parts of the North Pacific’s deep oceanic basins and gain increasing interests as glacial carbon traps. They are, however, difficult to date at an orbital-scale temporal resolution and still rarely used for paleoceanographic reconstructions. Here, we show that sedimentary records of past geomagnetic field intensity have high potential to improve reversal-based magnetostratigraphic age models. Five sediment cores from Central North Pacific mid-latitudes (39–47°N) and abyssal water depths ranging from 3,900 to 6,100 m were cube-sampled at 23 mm resolution and analyzed by automated standard paleo- and rock magnetic methods, XRF scanning, and electron microscopy. Relative Paleointensity (RPI) records were determined by comparing natural vs. anhysteretic remanent magnetization losses during alternating field demagnetization using a slope method within optimized coercivity windows. The paleomagnetic record delivered well interpretable geomagnetic reversal sequences back to 3 Ma. This age span covers the climate-induced transition from a biogenic magnetite prevalence in the Late Pliocene and Early Pleistocene to a dust-dominated detrital magnetic mineral assemblage since the Mid-Pleistocene. Volcaniclastic materials from concurrent eruptions and gravitational or contouritic sediment re-deposition along extinct seamount flanks provide a further important source of fine- to coarse-grained magnetic carriers. Surprisingly, higher proportions of biogenic vs. detrital magnetite in the late Pliocene correlate with systematically lowered RPI values, which seems to be a consequence of magnetofossil oxidation rather than reductive depletion. Our abyssal RPI records match the astronomically tuned stack of the mostly bathyal Pacific RPI records. While a stratigraphic correlation of rock magnetic and element ratio logs with standard oxygen isotope records was sporadically possible, the RPI minima allowed to establish further stratigraphic tie points at ∼50 kyr intervals. Thus, this RPI-enhanced magnetostratigraphy appears to be a major step forward to reliably date unaltered abyssal North Pacific sediments close to orbital-scale resolution.
Introduction
Establishing a robust and detailed sediment core chrono-stratigraphy is a major prerequisite for paleoceanographic interpretation and global stratigraphic correlation. Dating abyssal North Pacific sediments is a difficult task, as many of these were deposited below the carbonate compensation depth (CCD), which today is at ∼4,700 m water depth (Lyle, 2003) (Figure 1). The widespread lack of calcareous microfossils in the deep North Pacific precludes calcareous biostratigraphy, stable oxygen stratigraphy and radiocarbon dating, leaving magnetostratigraphy, tephrochronology, lithostratigraphy and siliceous biostratigraphy as most important options. Since the pioneer studies of Ninkovich et al. (1966), Opdyke and Foster (1970) and Kent and Lowrie (1974), reversal magnetostratigraphy has been the primary method to date North Pacific abyssal sediments. The sedimentary records of past geomagnetic polarity changes still form the backbone of most more recently published sediment chronologies from that region (Yamazaki and Ioka, 1997; Yamazaki and Oda, 2005; Korff et al., 2016; Shin et al., 2019). However, the temporal resolution of the Neogene geomagnetic polarity timescale is limited by the occurrence of only 3-5 geomagnetic polarity reversals per million years (Valet et al., 2005; Ogg, 2020). This resolution does not permit to capture orbital scale climate dynamics.
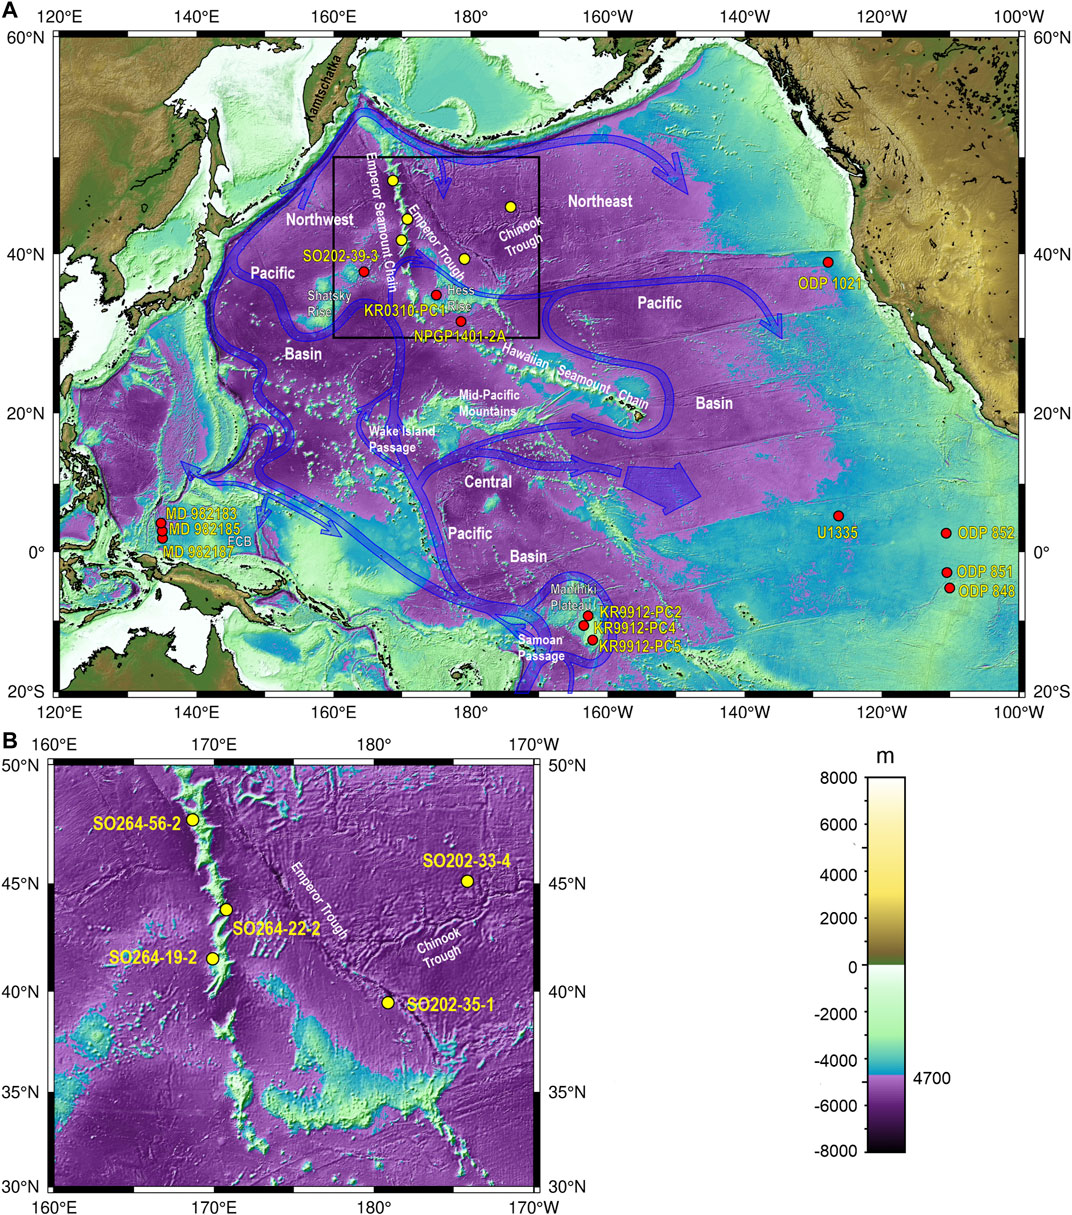
FIGURE 1. (A) Bathymetric and geographical setting of the North and Equatorial Pacific Ocean. The bathymetry data is from the General Bathymetric Chart of the Ocean (GEBCO, 2020). The color scale indicates water depth (m). A sharp change from blue to purple in the color scale marks the water depth of 4,700 m corresponding to the North Pacific CCD boundary (Lyle, 2003). Deep water currents were drawn according to Kawabe and Fujio (2010). Yellow circles refer to the cores of this study, red circles to previously published RPI records; a black rectangle encompasses the study area. ECB: East Caroline Basin, WCB: West Caroline Basin. (B) Close-up section of study area with the five sediment cores of RV SONNE Expeditions 202 and 264 presented here.
The Relative Paleointensity (RPI) method is an established way to enhance the temporal resolution in magnetostratigraphy (e.g., Tauxe et al., 1995) and has been successfully applied to North Pacific sediments (Yamazaki and Oda, 2005; Yamazaki and Kanamatsu, 2007). It assumes that the degree of alignment of magnetic carrier minerals, obtained by normalizing the Natural Remanent Magnetization (NRM) by a suitable magnetic mineral concentration parameter, reflects the very dynamic fluctuations of the geomagnetic dipole moment in the past. The RPI method has been corroborated by the independent authigenic 10Be/9Be method based on the fact that the Earth’s magnetic field controls the production rates of the cosmogenic nuclide 10Be. (Frank et al., 1997; Simon et al., 2016; Simon et al., 2018). Earth’s magnetic dipole strength varies in a similar frequency range as orbital insolation (Constable and Johnson, 2005; Yamazaki and Oda, 2005; Suganuma et al., 2008), but is far more chaotic due to the inherent instability of the geodynamo mechanism. By their spectral characteristics, RPI-based correlation age models should provide similar resolutions as orbital chronologies. The non-periodic nature and more complex features of RPI may even facilitate pattern matching between different sediment records, especially if they are from the same region.
Numerous critical investigations of the RPI method revealed, however, that RPI records often suffer from sedimentary bias that can compromise data reliability and hamper pattern recognition and correlation. Factors impacting the magnetic recording efficiency and, consequently, the RPI signal characteristics of sediments are mineral and grain-size variability of the magnetic carriers (Tauxe et al., 1995; Channell et al., 2013; Chen et al., 2017; Hatfield et al., 2020), changes in composition and porosity of the sediment matrix (Franke et al., 2004; Hofmann and Fabian, 2007), and varying sedimentation, bioturbation and consolidation rates (Tauxe et al., 1996). Another potential problem of the RPI method is diagenetic magnetite dissolution (e.g., Hofmann and Fabian, 2009; Korff et al., 2016) and secondary precipitation of greigite (Rowan et al., 2009) or biogenic magnetite. On the opposite, high-grade oxidation (maghemitization) of fine-grained magnetite has also been found to destabilize the NRM of deep Pacific sediments (Kent and Lowrie, 1974; Yamazaki and Katsura, 1990) during the Pliocene when the deep North Pacific ocean was better ventilated.
The continuous paleomagnetic recording mechanism inherent to sediment accumulation is known as “Postdepositional Remanent Magnetization (PDRM) acquisition.” PDRM is acquired by the orientation of magnetized grains along with the geomagnetic field in the upper sedimentary column, followed by fixation in a PDRM “lock-in zone” localized in ∼5–30 cm depth below the sediment surface. The PDRM process is affected by many factors and not well defined. Therefore, a systematic and often varying age lag between magnetostratigraphic and cyclostratigraphic datings is unavoidable (Bleil and von Dobeneck, 1999; Roberts and Winklhofer, 2004; Suganuma et al., 2010; Simon et al., 2018). In RPI reference records dated by orbital tuning of paleoceanographic proxies, RPI signal minima can be offset and/or expanded with respect to corresponding reversal ages (e.g., Yamazaki and Oda, 2005). Dealing with such intrinsic dating discrepancies is particularly important in oceanic regions characterized by very low sediment accumulation rates as the abyssal North Pacific.
The most widely used Pleistocene RPI reference stacks are the SINT-2000 (0–2000 ka; Valet et al., 2005), a stack of five to ten independently dated records from the Atlantic, Indian and Pacific Oceans, and the equally global PISO-1500 stack (0–1,500 ka; Channell et al., 2009). In order to preserve regional sedimentary recording characteristics and non-dipolar paleo-field contributions, RPI stacks for specific oceanic regions have been established. The high-resolution NAPIS (10–75 ka; Laj et al., 2000) and SAPIS (0–80 ka; Stoner et al., 2002) represent the North and South Atlantic, the NOPAPIS stack (0–250 ka; Yamamoto et al., 2007) the North Pacific. Among the few presently available RPI records reaching into or beyond Pliocene times are the Equatorial Pacific Paleointensity Stack, EPAPIS-3Ma (0.75–3 Ma; Yamazaki and Oda, 2005) and the composite RPI record of IODP Site U1335 (0–8 Ma; Yamazaki and Yamamoto, 2018). Valet and Meynadier published a composite record of ODP sites 848, 851, 852 (0–4 Ma, Valet and Meynadier, 1994) featuring a famous “saw-tooth pattern” with a gradual decrease before and a sharp recovery after polarity transitions. Valet et al. (2020) also recently published composite RPI records for east Pacific ODP sites 1021 and 851 (both 0–4.4 Ma). Most of these RPI records or stacks are from elevated seamount or ridge flank locations with water depths shallower than 4,600 m, and from equatorial or low-latitude sites, where the CCD is deeper (Table 1; Figure 1). These sediments usually have sedimentation rates of >1 cm/kyr and cyclic carbonate contents that some researchers used for dating RPI records by oxygen isotope stratigraphy. Cyclic variability in sediment lithology has also been used to establish astronomical timescales for some Pacific RPI records by correlating these changes to Earth’s orbital parameters.
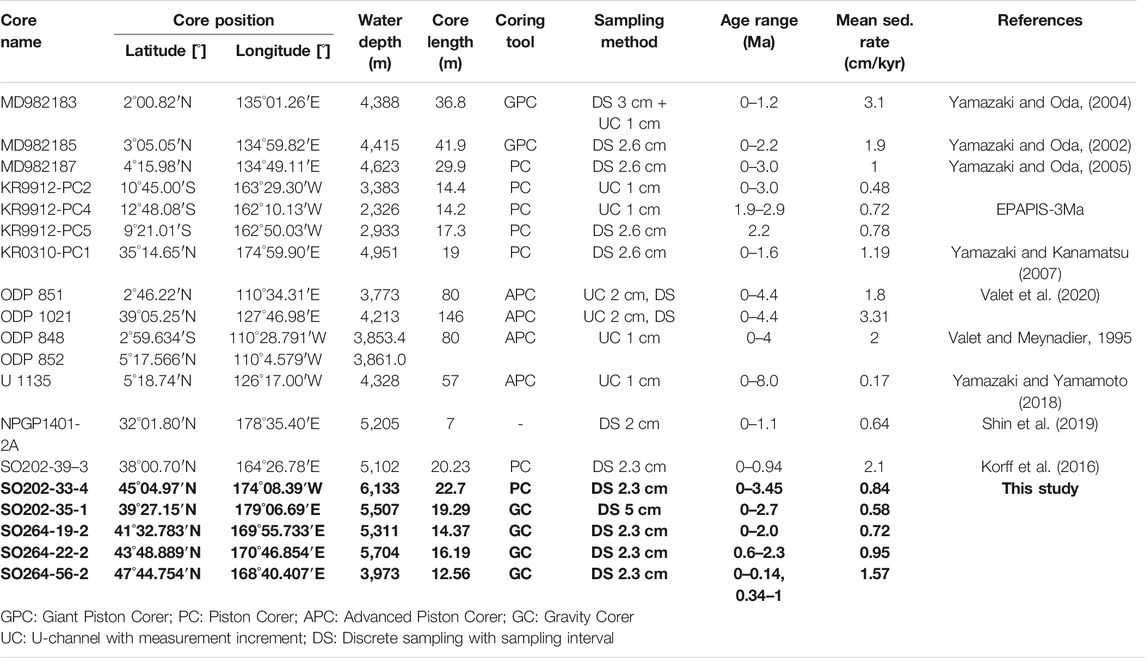
TABLE 1. Previously published and newly reported (in bold) North Pacific RPI records.
This study investigates the Plio-Pleistocene North Pacific reversal and RPI records of five newly studied abyssal sediment cores (Table 1) collected during North Pacific R/V SONNE cruises SO202 INOPEX (Subarctic Pacific W–E transect in 2009) and SO264 EMPEROR (Emperor Seamount Chain N–S transect in 2018). The gravity and piston cores were retrieved from margins of abyssal plains in mid-ocean and mid-latitude positions between 39 and 47°N (Figure 1). These mostly clayey, nearly carbonate-free, and seemingly undisturbed cores were selected to create a regional chronostratigraphic reference, to which some more complex and possibly discontinuous sediment sequences from elevated seamount and ridge sites will be stratigraphically correlated.
In the North Pacific, sediment deposition below the CCD is dominated by dust input from East Asia. These sediments are exposed to changes in bottom water ventilation and the associated variations in redox conditions. This in turn affects the oxidation states of elements, their solubility and adsorption behavior. Asian dust export (Yamazaki and Ioka, 1997) and deep ocean ventilation (Korff et al., 2016) are reflected in major element and rock magnetic ratios. These proxies will be used to test our reversal- and RPI-based chronologies. In this oligotrophic and mostly oxic part of the North Pacific, far from continents and island arcs and without proximal volcanic activity in the Neogene, these sediments are expected to contain bacterial magnetite as relevant magnetic carrier (Vali and Kirschvink, 1989; Yamazaki and Ioka, 1997), making them attractive for subsequent magnetofossil-based paleoenvironmental studies (Usui et al., 2017; Yamazaki et al., 2020).
Study Area
Bathymetry and Geology
The North Pacific Basin, the world’s deepest ocean basin, is rich and diverse in bathymetric features (Figure 1A): within its 22% share of the global ocean surface, the North Pacific encloses (by area) 66% of the world’s hadal zone (>6,000 m), 41% of the deep sea trenches, 39% of the seamounts, 53% of the guyots, and 29% of the submarine ridges (Harris et al., 2014). It also hosts three large igneous oceanic plateaus: the Shatsky Rise, the Hess Rise, and the Mid-Pacific Mountains. The 6,200 km long Emperor-Hawaiian seamount chain (ESC) stretches from the junction of the Kuril–Kamchatka and Aleutian Trenches at 55°N to the Island of Hawaii at 19°N (Kodama et al., 1978) separating the Northwest Pacific Basin from the Northeast Pacific Basin (Figure 1A). Of similar length is a topographic W-E divide at ∼20°N, composed of the Japanese Guyots, Wake Guyots, and Mid-Pacific Mountains. These structures form a sill that separates the two Northern Pacific Basins from the Central Pacific Basin. Our sediment cores fall into the central North Pacific sector from 30 to 50°N and from 60°E to 170°W (Figure 1B), encompassing both ridge flanks of the ESC and the adjacent Emperor and Chinook Troughs further east. The Emperor Trough consists of several bathymetric deeps extending in NNW orientation over a length of 1750 km (Erickson, 1970; Dickens and Owen, 1995). The Chinook Trough is bathymetrically expressed as a dominant deep in a series of discrete segments with large vertical relief and a maximum depth of 7,140 m (Rea, 1970; Rea and Dixon, 1983; Dickens and Owen, 1995).
Hydrography
North Pacific seamount bases connect in ridge- or platform-like structures that constrain and focus the lower abyssal bottom currents (Figure 1A). Lower Circumpolar Deep Water (LCDW) presently forms the homogeneous lowest deep water mass and ventilates the bulk of the deep North Pacific at water depths below 3,500 m (Mantyla and Reid, 1983; Johnson and Toole, 1993). LCDW is formed in the Southern Ocean by mixing of Antarctic Bottom Water (AABW), Pacific Deep Water (PDW) and North Atlantic Deep Water (NADW). In the North Pacific, LCDW is characterized by a potential temperature of <1.2°C and salinities ranging between 34.65 and 34.70 psu (Talley, 2003; Talley, 2013). On its way into the North Pacific, it ages and accumulates silica and nutrients, thereby loosing oxygen due to remineralization of organic carbon. Thus, the LCDW is relatively oxygen-poor with concentrations from 160–180 μmol O2/kg in the modern North Pacific.
The 5,000 m deep Samoan Passage is the major bottleneck for bottom water transfer from the South to the North Pacific (Reid and Lonsdale, 1974; Roemmich et al., 1996). At present, ∼6.0 Sv of the LCDW supplied by the Southwest Pacific Deep Western Boundary Current (DWBC) traverse the Samoan Passage. This bottom current splits into a western branch, that flows through the east Mariana Basin, and an eastern branch, that travels through the Central Pacific Basin to partly enter the Northwest Pacific Basin through the 5,180 m deep Wake Island Passage (Rudnick, 1997; Kawabe et al., 2009). The separate LCDW branches finally reach the Northeast Pacific Basin either by a northern route along the Aleutian Trench, or through a gap in the Emperor Seamount chain at ∼39°N, or via a bypass of the Hawaiian Ridge at 20°N (Kawano et al., 2006; Komaki and Kawabe, 2009). Local upwelling and vertical mixing with overlying North Pacific Deep Water (NPDW) eventually recycles the dense LCDW waters trapped in the abyssal North Pacific basins (Talley and Joyce, 1992; Johnson et al., 2006).
Sedimentology
North Pacific bottom water is among the oldest water masses in the world (Stuiver et al., 1983). It accumulates high CO2, thereby leading to dissolution of calcite. Sediments from below 4,700 m are practically carbonate-free (Lyle, 2003), but carry minor contents of siliceous microfossils like diatom frustules, radiolarian skeletons and sponge spicules, which possibly stabilize the sedimentary fabric and may thereby improve the stability and quality of its paleomagnetic signal.
The abyssal sediments in the Central North Pacific primarily consist of distal East Asian dust distributed across the North Pacific by westerly winds (Blank et al., 1985; Rea and Hovan, 1995; Snoeckx et al., 1995; Yamazaki and Ioka, 1997). Serno et al. (2014) observed that over 90% of the modern abyssal sediment in the studied area ranges in size from clay to fine silt (mode: ∼4 µm), typical of long-range eolian transport. Most common minerals are illite, chlorite, kaolinite, quartz, and smectite (Corliss and Hollister, 1979). The Subarctic Front and Mixed Water Region at ∼40–45°N dividing the cold subarctic Oyashio Current from the warm subtropical Kuroshio Current marks the approximate southern iceberg drift limit during past glacial intervals, north of which coarse (>250 µm) detrital particles, easily identified as ice-rafted debris (IRD), have been found in abyssal sediments (Kent et al., 1971; St. John and Krissek, 1999; McCarron et al., 2020). However, this source of sediment supply has to be considered only during glacial times, when the transport of ice-rafted debris may expand as far south as 38°N (McCarron et al., 2021).
Sporadic volcaniclastic injections also contribute as a siliciclastic sediment component, particularly along active margins like those in the northwest Pacific. The most relevant pyroclastic fraction in Neogene North Pacific sediments is tephra from the Japan-Kuril-Kamchatka and Izu–Bonin–Mariana Arcs (Straub and Schmincke, 1998). Tephra frequencies are highest in western North Pacific: Derkachev et al. (2020) counted 25 tephra layers within 215 kyr at the north-west terminus of the ESC downwind from the Kamchatka peninsula. Discernible tephra and pumice layers further south are far less frequent (Natland, 1993). Floating pumice formed by shallow submarine rhyolitic eruptions can however drift over large distances. This has also been observed in the North Pacific, but is not nearly as common as in the SW Pacific (Bryan et al., 2012). Fine-grained weathering materials from outcropping volcaniclastic aprons of the ESC may be dissipated by bottom current erosion and reach the adjacent ocean basins by nepheloid transport (Manville et al., 2009). Collapses of instable seamount flanks and slope deposits can generate extensive volcanoclastic plumes and turbidite lobes that may share some similarities with tephra layers.
Materials and Methods
Materials
The sediments investigated here were collected during two North Pacific expeditions of the old and new German research vessels R/V SONNE. The SO202-INOPEX cruise [Tomakomai (Japan)—Busan (South Korea)] in 2009 focused on the biogeochemistry and paleoceanography of the subarctic Pacific and Bering Sea, while the SO264-EMPEROR cruise in 2018 [Suva (Fiji)—Yokohama (Japan); Nürnberg, 2018] explored in particular the shallower North Pacific ESC, thereby addressing the North Pacific’s role in Plio-Pleistocene climate change and carbon cycle dynamics. As the paleo- and rock magnetic studies of Korff et al. (2016) showed cyclic Late Pleistocene glacial magnetite depletion at Northwest Pacific core SO202-39-3, we now investigate two Northeast Pacific abyssopelagic cores SO202-33-4 (Chinook Trough, 6,133 m) and SO202-35-1 (Emperor Trough, 5,507 m) to determine if such cyclic or episodic magnetite dissolution layers are present on either side of the ESC. We also selected three of the deepest SO264 cores (SO264-19-2, 22-2, and 56-2) from abyssal plain locations in proximity to the ESC at mid-latitudes of 39.5–47.7°N and water depths of 3,973–6,133 m (Table 1). All five core locations exhibited well-stratified, undisturbed seismic reflectors as indicated by sub-bottom profiling site surveys. The shipboard core lithological and logging data indicated largely homogenous muddy sedimentary sequences with strong and steady susceptibility signals. We shortly describe each core in the following and refer to the cruise reports (Gersonde, 2012; Nürnberg, 2018) for more detailed site and core descriptions.
The 22.7 m long piston core SO202-33-4 was recovered north of the Chinook Trough fracture zone from a hadal water depth of 6,133 m; it is the deepest core of expedition SO202 and also of our study. The sediment is described as diatom-bearing mud, and, below 15.52 m, as diatom ooze. The 19.29 m long gravity core SO202-35-1 was retrieved from an abyssal plain west of the Emperor Trough at 5,507 m water depth. Its lithology comprises homogeneous light brownish diatom-bearing clay, mottled in various extents. The presence of manganese nodules gives evidence of a very low sedimentation rate as these grow very slowly (Barnes and Dymond, 1967). The 14.37 m long gravity core SO264-19-2 was collected SW of Ninigi Seamount and NW of Nintoku Seamount at a water depth of 5,311 m. It is composed of light to dark gray silt and contains a few thin tephra and turbidite layers. A pumice fragment of 1.5 cm size was found at a core depth of 11.00 m. The 16.21 m long gravity core SO264-22-2 was recovered from a site near Soga Seamount north of Yomei Seamount at a water depth of 5,704 m. The sediment consists of light to medium gray and brownish silty ooze. A volcanic rock was found at 0.12 m depth and a tephra layer at 3.86–3.90 m depth; laminated layers were observed in core depths of 7.51–7.64, 8.21–8.25, 9.21–9.52 and 11.06–11.21 m, respectively. The 12.56 m long gravity core SO264-56-2 was taken on the base of Minnetonka Seamount at a bathyal to abyssal water depth of 3,973 m. The core’s uppermost 1.6 m consist of dark gray silt and pelagic ooze with intercalated sandy (turbidite) layers at 3.28–3.30, 3.84 m and tephra layers at 4.68–5.32 and 7.33–7.37 m. A sharp drop in radioactive Th230 concentration was discovered at ∼2.3 m depth in this core (Walter Geibert, pers. comm.) that implies a hiatus from 140 to 340 ka. This hiatus was not visually detected during initial core description.
Paleo- and Rock Magnetic Analyses
After shipboard logging of whole-round cores with a GEOTEK Multi-Sensor Core Logger (MSCL) (Höfken et al., 2018), all core segments were split into halves. Magnetic volume susceptibility κ was measured at the University of Bremen on archive halves in 1 cm increments using a Bartington MS2 susceptometer with a high-resolution MS2F (Ø 15 mm) spot sensor mounted to an automated logger. Temperature drift effects were eliminated by performing a void measurement in air after each sediment measurement.
All working halves were continuously subsampled with non-magnetic 6.2 cm3 plastic cubes, obtaining a sample spacing of ∼2.3 cm; solely core SO202-35-1 had been subsampled at a lower resolution of 5 cm. Natural Remanent Magnetization (NRM) of these 3,122 cube samples was measured with an automated 2G Enterprises model 755R cryogenic magnetometer system with integrated alternating field (AF) demagnetization unit at the paleo- and rock magnetic laboratory at the University of Bremen (Mullender et al., 2016). NRM was AF demagnetized in 16 steps, using a 3-axis demagnetization mode with peak fields of 5, 10, 15, 20, 25, 30, 35, 40, 45, 50, 60, 70, 80, 90, and 100 mT. An Anhysterestic Remanent Magnetization [ARM, reflecting the submicron magnetite concentration (Egli and Lowrie, 2002)] was then imparted in a 100 mT peak AF and 50 µT DC bias field to all samples. The ARM of the three SO264 cores was demagnetized in the same 16 steps as NRM while the ARM of the two SO202 cores had been previously demagnetized in 11 steps with peak fields of 5, 10, 15, 20, 25, 30, 35, 40, 45, 50, 100 mT.
ARM normalized by its DC bias field is termed anhysteretic susceptibility κARM. The κARM/κ ratio is a diagnostic value of magnetite particle or crystal size (King et al., 1983). The low-field volume susceptibility κ used as normalizer was measured with a Bartington MS3 susceptometer and a MS2B discrete sample sensor. Each sample was measured three times with intermitting void measurements, after which the net values were averaged. The proxy ratio Fe/κ (Funk et al., 2004; Korff et al., 2016; Shin et al., 2019) compares total iron to magnetite content, i.e. paramagnetic (or total) Fe to ferrimagnetic Fe species concentration. The Fe/κ ratio usually carries a subtle primary signature, reflecting sediment source rock petrology and provenance, and a usually more prominent secondary imprint, indicating zones of magnetic mineral diagenesis (depletion, formation, reduction, oxidation).
Following the remanence and susceptibility measurements, we selected five representative samples of core SO264-19-2 (dotted lines in Figure 2) for First-Order Reversal Curves (FORC) analyses (Pike et al., 1999; Roberts et al., 2000). About 25 mg of dried sediments were stabilized with glue and measured with a Princeton Measurement Corporation (PMC) Micromag M2900 alternating gradient force magnetometer following the protocol of Egli (2013). To process and plot FORC distribution data we used the VARIFORC method of Egli et al. (2013).
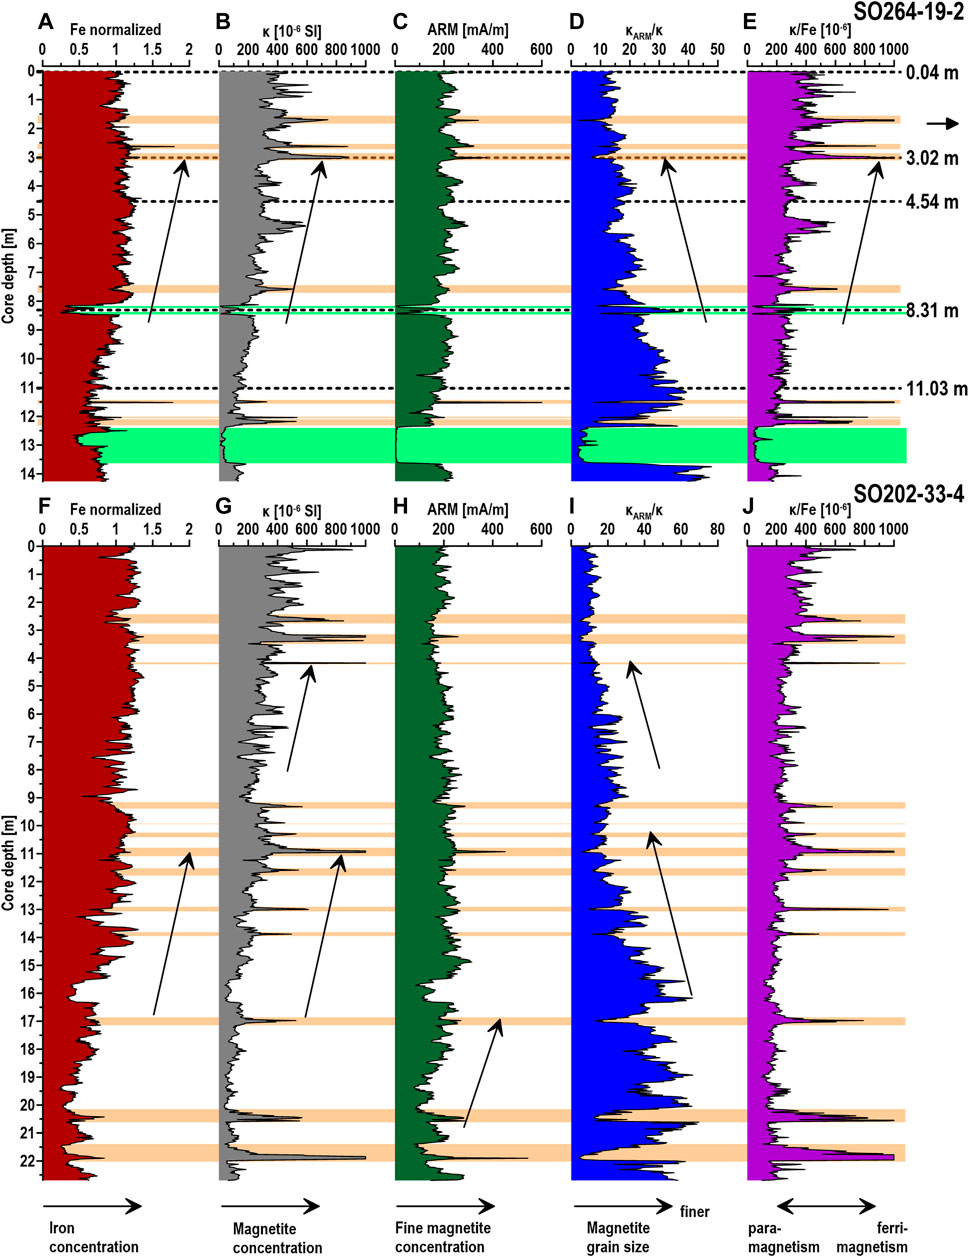
FIGURE 2. Down-core rock magnetic records of cores SO264-19–2 (top) and SO202-33–4 (bottom). Green horizontal bars: magnetite dissolution layers; orange bars: tephra or volcaniclastic layers (A,F): Relative Fe content derived from XRF core scans. (B,G): Discrete sample volume susceptibility (C,H): Anhysteretic remanent magnetization ARM. (D,I): Magnetogranulometric κARM/κ ratio. (E,J): Mineral magnetic κ/Fe ratio. Dashed horizontal lines mark positions of the five samples used for FORC and SEM/TEM analyses. Black arrows indicate prominent signal trends.
Scanning and Transmission Electron Microscopy
Magnetic separates for electron microscopic observation were extracted from suspended sediment by magnetic techniques (Hounslow and Maher, 1996). Prior to dispersion, the susceptibility of each selected sample was measured to quantify magnetic extraction efficiency. About 3 cm3 sediments were dispersed in demineralized water by high-power ultrasonic agitation. Sodium polyphosphate was added as a peptizing agent to keep clay mineral particles in suspension. This suspension was recirculated in a closed extraction system, where magnetic particles attach to a “magnetic finger” (von Dobeneck et al., 1987). The magnetic extracts collected during 24 h operation were repeatedly washed with demineralized water to remove attached clays.
The magnetic particle fraction of >1 µm was investigated with a ZEISS DSM 940A scanning electron microscope (SEM) with energy-dispersive X-ray spectroscopy (EDX) analyzer at the Faculty of Geoscience, University of Bremen, operated at 15 kV. A drop of suspended magnetic extract was placed on the SEM stub, dried and coated with a carbon layer to prevent surface charging during SEM observation. For transmission electron microscopy (TEM) of the submicron fraction, we used a Zeiss EM 900N TEM at the Electron and Light Microscopy Service Unit, Faculty of Mathematics and Natural Sciences, University of Oldenburg, operated at 80 kV. For TEM, magnetic extracts were agitated in an ultrasonic water bath for 2 min to separate magnetic particles, then a drop of this suspension was placed on a carbon coated TEM copper grid and dried in air.
X-Ray Fluorescence Spectrometry
High-resolution records of the major elements Fe, Ca, Ba, Ti and Al were obtained by X-ray fluorescence scanning with an Avaatech Series 4 XRF-core scanner at the Alfred Wegener Institute, Helmholtz Centre for Polar and Marine Research (AWI) Bremerhaven Marine Geology Laboratory. Prior to scanning, the topmost sediment layer on the core archive half was removed to create a fresh, flat surface. SPEXCerti Prep Ultralene® film was placed on the sediment surface, all XRF-scanning was carried out with 1 cm sample resolution, a 10 mm slit size and a current of 0.15 mA. Three consecutive runs were performed with tube voltages of 10, 30, and 50 kV, and with acquisition times of 10, 30 and 50 s, respectively. Raw data was processed using Canberra Eurisys’ iterative least squares software (WIN AXIL) package. Element concentrations are reported as area counts.
Results
Origin and Character of Magnetic Remanence Carriers
The reliability of paleomagnetic records critically depends upon the magnetic, chemical and mechanical (orientation) stability of the NRM carriers. This is even more relevant for RPI-studies (Tauxe, 1993) than for reversal magnetostratigraphy. Analyzing the sediment’s magnetic properties prior to interpreting paleomagnetic results is therefore an established and essential first step in magnetostratigraphic studies. Here we present exemplary rock magnetic analyses for two cores from different settings, ESC core SO264-19-2 (0–2.01 Ma) and Chinook Trough core SO202-33-4 (0–3.45 Ma). High-resolution rock magnetic property logs first identify the trends, events, cycles, and diagenetic alterations of the sedimentary magnetic mineral assemblages. FORC analyses and electron microscopy of five representative samples then reveal the specific nature and likely origin of magnetic particles that are thought to carry reversal and RPI information over extended periods.
Rock Magnetic Properties of Cores SO264-19-2 and SO202-33-4
Core logs of total iron (Fe), and, in rather simplified terms, of “total magnetite” (κ) and “fine magnetite” (ARM) content as well as diagnostic ratios for magnetic granulometry (κARM/κ) and mineralogy (κ/Fe) have been compiled in Figure 2. Both cores SO264-19-2 and SO202-33-4 show a gradual, but quite variable increase in iron (Figures 2A,F) and magnetite (Figures 2B,G) content upcore, where the latter is steeper as evidenced by the likewise positive trend of κ/Fe (Figures 2E,J). Fairly uniform ARM values with only small-scale cyclic patterns (Figures 2C,H) indicate either a stable production of biogenic magnetite or stable deposition of very fine detrital magnetite, as well as favorable geochemical preservation conditions for such fine particles. The prominent upward decrease of the κARM/κ ratio (Figures 2D,I) from initially 48, resp., 70 down to ∼12 (while κ rises by a factor of 3 or 5) implies an increasing mixture of coarser detrital magnetite to a fine single domain (SD) biogenic magnetite fraction. In absence of diluting biogenic carbonate, the eminent increase of Fe and κ implies lithological changes of the terrigenous fraction. As our cores cover the past 2.01 Myr, resp., 3.45 Myr (Table 1), this steady increase in magnetic mineral content was previously described by (Yamazaki and Ioka 1997; Zhang et al., 2020a, 2020b) and reflects the rising Asian dust export to the North Pacific during the Plio-Pleistocene cooling (e.g., Rea, 1994).
In core SO264-19-2, this compositional trend occurs mainly between 5 and 12 m core depth. A sharp drop in ferrimagnetic mineral content (Figures 2A–E, green bars) at core depths 8.17–8.24, 8.37–8.46 and 12.41–13.64 m, respectively, concerns especially, but not exclusively the fine magnetite fraction. Episodic losses of the biogenic SD magnetite along with abrupt magnetic coarsening are a typical signature of benthic magnetite dissolution under stagnant and oxygen-depleted bottom water conditions (Korff et al., 2016). At least seven positive spikes (Figures 2B–E, orange bars) in magnetite concentration paralleled by magnetic grain-size coarsening and increasing ferrimagnetism embody typical volcanic layers, either ashes (tephra) from the Pacific “Ring of Fire” or fine volcaniclastic turbidites originating from the ESC or other proximal seamounts. The Fe records also shows some cyclicity with a wavelength of ∼0.3 m in the lower core part (8.5–12.5 m), while κ and ARM records display some cyclicity with a wavelength of ∼1.2 m in the upper 0–6 m.
The rock magnetic κ, κARM/κ and κ/Fe records of core SO202-33-4 (Figures 2G,I,J), ramp up in two stages from 22–10 m and from 9–3 m core depth. In consideration of its 70% older base age and 10% lower sedimentation rate (SR) (Table 1), the upper section of SO202-33-4 (above ∼10 m core depth) corresponds (based on magnetostratigraphy) to the entire length of SO264-19-2. Core SO202-33-4 comprises a greater number of volcanic ash or volcaniclastic turbidite layers (orange bars in Figures 2F–I). We identify these here by characteristic, often upward graded peaks in κ, ARM and κ/Fe, accompanied by sharp minima in κARM/κ, that could be related to coarse multi-domain (MD) or ultrafine superparamagnetic (SP) magnetite, both of which have high susceptibility, but negligible magnetic remanence. Particularly prominent examples are two volcanic layers at 20.2–20.5 and 21.5–22.0 m, respectively. Core SO202-33-4 does not show any obvious signs of magnetite dissolution. However, this core exhibits diatom ooze layers at e.g., 15.5–16.5 and 19.1–19.5 m depth, which may indicate a shift of the subarctic front (Ren et al., 2014). These silica-rich layers dilute the Fe concentration without modifying κARM/κ and κ/Fe.
Five representative SO264-19-2 samples were selected for FORC analyses (Figure 3) and SEM/TEM investigations (Figure 4) from core depths of 0.04, 3.02, 4.54, 8.31 and 11.03 m, respectively (dotted lines in Figure 2). They represent different rock magnetic properties according to κ, κARM/κ (Figure 2) as well as physical properties (e.g., color reflectance) and core descriptions as provided in the cruise report (Nürnberg, 2018). The FORC diagrams in particular from lower core sections (Figures 3D,E) show dominant central ridge maxima (i.e. along the Hb = 0 axis) with little vertical spread, a maximum near Hc ≈ 25 mT and coercivity range up to Hc ≈ 80 mT, which is all typical of biogenic SD magnetite (Egli et al., 2010; Zhang et al., 2018; Li et al., 2020; Yamazaki et al., 2020). Samples from the upper section with lower κARM/κ and accordingly higher detrital magnetic mineral content (Figures 3A,C) display larger off-axis spread in softer coercivity ranges of Hc ≤ 40 mT and a magnetically soft, interacting MD-type component localized along the Hb axis at Hc ≤ 2 mT. The volcaniclastic sample from the susceptibility peak at 3.02 m depth (Figure 3B) lacks a dominant biogenic magnetite fingerprint and instead shows a wide double-sided triangular spread below Hc = 60 mT reflecting interacting magnetic vortex state (VS) particles such as small clustered ferrimagnetic inclusions within a glassy or silicate mineral matrix.
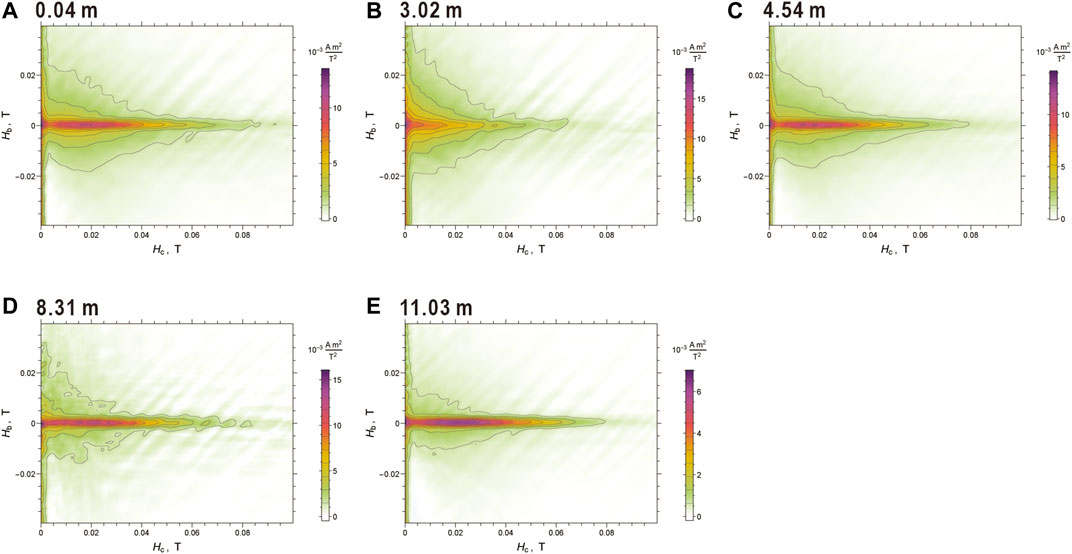
FIGURE 3. First-order reversal curve (FORC) diagrams of five samples (A–E) selected from lithologically distinct layers of core SO264-19–2 (dashed lines in Figure 2 top). The FORC diagrams in particular of lower core sections (D,E) show dominant central ridge maxima typical of biogenic SD magnetite (Egli et al., 2010). FORC diagrams (A,C) have a larger off-axis spread in the coercivity range of Hc ≤ 40 mT representing fine-grained detrital magnetite. Magnetically soft, internally interacting (volcaniclastic?) MD particles are localized parallel to the Hb axis. Ash layer (B) lacks a dominant central ridge maximum and instead shows a wide double-sided triangular spread below Hc = 60 mT reflecting interacting magnetic vortex state (VS) inclusions in a glassy matrix.
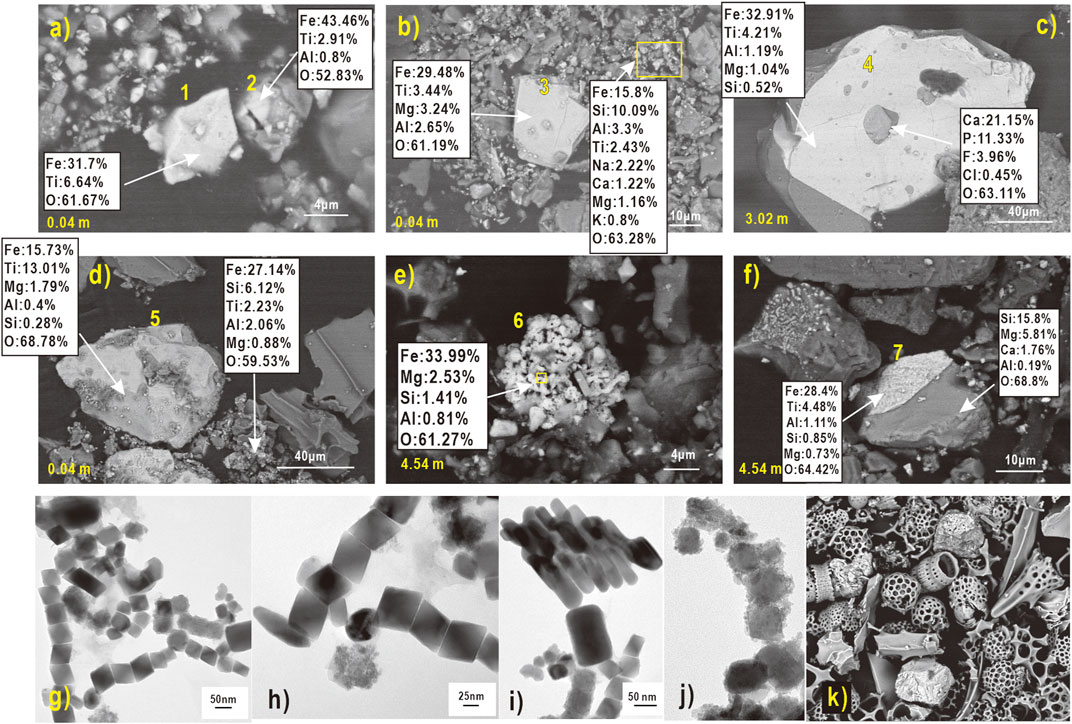
FIGURE 4. SEM and TEM micrographs of magnetic extracts from selected SO264-19-2 samples. Respective core depths (m) and particle numbers are shown in yellow (A–F): SEM images of large volcaniclastic Fe-Ti oxide minerals with EDX element concentrations [atomic%] (G–J): TEM images of chains and clusters of fossil bacterial magnetosomes of octahedral, prismatic and elongated shapes and various sizes. (K) SEM image of radiolarian skeletons and diatom frustules.
Scanning Electron Microscope and Transmission Electron Microscopy Analysis of Magnetic Extracts of Core SO264-19-2
About 2 g sediments of each of the above listed SO264-19-2 samples was suspended in water and cycled through the magnetic extraction apparatus. Extraction efficiencies of 25–65% of the bulk susceptibility were attained within 24 h extraction time, sufficient for a qualitative representation of the observed magnetic mineral assemblages (von Dobeneck et al., 1987; Hounslow and Maher, 1996). The larger (>1 µm) lithogenic magnetic mineral particles were resolved by SEM (Figures 4A–F) and geochemically analyzed with EDX, while submicron (1–300 nm) sized magnetite particles were visualized and identified by TEM (Figures 4G–J). SEM micrographs labels show EDX analyses in atomic%, which we translate here into equivalent mineral formulas.
Starting with SEM results, Figure 4A shows two isolated titanomagnetite grains of ∼6 μm size with compositions of Fe2.49Ti0.51O4 (particle 1) and Fe2.81Ti0.19O4 (particle 2), both typical of intraplate volcanism. Their sharp edges, bowed surfaces and irregular shapes are products of surficial low-temperature ocean floor oxidation (maghemitization) that splits larger titanomagnetite grains along curved shrinkage cracks (Petersen and Vali, 1987); particle 2 displays internal shrinkage cracks. The larger particle 3 (∼20 μm) of Figure 4B has morphological features similar to particles 1 and 2, but a more complex Fe spinel composition equivalent to Fe2.28Ti0.26Mg0.25Al0.2O4. Particles of this kind usually show no signs of eolian or fluvial transport such as rounded edges and are too large to be transported by wind. Their cation substitution (x = 0.2–0.6) points at magmatic source rocks ranging from tholeiitic basalt to trachyte, which is common for early or late-stage extrusive rocks in oceanic intraplate volcanism. Figure 4B also shows abundant micron-size iron-oxide crystals (lighter) attached to a larger (darker) silicate mineral. Some have an elongated or skeletal shape that is typical for magnetite crystallizing in rapidly chilled magmas. Particle 4 (Figure 4C) is from an identified volcaniclastic sediment layer and ∼150 μm large. With a composition similar to particle 3, it has inclusions of apatite [Ca5(PO4)3(F, Cl, OH)] and resembles a magmatic phenocryst. Magnetic particles of such size are far too large to be transported by wind or ocean bottom currents, leaving gravitational mass transport as most likely option. Indeed, some ‘sandy turbidites’ and larger pebbles up to 1.5 cm were occasionally described in the shipboard lithologs.
The similarly large size (∼80 μm) particle 5 in Figure 4D corresponds to a mineral composition of Fe1.1Ti0.9O3, i.e., a Ti-rich, probably ferrimagnetic hemoilmenite. The image also shows numerous clustered submicron magnetite particles with low Ti-content adhering to large glassy, fluted pumice shards. This sample is from near the core top and the fresh-looking pumice shards should originate from active island-arc volcanism. Particle 6 (Figure 4E) seems to consist of pure magnetite and represent a skeletal structure in a mostly dissolved, but still bonded silicate matrix. A similar particle without discernible silicate dissolution is on the left side of Figure 4F. The intergrown crystals of particle 7 at right consist of titanomagnetite protruding from a Mg-rich silicate mineral, demonstrating that titanomagnetite is more stable than the mafic rock matrix under low-temperature ocean-floor weathering condition. Most Fe-Ti oxide particles identified by SEM are larger than 15 μm and should have MD properties. They contribute little to NRM with their probably low net magnetizations, particularly not to a PDRM, where magnetic moment per volume matters for geomagnetic alignment. These large magmatic particles are outnumbered by smaller similar particles most of which are also of magmatic origin, but not necessarily from active volcanism. Siliceous radiolarian skeletons and diatom frustules are commonly found but are generally minor biogenic components of abyssal North Pacific sediments (Figure 4K).
Under the higher TEM magnification scale, biogenic magnetite particles, so-called magnetofossils (Petersen et al., 1986) were identified in each studied sample (Figures 4G–J). Notably, we observed fossilized bacterial magnetosomes that were still attached in primary chains of equally sized and shaped magnetite particles. More often, individual magnetofossils were reorganized as secondary chains or clusters of different magnetofossil morphologies with lengths of ∼40–200 nm. So-called “equant” octahedral magnetofossils were the most frequent variety (Figures 4G,H,J), while prismatic, elongated and carrot-shaped morphologies (Figures 4H,I) were less abundant. Magnetofossil chains were often attached to larger detrital magnetic particles and partly overcrusted with irregularly shaped nanoparticles (<5 nm, Figure 4J). According to TEM micrographs, magnetofossils outnumber detrital magnetite particles within the submicron SD size range.
Establishing and Refining Magnetostratigraphic Age Models
The magnetostratigraphic-RPI dating approach generally follows four steps: 1) establishment of an initial age model based on geomagnetic reversals, 2) selection of the optimal RPI normalization method, 3) refinement of the reversal age model by correlating the RPI logs to an astronomically tuned RPI reference record, and 4) corroboration of the RPI-based age model by orbital tuning of a cyclic proxy record, if available.
Reversal-Based Magnetostratigraphic Age Models
Vector end-point diagrams (Figure 5) depict the changing orientation and moment of the NRM vector in the course of stepwise AF demagnetization as projections onto orthogonal horizontal and vertical planes (Zijderveld, 1967). Nearly all samples, whether of normal or reverse polarity, display a simple, unidirectional NRM demagnetization behavior linearly decaying toward the origin of the vector plots. Reverse samples typically show a soft normal overprint, which is removed after the 20 mT AF step (Figures 5B,C,H). Samples with slightly noisier signals and incomplete demagnetization are usually located near reversal boundaries and therefore carry low and partially antiparallel NRM, sometimes at the limit of analytical detectability.
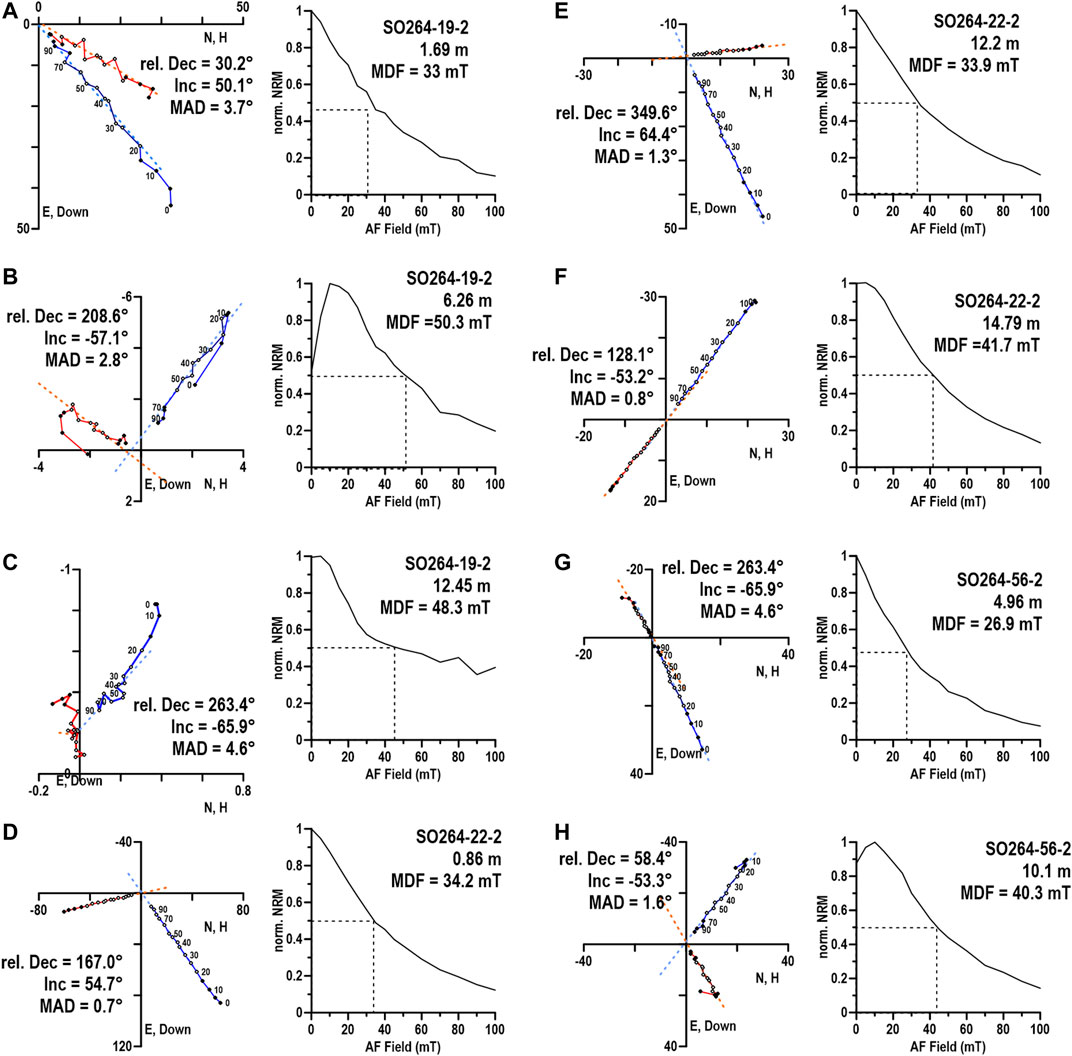
FIGURE 5. Vector end-point (or Zijderveld) plots exemplarily showing NRM AF demagnetization characteristics of discrete samples of cores SO264-19-2, 22-2, and 56-2. Diagrams show projections of the NRM vector into the horizontal (H) vs. vertical (Z, Down) component plane (Inc. = inclinations, in blue) and into the N vs. E component plane (Dec = declinations without azimuth correction, in red) during AF demagnetization. The AF demagnetization plots show the change in (mA/m; in black) during AF demagnetization; they were normalized to the highest and not the initial NRM values. This results in more realistic median destructive field (MDF) values (dotted lines). Samples in (A,D,E,G) have normal polarity; samples in (B,C,F,H) have reverse polarity.
Characteristic Remanent Magnetization (ChRM) was determined as best-fit line (BFL) by principal component analysis involving ten subsequent data points of the largely linear 30–100 mT demagnetization interval. For most samples the maximum angular deviation (MAD) for the ChRM direction is less than 8°. After the final 100 mT AF demagnetization step, most samples had less than 10% of their initial NRM. Sample 5c is from a dissolution layer in core SO264-19-2, where magnetite has been largely dissolved and residual antiferromagnetic minerals with higher geochemical resistivity and higher magnetic coercivity become dominant requiring higher AF demagnetization fields for demagnetization. Median destructive fields (MDF) vary between 30 and 50 mT, indicating that the magnetization carriers are relatively low- to medium-coercive ferrimagnets. ChRM inclinations comply with or are slightly lower than the local geocentric axial dipole inclination of 60.6° (core SO264-19-2), 62.5° (core SO264-22-2), and 65.6° (core SO264-56-2). The well-defined ChRM directions with low MAD values suggest that all cores are well suited for magnetostratigraphic purposes.
Reversal-based initial chronologies of the five sediment cores were established by assigning their generally well-defined ChRM polarities to the geomagnetic polarity timescale (GPTS 2020) by Ogg (2020) (Figure 6). ChRM inclinations and azimuth-corrected declinations were compiled with relevant concentration-dependent (NRM and ARM intensities), grain-size (κARM/κ) and mineral specific (κ/Fe) parameters. Vertical color bars highlight volcaniclastic layers (orange) and magnetite reduction zones (green). All our records include the Matuyama/Brunhes (M/B) boundary and the top of Jaramillo Subchron, providing a minimum of two reversal tie points for the “youngest” core SO264-56-2 (0–140, 340–1,050 ka; Figures 6A,C maximum of 15 tie points for the “oldest” core SO202-33-4 (0–3.45 Ma; Figure 6D) with mean SR ranging from 1.6 cm/kyr down to 0.7 cm/kyr.
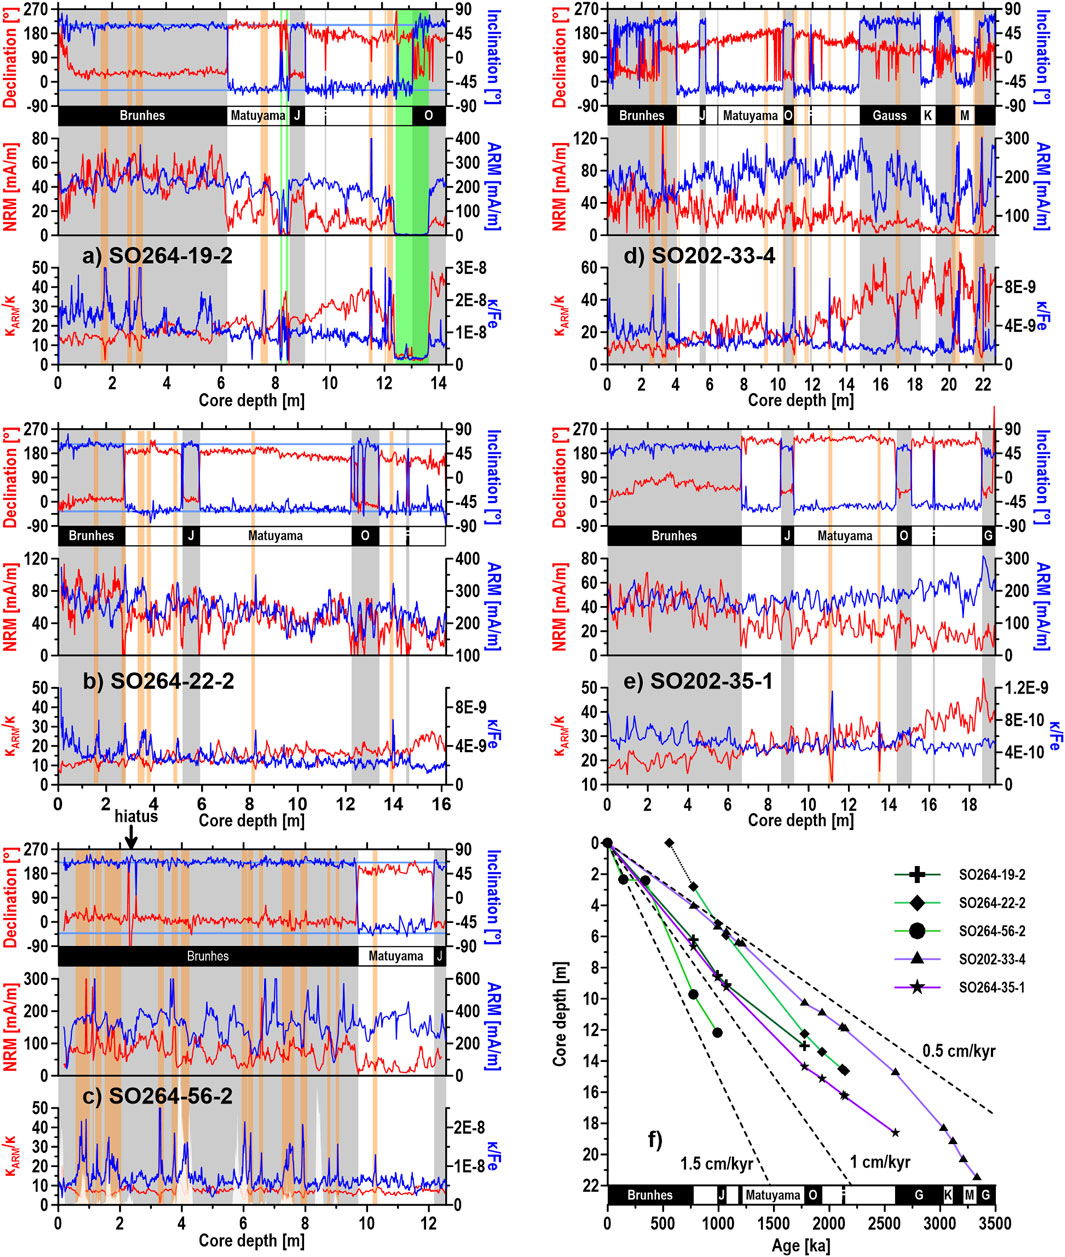
FIGURE 6. Magnetostratigrapic and rock magnetic records of cores (A) SO264-19-2, (B) SO264-22-2, (C) SO264-56-2, (D) SO202-33-4, and (E) SO202-35-1. In each plot, the azimuth-corrected declination and inclination, NRM and ARM intensity, and κARM/κ and κ/Fe are marked by red and blue lines, respectively. Green bands mark dissolution layers, orange bands volcaniclastic layers. White peaks in (C) are carbonate layers given as [Ca/Si]. the light blue lines in (A-C) are the local inclinations of a geocentric axial dipole. Magnetostratigraphic names and interpretations follow the Ogg (2020) GPTS 2020. Black/gray (white) bars represent normal (reverse) polarity zones. Magnetostratigraphic abbreviations: J—Jaramillo Subchron, CM—Cobb Mountain Subchron, O—Olduvai Subchron, F—Feni Subchron, K—Kaena Subchron, Mammoth Subchron, G—Gauss Chron. (F) Age-depth plots of all cores. Symbols represent geomagnetic reversals. The dotted line of core SO264-22-2 is a backward extrapolation from the following reversals. Dashed lines represent sedimentation rates.
The southernmost ESC core SO264-19-2 (Figure 6A) has a magnetostratigraphic record that ends just below the base of the Olduvai Subchron, i.e. at ∼2000 ka. A 180° declination twist, a noisy inclination, and a drop in NRM intensity at the core top indicate some coring-induced deformation, and no reliable RPI signal should be expected above 1 m core depth. A secondary normal overprint within reverse zones can be discerned at 8.17–8.24, 8.37–8.46 and 12.41–13.64 m depths, where NRM intensity and κARM/κ descend to a near zero level due to diagenesis (Figure 7C). The very prominent κ/Fe peaks of the volcaniclastic layers seem to just minimally influence NRM intensities and directions. NRM intensities below the M/B boundary are much lower in all studied cores as in many published records (Valet and Meynadier, 1993).
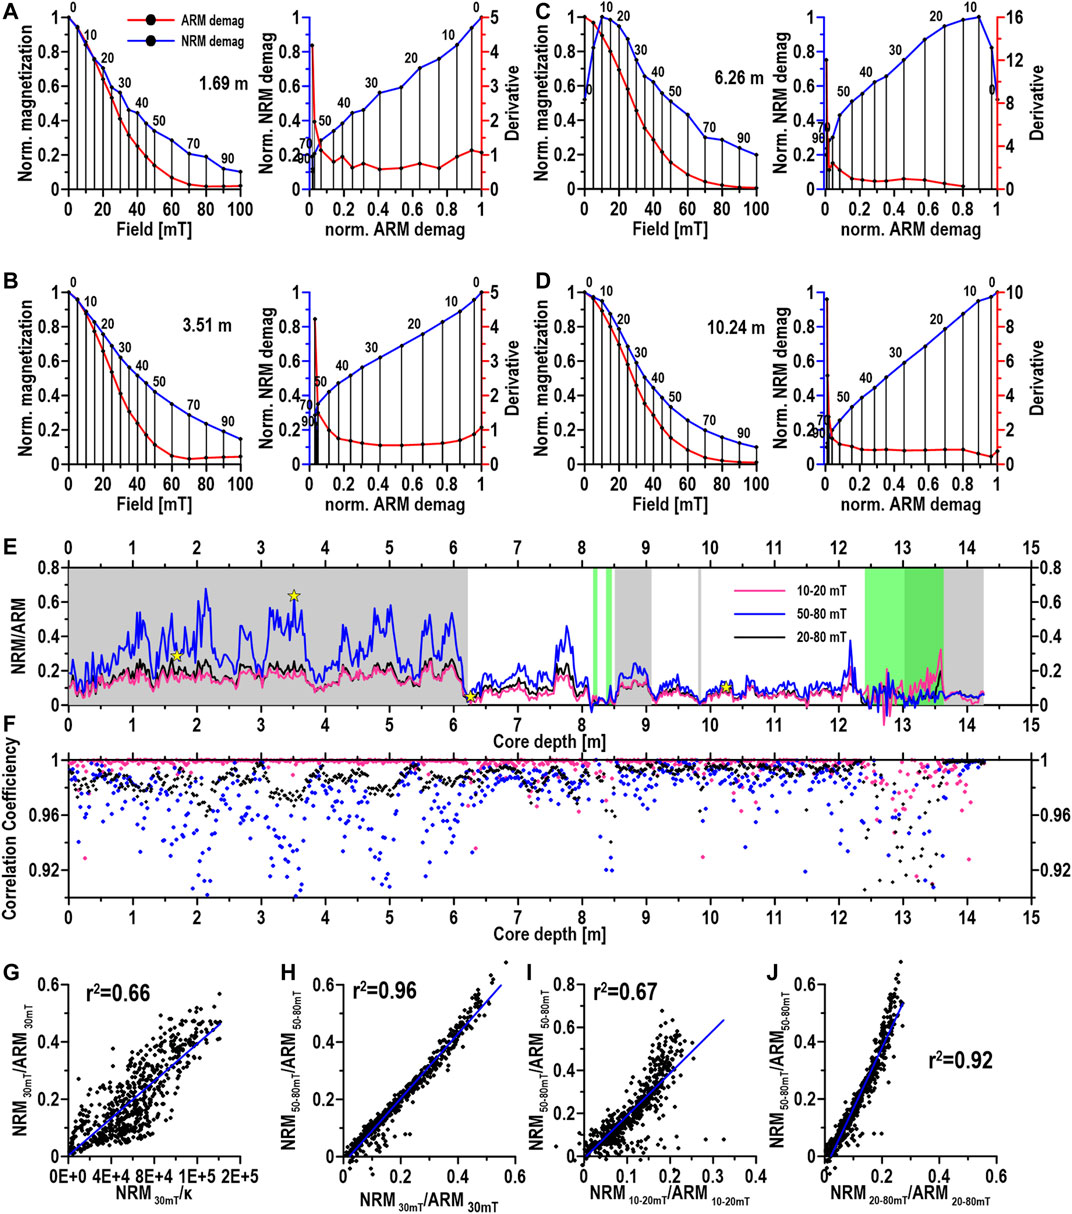
FIGURE 7. Analytical diagrams for the selection the most appropriate RPI normalization method: (A–D) Left panels illustrate normalized NRM (blue) and ARM (red) AF demagnetization curves for representative samples of core SO264-19-2 (marked by yellow stars in Panel 7E). Right panels show normalized NRM vs. normalized ARM AF demagnetization levels (in blue) and their derivatives (in red). (E) Relative paleointensity (RPI) records normalized in three different ways: NRM10–20mT/ARM10–20mT (pink), NRM50–80mT/ARM50–80mT (blue), NRM20–80mT/ARM20–80mT (black). (F) Corresponding linear correlation coefficients (r) marked by dots of the same color. (G–J) Biplots of RPI values calculated by different normalization methods with corresponding correlation coefficients r2 and linear regression curves (blue).
The very short Brunhes section of central ESC core SO264-22-2 (Figure 6B) points at an incomplete section, which could result from bottom current erosion, slope failure or non-deposition, while core top loss during coring is considered unlikely. There is no evidence of an internal hiatus in the section. The age for the core top was estimated to be 560 ka by backward extrapolating the age-depth relation of the M/B boundary and Jaramillo Subchron top. In consequence, this core reaches an age of 2.3 Ma, despite its higher mean sedimentation rate (1.0 vs. 0.7 cm/kyr, Table 1). This core probably also shows magnetite depletion due to changing redox condition caused by modified bottom water ventilation (Korff et al., 2016; Shin et al., 2018). Consequently, multiple normal overprints are recognized within the upper half of the section representing the Olduvai Subchron.
The northernmost ESC core SO264-56-2 (Figure 6C) differs insofar from all other studied cores, as its bathypelagic water depth (3,973 m) enabled a temporary accumulation of carbonate during interglacial CCD lows (note episodic Ca/Si spikes in Figure 6C). This intermittent calcareous input seems to have reduced NRM intensity and enhanced ARM intensity probably by increasing the ratio of biogenic to detrital magnetite. The previously mentioned hiatus from 140 to 340 ka coincides well with a large, highly localized deflection of the ChRM direction (arrow in Figure 6C). Numerous κ/Fe spikes associated with κARM/κ lows attest volcaniclastic layers at somewhat higher frequency of ∼1–2 per meter. The NRM signal also displays a higher “spikiness” (e.g., ∼1 and ∼6.5 m) which may compromise RPI patterns.
Core SO202-33-4 from Chinook Trough (Figure 6D) is our deepest record and only piston core. Its greater length of 22.7 m let it probe the oldest sediments (∼3.45 Ma) of this study, reaching beyond EPAPIS-3Ma (800–3,000 ka; Yamazaki and Oda, 2005). The Gauss/Matuyama boundary (2,595 ka) at a depth of 14.77 m marks the revised base of the Pleistocene Epoch (Head, 2019). Further downcore, the Late Pliocene reverse Kaena (3,032–3,116 ka, 18.33–19.20 m) and Mammoth (3.207–3.330 Ma, 20.36–21.49 m) subchrons are confined by inclination data. The ChRM directions of this core show larger inclination scatter and some twisted declinations. It is also uncommon to find sedimentation rates increasing toward the base of the core (Figure 6F). These issues may be caused by a rotation of the core in the liner and an expansion of the sediment column resulting from the piston-coring technique. Despite these potential drawbacks, the inclination record even resolves the brief normal Cobb Mountain Subchron (1,180–1,215 ka) and Feni Subchron (formerly Reunion, 2,116–2,140 ka; Singer, 2014). Given a mean sedimentation rate of 0.7 cm/kyr, the durations of these subchrons (∼25–35 kyr) correspond to a depth interval of ∼20 cm, which, according to Bleil and von Dobeneck (1999), defines an upper limit for the PDRM lock-in half-depth d½. This half-depth d½ also specifies the theoretical vertical depth offset of a paleomagnetic reversal record from the past sediment-water interface at the time of the paleofield reversal. The resulting stratigraphic age discrepancy between paleomagnetic and paleoclimatic datings of deep Pacific sediment cores has been investigated by e.g., Suganuma et al. (2011); following their findings, the sediment ages assigned by reversal and RPI matching should be 20–30 kyr too young. Without the authigenic 10Be/9Be isotope method (Simon et al., 2018) or availability of an independent stable isotope age model (Tauxe et al., 1996), it is not possible to estimate the lock-in depth and age offset any better.
Gravity core SO202-35-1 from Emperor Trough (Figure 6E) reaches the G/M boundary just above the core base at 18.63 m. As water depth and sedimentological settings of this core do not differ much from core SO202-33-4, the gentler gravity coring method is probably responsible for better paleomagnetic quality. Inclinations and declinations reverse in perfect synchrony and the Feni Subchron is very well reproduced at a core depth of 16.18 m. The opposite trends of NRM and ARM intensity are somewhat counter-intuitive and will be discussed in Chapter 5.1.
Displaying all five reversal age models in Figure 6F raises confidence in the obtained chronologies: age-depth relations are appreciably linear and the resulting sedimentation rates correspond well with previous findings from this area (Yamazaki and Kanamatsu, 2007). The continuous cube sampling provided a detailed reproduction of the established geomagnetic polarity time scale. Two shorter Matuyama subchrons but no Brunhes excursions (Channell et al., 2020) could be resolved.
Selecting the Appropriate Relative Paleointensity Normalization Method
An important criterion qualifying sediments for RPI research is a sufficiently high uniformity and stability of the magnetic carriers (Tauxe, 1993) and of the surrounding sediment matrix (Franke et al., 2004). All studied cores, particularly SO264-19-2, SO202-33-4 and SO202-35-1, show large scale magnetic source-area and grain-size changes (Figure 2; Yamazaki and Ioka, 1995) at the longer term and also considerable compositional short-scale variability by frequent volcaniclastic sedimentation events and less frequent localized reductive magnetite depletion conditions. Such changing magnetic mineral assemblages are adverse for RPI calibration, but may still allow reconstructing and matching characteristic RPI patterns for chronostratigraphic purposes.
Over the past decades, numerous RPI normalization methods have been proposed: Traditionally RPI has been estimated by normalizing NRM intensity with a single concentration-dependent rock magnetic parameter such as ARM, IRM or κ, generally after light AF demagnetization (20–30 mT) eliminating viscous or technically acquired soft magnetization components (Constable and Tauxe, 1987). Tauxe et al. (1995) proposed a pseudo-Thellier approach, where NRM is plotted against ARM as both are sequentially demagnetized at the same AF field steps (Figures 7A–D). The RPI value is determined as the best-fit slope to a quasi-linear curve section. This method allows to avoid bias by viscous or chemical overprint and to identify and consider coercivity windows of different magnetic carriers. Chen et al. (2017) presented an end-member analysis based on NRM and IRM demagnetization and proposed separate coercivity windows for NRM carried by detrital components (10–20 mT) and biogenic magnetite (50–80 mT). Other studies (Franke et al., 2004; Hofmann and Fabian, 2007) went further to include additional normalizers for non-magnetic sedimentary factors controlling the initial mobility and later fixation of magnetic carriers in the pore space of the sediment matrix.
Given our large sample numbers, magnetic measurements had to be automated and time-consuming sedimentological analyses excluded. The availability of stepwise (5–100 mT) AF demagnetization data of NRM and ARM acquired in a 100 mT AF field, besides single sample susceptibility κ, let us opt between a simple normalization with ARM or κ, or a slope approach within a fixed or individually adapted coercivity window. As NRM and ARM did not vary as strongly with sediment lithology as magnetic susceptibility (Figure 2), κ was considered unsuitable as normalizer. The cross-plot between RPI estimates obtained by normalizing NRM30mT with ARM30mT and κ, respectively, (Figure 7G), shows low correlation and high scatter, which is thought to result from the integral character of magnetic susceptibility and the impact of para- and diamagnetism as well as of SP and MD ferrimagnetism, all of which are rather irrelevant for PDRM.
Figures 7A–D compare normalized NRM and ARM AF demagnetization data of four characteristic SO264-19-2 samples (shown in Figure 7E) as normalized demagnetization curves and pseudo-Thellier plots. One can easily note that some NRM carriers have an intermediate to high coercivity as the residual NRM after 100 mT AF demagnetization is still in the order of 10–25% of the initial NRM. While this higher coercive fraction is not relevant to detect the proper paleofield polarity, it would have been methodologically advantageous to use a higher peak alternating field of 200 or 300 mT for ARM acquisition to include magnetic carrier particles in this coercivity range.
The pseudo-Thellier curves and their derivatives (Figures 7A–D, in red) show that the relative demagnetization losses of NRM and ARM have a relatively linear relation (ΔNRM/ΔARM ≈1) for AF steps between 20 and 50 mT. Beyond ∼60 mT AF level, the coercivity spectra of NRM and ARM deviate progressively and the ΔNRM/ΔARM derivative rises steeply to values of 5 or 10. The extent to which this increasing misfit and resulting nonlinearity is taken into the coercivity window of the RPI normalization method, has large control over the final curve shape (Figure 7E).
Following the method of Chen et al. (2017), their “detrital” 10–20 mT coercivity range would create a RPI curve with low amplitude dynamics and zero or even negative values in reverse sections with soft normal overprint, hence some “reverse polarity” bias. By contrast, their “biogenic” 50–80 mT coercivity window produces a RPI curve with high amplitude dynamics that seems to reflect higher-coercive volcanic or detrital particles [e.g., SD (titano)maghemite, hemoilmenite] rather than biogenic magnetite. This coercivity window is therefore susceptible to “petrological” bias. The outlier data in Figure 7I illustrate that such biases within the coercivity windows proposed by Chen et al. (2017) are bound to generate partly abnormal RPI values for the studied cores. The data qualities can be compared by the linear correlation coefficients r (Figure 7F) of the fitted data points (Channell et al., 2013).
In comparison, a simple NRM30mT/ARM30mT normalization and a “biogenic” NRM50–80mT/ARM50–80mT normalization (Figure 7H) provide very similar results in relative as well as in absolute terms. With the intention to include detrital and biogenic carriers likewise and to exclude viscous carriers as well as to keep the procedure simple and robust against the above described biases, we opted for a broad and constant NRM20–80mT/ARM20–80mT (Figures 7E,J) slope range to normalize the three SO264 cores. Cores SO202-33-4 and SO202-35-1 were normalized as NRM20–40mT/ARM20–40mT and NRM25–45mT/ARM25–45mT, respectively, due to different former ARM demagnetization protocols.
Relative Paleointensity-Based Age Model Refinement
We created a Pacific target RPI curve by splicing the RPI record of core KR0310-PC1 (0–780 ka; Yamazaki and Kanamatsu, 2007) from Hess Rise (Figure 1) to the equatorial Pacific EPAPIS-3 Ma RPI stack (800–3,000 ka; Yamazaki and Oda, 2005). The KR0310-PC1 RPI record had been dated by tying its S-ratio record (Bloemendal et al., 1992), here used as a hematite-based Asian dust proxy record, to the global δ18O stack LR04 (Lisecki and Raymo, 2005). The six RPI records stacked in EPAPIS-3 Ma had been dated by matching their ARM records to LR04. Because of orbital tuning uncertainties and delayed lock-in, reversal ages and RPI minima of EPAPIS-3 Ma deviate noticeably from the reversal ages of the formerly used CK95 (Cande and Kent, 1995) and recent GPTS 2020 (Ogg, 2020). To avoid conflicting RPI and reversal-based ages for our records, we tied all reversal minima of EPAPIS-3 Ma to the respective GPTS2020 reversal ages and readjusted the enclosed EPAPIS-3 Ma sections with a piecewise linear age-age transfer function (Figure 8).
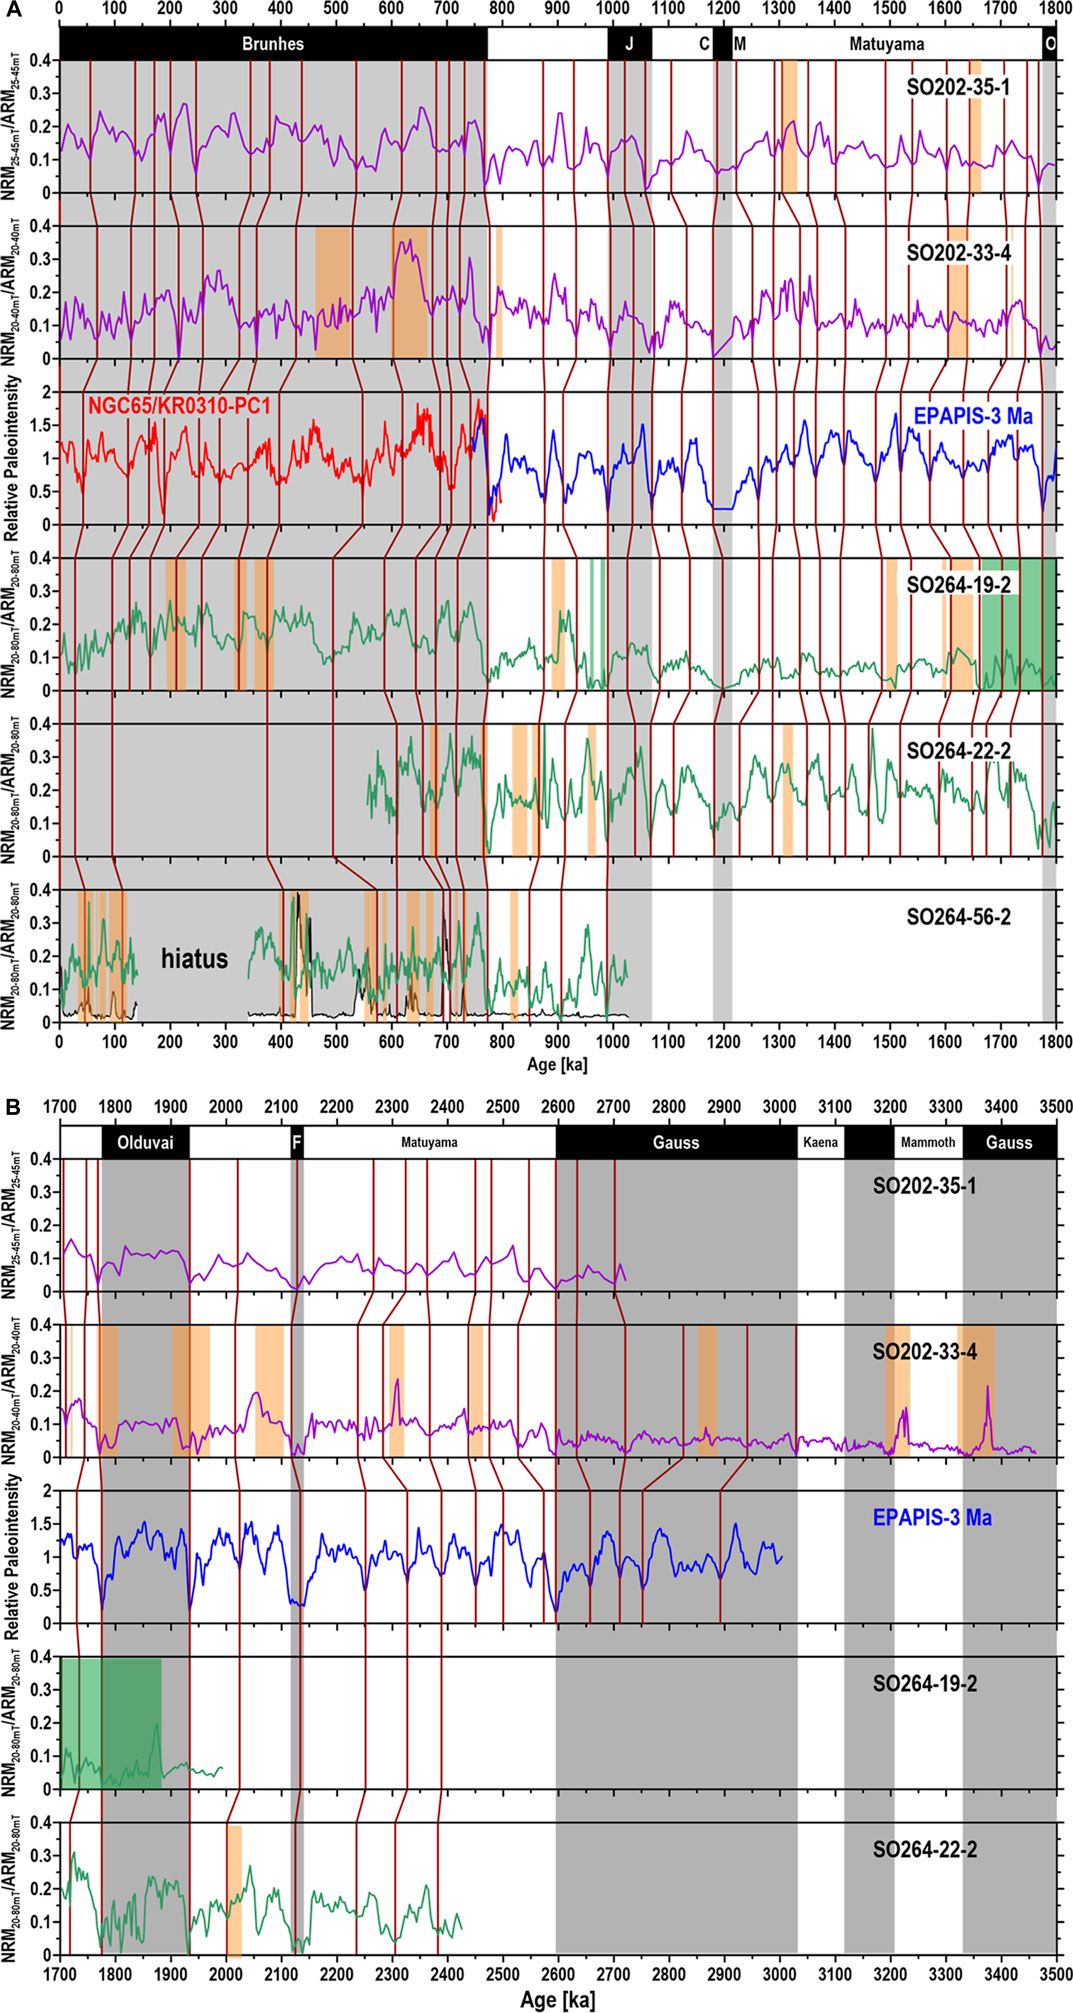
FIGURE 8. RPI records of two SO202 cores (purple) and three SO264 (green) cores plotted against reversal-based age for the period 0–1,800 ka. Also shown is the RPI target record NGC65/KR0310-PC1 (red curve, Hess Rise, 0–780 ka, Yamazaki and Kanamatsu, 2007) and EPAPIS-3Ma stack (blue curve, East Pacific, 773–3,000 ka, Yamazaki and Oda, 2005) adjusted to GPTS 2020 (Ogg, 2020). Tie lines between our RPI records and the target RPI records are shown in brown. Orange and green bands mark volcaniclastic and diagenetic layers, respectively. Black/gray (white) bars at the top of the panel indicate normal (reverse) polarity zones. White peaks with black outline in SO264-56-2 are carbonate layers. Magnetostratigraphic abbreviations: J—Jaramillo Subchron, CM—Cobb Mountain Subchron, O—Olduvai Subchron, F—Feni Subchron (1,700–3,500 ka).
The correlations of our RPI records to this target curve are shown in Figure 8. Potential signal shifts at volcaniclastic layers and diagenetic zones are highlighted by orange and green vertical bars. Starting from geomagnetic reversals and well recognizable RPI patterns, we successively inserted tie lines from prominent minima of the RPI target record to the corresponding features of our RPI records in approximate ∼50 kyr intervals. By keeping always one eye on the pattern matching and the other on the resulting sedimentation rates, we tried to avoid spurious sedimentation rate jumps between tie points. For most parts of the records, the correlations appear trustworthy. There are a few tie-line placements in disturbed upper and damped lower sections that may be somewhat less evident, but they agree well with the sedimentation rates while discarding them does little change to the final age models. We decided not to engage into automated signal pattern correlation methods such as dynamic time warping (e.g., Channell et al., 2008) in order to avoid opening another complex and controversial topic in this article, but consider this as an interesting future option.
Due to larger sample spacing (5 cm) and lower mean sedimentation rate (0.6 cm/kyr), the RPI record of SO202-35-1 appears smoother than the other RPI records. Aided by pattern comparison with the higher resolved RPI record of core SO202-33-4, the level of detail is still sufficient to match and tie it to the target record. More concerning is the decline in amplitude and feature characteristics of the older sections (1,800–3,500 ka). The signal deterioration is even greater for core SO264-19-2 (Figure 8B) and concerns its complete pre-Brunhes section. The RPI record of core SO264-22-2 shows amplitudes and signal characteristics that are more consistent, while SO264-56-2 RPI record suffers from the sediment disturbance (hiatus) in its upper part and more complex and dissimilar RPI patterns in its lower part, possibly related to the intercalated carbonate layers (Figure 6C, white shaded peaks).
The Brunhes sections of SO202-35-1 and SO202-33-4 can be matched to the KR0310-PC1 record with a total of 13 tie points. The top of core SO264-19-2 is too disturbed to be confidently correlated, but RPI patterns agree before ∼300 ka. The estimated age of ∼550 ka (Reversal-Based Magnetostratigraphic Age Models) for the top of core SO264-22-2 also agrees well with its RPI pattern match. The RPI of SO264-56-2 shows high-frequency variability and the eight chosen tie points with the target record are partly tentative at this point due to a lack of distinctive low-frequency patterns.
The Matuyama Chron with its well-defined normal subchrons provides sufficient magnetostratigraphic tie points to constrain the RPI pattern matches, which are generally in good agreement. SO202-35-1, SO202-33-4 and SO264-22-2 RPI records fit well to the target curves while SO264-19-2 shows some inconsistencies or compressed sections.
The stratigraphic revision of the Cobb Mountain (CM) subchron of formerly 10 kyr duration (1,201–1,211 ka in CK95) to now 37 kyr length (1,178–1,215 ka; Channell, 2017; Ogg, 2020) is not well represented by EPAPIS-3 Ma, which shows no double intensity minimum as to be usually expected for the beginning and termination of subchrons. The age adjustment from CK95 to GPTS2020 results in a considerable stretching of the EPAPIS-3 Ma target at this point resulting in very low temporary sedimentation rates (Figure 9). All standard RPI stacks (e.g., SINT-2000, PISO-1500) have just one broad paleointensity minimum over the CM subchron. Solving this issue adequately is impossible from our data, as it may partly result from non-dipolar field components (Channell, 2017). We therefore simply centered our RPI minima with the center of the new CM chronology (Figure 8).
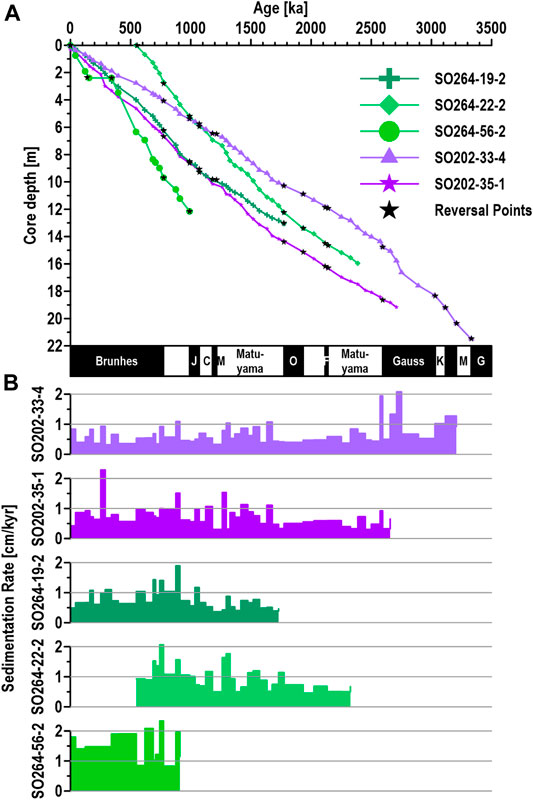
FIGURE 9. (A) Finalized age-depth models and (B) linear sedimentation rates after RPI correlation. Black stars represent reversal-based tie-points. Black (white) bars at the bottom of the panel indicate normal (reverse) polarity zones. Magnetostratigraphic abbreviations are explained in the caption of Figure 6.
For the Gauss Chron, low RPI intensity and variability of SO202-33-4 make it hard to ascertain the RPI patterns correspondence with the well-structured EPAPIS-3Ma. The 3,000–3,450 ka section of SO202-33-4 extends beyond EPAPIS-3Ma. Its RPI record features two peaks associated with volcaniclastic layers, but no significant paleointensity variations. The age model is well constrained by the top and base ages of the Kaena and Mammoth subchrons. The final age models gained from RPI pattern matching are shown in Figure 9. They are not far from those obtained from simple reversal magnetostratigraphy since sedimentation rates remain relatively constant in each core. This gives us confidence in our age models despite the mentioned uncertainties in the dating process.
Discussion
Impact of Magnetization Carrier Lithology on the Relative Paleointensity Signal
As shown by early rock magnetic studies of the abyssal North Pacific (Vali et al., 1987; Yamazaki and Ioka, 1997), magnetofossils are omnipresent and abundant in pelagic sediments, and, by virtue of their SD domain state and magnetic stability, efficient NRM carriers. The benthic production of biogenic magnetite appears to be rather uniform, quite in contrast with the very dynamic deposition of eruptive or redeposited volcaniclastic materials. Magmatic titanomagnetite particles, ranging from coarse phenocrysts to fine silicate-embedded magnetite inclusions, may not be efficient PDRM carriers and bear a risk of creating bias in RPI normalization by their undefined magnetic properties and fluctuating presence. While biogenic and volcanogenic magnetic mineral accumulation is not subject to long-term trends, the eolian influx of fine dust particles from Inner Asia increases significantly through the Plio-Pleistocene and progressively controls the rock and paleomagnetic characteristics of abyssal North Pacific sediments, as Yamazaki and Ioka (1997) first showed. The increase of κ relative to Fe signalizes a shift from more paramagnetic to more ferrimagnetic minerals (Figure 2), which may imply a growing impact of physical (cold, arid, magnetite-preserving) Late Pleistocene weathering regimes relative to a more chemical (warm, humid, magnetite-oxidizing) pedogenesis in the Early Pleistocene. Similar changes are known from Chinese loess records (e.g., Heslop et al., 2000; Zhang et al., 2020a, 2020b).
To analyze the impact of magnetic grain size and composition variations and sediment lithology on the RPI records, we first compared κARM/κ distribution of all cores (Figure 10A) and then RPI vs. κARM/κ scatter plots for each individual core (Figures 10B–F), distinguishing volcaniclastic and diagenetic layers as well as normal and reverse sections. As Figure 10A shows, the range of magnetic grain sizes varies largely between cores. The easternmost core SO202-33-4 displays the widest range of magnetic grain sizes from fine to coarse, which actually represents a temporal trend (Figure 2, Figure 10B) rather than sediment heterogeneity, resulting from increasing detrital magnetite (eolian dust) input since the Mid-Pleistocene. The cross plots in Figures 10B–F reveal remarkable differences in terms of magnetic grain-size variation and its impact on RPI. The low and rather constant κARM/κ ratios of cores SO264-56-2 (∼5–10) and SO264-22-2 (∼10–25) reflect greater proximity to the ESC resulting in higher volcaniclastic input from nearby seamount flanks. This proximal input is evidenced by the high frequency and greater thickness of volcaniclastic layers and the microscopically observed coarseness of magnetic particles (Figures 4A–F). Given that the ECS seamounts have been volcanically inactive for over 40 Myr, such phases of volcaniclastic deposition and massive erosion (both cores have a large hiatus within the Brunhes Chron) could be contouritic or tubiditic, driven either by deep-water currents along the ESC (Figure 1) or by downslope turbidity currents triggered by local seamount slope failures. As the impact seemed stronger during the Brunhes Chron, we prefer the first explanation that provides a paleoceanographic link to a possible Mid- to Late Pleistocene intensification of bottom current intensity. Neither contouritic nor turbiditic sedimentation is desirable for RPI records as sediment rates and grain sizes could vary at short scales, adding randomness to the RPI pattern.
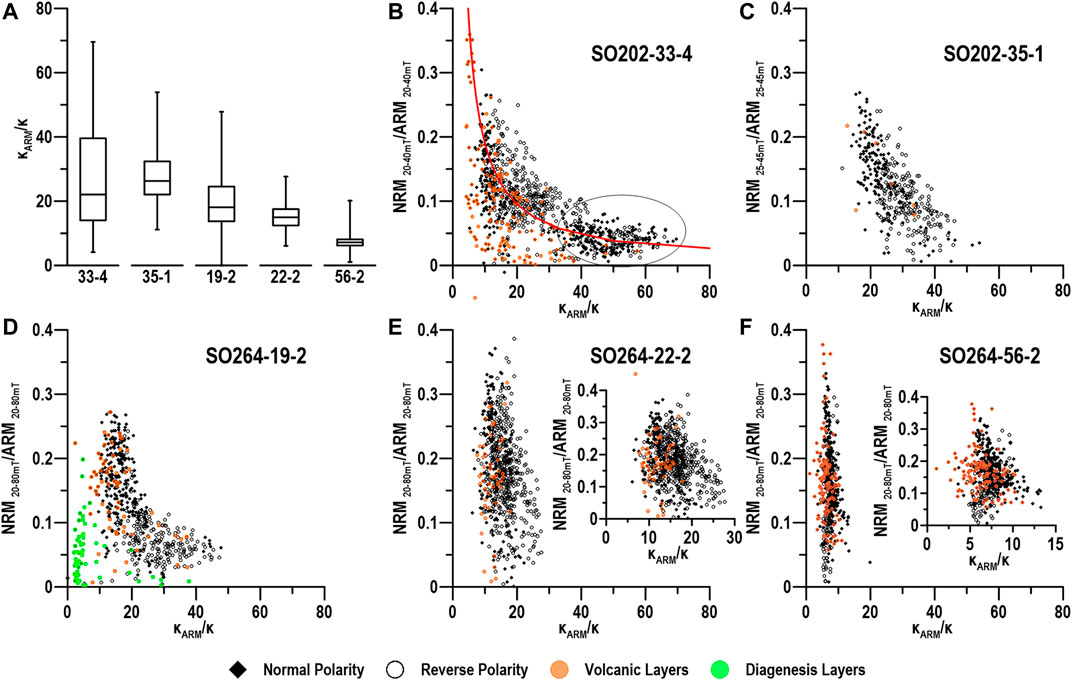
FIGURE 10. (A) Box-and-whisker plots of κARM/κ records (B–F) RPI vs. κARM/κ biplots for cores (B) SO202-33-4, (C) SO202-35-1, (D) SO264-19-2, (E) SO264-22-2, and (F) SO264-56-2. Solid (open) symbols depict intervals of normal (reverse) magnetic polarity. Orange and green symbols represent data points from volcaniclastic and diagenesis layers, respectively. Small plots with extended x-axes have been inserted in (E) and (F).
A larger range of the magnetogranulometric κARM/κ values is observed (Figures 10B–D) for the older complete cores SO202-33-4 (10–70), SO202-35-1 (15–50) and SO264-19-2 (10–50 without diagenesis), which are similar to the values of Yamazaki and Ioka (1997). We interpret these large magnetic grain size variations as increased admixing of coarser detrital (titano-)magnetite to a constant benthic production of biogenic magnetite (Franke et al., 2007). Older sections of the RPI record with their finer (biogenic) magnetic particle sizes have consistently lower values. The RPI vs. κARM/κ biplots of these three cores data follow hyperbolic trends (e.g., red line in Figure 10B), i.e., RPI decreases downwards, together with the fining of magnetic grain size (Figure 2, Figure 6, Figure 10B). We tentatively use this inverse relation to rescale the SO202-33-4 RPI record (dotted line of SO202-33-4 in Figure 11A) by adjusting the NRM/ARM level by multiplication with κARM/κ. This is not regarded as a general method, but visibly enhances the patterns in the lower part of the RPI record.
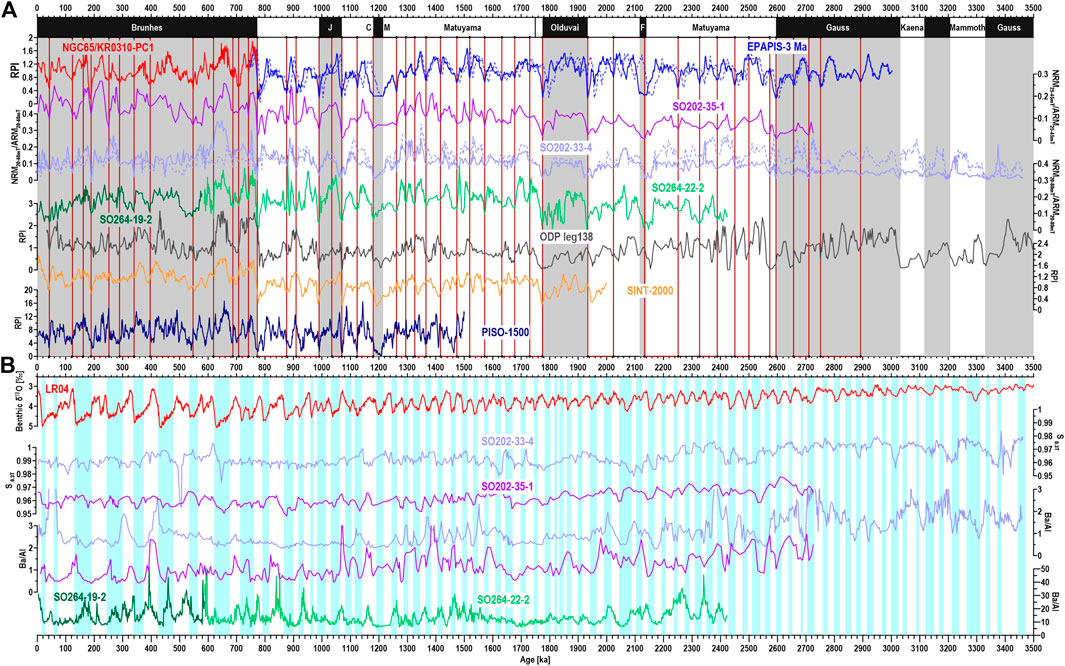
FIGURE 11. (A) Tuned RPI records of cores SO202-35-1 (dark purple), SO202-33-2 (light purple), SO264-19-2 (0–580 ka, dark green), SO264-22-2 (580–1,800 ka, light green), target core NGC65/KR0310-PC1 (0–780 ka, red; Yamazaki and Kanamatsu, 2007), EPAPIS-3Ma stack (773–3,000 ka; dotted blue line: original record, solid blue line: after adjustment to GPTS 2020; Yamazaki and Oda, 2005), ODP leg 138 sites 848, 851, 852 (grey line; Valet and Meynadier, 1995), SINT-2000 (deep and light orange lines Guyodo and Valet, 1999; Valet et al., 2005), PISO-1500 (dark blue line; Channell et al., 2009) for the age period 0–1,800 ka. Black (white) bars at the top indicate normal (reverse) polarity (sub)chrons. Magnetostratigraphic abbreviations: J—Jaramillo Subchron, CM—Cobb Mountain Subchron, G—Gauss Chron. (B) LR04 stack (red curve; Lisiecki and Raymo, 2005), S0.3T records of cores SO202-33-4 (light purple) and SO202-35-1 (dark purple), Ba/Al records of cores SO264-19-2 (dark green) and SO202-22-2 (light green). Glacial MIS stages are marked in light blue (1,700-3,500 ka).
Such age-dependent decrease of RPI amplitudes is not seen in the EPAPIS-3 Ma stack (Figure 8). Yamazaki and Oda (2005) related long-term RPI trends rather to changes in accumulation rates, which are not found in our records (Figure 9). For South China Sea RPI records, Ouyang et al. (2014) reported biogenic particles to be 2–4 times more efficient PDRM carriers than detrital components. Chang et al. (2016) argued that small particles could better overcome the hydrodynamic forces than larger particles and would therefore be more reliable paleomagnetic recorders. Chen et al. (2016) also found that the biogenic SD component of east Equatorial Pacific sediment carried 2–4 times higher NRM/ARM than a detrital component consisting mainly of SD sized magnetic inclusions in silicate crystals. However, different PDRM acquisition efficiencies of biogenic and detrital components seemed not to have important consequences as both carrier types recorded the same signal with overall coherent patterns.
The higher RPI efficiencies of biogenic SD magnetite suggested by previous studies contrast our findings for which various explanations are discussed in the following: 1) viscous remagnetization, 2) different magnetic carriers efficiencies, 3) reductive dissolution, or 4) oxidation of fine magnetite particles.
Viscous normal overprinting of reverse sections is observed in Zijderveld plots (e.g., Figure 7B), but could not have been the leading cause for the lower NRM/ARM in older sections, since the normal Gauss record section of SO202-33-4 has even lower RPI values than the reverse Matuyama section above (Figure 8) and the soft 0–20 mT AF demagnetization track sections were omitted from RPI.
A possible mineralogical explanation could lie in differences of the detrital magnetic carriers in the studied areas. Magnetite nanoparticle inclusions in silicates (Chen et al., 2016) should indeed be less suitable carriers in terms of PDRM theory, while similarly large isolated detrital magnetite particles in the vortex state (former PSD) size spectrum could be more efficient remanence carriers than twisted chains or interacting clusters of magnetofossils, in particular, if their NRM would in parts be a Depositional Remanent Magnetization (DRM) (Valet et al., 2017). At the studied central North Pacific mid-latitude sites, the influx of long-range wind-transported ultra-fine continental dust is bound to carry only very fine weathering-resistant magnetite and maghemite particles. Likewise fine, proximally sourced magmatic titanomaghemite particles from weathering rocky outcrops at seamount flanks, dispersed and sorted by bottom or turbidity currents, would also be accumulated as individual particles and should likewise make good DRM or PDRM carriers. Figures 10B,D,E, show that the data points of isolated volcaniclastic layers often have lower κARM/κ values and a wider RPI range. They can record magnetic paleointensity, but with greatly varying efficiency. The two large RPI peaks near the bottom of core SO202-33-4 actually have their origin in such volcaniclastic layers.
Cyclic magnetite dissolution by glacial oxygen depletion and carbon trapping as described by Korff et al. (2016) and Shin et al. (2018) for the abyssal NW Pacific can reduce RPI, but was only detected in core SO264-19-2, which features one broad and two fine magnetite dissolution layers (Figure 3, Figure 8). In the RPI vs. κARM/κ biplot (Figure 10D), these samples form an isolated cluster of strongly reduced RPI and very low (2–8) κARM/κ values. This underlines the finding by Korff et al. (2016) that magnetite-depletion entails severe PDRM loss and dramatically deteriorates RPI patterns. The phenomenon of glacial benthic anoxia and related magnetite depletion seems to be rare at the ESC and absent further east, at least in the latitudinal range covered by the here studied sediment cores. From the SO264 magnetic susceptibility logs (Nürnberg, 2018), we expect that this situation should be different in the subarctic North Pacific (north of 50°N).
From our viewpoint, the most convincing explanation for long term NRM loss in abyssal sediments can be found in early paleomagnetic work in the North and South Pacific by Opdyke and Foster (1970), Kent and Lowrie (1974), Prince et al. (1980) and Yamazaki and Katsura (1990). These authors believed that the unstable magnetic behavior of the Pliocene abyssal sediments of the cores was related to the presence of highly oxidized fine-grained magnetite, which we would now consider as biogenic. Their reasoning for increasing magnetic instability with oxidation (i.e. maghemitization) state is a shift of the superparamagnetic (SP) threshold of stable SD particles from 30 nm for magnetite (Dunlop, 1973) up to 120 nm for stoichiometric maghemite (Readman and O’Reilly, 1972). As biogenic magnetite particles mostly fall into that size range and become fully oxidized when being exposed to oxic bottom and pore water conditions over long periods (Chang et al., 2013), the NRM and thus RPI loss may be best explained by oxidation-related unblocking of fine biogenic magnetite particles. A marked loss of ARM during the Gauss Chron (Figure 6D) without decrease in κ/Fe evidences magnetite oxidation rather than magnetite reduction. Possibly this destabilization only concerns the numerous small octahedral magnetofossils, while less abundant larger, e.g., prismatic magnetofossils (Figure 4) may still preserve a stable SD state. Yamazaki and Katsura (1990) proposed, that the “unstable-to-stable transition” after late Pliocene resulted from less oxidizing benthic conditions in the Pleistocene.
Relative Paleointensity-Enhanced Magnetostratigraphy Versus Cyclostratigraphy
We next compare our new abyssal RPI records to previously published RPI target stacks and records and also briefly test cyclostratigraphic alternatives using existing paleoclimate proxy records of our cores (Figure 11A, Figure 11B). In order to keep this graphic compilation manageable in size, we spliced the incomplete RPI records of SO264-19-2 and -22-2 together and only show the RPI records of SO202-35-1 and -33-4 in full length. The depicted RPI target records are EPAPIS-3Ma, SINT-2000, PISO-1500 and ODP Leg 138 (Figure 11, for references see Table 1). From these published RPI records, only the EPAPIS-3Ma ages have been modified to the GPTS2020 timescale (from dotted to solid lines). It appears that the other RPI stacks are largely synchronous with GPTS 2020, probably due to their δ18O tuned chronologies.
In the Mid- to Late Pleistocene Brunhes Chron, the RPI patterns of our cores agree generally well with all target records. Some major intensity minima linked to Brunhes excursions at ∼41 ka (Laschamp) and ∼188 ka (Iceland Basin; Channell et al., 2020) are prominent in our RPI records. Characteristic peaks at ∼350–400 ka and ∼600–700 ka also exist in all records. The early Brunhes “West Eifel Suite” (530–730 ka) of 5–6 geomagnetic excursions (Böhnel et al., 1987; Singer, 2014; Channel et al., 2020) is at least partly reflected in large and well recognizable RPI amplitudes.
There is a lag between the original EPAPIS-3Ma record and the PISO-1500 and SINT-2000, which may be due to a delayed response of the carbonate system to changes in continental ice volume and sea level resulting in carbonate concentration variations lagging benthic δ18O (Hodell et al., 2001). This is one of the reasons, why we adjusted EPAPIS-3Ma to GPTS2020 in the Early Pleistocene Matuyama Chron. Our linear approach for this may have resulted in some over-corrections as the ∼20 kyr offset of a large RPI peak at ∼880–940 ka relative to other reference RPI records suggests. The Jaramillo Subchron RPI pattern lacks some detail, but still matches the target record very well. Interestingly, the previously observed long “CM single RPI intensity minimum” can also be recognized in the PISO-1500, SINT-2000, and ODP leg 138 records, where single, very broad and low RPI minima instead of two sharp framing minima are observed. The stretched minima agree well with the length of the revised CM duration. The few cosmogenic records also agree that geomagnetic intensity low persists for ca. 20 kyr (Carcaillet et al., 2004; Simon et al., 2018). For the Olduvai Subchron, our RPI patterns are not as detailed as in EPAPIS-3Ma; SO264-22-2 is actually more similar to SINT-2000. For the beginning of the Matuyama Chron, we are left just with the Pacific RPI targets where some uncertainties in the pattern matching are obvious.
The Late Pliocene Gauss Chron was best covered by core SO202-33-4, but lower RPI amplitudes make the match with EPAPIS-3Ma more challenging. The κARM/κ adjusted RPI record of SO202-33-4 (dotted line in Figure 11A) shows more prominent variations, which are quite consistent with EPAPIS-3Ma. As the reliability of this RPI correction method has not been elaborated and validated, we leave these two options for comparison, but not for correlation.
In Figure 11B, we present available high-resolution paleoclimate proxy records (S-0.3T and Ba/Al) for our cores, scaled to their RPI age models. North Pacific glacial-interglacial dust flux cycles are often well reflected in relative hematite variations depicted by the rock magnetic S-0.3T ratio (e.g., Yamazaki and Ioka, 1997). With their larger distance from Asia, the S-ratio records of our cores vary just minimally between 0.95 and 0.98. These small changes may also mirror other processes than dust flux, e.g., diagenesis (Korff et al., 2016; Shin et al., 2018). Any attempt to correlate one of our rock magnetic records to a climate stack like LR04 is risky and definitely far less promising than RPI matching, at least for most parts of these rock magnetic records. On the other hand, RPI matching also avoids the circular problem of using climatic constrains to discuss climatological changes.
In the North Pacific, Ba/Ti or Ba/Al records are indicative of changes in paleo-export production changes and deep water ventilation. These records have been used as correlation targets where lower values in these ratios reflect glacial periods (Jaccard et al., 2010; Serno et al., 2014). Korff et al. (2016) correlated the SO202-39-3 Ba/Ti record to the astronomically tuned Ba/Al record of ODP 882 to solve the diagenesis-related RPI uncertainties in the upper core section. Shin et al. (2018) compared the Ba/Ti and Ba/Al records of various Shatsky Rise cores and found out that their minima in MIS 10, 8 and 6 were synchronous. Among all various inspected element ratios of our cores, Ba/Al records also had the most characteristic, in some parts even recognizably cyclic features (Figure 11). Without further detailed cyclostratigraphic analysis, common cyclic patterns are recognizable in some parts of the Ba/Al records of the herein studied cores, e.g., from ∼1,050 to 1,650 ka. However, in other sections, e.g., from ∼500 to 1,000 ka and ∼1,700 to 3,500 ka, the Ba/Al records have little in common, although certain cyclic and singular features do exist, e.g., the 2.73 Ma break (Bailey et al., 2011) in core SO202-33-4. It is also worth mentioning that we observe typical relative age offsets in the order of ∼20–40 kyr, which may be related to the complex regional Ba/Al signal formation and preservation processes (Serno et al., 2014) or to the RPI age model itself. This situation hinders the construction of a high-resolution cyclostratigraphic network using Ba/Al records, and thus prevents to perform an independent test of our RPI-based age models as initially intended.
Conclusion
This study set out to test the applicability of RPI pattern matching as a means to improve temporal resolution in the magnetostratigraphic dating of North Pacific abyssal sediments. All but very few presently published RPI records and stacks are from bathy- or hemipelagic sediments and bear biogenic or cyclic fractions that permit orbital tuning. To render marine sediments “RPI-suitable,” certain conditions should be met (Tauxe, 1993): in particular homogeneity of the magnetic carriers, absence of chemical alteration, and constant and appreciably high sedimentation rates. These golden “Tauxe rules” are largely breached in the deep North Pacific; the worst violation is probably the non-steady mixing of eolian, volcanic and biogenic magnetic carrier fractions over shorter and longer timescales. Magnetite reduction, ash, pumice, turbidite and contourite layers can and do occur. Sedimentation rates are very low (<1 cm/kyr) and hiatuses are not uncommon.
The major minima and more basic patterns of our five new RPI records could nevertheless be quite convincingly matched to EPAPIS-3Ma and other RPI stacks. Observed signal discrepancies resulted from 1) pattern compression due to low sedimentation rates and lock-in zone effects, 2) varying volcaniclastic admixtures that increased or reduced RPI intensities depending on origin and grain size, 3) episodic magnetite dissolution, and 4) a large shift from highly oxidized magnetofossil-dominated carriers in the Late Pliocene sections to an increasingly detrital, dust- and possibly also nepheloid-current controlled magnetic carrier assemblage throughout Pleistocene times.
Large long-term shifts in standard rock magnetic parameters (κ, κARM/κ, Fe, κ/Fe) document the enhancement of eolian dust input during Plio-Pleistocene cooling since 3.5 Ma (Snoeckx and Ingram, 1992). The benthic bacterial magnetite production was best quantified by ARM, FORCs, and TEM imaging and turned out to be largely stable over this period; it was episodically lowered by some dissolution or dilution effects. Volcanic event layers — ashes and volcaniclastic turbidites or contourites — appeared as sharp peaks in κ/Fe. Low κARM/κ and high κ values were also indicative of this third and very relevant carrier fraction, which may also be part of a steady background sedimentation dispersed by nepheloid transport. Magnetite depletion layers were only occasionally found in core SO264-19-2; the bathypelagic core SO264-56-2 featured intercalated interglacial carbonate layers. Proximal titanomagnetite sources were indicated by large (∼100 μm) partly oxidized titanomagnetite fragments originating from the ESC that should not be relevant as magnetization carriers, but make good indicators of sediment origin and transport.
For RPI normalization, we used a pseudo-Thellier slope method and analyzed coercivity windows proposed by Chen et al. (2017), who argued that NRM10–20mT/ARM10–20mT should correspond to a detrital and NRM50–80mT/ARM50–80mT to a biogenic coercivity window. NRM was generally not fully demagnetized after a 100 mT peak field and turned out to be magnetically harder than the routinely applied ARM100mT. The ΔNRM/ΔARM slope therefore rises sharply after 60 mT demagnetization where harder magnetic carriers are present. In sections of reverse magnetic polarity, ΔNRM/ΔARM goes negative below 20 mT AF due to normal viscous overprinting. We chose optimized slope sections including stable detrital as well as biogenic PDRM carriers. NRM20–80mT/ARM20–80mT was applied to three SO264 cores and NRM20–40mT/ARM20–40mT resp. NRM25–45mT/ARM25–45mT to two SO202 cores. For future studies, we recommend imprinting ARM in AF fields higher than 100 mT, if possible up to 200 or 300 mT.
A general finding for all longer records was a systematic RPI amplitude decline with depth and/or age. A significant inverse relation of RPI and κARM/κ suggest, that long term geomagnetic recording stability of biogenic magnetite is inferior to that of the eolian and volcanic magnetization carriers in our study area. This observation can be best explained by high-grade oxidation of biogenic magnetite in deeper Pliocene strata. We show exemplarily, that weak RPI patterns in magnetofossil-dominated sections may be partly recovered by applying a κARM/κ-based correction factor.
Our RPI-based refinements of reversal magnetostratigraphies turned out to be more feasible than cyclostratigraphic tuning of the paleoceanographic proxies S-0.3T or Ba/Al. For abyssal North Pacific sediments without severe magnetic mineral dissolution, our RPI-tuned age models appear to reach an approximate precision of ∼20–40 kyr within the Plio-Pleistocene. From our viewpoint, this seems to be the best available, and besides, a largely climate-independent dating option for abyssal North Pacific sediments.
Data Availability Statement
The datasets presented in this study can be found in online repositories. All data in this study can be downloaded in Pangaea data publisher (www.pangaea.de).
Author Contributions
WW did the measurements of the SO264 cores, produced all figures, interpreted the data and wrote the manuscript together with TvD. The manuscript was revised and extended by all other co-authors and finalized by WW, YZ, and TvD. TEM microscopy was realized in cooperation and with support by MW. TF did the shipboard and lab measurements of the SO202 cores. LL-J provided and calibrated the SO264 XRF core scans. YZ provided interpretation support for magnetostratigraphy. DN and RT wrote the SO264 proposal, collected the sediment cores with LL-J, and devised the RPI dating concept together with TvD and TF.
Funding
WW gratefully acknowledges her promotion scholarship from the China Scholarship Council (CSC) under CSC Grant No. 201804910416. Expedition and laboratory costs were financed by the German Federal Ministry for Education and Research (BMBF) through the projects “Innovative North Pacific Experiment INOPEX” (PI Rainer Gersonde, Grant No. 03G202A, AWI) and TvD (MARUM, Grant No. 03G0202B), “SONNE-EMPEROR” (Grant No. 03G0264A, GEOMAR and 03G0264B, AWI), and “The North Pacific in Warming Climates NOPAWAC“ (AWI, Grant No. 03F0785A), as well by AWI institutional funds of the research programmes “PACES-II” and “Changing Earth – Sustaining Our Future”.
Conflict of Interest
The authors declare that the research was conducted in the absence of any commercial or financial relationships that could be construed as a potential conflict of interest.
Publisher’s Note
All claims expressed in this article are solely those of the authors and do not necessarily represent those of their affiliated organizations, or those of the publisher, the editors and the reviewers. Any product that may be evaluated in this article, or claim that may be made by its manufacturer, is not guaranteed or endorsed by the publisher.
Acknowledgments
WW gratefully acknowledges financial support by the China Scholarship Council (No. 201804910416). The authors would like to thank Weng-si Chao, Lara Jacobi, and Ovie Miracle Benson for XRF measurements, Lucia Korff for sampling and measuring the two SO202 cores, and Raquel Para González for helping with magnetic extraction, hysteresis and electron microscopy. We greatly appreciated the help of Liane Brück for core sampling and lab support, software support and help in data management by Janna Just and Heike Piero. Adrian Höfken and Liane Brück performed the shipboard core logging on R/V SONNE cruise SO264. We likewise thank the captains and crews of expeditions SO202 and SO264 for their great support at sea. Very detailed and constructive reviews by QS and JP greatly improved our manuscript and were highly appreciated.
References
Bailey, I., Liu, Q., Swann, G. E., Jiang, Z., Sun, Y., Zhao, X., et al. (2011). Iron Fertilisation and Biogeochemical Cycles in the Sub-arctic Northwest Pacific during the Late Pliocene Intensification of Northern Hemisphere Glaciation. Earth Planet. Sci. Lett. 307 (3–4), 253–265. doi:10.1016/j.epsl.2011.05.029
Barnes, S. S., and Dymond, J. R. (1967). Rates of Accumulation of Ferro-Manganese Nodules. Nature 213 (5082), 1218–1219. doi:10.1038/2131218a0
Blank, M., Leinen, M., and Prospero, J. M. (1985). Major Asian Aeolian Inputs Indicated by the Mineralogy of Aerosols and Sediments in the Western North Pacific. Nature 314 (6006), 84–86. doi:10.1038/314084a0
Bleil, U., and von Dobeneck, T. (1999). “Geomagnetic Events and Relative Paleointensity Records - Clues to High-Resolution Paleomagnetic Chronostratigraphies of Late Quaternary Marine Sediments?),”. in Use of Proxies in Paleoceanography (Berlin, Heidelberg: Springer), 635–654. doi:10.1007/978-3-642-58646-0_26
Bloemendal, J., King, J. W., Hall, F. R., and Doh, S.-J. (1992). Rock Magnetism of Late Neogene and Pleistocene Deep-Sea Sediments: Relationship to Sediment Source, Diagenetic Processes, and Sediment Lithology. J. Geophys. Res. 97 (B4), 4361–4375. doi:10.1029/91JB03068
Böhnel, H., Reisman, N., Jäger, G., Haverkamp, U., Negendank, J. F. W., and Schminke, H. U. (1987). Paleomagnetic Investigation of Quaternary West Eifel Volcanics (Germany): Indication for Increased Volcanic Activity during Geomagnetic Excursion/event? J. Geophys. 62, 50–61.
Bryan, S. E., Cook, A. G., Evans, J. P., Hebden, K., Hurrey, L., Colls, P., et al. (2012). Rapid, Long-Distance Dispersal by Pumice Rafting. PLoS ONE 7 (7), e40583. doi:10.1371/journal.pone.0040583
Cande, S. C., and Kent, D. V. (1995). Revised Calibration of the Geomagnetic Polarity Timescale for the Late Cretaceous and Cenozoic. J. Geophys. Res. 100 (B4), 6093–6095. doi:10.1029/94JB03098
Carcaillet, J., Bourlès, D. L., Thouveny, N., and Arnold, M. (2004). A High Resolution Authigenic 10Be/9Be Record of Geomagnetic Moment Variations over the Last 300 Ka from Sedimentary Cores of the Portuguese Margin. Earth Planet. Sci. Lett. 219 (3–4), 397–412. doi:10.1016/S0012-821X(03)00702-7
Chang, L., Roberts, A. P., Heslop, D., Hayashida, A., Li, J., Zhao, X., et al. (2016). Widespread Occurrence of Silicate-Hosted Magnetic mineral Inclusions in marine Sediments and Their Contribution to Paleomagnetic Recording. J. Geophys. Res. Solid Earth 121 (12), 8415–8431. doi:10.1002/2016JB013109
Chang, L., Winklhofer, M., Roberts, A. P., Heslop, D., Florindo, F., Dekkers, M. J., et al. (2013). Low-temperature Magnetic Properties of Pelagic Carbonates: Oxidation of Biogenic Magnetite and Identification of Magnetosome Chains. J. Geophys. Res. Solid Earth 118 (12), 6049–6065. doi:10.1002/2013JB010381
Channell, J. E. T. (2017). Cobb Mountain Subchron Recorded at IODP Site U1306 (Eirik Drift, off SE Greenland). Geophys. J. Int. 209 (3), 1389–1397. doi:10.1002/2016JB01361610.1093/gji/ggx098
Channell, J. E. T., Hodell, D. A., Margari, V., Skinner, L. C., Tzedakis, P. C., and Kesler, M. S. (2013). Biogenic Magnetite, Detrital Hematite, and Relative Paleointensity in Quaternary Sediments from the Southwest Iberian Margin. Earth Planet. Sci. Lett. 376, 99–109. doi:10.1016/j.epsl.2013.06.026
Channell, J. E. T., Hodell, D. A., Xuan, C., Mazaud, A., and Stoner, J. S. (2008). Age Calibrated Relative Paleointensity for the Last 1.5 Myr at IODP Site U1308 (North Atlantic). Earth Planet. Sci. Lett. 274 (1–2), 59–71. doi:10.1016/j.epsl.2008.07.005
Channell, J. E. T., Singer, B. S., and Jicha, B. R. (2020). Timing of Quaternary Geomagnetic Reversals and Excursions in Volcanic and Sedimentary Archives. Quat. Sci. Rev. 228, 106114. doi:10.1016/j.quascirev.2019.106114
Channell, J. E. T., Xuan, C., and Hodell, D. A. (2009). Stacking Paleointensity and Oxygen Isotope Data for the Last 1.5 Myr (PISO-1500). Earth Planet. Sci. Lett. 283 (1–4), 14–23. doi:10.1016/j.epsl.2009.03.012
Chen, L., Heslop, D., Roberts, A. P., Chang, L., Zhao, X., McGregor, H. V., et al. (2017). Remanence Acquisition Efficiency in Biogenic and Detrital Magnetite and Recording of Geomagnetic Paleointensity. Geochem. Geophys. Geosyst. 18 (4), 1435–1450. doi:10.1002/2016GC006753
Constable, C. G., and Tauxe, L. (1987). Palaeointensity in the Pelagic Realm: marine Sediment Data Compared with Archaeomagnetic and lake Sediment Records. Geophys. J. Int. 90 (1), 43–59. doi:10.1111/j.1365-246X.1987.tb00674.x
Constable, C., and Johnson, C. (2005). A Paleomagnetic Power Spectrum. Phys. Earth Planet. Interiors 153 (1-3), 61–73. doi:10.1016/j.pepi.2005.03.015
Corliss, B. H., and Hollister, C. D. (1979). Cenozoic Sedimentation in the central North Pacific. Nature 282, 707–709. doi:10.1038/282707a0
Derkachev, A. N., Gorbarenko, S. A., Ponomareva, V. V., Portnyagin, M. V., Malakhova, G. I., and Liu, Y. (2020). Middle to Late Pleistocene Record of Explosive Volcanic Eruptions in marine Sediments Offshore Kamchatka (Meiji Rise, NW Pacific). J. Quat. Sci. 35 (1-2), 362–379. doi:10.1002/jqs.3175
Dickens, G. R., and Owen, R. M. (1995). Chinook Trough Rifting and Hydrothermal Deposition at Sites 885 and 886, in Editors D. K. Rea, I. A. Basov, D. W. Scholl, and J. F. Allan. Proceedings of the Ocean Drilling Program: Scientific Proc. ODP, Sci. Results, 145: (College Station: Ocean Drilling Program), 413–426. doi:10.2973/odp.proc.sr.145.128.1995
Dunlop, D. J. (1973). Superparamagnetic and Single-Domain Threshold Sizes in Magnetite. J. Geophys. Res. 78 (11), 1780–1793. doi:10.1029/JB078i011p01780
Egli, R., Chen, A. P., Winklhofer, M., Kodama, K. P., and Horng, C.-S. (2010). Detection of Noninteracting Single Domain Particles Using First-Order Reversal Curve Diagrams. Geochem. Geophys. Geosyst. 11, a–n. doi:10.1029/2009GC002916
Egli, R., and Lowrie, W. (2002). Anhysteretic Remanent Magnetization of fine Magnetic Particles. J. Geophys. Res. Solid Earth 107 (B10), EPM-2. doi:10.1029/2001JB000671
Egli, R. (2013). VARIFORC: An Optimized Protocol for Calculating Non-regular First-Order Reversal Curve (FORC) Diagrams. Glob. Planet. Change 110, 302–320. doi:10.1016/j.gloplacha.2013.08.003
Erickson, A. J.. (1970). The Measurement and Interpretation of Heat Flow in the Mediterranean and Black Seas (Doctoral Dissertation, Massachusetts Institute of Technology).Thesis (Ph. D.)--Massachusetts Institute of Technology, Dept. of Earth and Planetary Sciences, 1970. http://hdl.handle.net/1721.1/15419 doi:10.2172/4114120
Frank, M., Schwarz, B., Baumann, S., Kubik, P. W., Suter, M., and Mangini, A. (1997). A 200 Kyr Record of Cosmogenic Radionuclide Production Rate and Geomagnetic Field Intensity from 10Be in Globally Stacked Deep-Sea Sediments. Earth Planet. Sci. Lett. 149 (1–4), 121–129. doi:10.1016/S0012-821X(97)00070-8
Franke, C., Hofmann, D., and von Dobeneck, T. (2004). Does Lithology Influence Relative Paleointensity Records? A Statistical Analysis on South Atlantic Pelagic Sediments. Phys. Earth Planet. Interiors 147 (2-3), 285–296. doi:10.1016/j.pepi.2004.07.004
Franke, C., von Dobeneck, T., Drury, M., Meeldijk, J., and Dekkers, M. (2007). Magnetic Petrology of Equatorial Atlantic Sediments: Electron Microscopy Results and Their Implications for Environmental Magnetic Interpretation. Paleoceanography 22, PA4207. doi:10.1029/2007PA001442
Funk, J., von Dobeneck, T., and Reitz, A. (2004). Integrated Rock Magnetic and Geochemical Quantification of Redoxomorphic Iron Mineral Diagenesis in Late Quaternary Sediments from the Equatorial Atlantic. in The South Atlantic in the Late Quaternary: Reconstruction of Material Budgets and Current Systems. Editors G. Wefer, S. Mulitza, and Ratmeyer. (Germany: Springer-Verlag), 237–260.
Gersonde, R. (2012). The Expedition of the Research Vessel-Sonne” to the Subpolar North Pacific and the Bering Sea in 2009 (SO202-INOPEX). Berichte zur Polar-und Meeresforschung= Rep. polar Mar. Res. 643, 323.
Harris, P. T., Macmillan-Lawler, M., Rupp, J., and Baker, E. K. (2014). Geomorphology of the Oceans. Mar. Geology. 352, 4–24. doi:10.1016/j.margeo.2014.01.011
Hatfield, R. G., Stoner, J. S., Solada, K. E., Morey, A. E., Woods, A., Chen, C. Y., et al. (2020). Paleomagnetic Constraint of the Brunhes Age Sedimentary Record from Lake Junín. Peru. Front. Earth Sci. 8, 147. doi:10.3389/feart.2020.00147
Head, M. J. (2019). Formal Subdivision of the Quaternary System/Period: Present Status and Future Directions. Quat. Int. 500, 32–51. doi:10.1016/j.quaint.2019.05.018
Heslop, D., Langereis, C. G., and Dekkers, M. J. (2000). A New Astronomical Timescale for the Loess Deposits of Northern China. Earth Planet. Sci. Lett. 184, 125–139. doi:10.1016/S0012-821X(00)00324-1
Hodell, D. A., Charles, C. D., and Sierro, F. J. (2001). Late Pleistocene Evolution of the Ocean's Carbonate System. Earth Planet. Sci. Lett. 192, 109–124. doi:10.1016/S0012-821X(01)00430-7
Höfken, A. F., Brück, L., Fessler, S., Liu, J., and Nürnberg, D. (2018). “Chapter 5.5: Sediment Core Logging,” in Cruise Report SO264-SONNE-EMPEROR: The Plio-Pleistocene to Holocene Development of the Pelagic North Pacific from Surface to Depth – Assessing its Role for the Global Carbon Budget and Earth ́s Climate, Suva (Fiji) – Yokohama (Japan), 30.6. – 24.8.2018. GEOMAR Report N. Ser.. Editor D. Nürnberg (Kiel: GEOMAR Helmholtz-Zentrum für Ozeanforschung), 46, 37–38. doi:10.3289/GEOMARGermany_REP_NS_46_2018
Hofmann, D. I., and Fabian, K. (2007). Rock Magnetic Properties and Relative Paleointensity Stack for the Last 300 Ka Based on a Stratigraphic Network from the Subtropical and Subantarctic South Atlantic. Earth Planet. Sci. Lett. 260 (1-2), 297–312. doi:10.1016/j.epsl.2007.05.042
Hofmann, D. I., and Fabian, K. (2009). Correcting Relative Paleointensity Records for Variations in Sediment Composition: Results from a South Atlantic Stratigraphic Network. Earth Planet. Sci. Lett. 284, 34–43. doi:10.1016/j.epsl.2009.03.043
Hounslow, M. W., and Maher, B. A. (1996). Quantitative Extraction and Analysis of Carriers of Magnetization in Sediments. Geophys. J. Int. 124 (1), 57–74. doi:10.1111/j.1365-246X.1996.tb06352.x
Jaccard, S. L., Galbraith, E. D., Sigman, D. M., and Haug, G. H. (2010). A Pervasive Link between Antarctic Ice Core and Subarctic Pacific Sediment Records over the Past 800kyrs. Quat. Sci. Rev. 29 (1–2), 206–212. doi:10.1016/j.quascirev.2009.10.007
Johnson, G. C., and Toole, J. M. (1993). Flow of Deep and Bottom Waters in the Pacific at 10°N. Deep Sea Res. Oceanographic Res. Pap. 40 (2), 371–394. doi:10.1016/0967-0637(93)90009-r
Johnson, H. P., Hautala, S. L., Bjorklund, T. A., and Zarnetske, M. R. (2006). Quantifying the North Pacific Silica Plume. Geochem. Geophys. Geosyst. 7, a–n. doi:10.1029/2005GC001065
Kawabe, M., and Fujio, S. (2010). Pacific Ocean Circulation Based on Observation. J. Oceanogr. 66 (3), 389–403. doi:10.1007/s10872-010-0034-8
Kawabe, M., Fujio, S., Yanagimoto, D., and Tanaka, K. (2009). Water Masses and Currents of Deep Circulation Southwest of the Shatsky Rise in the Western North Pacific. Deep Sea Res. Part Oceanographic Res. Pap. 56 (10), 1675–1687. doi:10.1016/j.dsr.2009.06.003
Kawano, T., Fukasawa, M., Kouketsu, S., Uchida, H., Doi, T., Kaneko, I., et al. (2006). Bottom Water Warming along the Pathway of Lower Circumpolar Deep Water in the Pacific Ocean. Geophys. Res. Lett. 33 (23), L23613. doi:10.1029/2006GL027933
Kent, D., Opdyke, N. D., and Ewing, M. (1971). Climate Change in the North Pacific Using Ice-Rafted Detritus as a Climatic Indicator. Geol. Soc. America Bull. 82 (10), 2741–2754. doi:10.1130/0016-7606(1971)82[2741:ccitnp]2.0.co;2
Kent, D. V., and Lowrie, W. (1974). Origin of Magnetic Instability in Sediment Cores from the central North Pacific. J. Geophys. Res. 79 (20), 2987–3000. doi:10.1029/JB079i020p02987
King, J. W., Banerjee, S. K., and Marvin, J. (1983). A New Rock-Magnetic Approach to Selecting Sediments for Geomagnetic Paleointensity Studies: Application to Paleointensity for the Last 4000 Years. J. Geophys. Res. 88, 5911–5921. doi:10.1029/JB088iB07p05911
Kodama, K., Uyeda, S., and Isezaki, N. (1978). Paleomagnetism of Suiko Seamount, Emperor Seamount Chain. Geophys. Res. Lett. 5 (3), 165–168. doi:10.1029/GL005i003p00165
Komaki, K., and Kawabe, M. (2009). Deep-circulation Current through the Main Gap of the Emperor Seamounts Chain in the North Pacific. Deep Sea Res. Part Oceanographic Res. Pap. 56 (3), 305–313. doi:10.1016/j.dsr.2008.10.006
Korff, L., von Dobeneck, T., Frederichs, T., Kasten, S., Kuhn, G., Gersonde, R., et al. (2016). Cyclic Magnetite Dissolution in Pleistocene Sediments of the Abyssal Northwest Pacific Ocean: Evidence for Glacial Oxygen Depletion and Carbon Trapping. Paleoceanography 31, 600–624. doi:10.1002/2015PA002882
La j, C., Kissel, C., Mazaud, A., Channell, J. E. T., and Beer, J. (2000). North Atlantic Palaeointensity Stack since 75ka (NAPIS-75) and the Duration of the Laschamp Event. Phil. Trans. R. Soc. Lond. Ser. A: Math. Phys. Eng. Sci. 358 (1768), 1009–1025. doi:10.1098/rsta.2000.0571
Li, J., Liu, Y., Liu, S., Roberts, A. P., Pan, H., Xiao, T., et al. (2020). Classification of a Complexly Mixed Magnetic Mineral Assemblage in Pacific Ocean Surface Sediment by Electron Microscopy and Supervised Magnetic Unmixing. Front. Earth Sci. 8, 609058. doi:10.3389/feart.2020.609058
Lisiecki, L. E., and Raymo, M. E. (2005). A Pliocene-Pleistocene Stack of 57 Globally Distributed Benthic δ18O Records. Paleoceanography 20, a–n. 20(1), PA1003. doi:10.1029/2004PA001071
Lyle, M. (2003). Neogene Carbonate Burial in the Pacific Ocean. Paleoceanography 18, a–n. 3. doi:10.1029/2002PA000777
Mantyla, A. W., and Reid, J. L. (1983). Abyssal Characteristics of the World Ocean Waters. Deep Sea Res. A. Oceanographic Res. Pap. 30 (8), 805–833. doi:10.1016/0198-0149(83)90002-X
Manville, V., Németh, K., and Kano, K. (2009). Source to Sink: A Review of Three Decades of Progress in the Understanding of Volcaniclastic Processes, Deposits, and Hazards. Sedim. Geol. 220 (3-4), 136–161. doi:10.1016/j.sedgeo.2009.04.022
McCarron, A. P., Bigg, G. R., Brooks, H., Leng, M. J., Marshall, J. D., Ponomareva, V., et al. (2021). Northwest Pacific Ice-Rafted Debris at 38°N Reveals Episodic Ice-Sheet Change in Late Quaternary Northeast Siberia. Earth Planet. Sci. Lett. 553, 116650. doi:10.1016/j.epsl.2020.116650
Mullender, T. A. T., Frederichs, T., Hilgenfeldt, C., de Groot, L. V., Fabian, K., and Dekkers, M. J (2016). Automated Paleomagnetic and Rock Magnetic Data Acquisition with an In-Line Horizontal “2G” System. Geochem. Geophys. Geosyst. 17 (9), 3546–3559. doi:10.1002/2016GC006436
Natland, J. H. (1993). Volcanic ash and pumice at Shatsky Rise: sources, mechamisms of transport, and bearing on atmosphere circulation, in editors: J.H. Natland, M.A. Storms et al. Proc. ODP Sci. Results (Ocean Drilling Program Coll. Station, TX) 132, 57–66.
Nürnberg, D. (2018). In Cruise Report SO264-SONNE-EMPEROR: The Plio-Pleistocene to Holocene Development of the Pelagic North Pacific from Surface to Depth – Assessing its Role for the Global Carbon Budget and Earth’s Climate, Suva (Fiji) – Yokohama (Japan), 30.6. – 24.8.2018. GEOMAR Report N. Ser. 46, 284. doi:10.3289/GEOMAR
Ninkovich, D., Opdyke, N., Heezen, B. C., and Foster, J. H. (1966). Paleomagnetic Stratigraphy, Rates of Deposition and Tephrachronology in North Pacific Deep-Sea Sediments. Earth Planet. Sci. Lett. 1 (6), 476–492. doi:10.1016/0012-821X(66)90052-5
Ogg, J. G. (2020). “Geomagnetic Polarity Time Scale. Chapter 5-Geomagnetic Polarity Time Scale,” in Geologic Time Scale 2020. Editors M. FelixGradstein, G. JamesOgg, D. MarkSchmitz, and M. GabiOgg (Netherlands: Elsevier), 159–192. doi:10.1016/B978-0-12-824360-2.00005-X
Opdyke, N. D., and Foster, J. H. (1970). Paleomagnetism of Cores from the North Pacific. North Pac. Geol. Soc. Am. Mem 126, 83–119. doi:10.1130/mem126-p83
Ouyang, T., Heslop, D., Roberts, A. P., Tian, C., Zhu, Z., Qiu, Y., et al. (2014). Variable Remanence Acquisition Efficiency in Sediments Containing Biogenic and Detrital Magnetites: Implications for Relative Paleointensity Signal Recording. Geochem. Geophys. Geosyst. 15 (7), 2780–2796. doi:10.1002/2014GC005301
Petersen, N., and Vali, H. (1987). Observation of Shrinkage Cracks in Ocean Floor Titanomagnetites. Phys. earth Planet. interiors 46 (1–3), 197–205. doi:10.1016/0031-9201(87)90182-8
Petersen, N., von Dobeneck, T., and Vali, H. (1986). Fossil Bacterial Magnetite in Deep-Sea Sediments from the South Atlantic Ocean. Nature 320, 611–615. doi:10.1038/320611a0
Pike, C. R., Roberts, A. P., and Verosub, K. L. (1999). Characterizing Interactions in fine Magnetic Particle Systems Using First Order Reversal Curves. J. Appl. Phys. 85 (9), 6660–6667. doi:10.1063/1.370176
Prince, R. A., Heath, G. R., and Kominz, M. (1980). Paleomagnetic Studies of central North Pacific Sediment Cores: Stratigraphy, Sedimentation Rates, and the Origin of Magnetic Instability. Geol. Soc. America Bull. 91 (8_Part_II), 1789–1835. doi:10.1130/GSAB-P2-91-1789
Rea, D. K. (1970). Changes in Structure and Trend of Fracture Zones north of the Hawaiian Ridge and Relation to Sea-Floor Spreading. J. Geophys. Res. 75 (8), 1421–1430. doi:10.1029/JB075i008p01421
Rea, D. K., and Dixon, J. M. (1983). Late Cretaceous and Paleogene Tectonic Evolution of the north Pacific Ocean. Earth Planet. Sci. Lett. 65 (1), 145–166. doi:10.1016/0012-821X(83)90196-6
Rea, D. K., and Hovan, S. A. (1995). Grain Size Distribution and Depositional Processes of the mineral Component of Abyssal Sediments: Lessons from the North Pacific. Paleoceanography 10 (2), 251–258. doi:10.1029/94PA03355
Rea, D. K. (1994). The Paleoclimatic Record provided by Eolian Deposition in the Deep Sea: The Geologic History of Wind. Rev. Geophys. 32 (2), 159–195. doi:10.1029/93RG03257
Readman, P. W., and O'Reilly, W. (1972). Magnetic Properties of Oxidized (Cation-Deficient) Titanomagnetites (Fe, Ti)3O4. J. Geomagn. Geoelec 24 (1), 69–90. doi:10.5636/jgg.24.69
Reid, J. L., and Lonsdale, P. F. (1974). On the Flow of Water through the Samoan Passage. J. Phys. Oceanogr. 4 (1), 58–73. doi:10.1175/1520-0485(1974)004<0058:otfowt>2.0.co;2
Ren, J., Gersonde, R., Esper, O., and Sancetta, C. (2014). Diatom Distributions in Northern North Pacific Surface Sediments and Their Relationship to Modern Environmental Variables. Palaeogeogr. Palaeoclimatol. Palaeoecol. 402, 81–103. doi:10.1016/j.palaeo.2014.03.008
Roberts, A. P., Pike, C. R., and Verosub, K. L. (2000). First-order Reversal Curve Diagrams: A New Tool for Characterizing the Magnetic Properties of Natural Samples. J. Geophys. Res. 105 (B12), 28461–28475. doi:10.1029/2000JB900326
Roberts, A. P., and Winklhofer, M. (2004). Why Are Geomagnetic Excursions Not Always Recorded in Sediments? Constraints from post-depositional Remanent Magnetization Lock-In Modelling. Earth Planet. Sci. Lett. 227 (3-4), 345–359. doi:10.1016/j.epsl.2004.07.040
Roemmich, D., Hautala, S., and Rudnick, D. (1996). Northward Abyssal Transport through the Samoan Passage and Adjacent Regions. J. Geophys. Res. 101 (C6), 14039–14055. doi:10.1029/96JC00797
Rowan, C. J., Roberts, A. P., and Broadbent, T. (2009). Reductive Diagenesis, Magnetite Dissolution, Greigite Growth and Paleomagnetic Smoothing in marine Sediments: A New View. Earth Planet. Sci. Lett. 277, 223–235. doi:10.1016/j.epsl.2008.10.016
Rudnick, D. L. (1997). Direct Velocity Measurements in the Samoan Passage. J. Geophys. Res. 102 (C2), 3293–3302. doi:10.1029/96JC03286
Serno, S., Winckler, G., Anderson, R. F., Hayes, C. T., McGee, D., Machalett, B., et al. (2014). Eolian Dust Input to the Subarctic North Pacific. Earth Planet. Sci. Lett. 387, 252–263. doi:10.1016/j.epsl.2013.11.008
Shin, J. Y., Yu, Y., and Kim, W. (2019). Wavelet-based Verification of a Relative Paleointensity Record from the North Pacific. Earth Planets Space 71, 88. doi:10.1186/s40623-019-1067-x
Shin, J. Y., Yu, Y., Seo, I., Hyeong, K., Lim, D., and Kim, W. (2018). Magnetic Properties of Deep‐Sea Sediments from the North Pacific: A Proxy of Glacial Deep‐Water Ventilation. Geochem. Geophys. Geosyst. 19, 4433–4443. doi:10.1029/2018GC007735
Simon, Q., Thouveny, N., Bourlès, D. L., Bassinot, F., Savranskaia, T., Valet, J.-P., et al. (2018). Increased Production of Cosmogenic 10Be Recorded in Oceanic Sediment Sequences: Information on the Age, Duration, and Amplitude of the Geomagnetic Dipole Moment Minimum over the Matuyama-Brunhes Transition. Earth Planet. Sci. Lett. 489, 191–202. doi:10.1016/j.epsl.2018.02.036
Simon, Q., Thouveny, N., Bourlès, D. L., Valet, J. P., Bassinot, F., Ménabréaz, L., et al. (2016). Authigenic 10 Be/9 Be Ratio Signatures of the Cosmogenic Nuclide Production Linked to Geomagnetic Dipole Moment Variation since the Brunhes/Matuyama Boundary. J. Geophys. Res. Solid Earth 121 (11), 7716–7741. doi:10.1002/2016JB013335
Singer, B. S. (2014). A Quaternary Geomagnetic Instability Time Scale. Quat. Geochronol. 21, 29–52. doi:10.1016/j.quageo.2013.10.003
Snoeckx, H., Rea, D. K., Jones, C. E., and Ingram, B. L. (1995). Eolian and Silica Deposition in the Central North Pacific: Results from Sites 885/886. Scientific results145, 219–230. doi:10.2973/odp.proc.sr.145.123.1995
St. John, K. E., and Krissek, L. A. (1999). Regional Patterns of Pleistocene Ice-Rafted Debris Flux in the North Pacific. Paleoceanography 14 (5), 653–662. doi:10.1029/1999PA900030
Stoner, J. S., Laj, C., Channell, J. E. T., and Kissel, C. (2002). South Atlantic and North Atlantic Geomagnetic Paleointensity Stacks (0-80ka): Implications for Inter-hemispheric Correlation. Quat. Sci. Rev. 21 (10), 1141–1151. doi:10.1016/S0277-3791(01)00136-6
Straub, S. M., and Schmincke, H. U. (1998). Evaluating the Tephra Input into Pacific Ocean Sediments: Distribution in Space and Time. Geologische Rundschau 87 (3), 461–476. doi:10.1007/s005310050222
Stuiver, M., Quay, P. D., and Ostlund, H. G. (1983). Abyssal Water Carbon-14 Distribution and the Age of the World Oceans. Science 219 (4586), 849–851. doi:10.1126/science.219.4586.849
Suganuma, Y., Okuno, J. I., Heslop, D., Roberts, A. P., Yamazaki, T., and Yokoyama, Y. (2011). Post-depositional Remanent Magnetization Lock-In for marine Sediments Deduced from 10Be and Paleomagnetic Records through the Matuyama–Brunhes Boundary. Earth Planet. Sci. Lett. 311 (1-2), 39–52. doi:10.1016/j.epsl.2011.08.038
Suganuma, Y., Yamazaki, T., Kanamatsu, T., and Hokanishi, N. (2008). Relative Paleointensity Record during the Last 800 Ka from the Equatorial Indian Ocean: Implication for Relationship between Inclination and Intensity Variations. Geochem. Geophys. Geosyst. 9, a–n. doi:10.1029/2007GC001723
Suganuma, Y., Yokoyama, Y., Yamazaki, T., Kawamura, K., Horng, C. S., and Matsuzaki, H. (2010). 10Be Evidence for Delayed Acquisition of Remanent Magnetization in marine Sediments: Implication for a New Age for the Matuyama–Brunhes Boundary. Earth Planet. Sci. Lett. 296 (3-4), 443–450. doi:10.1016/j.epsl.2010.05.031
Talley, L. (2013). Closure of the Global Overturning Circulation through the Indian, Pacific, and Southern Oceans: Schematics and Transports. Oceanog 26, 80–97. doi:10.5670/oceanog.2013.07
Talley, L. D., and Joyce, T. M. (1992). The Double Silica Maximum in the North Pacific. J. Geophys. Res. 97 (C4), 5465–5480. doi:10.1029/92JC00037
Talley, L. D. (2003). Shallow, Intermediate, and Deep Overturning Components of the Global Heat Budget. J. Phys. Oceanogr. 33, 530–560. doi:10.1175/1520-0485(2003)033<0530:siadoc>2.0.co;2
Tauxe, L., Herbert, T., Shackleton, N. J., and Kok, Y. S. (1996). Astronomical Calibration of the Matuyama-Brunhes Boundary: Consequences for Magnetic Remanence Acquisition in marine Carbonates and the Asian Loess Sequences. Earth Planet. Sci. Lett. 140 (1-4), 133–146. doi:10.1016/0012-821X(96)00030-1
Tauxe, L., Pick, T., and Kok, Y. S. (1995). Relative Paleointensity in Sediments: A Pseudo-thellier Approach. Geophys. Res. Lett. 22 (21), 2885–2888. doi:10.1029/95GL03166
Tauxe, L. (1993). Sedimentary Records of Relative Paleointensity of the Geomagnetic Field: Theory and Practice. Rev. Geophys. 31 (3), 319–354. doi:10.1029/93RG01771
Usui, Y., Yamazaki, T., and Saitoh, M. (2017). Changing Abundance of Magnetofossil Morphologies in Pelagic Red Clay Around Minamitorishima, Western North Pacific. Geochem. Geophys. Geosyst. 18, 4558–4572. doi:10.1002/2017GC007127
Valet, J.-p., and Meynadier, L. (1993). Geomagnetic Field Intensity and Reversals during the Past Four Million Years. Nature 366 (6452), 234–238. doi:10.1038/366234a0
Valet, J.-P., Meynadier, L., and Guyodo, Y. (2005). Geomagnetic Dipole Strength and Reversal Rate over the Past Two Million Years. Nature 435, 802–805. doi:10.1038/nature03674
Valet, J.-P., Tanty, C., and Carlut, J. (2017). Detrital Magnetization of Laboratory-Redeposited Sediments. Geophys. J. Int. 210 (1), 34–41. doi:10.1093/gji/ggx139
Valet, J. P., Thevarasan, A., Bassinot, F., Savranskaia, T., and Haddam, N. (2020). Two Records of Relative Paleointensity for the Past 4 Myr. Front. Earth Sci. 8, 148. doi:10.3389/feart.2020.00148
Vali, H., Förster, O., Amarantidis, G., and Petersen, N. (1987). Magnetotactic Bacteria and Their Magnetofossils in Sediments. Earth Planet. Sci. Lett. 86 (2–4), 389–400. doi:10.1016/0012-821X(87)90235-4
Vali, H., and Kirschvink, J. L. (1989). Magnetofossil Dissolution in a Palaeomagnetically Unstable Deep-Sea Sediment. Nature 339 (6221), 203–206. doi:10.1038/339203a0
von Dobeneck, T., Petersen, N., and Vali, H. (1987). Bakterielle Magnetofossilien - Paläomagnetische und paläontologische Spuren einer ungewöhnlichen Bakteriengruppe. Geowissenschaften in unserer Zeit 5, 27–35. doi:10.2312/geowissenschaften.1987.5.27
Yamamoto, Y., Yamazaki, T., Kanamatsu, T., Ioka, N., and Mishima, T. (2007). Relative Paleointensity Stack during the Last 250 Kyr in the Northwest Pacific. Journal of Geophysical Research: Solid Earth, 112(B1), B01104. doi:10.1029/2006JB004477
Yamazaki, T., Fu, W., and Shimono, T. (2020). Unmixing Biogenic and Terrigenous Magnetic mineral Components in Red clay of the Pacific Ocean Using Principal Component Analyses of First-Order Reversal Curve Diagrams and Paleoenvironmental Implications. Earth Planets Space 72, 12. (2020). doi:10.1186/s40623-020-01248-5
Yamazaki, T., and Ioka, N. (1997). Environmental Rock-Magnetism of Pelagic clay: Implications for Asian Eolian Input to the North Pacific since the Pliocene. Paleoceanography 12 (1), 111–124. doi:10.1029/96PA02757
Yamazaki, T., and Kanamatsu, T. (2007). A Relative Paleointensity Record of the Geomagnetic Field since 1.6 Ma from the North Pacific. Earth Planet. Sp 59, 785–794. doi:10.1186/BF03352741
Yamazaki, T., and Katsura, I. (1990). Magnetic Grain Size and Viscous Remanent Magnetization of Pelagic clay. J. Geophys. Res. 95 (B4), 4373–4382. doi:10.1029/JB095iB04p04373
Yamazaki, T., and Oda, H. (2004). “Intensity-inclination Correlation for Long-Term Secular Variation of the Geomagnetic Field and its Relevance to Persistent Non-dipole Components,” in Timescales of the Paleomagnetic Field. Editor J. E. T. Channell (Washington, DC: AGU), Vol.145, 287–298. Geophys. Monogr. Ser.,.
Yamazaki, T., and Oda, H. (2002). Orbital Influence on Earth's Magnetic Field: 100,000-year Periodicity in Inclination. Science 295, 2435–2438. doi:10.1126/science.1068541
Yamazaki, T., and Oda, H. (2005). A Geomagnetic Paleointensity Stack between 0.8 and 3.0 Ma from Equatorial Pacific Sediment Cores. Geochem. Geophys. Geosyst. 6, a–n. doi:10.1029/2005GC001001
Yamazaki, T., and Yamamoto, Y. (2018). Relative Paleointensity and Inclination Anomaly over the Last 8 Myr Obtained from the Integrated Ocean Drilling Program Site U1335 Sediments in the Eastern Equatorial Pacific. J. Geophys. Res. Solid Earth 123 (9), 7305–7320. doi:10.1029/2018JB016209
Zhang, Q., Liu, Q., and Sun, Y. (2020a). Review of Recent Developments in Aeolian Dust Signals of Sediments from the North Pacific Ocean Based on Magnetic Minerals. Geol. Mag 157 (5), 790–805.
Zhang, Q., Liu, Q., Li, J., and Sun, Y. (2018). An Integrated Study of the Eolian Dust in Pelagic Sediments from the North Pacific Ocean Based on Environmental Magnetism, Transmission Electron Microscopy, and Diffuse Reflectance Spectroscopy. J. Geophys. Res. Solid Earth 123 (5), 3358–3376. doi:10.1002/2017JB014951
Zhang, Q., Liu, Q., Roberts, A. P., Larrasoaña, J. C., Shi, X., and Jin, C. (2020b). Mechanism for Enhanced Eolian Dust Flux Recorded in North Pacific Ocean Sediments since 4.0 Ma: Aridity or Humidity at Dust Source Areas in the Asian interior? Geology 48 (1), 77–81. doi:10.1130/G46862.1
Keywords: North Pacific, abyssal sediments, relative paleointensity, magnetic carriers, magnetostratigraphy, biogenic magnetite, magnetite reduction, magnetite oxidation
Citation: Wang W, von Dobeneck T, Frederichs T, Zhang Y, Lembke-Jene L, Tiedemann R, Winklhofer M and Nürnberg D (2021) Dating North Pacific Abyssal Sediments by Geomagnetic Paleointensity: Implications of Magnetization Carriers, Plio-Pleistocene Climate Change, and Benthic Redox Conditions. Front. Earth Sci. 9:683177. doi: 10.3389/feart.2021.683177
Received: 20 March 2021; Accepted: 28 June 2021;
Published: 10 August 2021.
Edited by:
Davide Tiranti, Agenzia Regionale per la Protezione Ambientale (ARPA), ItalyReviewed by:
Quentin Simon, UMR7330 Centre Européen de Recherche et d'enseignement de Géosciences de l'environnement (CEREGE), FranceJosep M. Pares, National Research Center on Human Evolution, Spain
Copyright © 2021 Wang, von Dobeneck, Frederichs, Zhang, Lembke-Jene, Tiedemann, Winklhofer and Nürnberg. This is an open-access article distributed under the terms of the Creative Commons Attribution License (CC BY). The use, distribution or reproduction in other forums is permitted, provided the original author(s) and the copyright owner(s) are credited and that the original publication in this journal is cited, in accordance with accepted academic practice. No use, distribution or reproduction is permitted which does not comply with these terms.
*Correspondence: Wanzhang Wang, d3dhbmdAdW5pLWJyZW1lbi5kZQ==