
95% of researchers rate our articles as excellent or good
Learn more about the work of our research integrity team to safeguard the quality of each article we publish.
Find out more
ORIGINAL RESEARCH article
Front. Earth Sci. , 05 November 2021
Sec. Biogeoscience
Volume 9 - 2021 | https://doi.org/10.3389/feart.2021.676748
This article is part of the Research Topic Observing, Modeling and Understanding Processes in Natural and Managed Peatlands View all 17 articles
 Laura L. Bourgeau-Chavez1*
 Sarah L. Grelik1
 Michael J. Battaglia1
 Dorthea J. Leisman1
 Rod A. Chimner2John A. Hribljan2
 Erik A. Lilleskov3Freddie C. Draper4,5
 Brian R. Zutta6,7
 Kristell Hergoualc’h8Rupesh K. Bhomia9Outi Lähteenoja10
There is a data gap in our current knowledge of the geospatial distribution, type and extent of C rich peatlands across the globe. The Pastaza Marañón Foreland Basin (PMFB), within the Peruvian Amazon, is known to store large amounts of peat, but the remoteness of the region makes field data collection and mapping the distribution of peatland ecotypes challenging. Here we review methods for developing high accuracy peatland maps for the PMFB using a combination of multi-temporal synthetic aperture radar (SAR) and optical remote sensing in a machine learning classifier. The new map produced has 95% overall accuracy with low errors of commission (1–6%) and errors of omission (0–15%) for individual peatland classes. We attribute this improvement in map accuracy over previous maps of the region to the inclusion of high and low water season SAR images which provides information about seasonal hydrological dynamics. The new multi-date map showed an increase in area of more than 200% for pole forest peatland (6% error) compared to previous maps, which had high errors for that ecotype (20–36%). Likewise, estimates of C stocks were 35% greater than previously reported (3.238 Pg in Draper et al. (2014) to 4.360 Pg in our study). Most of the increase is attributed to pole forest peatland which contributed 58% (2.551 Pg) of total C, followed by palm swamp (34%, 1.476 Pg). In an assessment of deforestation from 2010 to 2018 in the PMFB, we found 89% of the deforestation was in seasonally flooded forest and 43% of deforestation was occurring within 1 km of a river or road. Peatlands were found the least affected by deforestation and there was not a noticeable trend over time. With development of improved transportation routes and population pressures, future land use change is likely to put South American tropical peatlands at risk, making continued monitoring a necessity. Accurate mapping of peatland ecotypes with high resolution (<30 m) sensors linked with field data are needed to reduce uncertainties in estimates of the distribution of C stocks, and to aid in deforestation monitoring.
Despite covering a relatively small area of the Earth’s terrestrial landscape (3–5% (Maltby and Proctor, 1996; Moomaw et al., 2018), peat-accumulating wetlands currently represent one of the largest carbon stores in the world with an estimated 25–30% of the global belowground soil organic C stock (Yu et al., 2010; Leifeld and Menichetti, 2018; Loisel et al., 2021). Although there have been many efforts to estimate the spatial distribution of peatlands and their C stocks, great uncertainties remain. One of the challenges with mapping the distribution of peatlands is in accurately distinguishing them from non-peat wetlands both in the field and from remotely sensed data. Efforts to map global wetlands from MODIS or other coarse resolution optical sources are ineffective in detecting and mapping peatlands. With coarse (250 m–1 km) resolution data, peatlands typically are grouped with a more general wetland class. Since peatlands are often small and interspersed with upland and other wetland types, it is essential to use finer resolution data (30 m or better) to distinguish peatland types. Further, hybrid remote sensing methods that use a combination of data sources and imagery from multiple seasons are necessary to capture the hydrologic and phenological variation that characterizes the diversity of peatlands that exist on the landscape (Bourgeau-Chavez et al., 2017; Bourgeau-Chavez et al., 2018).
Wetlands in general are difficult features to map due to their high variability in morphology and wetness conditions across the seasons. The utility of optical data alone is limited because peatland and non-peatland ecotypes can be floristically similar (Draper et al., 2014; Bourgeau-Chavez et al., 2017; Hribljan et al., 2017). Reliance on optical data is further challenged in regions like the tropics that are often laden with heavy cloud cover. In contrast, the long wavelength of L-band (∼24 cm wavelength) synthetic aperture radar (SAR) allows for penetration of clouds and wetland canopies, and interacts with the wet or flooded soil differently than from dry soil, allowing discrimination of wetlands from non-wetlands. A better distinction between vegetation types (forested, shrubby, and herbaceous), peat- and non-peat wetlands, and peatland types (bog vs. fen) has been obtained through multi-date, multi-sensor SAR and optical approaches (Bourgeau-Chavez et al., 2015; Bourgeau-Chavez et al., 2017; Hribljan et al., 2017; Chimner et al., 2019). Using multiple date SAR images allows for monitoring of changes in hydrologic condition to help differentiate between mineral soil wetlands that are periodically inundated and organic soil peatlands that typically have saturated soils for longer portions of a year (e.g., Chimner et al., 2019). Similarly, multi-date Landsat allows the capture of phenological differences between dominant plant species and together the complementary sensors have been shown to improve wetland mapping in the coastal Great Lakes (Bourgeau-Chavez et al., 2015), boreal peatlands of Alberta and Northwest Territories Canada, Michigan’s upper peninsula (Bourgeau-Chavez et al., 2017; Bourgeau-Chavez et al., 2019) and in tropical mountain peatlands (Hribljan et al., 2017; Chimner et al., 2019). However, these methods have not yet been applied to tropical lowland peatlands.
Compared to boreal peatlands, the distribution of tropical peatlands has only recently begun to be revealed. Although tropical Southeast Asian peatlands have been well-studied, recent efforts are discovering vast tropical peatland areas in both the Congo of Africa (Dargie et al., 2017) and the Amazon basin of South America (Lähteenoja et al., 2012; Gumbricht et al., 2017). Several groups have mapped tropical peatlands globally (Gumbricht et al., 2017; Xu et al., 2018), as well as for Indonesia (Margono et al., 2014; Warren et al., 2017; Crowson et al., 2019) and Peru (Lähteenoja et al., 2009a; Lähteenoja et al., 2012; Draper et al., 2014). These maps have relied on optical (Landsat) imagery from a single date (e.g., Lhteenoja et al., 2012) or more recently a hybrid of optical and SAR (e.g., PALSAR or Sentinel-1) also from a single date (Draper et al., 2014; Margono et al., 2014; Crowson et al., 2019). Improving peatland distribution maps and reducing uncertainties in estimates of C stocks requires additional field sampling and high resolution (<30 m) remote sensing analysis (Xu et al., 2018) that includes multi-date, multi-sensor imagery. Reducing errors in peatland map classifications will increase confidence in estimates of C stocks, and also allow for better understanding of threats to existing peatlands through monitoring of land cover and land use changes.
The main goal of our research was to determine if the application of a multi-date, multi-sensor SAR and optical approach can improve on previous mapping efforts employing a single date of SAR and optical data (Draper et al., 2014) for classification of tropical lowland peatlands of Peru. For this analysis, we focus on a similar study area to that of Draper et al. (2014) in the Pastaza Marañón Foreland Basin (PMFB) within the Peruvian Amazon. This region harbors extensive areas with deep peat reservoirs that sequester large C stocks (Lähteenoja et al., 2012; Draper et al., 2014; Bhomia et al., 2019). Tropical floodplain ecosystems such as these are defined by their seasonal cycles of inundation, lasting several months, alternating with seasonal drying (Hamilton et al., 1998). These periods of inundation vary across the landscape, leading to a complex mosaic of interspersed peatlands and seasonally flooded non-peat wetlands. Our objectives are to determine what improvements can be made over a single date of L-band radar and single date of Landsat in our mapping approach and also how helpful digital elevation model (DEM) derivatives may be in mapping this relatively flat region. We then compare changes in estimates of carbon stocks based on these new maps using the field data and algorithms from Draper et al. (2014). Second, while it is imperative to improve accuracy in peatland mapping capability, it is also of great importance to recognize and quantify threats to these systems. Globally, from the arctic to the tropics, land use change (e.g., deforestation, oil, and gas exploration, grazing, agriculture, infrastructure development, hydrologic alterations, etc.) is one of the largest threats to peatlands. Until recently, human impacts on South American tropical peatlands were not widely studied. Most of the focus has been on Indonesia, where tropical peatlands have been rapidly deforested and converted to agricultural production such as palm oil and tree plantations (Miettinen et al., 2011; Miettinen et al., 2016). The Peruvian Amazon contrasts with Indonesia as it has not yet been heavily affected by widespread anthropogenic disturbance, but there is potential for more severe human impacts as economic and industrial development of the region increase (Roucoux et al., 2017; Lilleskov et al., 2019). Recent expansion of road networks in the Peruvian Amazon could directly affect these extensive peatland ecosystems. An accurate understanding and quantification of peatland extent, carbon storage, and human impacts is needed to inform policy and guide management. Thus, our second goal is to assess current deforestation rates in the PMFB peatlands, and patterns of deforestation in relation to proximity to river and road networks.
The 141,200 km2 study area is a vast floodplain complex of the Pastaza-Marañón Foreland Basin (PMFB) in Amazonian Peru to the west and south of Iquitos (Figure 1). The region is dominated by palm swamps in the Marañón and Ucayali basins, which are remote and difficult to access. The larger landscape consists of a mosaic of uplands and wetlands, both peat forming and non-peat forming. Three peatland ecosystem types (palm swamp peatland, pole forest peatland, and open peatland) and two non-peatland ecosystem types (seasonally flooded forest, Terra firme/occasionally flooded forest) dominate the landscape (Lähteenoja and Page, 2011; Draper et al., 2014; Draper et al., 2018). Palm swamp peatlands (a portion of the ecosystems locally known as aguajales or tahuampas) are dominated by flood tolerant palms, especially Mauritia flexuosa, commonly known as aguaje (Draper et al., 2018), and are typically minerotrophic (i.e., fed by groundwater and/or surface water). Seasonally flooded forests are annually inundated for a portion of the year, they represent a wide range of forest community types, but are predominately non-peat forming and are normally not dominated by palm species. Open peatlands are dominated by herbaceous vegetation, typically graminoids, ferns, and floating aquatic plants (Draper et al., 2014), and can be minerotrophic (Lähteenoja and Page, 2011) or ombrotrophic (i.e., rainwater fed) (Lähteenoja et al., 2009a; Lähteenoja et al., 2009b). Pole forest peatlands (varillales hidromórfico) are dominated by dense, thin, low-stature (<20 m) trees (Draper at al., 2014), and tend to be ombrotrophic (Lähteenoja and Page, 2011). The forests are morphologically similar to white-sand forests (varillales in Peru; Adeney et al., 2016) but have distinct vegetation (Draper et al., 2018). The pole forest peatlands tend to have the thickest, oldest and most ombrotrophic peat deposits, with peat domes that extend above the maximum flood level, while palm swamp peatlands are commonly minerotrophic with evidence of frequent flooding and locations typically close to large and geomorphically dynamic rivers (Lähteenoja and Page, 2011; Lähteenoja et al., 2012). Open peatlands were also found near large and dynamic rivers and it is suggested that they may be in the early succession of peatland development because they appear much younger than pole forests (Draper et al., 2014).
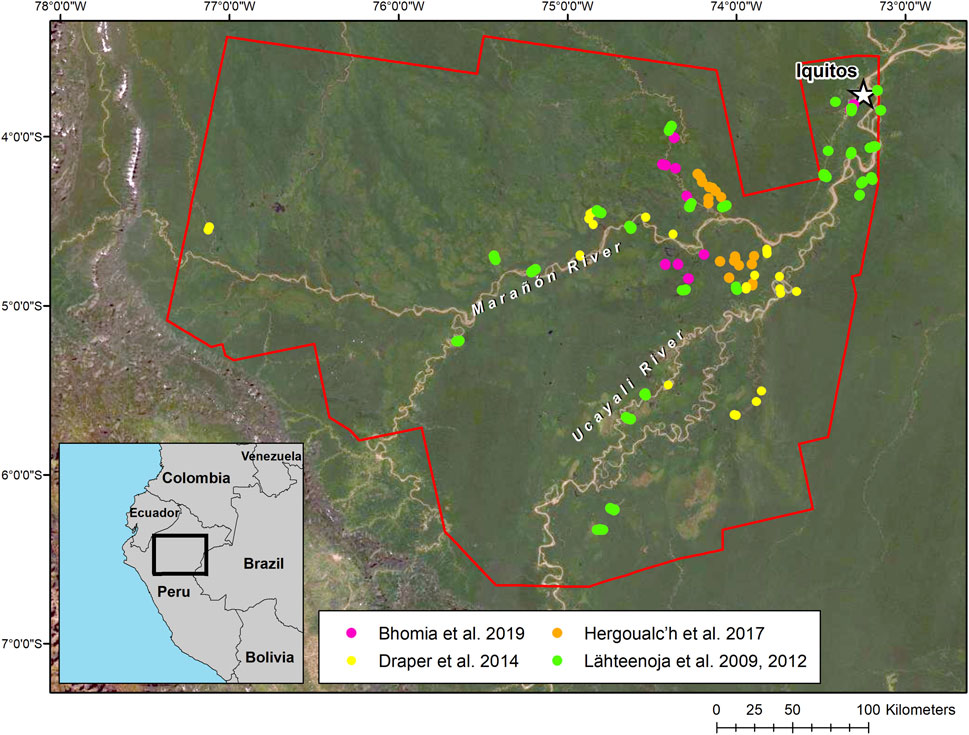
FIGURE 1. Pastaza Marañón Foreland Basin (PMFB) study area location in northern Peru including the Ucayali and Marañón river watersheds. Mapped area is shown in red outline; field sites are color-coded by data source.
Due to the remoteness of the study area and availability of existing field data on ecosystem types from various previous studies (Lähteenoja et al., 2009a; Lähteenoja et al., 2012; Draper et al., 2014, Hergoualc’h et al., 2017; Bhomia et al., 2019), we chose to compile the existing data for training and testing the map classifier (Figure 1; Supplemental Table S1). A total of 350 field locations (most of which had peat cores sampled) were obtained from these multiple sources and grouped into the five classes as defined by Draper et al. (2014) (open peatland, palm swamp, pole forest, Terra firme/occasionally flooded forest, and seasonally flooded forest). The field data were clustered to the eastern side of the study area and a handful of locations north of the Marañón River in the west at accessible sites along roads and rivers (Figure 1). Ideally, field data would be collected in a random distribution across the entire study region, however in remote locations that is logistically infeasible. Field data for mapping purposes is also best collected at the scale of the minimum mapping unit, which for our dataset is 0.4 ha (Bourgeau-Chavez et al., 2017). Thus, the point locations were used with image interpretation of sub-meter Worldview-2 or Google Earth imagery to create training and validation polygons of similar type, consisting of multiple pixels (minimum four pixels of 30 m size) in the Landsat-SAR imagery. For field data that consisted of multiple points along a transect in one wetland ecosystem type, we grouped the transect points into distinct training polygons using image interpretation of the sub-meter imagery as a guide (Figure 2). Thus, the actual number of training/validation polygons created for map classification was 85, much less than the 350 original field point locations, but areal coverage was much larger for each of the 85 polygons. This grouping was necessary to scale the field data to the remote sensing, thus maintaining field data at the scale of the minimum mapping unit (0.4 ha) or larger.
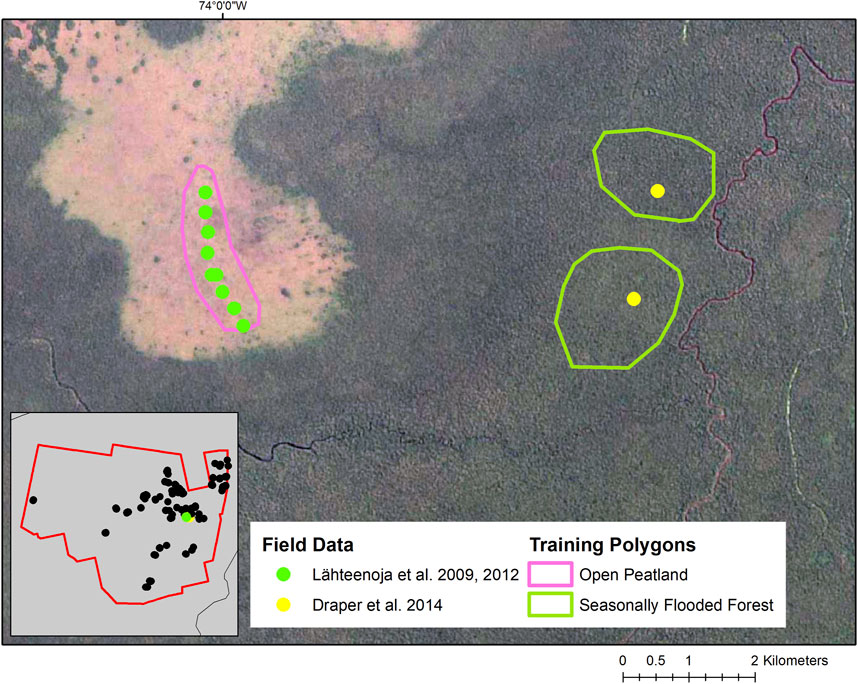
FIGURE 2. Field transect data within the Pastaza Marañón Foreland Basin (PMFB) of the same ecosystem type, such as the Riñón open peatland transect displayed in green (Lähteenoja et al., 2009a; Lähteenoja et al., 2012), were clustered into single ecosystem training polygons. For individual field points, such as the two seasonally flooded forest points from Draper et al. (2014) depicted in yellow, unique training polygons were created.
Advanced Land observing Satellite (ALOS) Phased Array type L-band Synthetic Aperture Radar (PALSAR) data (2007–2010) from fine beam single (FBS) and fine beam dual (FBD) modes were downloaded for the study area from the archive at the Alaska Satellite Facility (ASF) and radiometrically terrain corrected through ASF’s MapReady software to sigma nought. FBS consists of 10 m resolution horizontal send and horizontal receive polarized data (L-HH). FBD consists of dual polarized L-HH and L-HV (horizontal send and vertical receive polarized data). For each PALSAR scene extent, this resulted in 10–15 images. Past mapping efforts using the multi-date, multi-sensor approach by the authors relied on field data within each PALSAR scene. Such an approach limited the need for normalizing between adjacent scenes of PALSAR or Landsat that is necessary when mosaicking images. However, due to the remoteness of the study area and the limited and isolated field data, the 44 PALSAR scenes making up the study area needed to be mosaicked and normalization methods had to be developed. Several options for normalization were considered, but because we had a time series of images (10–15 dates) for the whole area, we chose to employ Principal Component Analysis (PCA) and to also use weather data to help choose images to mosaic of similar environmental conditions from similar seasons (high- and low-water), to create three input PALSAR datasets (PCA1, High-Water, Low-Water).
The time series PCA was used based on input of all available temporal PALSAR data (∼10–15 dates per scene area) in Erdas Imagine. PCA is a multivariate statistical technique that can be used to identify dominant spatial and temporal backscatter signatures (Jensen, 1996; Henebry, 1997; Bourgeau-Chavez et al., 2005). The first principal component (PCA1) captured dominant features across scenes, and reduced brightness/darkness inconsistencies between adjacent scenes, thus normalizing the data. This provided an image of stable scene elements, but changes in hydrological condition (high-vs. low-water seasons) also needed to be captured. A mosaic of low-water season PALSAR scenes as well as a mosaic of high-water season PALSAR scenes were needed. To do this, images from the same season/year and similar dates were chosen to build the mosaic. High-water season was defined as January–May and October–December, while the low-water season was defined as June–September. Next, images from other years from either the high- or low-water season were selected to fill in gaps. This was done by comparing precipitation data between scenes to capture similar environmental conditions and minimize variation in brightness across the mosaic. After each season (high- and low-water) of imagery was mosaicked it was filtered using a 3 × 3 median filter to reduce speckle. A total of 211 scenes were used for the high-water season and 156 for the low-water season (Supplemental Tables S2, S3). The PCA was not speckle filtered as the process already reduces speckle to higher order principal component (PC) images.
Cloud free Landsat imagery was very limited in this area and similar dates were not available across the study area. Two sources of Landsat mosaics were available for the region which were composites of multiple Landsat images. The first was the circa 2,000 Landsat 5 cloud-free composite created by Hansen et al. (2013) for Peru. The 2,000 image composite included Landsat bands 3 (red), 4 (NIR), 5 (SWIR), and 7 (SWIR). The second source was a 2010 Landsat 5 mosaic created by Draper et al. (2014). The Draper mosaic had three Landsat bands: 4 (NIR), 5 (SWIR), and 7 (SWIR).
Digital elevation model (DEM) data were downloaded from both the Earth Explorer [ASTER Global Digital Elevation Model (GDEM)] and the USGS Shuttle Radar Topography Mission (SRTM) DEM Directory. The 30 m SRTM DEM is based on interferometric SAR and was preferred but contained several data gaps which were filled with the ASTER GDEM. ASTER is an optical sensor and stereoscopic imaging was used to measure elevations and create the Global ASTER DEM product at 30 m horizontal resolution. Note that the work presented was created prior to the release of the SRTM Plus product that also has data gaps filled with ASTER and other sources.
Topographic indices allow for improved identification of low-lying areas and depressions that are more likely to be wet, but also for domed areas, such as occur in pole forests. These indices are then combined with remote sensing data in the map classifier. We chose to use the topographic position index (TPI) which is a measure of a point’s elevational position relative to the area immediately surrounding it (Weiss, 2001). To calculate TPI, each 30 m cell in the DEM was compared to the average value of cells in its surrounding neighborhood. In the resulting data set, negative values indicate a cell is relatively lower in elevation than the area around it, suggesting they are depressions, while positive values indicate the cell is relatively higher in elevation, such as peat domes. TPI is highly dependent on input parameters such as the shape and size of the neighborhood. For this project, a circular neighborhood with a 600 m (20-cell) radius was used. This 600 m radius tends to capture broad variability in landscapes without rugged topography.
The input datasets from PALSAR, Landsat, and either SRTM DEM or TPI (see examples in Figure 3) were used for classification to: 1) apply a single date of Landsat, PALSAR and SRTM DEM to mimic the Draper et al. (2014) approach; and 2) to test if there is improved accuracy of a multi-date approach. Models tested included all three data sources because it has already been demonstrated that adding PALSAR and SRTM DEM or derivatives improves peatland mapping accuracies over Landsat alone (Draper et al., 2014; Bourgeau-Chavez et al., 2017; Hribljan et al., 2017).
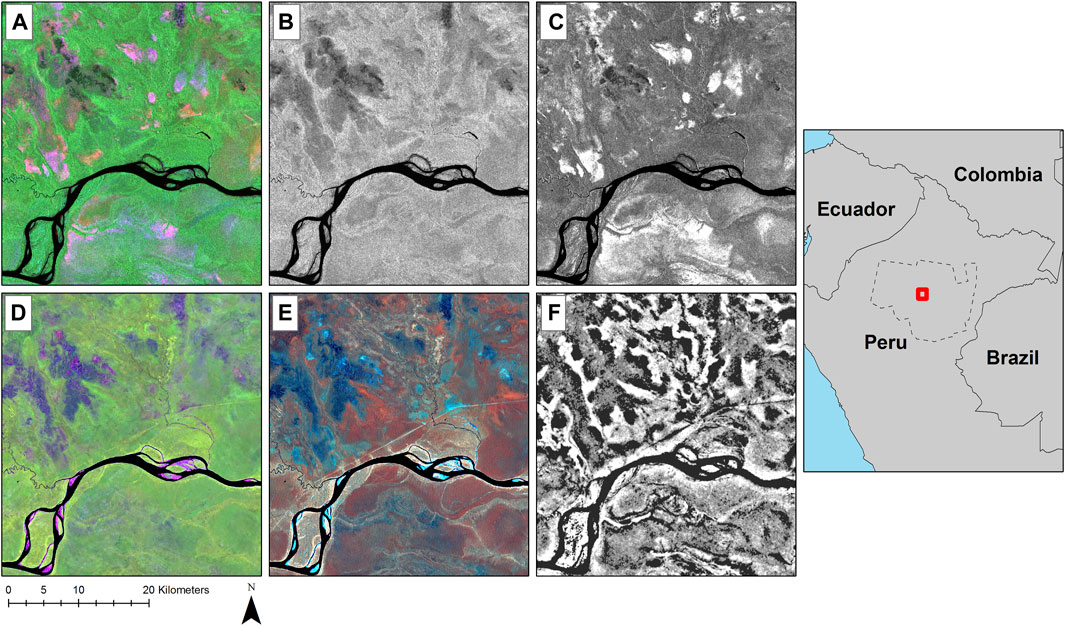
FIGURE 3. Examples of the input Pastaza Marañón Foreland Basin (PMFB) SAR and Optical datasets from the red box of the location map: (A) PALSAR false color composite with high-water L-HH (red), low-water L-HV (green), and low-water L-HH (blue); (B) PALSAR low-water L-HV; (C) PALSAR PCA1; (D) Landsat 2001 bands 5 SWIR (red), 4 NIR (green), and 3 red (blue) (Hansen et al., 2013); (E) Landsat Draper et al. (2014) Mosaic circa 2010 bands 4 (red), 5 (green), 6 (blue), and (F) SRTM TPI with 20 cell radius resampled to 30 m.
Interpretation of the various input images in combination can provide insight into land cover types and hydrologic variation (Figure 3). Dynamic hydrologic conditions are noticeable in Figure 3A, which is a false color composite of PALSAR high-water and low-water bands. The scattering occurring is a complex interaction of moisture content, vegetation structure and whether or not there is standing water. Areas appearing as shades of orange in Figure 3A represent vegetated areas that are exhibiting higher backscatter in the high-water L-HH image, likely due to flooding, while areas appearing pink exhibit high backscatter in both the high-water and the low-water L-HH image dates. We can infer that soil moisture or flooding was relatively higher in the pink areas than in green areas of the image in both seasons. In the low-water-HV image (Figure 3B), brighter areas correspond to higher biomass forests, while darker shades of grey correspond with open-canopied forbs and graminoid plants. Black areas, representing very low backscatter levels, show water features or saturated bare soils. Areas with high biomass (high L-HV) and wet conditions (high L-HH) likely represent forested wetlands, while similar areas with lower biomass are likely open wetlands. The machine learning classifier is trained for the various ecotypes and their respective backscatter signatures and reflectance based on field data.
The multi-date, multi-sensor map (hereafter referred to as multi-date map) was produced from 12 data layers including mosaics of the PALSAR PC1, PALSAR Low-water Season (L-HH and L-HV), PALSAR High-water Season (L-HH), SRTM TPI, and the 2000 (4 bands) and 2010 (3 bands) Landsat-5 mosaics. The map using the single date of Landsat and PALSAR imagery, similar to the Draper et al. (2014) map, had seven input layers including the PALSAR low-water season mosaic (L-HH and L-HV as well as a ratioed layer HH/HV), Landsat-5 2010 mosaic and SRTM DEM (not the TPI). Draper et al. (2014) used the 50 m PALSAR mosaic from JAXA, which is no longer available. Thus, we needed to reproduce that layer. From our reconnaissance of the image archive in comparison to the mosaic shown in Draper et al. (2014), most of the images appeared to be from the low-water season, thus we chose that as input to the RF classifier. For direct comparison of the single date and multi-date products we used the Random Forest classifier for both. Note, that we are not trying to exactly reproduce the Draper map, but to test if adding multi-seasonal optical and SAR images and a TPI improves the map accuracy. Thus, we focus on using the same input training and testing data and single versus multiple season images and compare the results.
Random Forests (Breiman, 2001), a machine learning classifier, was used for both peatland ecotype map classifications. Random Forests is a robust method that can be applied to a large area with consistency. It comprises multiple decision trees generated from a random subset of input training data and bands. Once the forest of decision trees is created, an individual pixel’s classification is determined by which class receives the most “votes” across all decision trees. One advantage of the algorithm is that it can easily handle missing attributes, such as cloud obscured pixels, as decision trees built without the missing attributes can be used to classify the compromised data.
Data products showing deforestation in the study region were available from Peru’s Ministry of the Environment (MINAM) through the GeoBosques platform (http://geobosques.minam.gob.pe/). The deforestation product was created using Landsat data and a supervised decision tree classification approach to represent annual forest loss from 2001 to 2011 (Potapov et al., 2014). An updated version of the product from MINAM representing years from 2001 to 2018 was used for this analysis. Since our maps are based on imagery from circa 2000 to 2010, we focused on the deforestation occurring after 2010.
To determine if proximity to waterways or roads has an effect on deforestation of each forest class, buffers were calculated around each of the rivers and roads in 1-km increments, and area for each mapped class was calculated within those buffers.
To assess if post-2010 deforested areas within the PMFB that were near rivers were a result of natural causes due to river meandering or appeared to be human-caused (i.e., forest harvesting), we selected a random set of 100 deforestation locations and used image interpretation of high-resolution imagery in Google Earth and ArcMap to determine what percent appeared to be human versus natural caused. This assessment was conducted using the most recent imagery available first, and for instances where the cause of the change to the river and surrounding land was not immediately obvious or if the most recent imagery was cloudy or of poor quality, we used multi-year imagery from Google Earth.
In order to better estimate the mean carbon stocks in the peatlands, we used a stratified estimator to calculate peatland cover area based on our error matrix (Olofsson et al., 2013). The mapped area of peatlands estimated from a pixel counting approach (counting pixels allocated to a map class and multiplying by the area of the pixel) may be quite different from the actual area on the ground due to weighted errors of omission and commission. While it is not possible to map where these errors are located, the actual area or adjusted area of each land cover class can be estimated using the error matrix and the percentage of area of each land cover class in the map (Olofsson et al., 2013). The assumptions for calculating adjusted area include having a random, systematic, or stratified random sample of ground truth points (Olofsson et al., 2013). Our ground truth samples were randomly selected from our training sites, which were sampled by several other researchers from accessible sites within a reasonable walking distance from a road or waterway (a necessary constraint due to remoteness of our study area). Peatland C storage across the mapping area was determined by summing the product of the total adjusted mapped peatland area for each peatland vegetation classification and the upper and lower limits of the C stock per area for each peatland vegetation type (palm swamp peatland, pole forest peatland, and open peatland) using the equation below from Draper et al. (2014) and Page et al. (2011):
where CP is total peatland carbon pool (Pg), v represents total number of peatland ecosystems, Dp is peat thickness (m), ρp is dry bulk density (kg/m3), Cp is carbon concentration (percentage mass of carbon in dry peat), AGCp is above-ground carbon (kg/m2), and Ap is area (m2). Field-based estimates from Draper et al. (2014) were used for the peat thickness, dry bulk density, carbon concentrations, and AGC for each peatland type. We report the contribution of each peatland vegetation type to aboveground, belowground, and total peatland C storage. Errors were propagated along the computations.
All statistical analyses were conducted in R statistical software version 1.3.1056.
To assess the accuracy of each of the ecotype maps produced using Random Forests, twenty percent of training polygons were withheld from classification and used for validation. Whole polygons were randomly selected and reserved with priority to field-verified polygons.
This approach was used because the out-of-box validation of Random Forests does not represent an independent dataset for validation (Bourgeau-Chavez et al., 2015; Millard and Richardson, 2015).
To assess whether different ecotypes were being harvested preferentially in the deforestation analysis, a chi-square goodness of fit test was applied. This test allowed us to assess whether an ecotype was deforested more or less preferentially based on a null model of its availability on the landscape. Thus, we compared ratios of observed area deforested in each ecotype and expected values of area deforested in each type based on the full distribution of area deforested.
The multi-date peatland map that included DEM-TPI (Figure 4) had an overall accuracy of 95% with individual peatland class producer’s accuracies (PA) of 85–99% (error of omission 0–15%) and user’s accuracies (UA) of 94–99% (errors of commission 1–6%, Tables 1, 2). Accuracy is calculated from a random sample of pixels within reserved validation polygons. An example of reserved polygons from each peatland class in comparison to the classified map is shown in Figure 5. The Random Forests (RF) classified map using the single date imagery and the SRTM DEM (after Draper et al., 2014) had 88% overall map accuracy, with individual peatland class producer’s accuracies of 69–88% (12–31% error of omission) and user’s accuracies of 77–99% (1–23% error of commission). The lowest accuracies for the single date map were with palm swamp peatland (77% UA, 70% PA) and pole forest peatland (77% UA, 75% PA). Draper et al., 2014 also reported lower accuracies for pole forest peatland (64% UA, 80% PA) using the Support Vector Machine (SVM) classifier and for the producer’s accuracy of palm swamp peatland (79% PA; 96% UA).
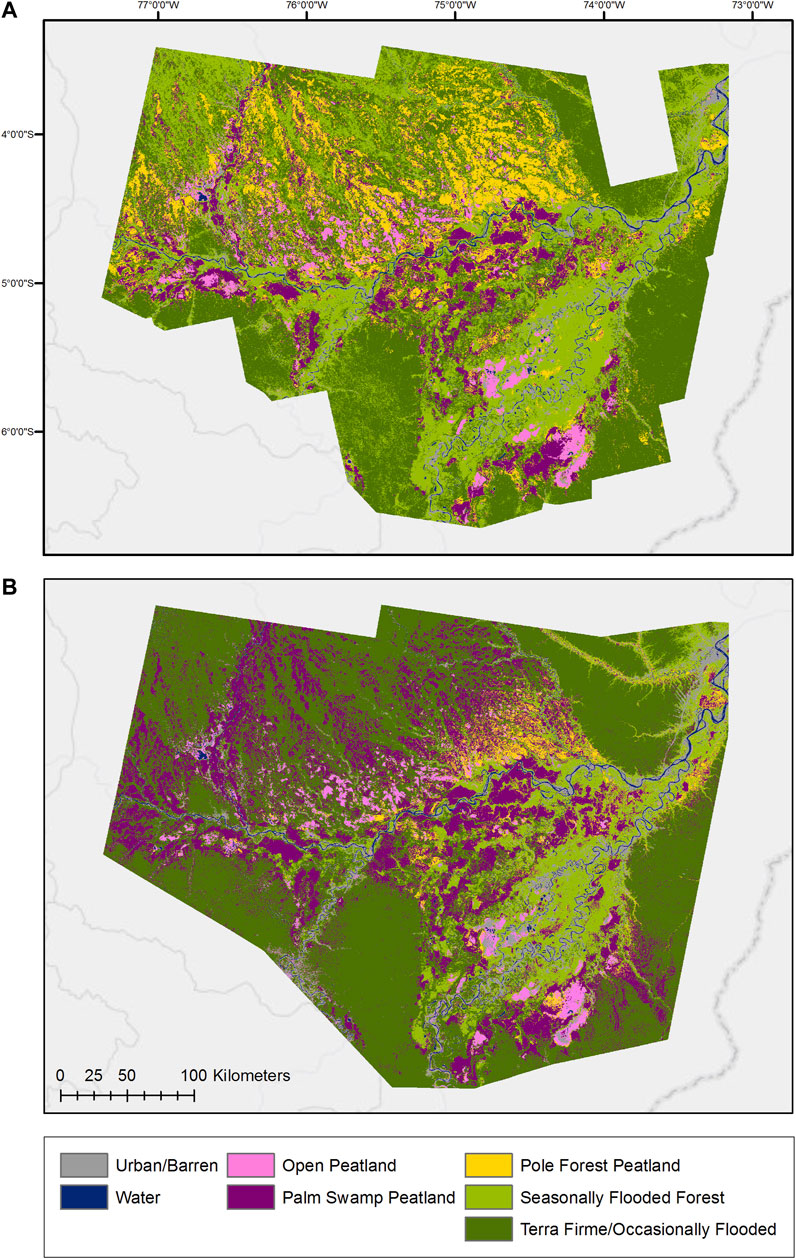
FIGURE 4. Pastaza Marañón Foreland Basin (PMFB) multi-date, multi-sensor Random Forests map (A) produced from PALSAR high-water season HH, low-water season HH and HV, and PCA1, combined with Landsat-5 2000 (Hansen), Landsat-5 2010 (Draper), and SRTM TPI; compared to single date Draper et al. (2014) map (B) using PALSAR low-water season HH and HV, ratioed HH/HV, Landsat-5 2010, and SRTM DEM.
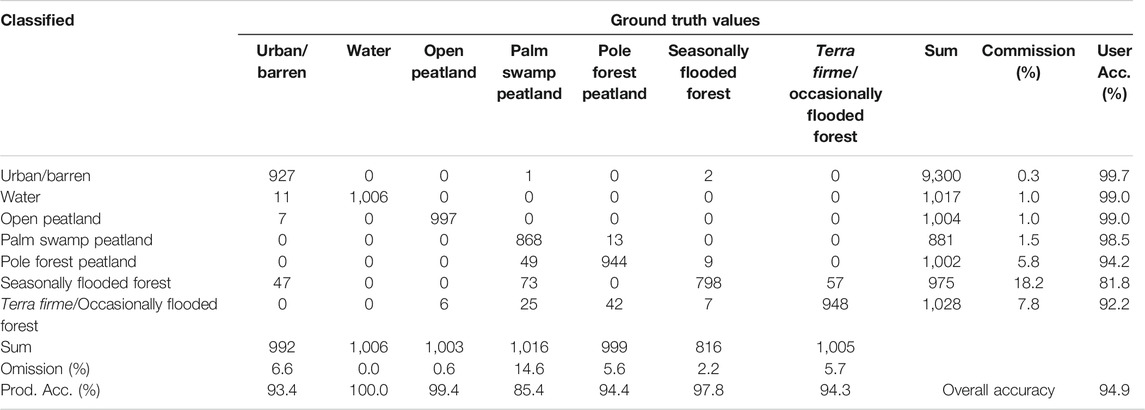
TABLE 1. Error matrix for the multi-date, multi-sensor map. Numbers are pixel counts randomly sampled from the validation polygons in each ecosystem class.
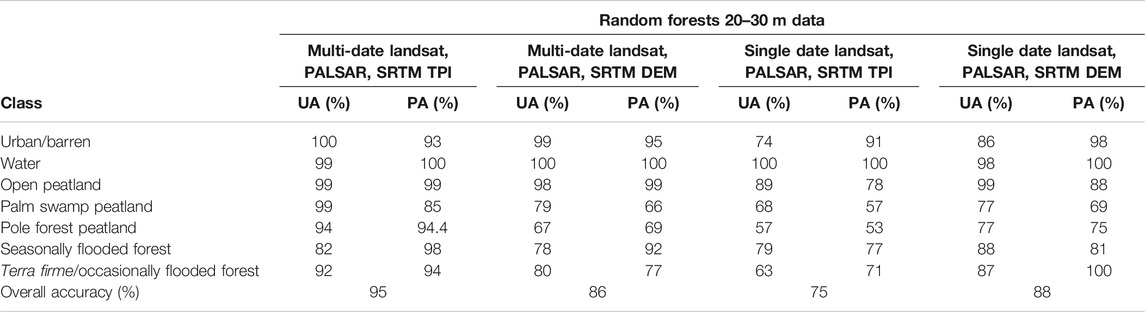
TABLE 2. Comparison of User’s (UA) and producer’s (PA) accuracies for the multi-date map vs. the single date map. Each are shown using the SRTM TPI or SRTM DEM in the RF classifier.
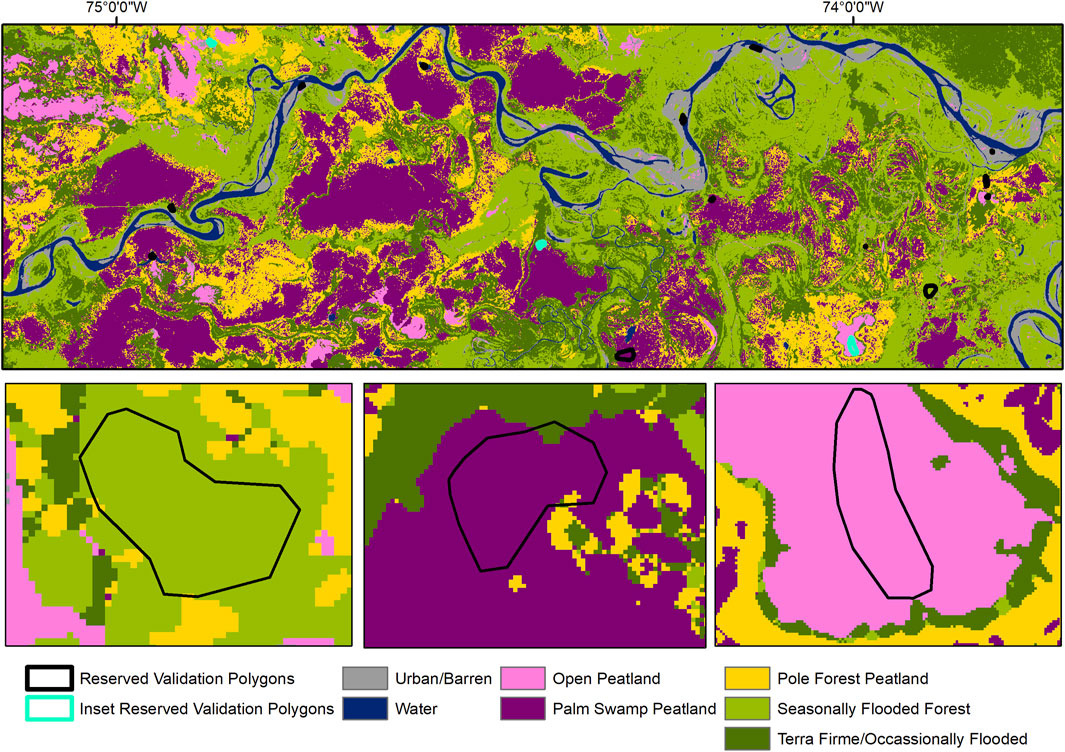
FIGURE 5. Example of validation polygons in Pastaza Marañón Foreland Basin (PMFB) seasonally flooded forest (left), palm swamp peatland (center), and open peatland (right) compared to the multi-date map classification. Accuracy assessment was calculated from a random sample of pixels within each cover type’s reserved validation polygons.
With any map product, it is important to also review the map to see if it appears correct based on knowledge of the landscape and comparison to other maps. Figures 4, 6 show a direct comparison between the actual Draper et al., 2014 map (recolored) and the new multi-date product. The single date Draper map (2014) has much less pole forest peatland and seasonally flooded forest than the multi-date map. The single date RF map we created is consistent with the SVM product published in Draper et al., 2014, but we show the Draper et al. (2014) map in Figures 4, 6 for direct comparison. The single date Draper et al. (2014) map shows large amounts of palm swamp peatland and Terra firme in place of pole forest peatland and seasonally flooded forest, respectively (Figures 4, 6).
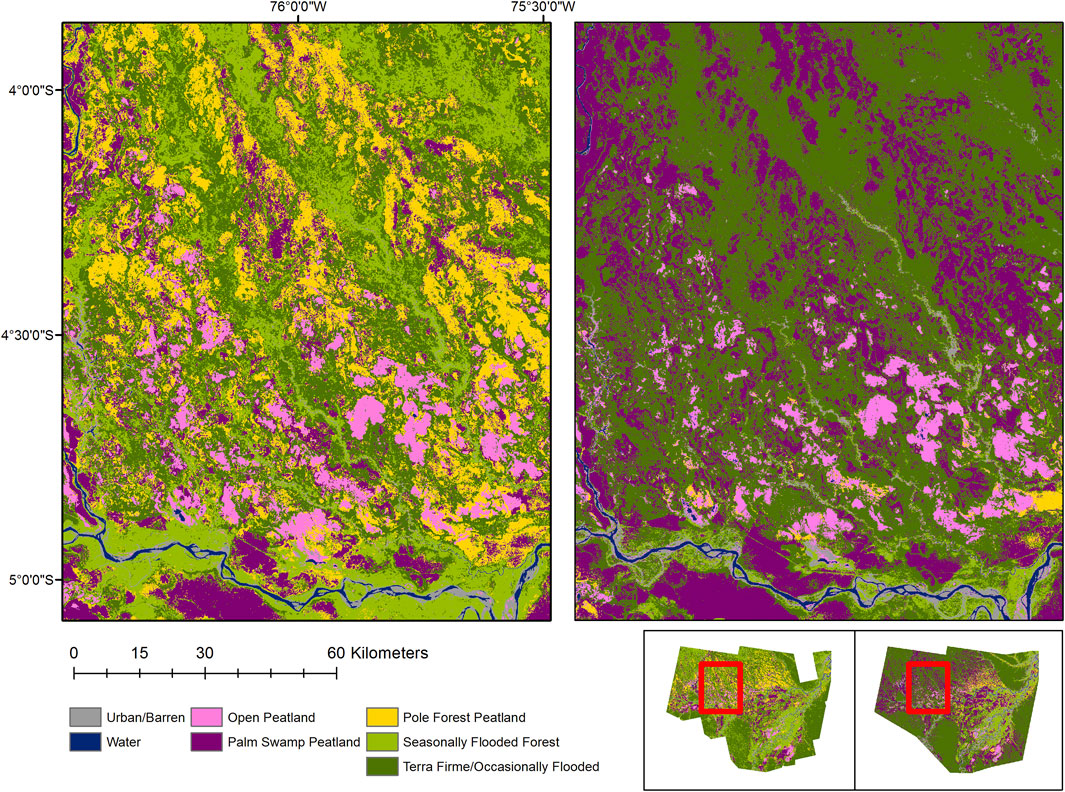
FIGURE 6. Pastaza Marañón Foreland Basin (PMFB) zoomed-in comparison of multi-date SAR-optical-TPI map product (left) to Draper remote sensing layers single date SAR-optical-DEM (right) both in Random Forests. This map highlights differences in the distribution of Pole forest peatland, Palm swamp peatland and Seasonally flooded forest.
A comparison of SRTM DEM and TPI was conducted for each of the maps, single date and multi-date (Table 2). The accuracies were much lower for the multi-date map with the DEM rather than the TPI, while the single date map had reduced accuracy with the TPI. The peatland and non-peatland classes drop by 10–20 percentage points when using the TPI in the single date map. For the multi-date map, open peatland stays about the same with TPI or DEM in the model. However, the map is improved when including the TPI instead of the DEM for palm swamp peatland with an increase by 18–19 percentage points in accuracy with the TPI. Similarly, pole forest peatland increases by 27–28 percentage points and even Terra firme/occasionally flooded forest increases slightly in accuracy (Table 2) with the TPI in the multi-date map.
A review of band importance within RF was conducted by class for the single date (DEM) and multi-date (TPI) maps (Figure 7). In all cases the Landsat optical bands had high importance. For the single date map, out of seven input bands, the SRTM DEM was the most important variable for determining Terre firme and pole forest, it was second in importance for open peatland and fourth for palm swamp and seasonally flooded forest. Without the second date of PALSAR to help in distinguishing these peatland/non-peatland types, the classifier appears to have been reliant on the DEM to distinguish lowland from upland. For the single-date map, PALSAR low-water HV was third in importance for pole forest, but for the other classes it was fifth or sixth in importance. This contrasts with the multi-date map where PALSAR low-water HV was the most important variable for pole forest and TPI was last out of 12 input bands. For palm swamp, PALSAR PCA1 was third in importance and TPI is ninth of the 12 input bands. For terre firme, TPI is 12th. Only for open peatland does TPI seem to be of significant importance, where it is sixth, PALSAR low-water HV was fifth.
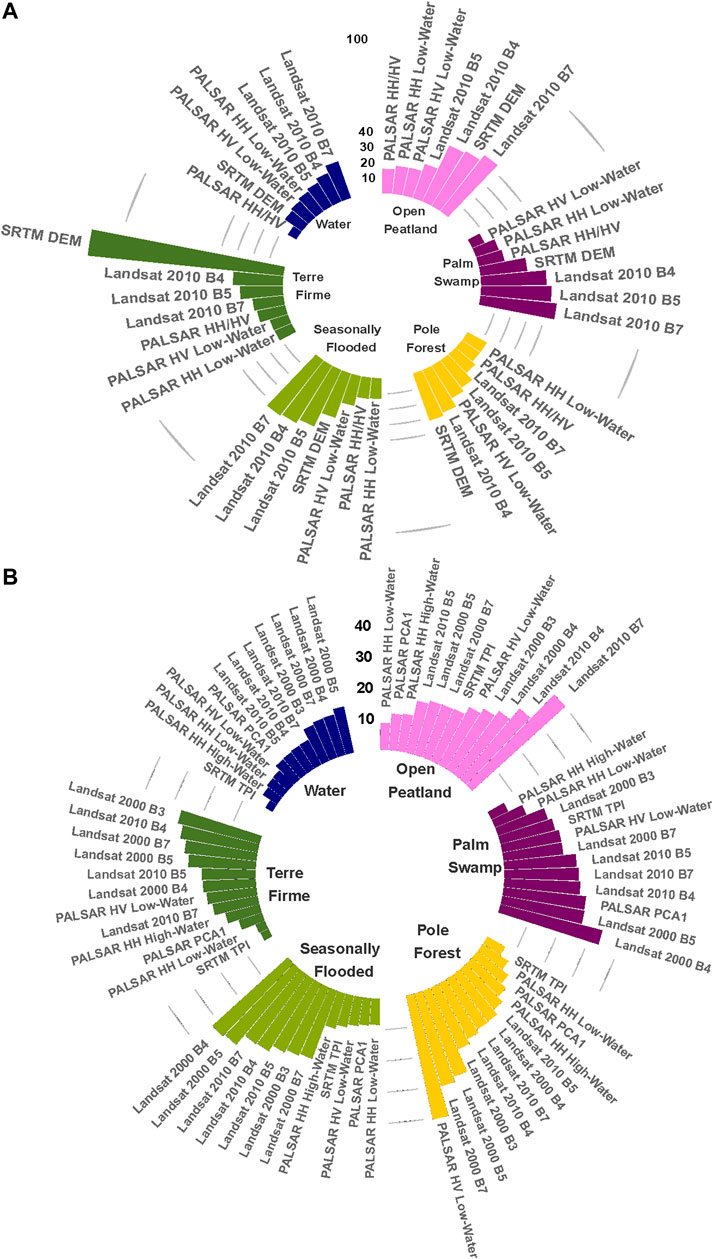
FIGURE 7. Plots of mean decrease in accuracy from the random forests classifier for each Pastaza Marañón Foreland Basin (PMFB) land cover type: for the single date map (A) and multi-date map (B). All classes are shown except urban/barren which had all the Landsat classes as most important.
Using the multi-date map and adjusted area of each land cover class based on the error matrix and the percentage of area of each land cover class in the map (after Olofsson et al., 2013) resulted in 0.48 Pg of aboveground C, 3.88 Pg of belowground C, and a total C stock of 4.36 Pg (Table 3). These are higher contributions to aboveground, belowground and total peatland C across all peatland types than the Draper et al. (2014) map (Table 3). The total C stock increased by 35%, from 3.238 to 4.360 Pg. Based on the multi-date map, pole forest peatland contributed the most to the total C stock with 58% (2.551 Pg) of the total carbon, followed by palm swamp with 34% (1.476 Pg) and open peatlands with 8% (0.33 Pg) of the total C. These proportions greatly differed from the Draper et al. (2014) map where the palm swamp contributed the most with 65% (2.116 Pg) of total C, followed by pole forest with 26% (0.831 Pg) and then open peatland with 9% (0.291 Pg) of the total C.
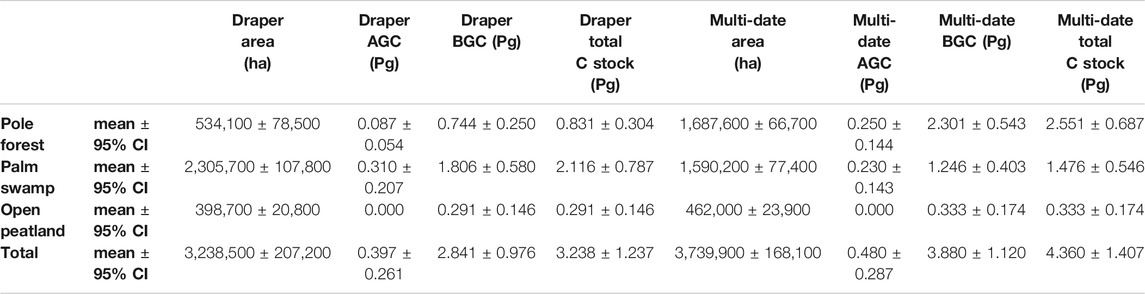
TABLE 3. Adjusted area of each land cover class estimated using the error matrix (Table 1) and the percentage of area of each land cover class in the map (after Olofsson et al., 2013), and C-stocks for above ground C (AGC), belowground C (BGC), and total C stock for the Draper et al. (2014) and the multi-date map. Note that we clipped the Draper et al. (2014) map (Figure 3) to match our area and thus the totals here are slightly lower than those reported in Draper et al. (2014).
Much of the classified pole forest area in the multi-date map was classified as palm swamp and Terra firme in the Draper et al. (2014) map (Figures 4, 6). This difference led to increased C storage in the multi-date map since pole forest peatlands are more carbon dense than palm peatlands (Draper et al., 2014). The classification of pole forest peatlands was greater than triple in area (from 534,100 to 1,687,000 ha) to that of the single date map, and this translated to a similar increase in contributions to C stocks (from 0.831 to 2.551 Pg of C), a 209% increase. Estimated palm swamp area decreased by 31% in the multi-date map from the Draper et a1. (2014) map (from 2,305,700 to 1,590,200 ha), resulting in a similar decrease in palm swamp carbon stocks (from 2.116 to 1.476 Pg). While less dramatic than the pole forest, the area, and C storage contributions of the open peatland also increased (15%) in the multi-date map (398,700 and 0.291 Pg of C to 462,000 and 0.333 Pg of C).
The yearly deforestation product produced by MINAM shows 87,268 ha of forest lost between 2010 and 2018 within the PMFB study area. The multi-date, multi-sensor map was intersected with the deforestation product to calculate yearly forest loss by forest cover type (Figure 8). We found that primarily seasonally flooded forest is being harvested each year, followed by terre firme and pole forest peatland. Palm swamp peatland is the least affected by deforestation between 2010 and 2018.
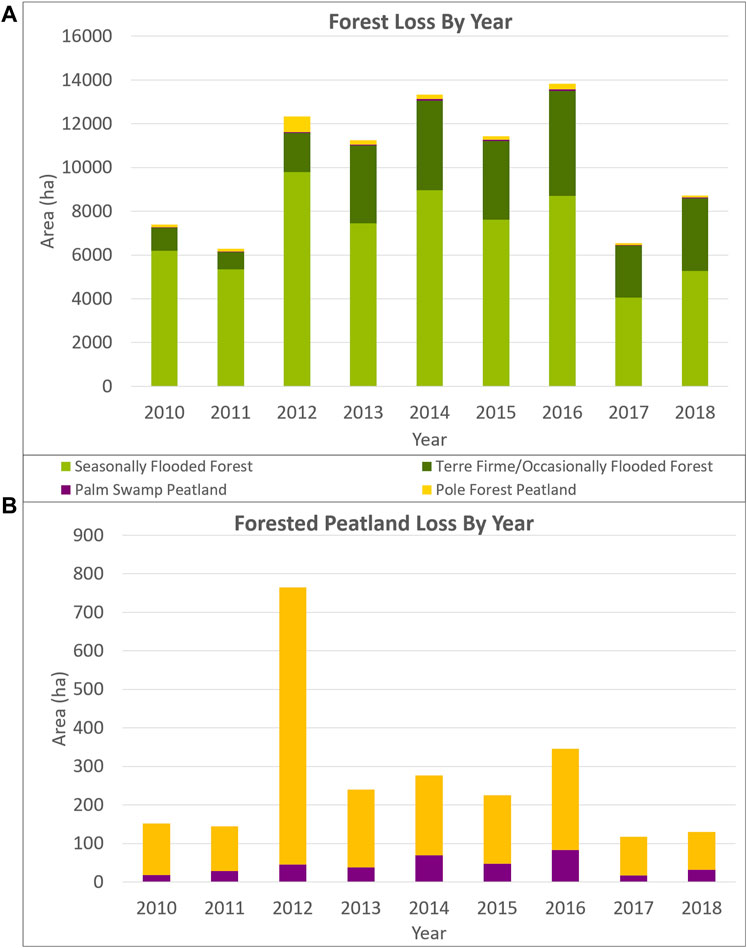
FIGURE 8. For the Pastaza Marañón Foreland Basin (PMFB): (A) Forest loss by class for each year from 2010 to 2018. (B) Forest loss by peatland class for each year (2010–2018). Note the large y-axis change in area for peatland forest loss (B) in comparison to all forest loss (A).
An analysis of preferential harvesting given the availability of cover types on the landscape was assessed with a chi-square goodness of fit test. We found that seasonally flooded forest is deforested at a much higher than expected rate given its availability on the landscape (Figure 9). Terra Firme, palm swamp peatland and pole forest peatland are all observed to be deforested less than expected based on their total distribution (Figure 9). Pole forest peatlands and palm swamp peatlands accounted for 12.3 and 11.9% of forested area in the classified map, respectively, while they accounted for only 2.2 and 0.4% of the deforested areas. Similarly, Terra firme/occasionally flooded forest accounted for 46.2% of the mapped area, yet only accounted for 27.8% of the deforested area. In contrast, seasonally flooded forest comprised 29.4% of the mapped area while accounting for 69.5% of the deforested area between 2010 and 2018.
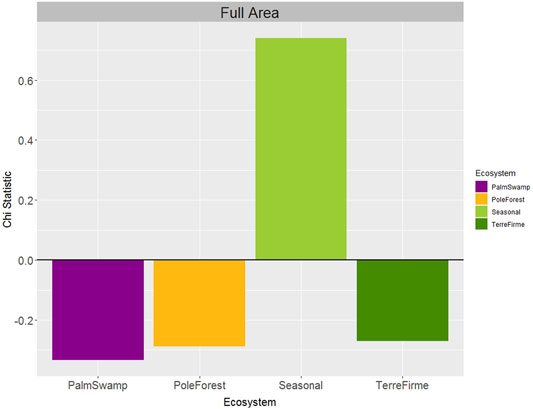
FIGURE 9. Chi-gram showing residuals for the four Pastaza Marañón Foreland Basin (PMFB) forested classes.
The MINAM deforestation maps show that significant forest loss occurred along the road between the largest cities of Iquitos and Nauta as well as along roads near other towns, such as San Lorenzo and Yurimaguas. However, given the absence of roads in most of the area, most forest loss appears to occur along the river corridors (Figure 10). The Ucayali and Marañón have numerous large tributaries flowing into them, creating a vast network of streams and rivers throughout the region allowing navigation. Satellite imagery and MINAM products show that agricultural and timber harvest activity is clearly concentrated in these corridors (Figure 10).
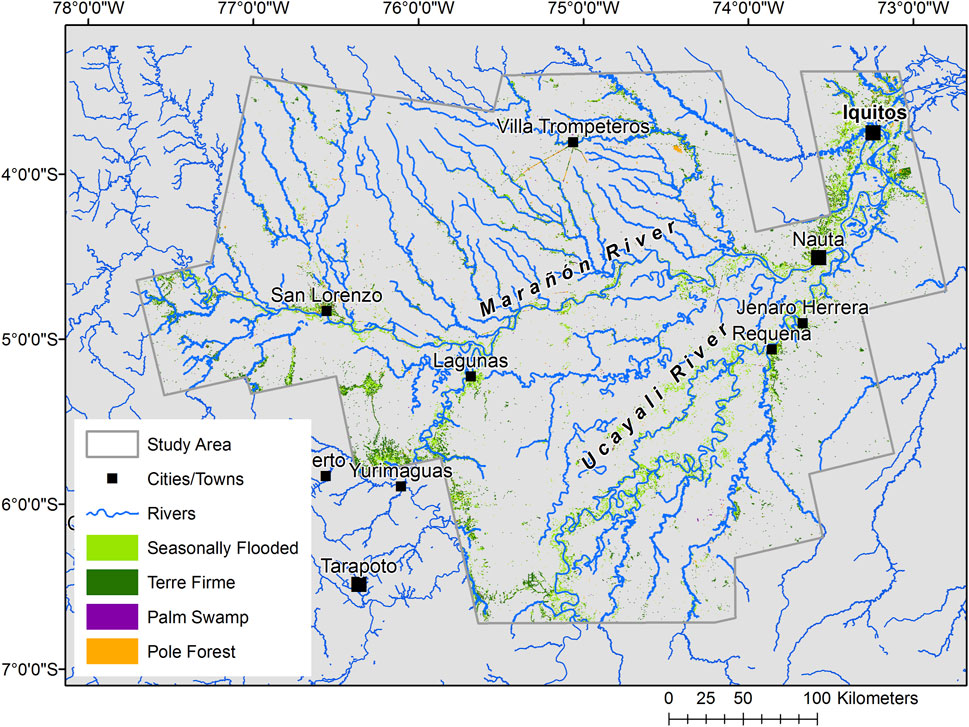
FIGURE 10. Deforested areas in relation to rivers and large settlements in the Pastaza Marañón Foreland Basin (PMFB) study area, color coded by ecotype.
An analysis of the distance of deforestation from roads and rivers (Figure 11) demonstrates that of the area classified as deforested between 2010 and 2018, 38,725 ha (42.5% of total deforested area) occurred less than 1 km from a river or a road (Figures 11A,B). Of these deforested areas within 1 km of rivers and roads, 88.8% was classified as seasonally flooded forest. Thus, it is not surprising that it is the cover type most affected. Since seasonally flooded forests occur along the meandering rivers which are dynamically changing, a visual inspection of the forest loss along rivers was conducted to determine if changes appeared to be due to harvest or natural changes. Potapov et al. (2014) reported that 6% of the gross forest loss mapped was due to flooding or river meander, but a majority of loss (92.2%) occurred as a result of clearing for agriculture. To assess this in the MINAM maps of 2010–2018 and within the PMFB, we chose 100 random deforested locations within 1 km of the waterways to determine probable causes of forest loss and found through image interpretation (Figure 12) that 32% were associated with flooding or river meander while the remainder were likely attributed to anthropogenic disturbance. Thus, the loss of seasonally flooded forests appears to be a combination of natural change due to dynamic hydrologic conditions and anthropogenic change due to timber harvesting (Figure 12), with a greater percentage due to the latter.
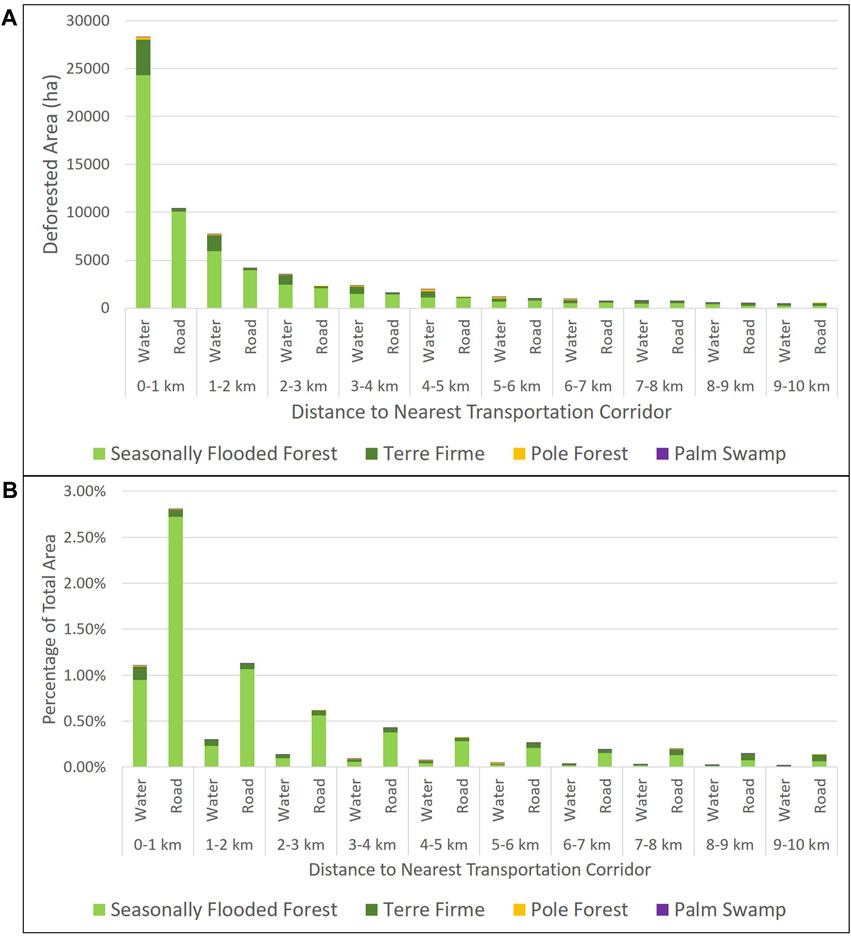
FIGURE 11. (A) Actual area of PMFB deforestation with proximity to rivers (water) or roads in 1 km increments by ecotype; (B) percentage of deforested areas by ecotype relative to the total available area of that ecotype in 1 km increments.
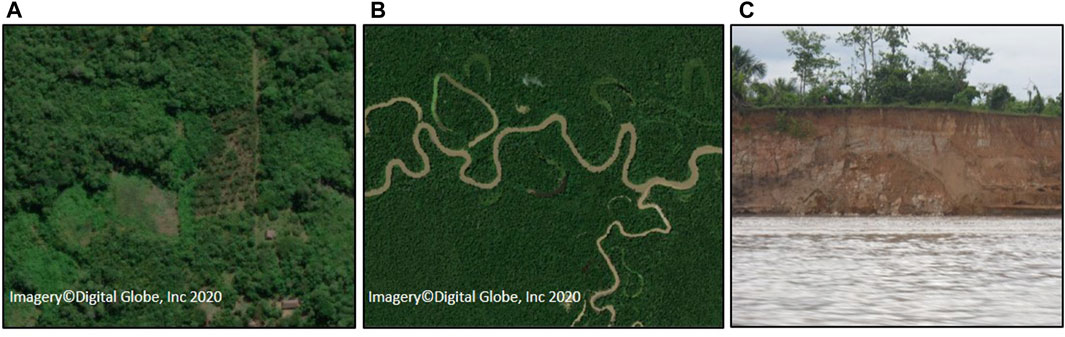
FIGURE 12. Digital globe images of forest clearing with plantation (A); meandering rivers (B), and a field photo example of erosion/forest loss from a meandering river (C); all in the Pastaza Marañón Foreland Basin (PMFB).
The PMFB multi-date map showed improvement in statistical accuracy as compared to the single date map for all of the peatland and non-peatland ecotype classes. We attribute this to the inclusion of low- and high-water season SAR images in the multi-date map which provides information about seasonal hydrological dynamics, i.e., inter-seasonal changes in the extent of inundation and soil moisture. Similarly, use of multiple dates of SAR and Landsat imagery resulted in improved peatland map accuracies in boreal peatland ecotypes (Bourgeau-Chavez et al., 2017) and tropical mountain peatland systems (Hribljan et al., 2017). The results of the band importance (mean decrease in accuracy) plots (Figure 7) for the single-date vs. multi-date maps showed that the inclusion of two seasons of data reduced the importance of SRTM greatly across many of the classes. In particular, for pole forest, the SRTM DEM had the greatest importance for the single date map, and for the multi-date map PALSAR L-HV was of greatest importance and the SRTM TPI moved to 12th.
The multi-date map resulted in over 1.1 million ha greater area of pole forest peatland mapped than Draper et al. (2014). This increased area is particularly noticeable in the northern part of the study area where field data were sparse. Pole forest peatland was the class Draper et al. (2014) had the most difficulty mapping. It had the lowest accuracies in the SVM map (Draper et al., 2014), with Draper reporting 36% commission and 20% omission error estimated from their field data. Although this was slightly improved in the RF single date map of this study, using 20–30 m resolution data and an expanded field training dataset (23% commission and 25% omission error), the multi-date map made significant improvement in mapping this class (<6% commission and omission error). The increase in mapped area of pole forest peatland resulted in a correspondingly large decrease in the palm swamp peatland class. The multi-season map shows palm swamp peatland to be more closely associated with large and dynamic rivers which better matches how they were described in Draper et al. (2014). The open peatlands are geographically similar in both maps. The multi-date map also showed differences in areas mapped for the two forested non-peatland classes, seasonally flooded forest and Terra firme, in comparison to the single-date and Draper et al. (2014) maps.
Another class that has large changes in the multi-season map product is the seasonally flooded forest, which increased largely by mapping into areas previously mapped as Terra firme in Draper et al. (2014). With a single date of SAR data, it is difficult to distinguish the seasonally flooded forest from the Terra firme class, likely accounting for the large differences, particularly in the northern and western parts of the study area. Draper et al. (2014) reported a 20% omission error in their map for seasonally flooded forest. They found that their SAR-optical-SRTM mapping of seasonally flooded forest had lower user’s accuracy than what was mapped with Landsat alone or Landsat and PALSAR. It was the only ecotype for which they did not have improvement by adding PALSAR and SRTM.
The estimates of PMFB C stocks, based on the higher accuracy multi-date map, increased by 35% from a total of 3.238 (Draper et al., 2014) to 4.26 Pg C. The major contributor to the total C stock was pole forest peatland with 58% (2.551 Pg), followed by palm swamp with 34% (1.476 Pg) and open peatlands with 8% (0.33 Pg). This increase in total C stocks from the previous estimates (Draper et al., 2014) is primarily attributed to the 1,153,500 ha increase in area of pole forest peatland mapped (216% increase in area) and the fact that pole forest peatlands are more carbon-dense than palm swamp peatlands (Draper et al., 2014). Although the area of palm swamp forest that was mapped decreased by 715,500 ha (31% decrease), this is more than offset by the 216% increase in mapped area of pole forest peatland. This large difference in C stock estimates between the two mapping approaches warrants additional field collection in the pole forest peatlands. Coincident research by Coronado et al. (2021), including field surveys of pole forest peatland, also expands the distribution of peatland pole forest in the PMFB, but mainly along the Tigre River. Understanding the vegetation structural differences in pole forest peatlands across the region, as well as the underlying ecohydrological processes resulting in their formation in low and high flow areas need further investigation, warranting additional field data collection in the upper PMFB, especially in the northwestern part of the basin associated with the geomorphologically distinct Pastaza fan. Our results exemplify the need for high resolution (<30 m), multi-season SAR and optical imagery for high accuracy maps, and complementary field data across all peatland types to produce more accurate and high confidence estimates of peatland carbon.
Our efforts to understand vulnerability of these peatlands to deforestation activities showed that between 2010 and 2018, 38.4% of deforestation occurred less than 1 km from a river in predominantly (83%) seasonally flooded forest (Figure 11C). This ecotype is deforested more than expected given its availability on the landscape (chi-square goodness of fit, Figure 9). Seasonally flooded forest is primarily known as non-peat forming, although in a few cases extensive peat deposits have been found (Lahteenoja et al., 2009b; Draper et al., 2014). The field data have been too sparse to quantify what differentiates peat storing and non-peat storing seasonally flooded forests and their contributions to C stocks. We found overall low rates of deforestation in the peatlands of this region which is consistent with previous studies (e.g., Lilleskov et al., 2019). The extensive peatlands and other wetlands, and resulting absence of roads in most of the area, combined with the intensity of seasonal water table changes associated with the larger rivers, and the relatively low timber value of peatland tree species (Roucoux et al., 2017) has likely focused recent deforestation to the non-peatland river corridors.
Partitioning natural and human disturbance indicated that a majority of the disturbance was anthropogenic, although immediately along rivers natural disturbance was also an important contributor. The large rivers meander substantially, leading to erosion and forest loss (Figure 12). These riparian corridors are a focus of economic activity, including slash and burn agriculture, creating small clearings in the forest for temporary plantations (Figure 12). Although, as detected by the Potapov et al. (2014) method, deforestation within the peatlands is limited, these forests are also subject to economically unsustainable degradation caused by cutting of female M. flexuosa to harvest their fruits (Hergoualc’h et al., 2017; Bhomia et al., 2019; Hergoualc’h et al., 2020). We expect that as road networks at the margins of the peatland area expand, associated rates of deforestation will likely increase dramatically (Coronado et al., 2020). The extent to which this happens will depend on the type and enforcement of land protections put in place including those via: 1) Ramsar designation or as national reserves with associated ecological-economic zoning; 2) initiatives to provide alternative approaches for the harvest of palm fruits (Roucoux et al., 2017; Lilleskov et al., 2019); and 3) other national initiatives to protect the carbon in peatlands, such as those likely to arise from current efforts to establish nationally determined contributions (NDCs) to the Paris Agreement (Murdiyarso et al., 2019; López Gonzales et al., 2020; Wiese et al., 2021).
The huge reservoir of organic carbon currently harbored in tropical peatlands is particularly vulnerable to loss due to both climate and land use change (López Gonzales et al., 2020). Much of the literature on peatlands focuses on the need to accurately map their distribution, measure peat stores in the field and to monitor change for C accounting. While we demonstrate the gains in map accuracy through the use of multi-date L-band SAR and optical imagery, there remains a need for additional field sampling to improve estimates and reduce uncertainties in quantifying the distribution of peatlands and carbon stocks. In addition, there is a growing need to monitor effects of climate and land use change in peatlands. Land use change is predicted to play a key role in future shifts of peatlands from a net sink to a net source of C to the atmosphere (Loisel et al., 2021). As global populations continue to grow, pressures on peatlands for deforestation and farming will likely ensue, but the need to conserve peat may outweigh these pressures through policy and management decisions (Loisel et al., 2021). In the present study, the 216% increase in area of pole forest peatland mapped in the PMFB, taken together with our understanding of the greater vulnerability of pole forest peatland to drainage (because of their position above regional water tables—peat domes), raises concerns of an even larger scale on the potential impact of peatland drainage and land use change (e.g., to tree plantations) in the region. This fact is an important consideration for national efforts to incorporate peatlands into government policy.
The raw data and map products supporting the conclusion of this article will be made available by the authors upon request.
LB-C, EL, and RC contributed to conception and design of the study. LB-C led all aspects including the development of the peatland mapping approach, SG, FD, and JH organized the field database. FD, BZ, KH, RB, and OL provided field data. SG processed the imagery, produced the peatland type maps and conducted the statistical accuracy assessment and band importance. DL performed the statistical peatland area adjustment and calculated C stocks with equations from FD. MB produced the DEM TPI and intersected the peatland maps with the deforestation maps and conducted the analysis. LB-C, RC, and EL wrote the first draft of the manuscript. All authors contributed to manuscript revision, read, and approved the submitted version.
This research was supported by USAID Sustainable Landscapes Program funding to the Sustainable Wetlands Adaptation and Mitigation Program (SWAMP), a collaborative effort led by the USDA Forest Service and CIFOR.
BZ was employed by the company Spatial Informatics Group, LLC.
The remaining authors declare that the research was conducted in the absence of any commercial or financial relationships that could be construed as a potential conflict of interest.
The reviewer TB declared a past co-authorship with the authors / with several of the authors RD, EL, and KH to the handling editor.
All claims expressed in this article are solely those of the authors and do not necessarily represent those of their affiliated organizations, or those of the publisher, the editors and the reviewers. Any product that may be evaluated in this article, or claim that may be made by its manufacturer, is not guaranteed or endorsed by the publisher.
We would like to thank all those who contributed field data, including Jeffrey van Lent and Christopher Baraloto, as well as Eleanor Serocki for assisting with data processing, Mary Ellen Miller for assisting with adjusting the areas mapped using the accuracy and Jeremy Graham and Ryan Adkins for assisting with producing figures.
The Supplementary Material for this article can be found online at: https://www.frontiersin.org/articles/10.3389/feart.2021.676748/full#supplementary-material
Adeney, J. M., Christensen, N. L., Vicentini, A., and Cohn‐Haft, M. (2016). White‐Sand Ecosystems in Amazonia. Biotropica 48 (1), 7–23. doi:10.1111/btp.12293
Bhomia, R. K., van Lent, J., Rios, J. M. G., Hergoualc’h, K., Coronado, E. N. H., and Murdiyarso, D. (2019). Impacts of Mauritia Flexuosa Degradation on the Carbon Stocks of Freshwater Peatlands in the Pastaza-Marañón River Basin of the Peruvian Amazon. Mitig Adapt Strateg. Glob. Change 24 (4), 645–668. doi:10.1007/s11027-018-9809-9
Bourgeau-Chavez, L. L., Smith, K. B., Brunzell, S. M., Kasischke, E. S., Romanowicz, E. A., and Richardson, C. J. (2005). Remote Monitoring of Regional Inundation Patterns and Hydroperiod in the Greater Everglades Using Synthetic Aperture Radar. Wetlands 25 (1), 176–191. doi:10.1672/0277-5212(2005)025[0176:rmorip]2.0.co;2
Bourgeau-Chavez, L., Endres, S., Battaglia, M., Miller, M., Banda, E., Laubach, Z., et al. (2015). Development of a Bi-National Great lakes Coastal Wetland and Land Use Map Using Three-Season PALSAR and Landsat Imagery. Remote Sensing 7 (7), 8655–8682. doi:10.3390/rs70708655
Bourgeau-Chavez, L. L., Endres, S., Powell, R., Battaglia, M. J., Benscoter, B., Turetsky, M., et al. (2017). Mapping Boreal Peatland Ecosystem Types from Multitemporal Radar and Optical Satellite Imagery. Can. J. For. Res. 47 (4), 545–559. doi:10.1139/cjfr-2016-0192
Bourgeau-Chavez, L. L., Endres, S. L., Graham, J. A., Hribljan, J. A., Chimner, R. A., Battaglia, M. J., et al. (2018). “Mapping Peatlands in Boreal and Tropical Ecoregions,” in Comprehensive Remote Sensing. Editor S. Liang (Oxford: Elsevier), 6, 24–44. 9780128032206. doi:10.1016/b978-0-12-409548-9.10544-5
Bourgeau-Chavez, L. L., Graham, J. A., Endres, S., French, N. H. F., Battaglia, M., Hansen, D., et al. (2019). ABoVE: Ecosystem Map, Great Slave Lake Area, Northwest Territories, Canada, 1997-2011. Oak Ridge, Tennessee, USA: ORNL DAAC. doi:10.3334/ORNLDAAC/1695
Chimner, R. A., Bourgeau-Chavez, L., Grelik, S., Hribljan, J. A., Clarke, A. M. P., Polk, M. H., et al. (2019). Mapping Mountain Peatlands and Wet Meadows Using Multi-Date, Multi-Sensor Remote Sensing in the Cordillera Blanca, Peru. Wetlands 39, 1057–1067. doi:10.1007/s13157-019-01134-1
Honorio Coronado, E., Mercado Torres, A., Del Castillo Torres, D., Dávila Cardoso, N., Martín Brañas, M., Ríos Torres, S., et al. (20202020). Impacto De La Construcción De La Carretera Iquitos-Saramiriza Sobre Los Bosques Y Turberas Del Río Tigre, Loreto, Perú. Folia Amaz 29 (1), 65–87. Available at: http://revistas.iiap.gob.pe/index.php/foliaamazonica/article/view/493/554. doi:10.24841/fa.v28i2.493
Honorio Coronado, E. N., Hastie, A., Reyna, J., Flores, G., Grández, J., Lähteenoja, O., et al. (2021). Intensive Field Sampling Increases the Known Extent of Carbon-Rich Amazonian Peatland Pole Forests. Environ. Res. Lett. 16 (7), 074048. Available at: https://iopscience.iop.org/article/10.1088/1748-9326/ac0e65/meta. doi:10.1088/1748-9326/ac0e65
Crowson, M., Warren‐Thomas, E., Hill, J. K., Hariyadi, B., Agus, F., Saad, A., et al. (2019). A Comparison of Satellite Remote Sensing Data Fusion Methods to Map Peat Swamp Forest Loss in Sumatra, Indonesia. Remote Sens Ecol. Conserv 5 (3), 247–258. doi:10.1002/rse2.102
Dargie, G. C., Lewis, S. L., Lawson, I. T., Mitchard, E. T. A., Page, S. E., Bocko, Y. E., et al. (2017). Age, Extent and Carbon Storage of the central Congo Basin Peatland Complex. Nature 542 (7639), 86–90. doi:10.1038/nature21048
Draper, F. C., Roucoux, K. H., Lawson, I. T., Mitchard, E. T. A., Honorio Coronado, E. N., Lähteenoja, O., et al. (2014). The Distribution and Amount of Carbon in the Largest Peatland Complex in Amazonia. Environ. Res. Lett. 9 (12), 124017. doi:10.1088/1748-9326/9/12/124017
Draper, F. C., Honorio Coronado, E. N., Roucoux, K. H., Lawson, I. T., Pitman, N. C. A., Phillips, O. L., et al. (2018). Peatland Forests Are the Least Diverse Tree Communities Documented in Amazonia, but Contribute to High Regional Beta-Diversity. Ecography 41 (8), 1256–1269. doi:10.1111/ecog.03126
Gumbricht, T., Roman‐Cuesta, R. M., Verchot, L., Herold, M., Wittmann, F., Householder, E., et al. (2017). An Expert System Model for Mapping Tropical Wetlands and Peatlands Reveals South America as the Largest Contributor. Glob. Change Biol. 23 (9), 3581–3599. doi:10.1111/gcb.13689
Hamilton, S. K., de Souza, O. C., and Coutinho, M. E. (1998). Dynamics of Floodplain Inundation in the Alluvial Fan of the Taquari River (Pantanal, Brazil). SIL Proc. 1922-2010 26 (3), 916–922. doi:10.1080/03680770.1995.11900852
Hansen, M. C., Potapov, P. V., Moore, R., Hancher, M., Turubanova, S. A., Tyukavina, A., et al. (2013). High-Resolution Global Maps of 21st-Century Forest Cover Change. Science 342, 850–853. Data available on-line from: http://earthenginepartners.appspot.com/science-2013-global-forest. doi:10.1126/science.1244693
Henebry, G. M. (1997). “Advantages of Principal Components Analysis for Land Cover Segmentation from SAR Image Series,” in Proceedings of Third ERS Symposium on space at the service of our environment, Noordwijk, The Netherlands, March 14–21, 1997 (SP-414, ESA), 175–178.
Hergoualc’h, K., Dezzeo, N., Verchot, L. V., Martius, C., van Lent, J., Aguila-Pasquel, J. D., et al. (2020). Spatial and Temporal Variability of Soil N2O and CH4 Fluxes along a Degradation Gradient in a Palm Swamp Peat forest in the Peruvian Amazon. Glob. Change Biol. 26, 7198–7216. doi:10.1111/gcb.15354
Hergoualc'h, K., Gutiérrez-Vélez, V. H., Menton, M., and Verchot, L. V. (2017). Characterizing Degradation of palm Swamp Peatlands from Space and on the Ground: An Exploratory Study in the Peruvian Amazon. For. Ecol. Manage. 393, 63–73. doi:10.1016/j.foreco.2017.03.016
Hribljan, J. A., Suarez, E., Bourgeau-Chavez, L., Endres, S., Lilleskov, E. A., Chimbolema, S., et al. (2017). Multidate, Multisensor Remote Sensing Reveals High Density of Carbon-Rich Mountain Peatlands in the Páramo of Ecuador. Glob. Change Biol. 23, 5412–5425. doi:10.1111/gcb.13807
Jensen, J. R. (1996). “Principal Component Analysis,” in Introductory Digital Image Processing; A Remote Sensing Perspective. Editor K.C. Clarke (Upper Saddle River, NJ: Prentice-Hall), 172–179.
Lähteenoja, O., and Page, S. (2011). High Diversity of Tropical Peatland Ecosystem Types in the Pastaza‐Marañón basin, Peruvian Amazonia. J. Geophys. Res. Biogeosciences 116 (G2), 15. doi:10.1029/2010jg001508
Lähteenoja, O., Ruokolainen, K., Schulman, L., and Oinonen, M. (2009a). Amazonian Peatlands: An Ignored C Sink and Potential Source. Glob. Change Biol. 15 (9), 2311–2320. doi:10.1111/j.1365-2486.2009.01920.x
Lähteenoja, O., Ruokolainen, K., Schulman, L., and Alvarez, J. (2009b). Amazonian Floodplains Harbour Minerotrophic and Ombrotrophic Peatlands. Catena 79, 140–145. doi:10.1016/j.catena.2009.06.006
Lähteenoja, O., Reátegui, Y. R., Räsänen, M., Torres, D. D. C., Oinonen, M., and Page, S. (2012). The Large Amazonian Peatland Carbon Sink in the Subsiding Pastaza-Marañón Foreland basin, Peru. Glob. Change Biol. 18 (1), 164–178. doi:10.1111/j.1365-2486.2011.02504.x
Leifeld, J., and Menichetti, L. (2018). The Underappreciated Potential of Peatlands in Global Climate Change Mitigation Strategies. Nat. Commun. 9 (1), 1071–1077. doi:10.1038/s41467-018-03406-6
Lilleskov, E., McCullough, K., Hergoualc’h, K., del Castillo Torres, D., Chimner, R., Murdiyarso, D., et al. (2019). Is Indonesian Peatland Loss a Cautionary Tale for Peru? A Two-Country Comparison of the Magnitude and Causes of Tropical Peatland Degradation. Mitig Adapt Strateg. Glob. Change 24, 591–623. doi:10.1007/s11027-018-9790-3
López Gonzales, M., Hergoualc’h, K., Angulo Núñez, Ó., Baker, T., Chimner, R., del Águila Pasquel, J., et al. (2020). What Do We Know about Peruvian Peatlands? Occasional Paper 210. Bogor, Indonesia: CIFOR.
Loisel, J., Gallego-Sala, A. V., Amesbury, M. J., Magnan, G., Anshari, G., Beilman, D. W., et al. (2021). Expert Assessment of Future Vulnerability of the Global Peatland Carbon Sink. Nat. Clim. Chang. 11, 70–77. doi:10.1038/s41558-020-00944-0
Maltby, E., and Proctor, M. C. F. (1996). “Peatlands: Their Nature and Role in the Biosphere,” in Global Peat Resources. Editor E. Lappalainen (Jyska: International Peat Society and Geological Survey of Finland), 11–19.
Margono, B. A., Bwangoy, J.-R. B., Potapov, P. V., and Hansen, M. C. (2014). Mapping Wetlands in Indonesia Using Landsat and PALSAR Data-Sets and Derived Topographical Indices. Geo-spatial Inf. Sci. 17 (1), 60–71. doi:10.1080/10095020.2014.898560
Miettinen, J., Shi, C., and Liew, S. C. (2011). Deforestation Rates in Insular Southeast Asia between 2000 and 2010. Glob. Change Biol. 17 (7), 2261–2270. doi:10.1111/j.1365-2486.2011.02398.x
Miettinen, J., Shi, C., and Liew, S. C. (2016). Land Cover Distribution in the Peatlands of Peninsular Malaysia, Sumatra and Borneo in 2015 with Changes since 1990. Glob. Ecol. Conservation 6, 67–78. doi:10.1016/j.gecco.2016.02.004
Millard, K., and Richardson, M. (2015). On the Importance of Training Data Sample Selection in Random Forest Image Classification: A Case Study in Peatland Ecosystem Mapping. Remote Sensing 7 (7), 8489–8515. doi:10.3390/rs70708489
Moomaw, W. R., Chmura, G. L., Davies, G. T., Finlayson, C. M., Middleton, B. A., Natali, S. M., et al. (2018). Wetlands in a Changing Climate: Science, Policy and Management. Wetlands 38 (2), 183–205. doi:10.1007/s13157-018-1023-8
Murdiyarso, D., Lilleskov, E., and Kolka, R. (2019). Tropical Peatlands Under Siege: The Need for Evidence-Based Policies and Strategies. Mitig Adapt Strateg. Glob. Change 24 (4), 493–505. doi:10.1007/s11027-019-9844-1
Olofsson, P., Foody, G. M., Stehman, S. V., and Woodcock, C. E. (2013). Making Better Use of Accuracy Data in Land Change Studies: Estimating Accuracy and Area and Quantifying Uncertainty Using Stratified Estimation. Remote Sensing Environ. 129, 122–131. doi:10.1016/j.rse.2012.10.031
Page, S. E., Rieley, J. O., and Banks, C. J. (2011). Global and Regional Importance of the Tropical Peatland Carbon Pool. Glob. Change Biol. 17 (2), 798–818. doi:10.1111/j.1365-2486.2010.02279.x
Potapov, P. V., Dempewolf, J., Talero, Y., Hansen, M. C., Stehman, S. V., Vargas, C., et al. (2014). National Satellite-Based Humid Tropical forest Change Assessment in Peru in Support of REDD+ Implementation. Environ. Res. Lett. 9 (12), 124012. doi:10.1088/1748-9326/9/12/124012
Roucoux, K. H., Lawson, I. T., Baker, T. R., Del Castillo Torres, D., Draper, F. C., Lähteenoja, O., et al. (2017). Threats to Intact Tropical Peatlands and Opportunities for Their Conservation. Conservation Biol. 31 (6), 1283–1292. doi:10.1111/cobi.12925
Warren, M., Hergoualc'h, K., Kauffman, J. B., Murdiyarso, D., and Kolka, R. (2017). An Appraisal of Indonesia's Immense Peat Carbon Stock Using National Peatland Maps: Uncertainties and Potential Losses from Conversion. Carbon Balance Manag. 12 (1), 12. doi:10.1186/s13021-017-0080-2
Weiss, A. (2001). “Topographic Position and Landforms Analysis,” in Poster presentation, ESRI user conference, San Diego, CA, July 9–13, 2001.
Wiese, L., Wollenberg, E., Alcántara-Shivapatham, V., Richards, M., Shelton, S., Hönle, S. E., et al. (2021). Countries’ Commitments to Soil Organic Carbon in Nationally Determined Contributions. Clim. Pol. 21, 1005–1019. Available at: https://www.tandfonline.com/doi/full/10.1080/14693062.2021.1969883. doi:10.1080/14693062.2021.1969883
Xu, J., Morris, P. J., Liu, J., and Holden, J. (2018). PEATMAP: Refining Estimates of Global Peatland Distribution Based on a Meta-Analysis. Catena 160, 134–140. doi:10.1016/j.catena.2017.09.010
Keywords: peatland, tropical, Amazon, carbon, deforestation, PALSAR, L-band radar
Citation: Bourgeau-Chavez LL, Grelik SL, Battaglia MJ, Leisman DJ, Chimner RA, Hribljan JA, Lilleskov EA, Draper FC, Zutta BR, Hergoualc’h K, Bhomia RK and Lähteenoja O (2021) Advances in Amazonian Peatland Discrimination With Multi-Temporal PALSAR Refines Estimates of Peatland Distribution, C Stocks and Deforestation. Front. Earth Sci. 9:676748. doi: 10.3389/feart.2021.676748
Received: 05 March 2021; Accepted: 14 October 2021;
Published: 05 November 2021.
Edited by:
Hanna Silvennoinen, Norwegian Institute of Bioeconomy Research (NIBIO), NorwayReviewed by:
Flor Salvador, Natural History Museum, PeruCopyright © 2021 Bourgeau-Chavez, Grelik, Battaglia, Leisman, Chimner, Hribljan, Lilleskov, Draper, Zutta, Hergoualc’h, Bhomia and Lähteenoja. This is an open-access article distributed under the terms of the Creative Commons Attribution License (CC BY). The use, distribution or reproduction in other forums is permitted, provided the original author(s) and the copyright owner(s) are credited and that the original publication in this journal is cited, in accordance with accepted academic practice. No use, distribution or reproduction is permitted which does not comply with these terms.
*Correspondence: Laura L. Bourgeau-Chavez, bGNoYXZlekBtdHUuZWR1
Disclaimer: All claims expressed in this article are solely those of the authors and do not necessarily represent those of their affiliated organizations, or those of the publisher, the editors and the reviewers. Any product that may be evaluated in this article or claim that may be made by its manufacturer is not guaranteed or endorsed by the publisher.
Research integrity at Frontiers
Learn more about the work of our research integrity team to safeguard the quality of each article we publish.