 A. E. El Emam
 A. Lethy
 Ali M. Radwan
 A. Awad
- 1Department of Geomagnetic and Geoelectric, National Research Institute of Astronomy and Geophysics (NRIAG), Helwan, Egypt
- 2Department of Geodynamics, National Research Institute of Astronomy and Geophysics (NRIAG), Helwan, Egypt
An archeological study using magnetic and ground-penetrating radar methods has been performed at the Dahshour region (Giza, Egypt), where various covered structures have not been found because of the long coercion of the zone under the military specialists. Dahshour is the southern extension of the Saqqara and Giza Pyramids plateau, around 25 km south of Cairo. The area is known for its colored pyramids—the white, red, and black pyramids, and the famous Bent Pyramid. Four investigation sites were chosen around the Bent Pyramid complex. The geophysical investigation has revealed the presence of some buried structures made up of mud bricks such as tombs, mud-brick walls, causeway, and remains of an ancient temple. Numerous limestone blocks were also detected. The study indicates the possible existence of an older valley temple made up of mud bricks and confirms the existence of another causeway that led to the Nile Valley. To protect the Egyptian heritage around this vital area, a detailed computation of the current crustal stress/strain state has been performed by taking into account all the available GPS observations. Achieved results indicated that the southern and the southeastern sectors of the investigated area are currently accumulating strain, and this means that there is a possibility for future earthquakes to occur around this vital archaeological area. Buried structures are preserved by confinement in the burial materials like a large mold. However, external load or stress can still cause damage. Therefore, during excavation, the stress should be reduced to avoid wall collapsing and structure damage. Therefore, it is recommended to start excavation from the stress direction from the southern side.
Introduction
Dahshour area is located southwest of Cairo (Figure 1A) within the Giza governorate, which is acclaimed for one of the seven world marvels, the pyramids of Giza. Dahshour is the southern extension of the Saqqara, and Giza Pyramids plateau is around 8 km south of Saqqara.
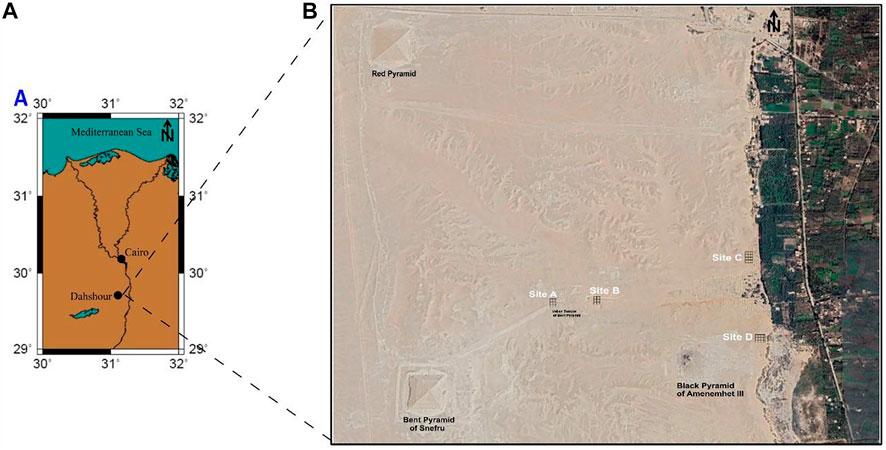
FIGURE 1. (A) Map of Egypt showing the location of Dahshour area. (B) Satellite image showing the study areas as represented by sites (A, B, C, and D) (reproduced from Google Earth).
The current study is conducted in the vast area between the scan locations of both Mekkawi et al. (2013) and Abdallatif et al. (2010). The study area belongs to the Bent Pyramid complex structure area (the selected survey sites are within the expected locations of these pyramid complex structures, e.g., causeway, valley Temple, funeral Temple, and burial chambers). The Bent Pyramid has a very important archeological value, as it was the first attempt to build a smooth-sided pyramid by King Sneferu (2613–2589 BC), whereas his son King Khufu (2589–2566 BC) built the most famous the Great Pyramid of Giza.
The Pharaohs recorded earthquakes and their destructive effects on their temples. They built their temples to withstand the earthquakes. However, these monuments cannot defeat nature and time; therefore, they require protection and preservation. Consequently, this study includes both archaeological investigations and hazard assessment at Dahshour area. Usually, seismic hazard assessment studies are performed for structures rising above the ground surface where they are usually affected by ground shaking. Such studies are usually based on earthquake catalogs. Jena et al. (2020) gave a complete review of seismic hazard assessment methods. However, for buried structures like walls, the ground static load and the causative stresses play a major role in structure damage, especially during the excavation process. Underground structures have a lower rate of damage due to ground shaking than surface structures (Hashash et al., 2001). Therefore, this study includes crustal deformation analysis to determine the stresses at Dahshour area.
After the occurrence of October 12, 1992, earthquake, which has a magnitude of 5.9 on the Richter scale at Dahshour area, 30 km southwest the center of Cairo city at a depth of about 23 km, causing 545 deaths, injuring 6,512, and making 50,000 people homeless (Hussein et al., 1996), the National Research Institute of Astronomy and Geophysics (NRIAG) in Egypt proposed programs to study the crustal deformation in and around the Greater Cairo area. In 1995, a high-precision GPS geodetic network consisting of eleven geodetic stations was established in and around the Greater Cairo area including the archaeological Dahshour area, and it has been extended and renewed during the period of the present study (Mahmoud et al., 1996). This is very important to compute the stress affecting the study area, especially around Dahshour, to assess the seismotectonic setting of this vital area. This study is the first work to address the stress hazard before excavation with a detailed map of the expected features and their orientation with the stress direction.
Historical and Archeological Background
Dahshour area is a very interesting site for both archaeological investigations and tourists. It retains a diversity of enormous archaeological structures such as the Bent Pyramid (2613–2589 BC during the rule of King Sneferu from the fourth Dynasty-Old Kingdom); it was the first attempt to build a smooth-sided pyramid, succeeded by the Red Pyramid (the first smooth-sided pyramid) rising to 104 m height, the White Pyramid of Amenemhat II (1929–1895 BC), the Black Pyramid of Amenemhat III (1860–1814 BC), and the Pyramid of Senusret III (1878–1839 BC) from the Middle Kingdom (12th and 13th dynasties). Dahshour additionally contains various landmarks identified with each pyramid, like funeral home sanctuaries and helper burial chambers for the relatives and supported authorities. There are likewise the Mastabas (a unique burial chamber structure) of different princesses and queens containing noticeable instances of Middle Kingdom goldsmiths, a large portion of which are currently in the Cairo Museum (Baines and Malek, 1992; Black and Norton, 1993).
The period of Sneferu witnesses a major evolution in the pyramid structure. It is well known that Sneferu built at least three pyramids that are still existing today (in Dahshour: the Bent Pyramid and the Red Pyramid, and in Faiyum: the Meidum Pyramid). Each pyramid was a step forward for the next with significant differences in the structure, materials, and design. Sneferu started with the Meidum pyramid, which was a step pyramid of sand and mud bricks covered with polished limestone. Only this pyramid has an associated mortuary temple. Finally, Sneferu constructed the Red Pyramid which is the first successfully constructed smooth-sided pyramid and the third largest pyramid in Egypt after those of Khufu and Khafre at Giza. The Red Pyramid complex contains mortuary and valley temples with a causeway in between. Nevertheless, the Bent Pyramid is a milestone in this progressive development in the pyramid’s architecture. Key features start to appear in the pyramid’s architecture, for example, using limestone as the main construction material in the pyramids, temples, and causeways.
Previous Work
Geophysical surveying in Dahshour area was spearheading work to investigate the related archeological designs, particularly since Dahshour zone has been blocked for logical work for quite a while due to the security vacuum following the 2011 uprising. In July 2019, Egypt opens the Bent Pyramid for tourism for the first time since 1965. Geophysical methods have made a critical commitment to archeology, especially, the nondestructive methods which are generally utilized in locations that loosen the requirement for conventional excavation. Several geophysical techniques can be utilized together or independently to diagram archeological constructions (David, 1995). Magnetic techniques and ground-penetrating radar “GPR” are two such apparatuses that have been utilized to portray archeological highlights (Hounslow and Chroston, 2002; Abdallatif et al., 2003). The magnetic technique has become a significant tool for the scientific examination of archeological sites. It was first utilized during the 1950s (Aitken et al., 1958) and has since become the main instrument in archeological prospection. It is a quick and compelling procedure for planning the appropriation of archeological remaining parts in the shallow subsurface (Clark, 1986; Clark, 1990; Scollar et al., 1990; Reynolds, 1997). A recent review of the application of the magnetic technique in the exploration of Egyptian archeology is given by Abdallatif et al. (2019).
The data are directly obtained, dealt with, and interpreted, utilizing high goal instruments. Numerous topographical and hydrological uses of the GPR have been portrayed by Davis and Annan (1989), Annan et al. (1991), Doolittle (1993). In like manner, the procedure has been effectively utilized in archeological investigations (Goodman, 1994; Goodman et al., 1995; Conyers and Goodman, 1997; Leckebusch, 2000; Tomizawa et al., 2000).
Many previous geophysical studies have been carried out in Dahshour area. Abdallatif et al. (2010) have conducted near-surface magnetic investigations using the FM36 magnetic gradiometer in the area east of the Amenemhat II pyramid. They scan an area of 340 m × 200 m, which comprises four major archaeological features of different shapes and sizes that mostly consist of mud bricks. These main structures are the causeway that connected the mortuary temple with the valley temple during the Middle Kingdom of the 12th Dynasty, the mortuary temple and its associated rooms, ruins of an ancient working area, and a Mastaba. This work was followed by an integrated geophysical survey conducted by Abbas et al. (2011). The ground-penetrating radar (GPR, SIR-2000), the electrical resistance meter (Geoscan RM15), and the electromagnetic profiler (GEM300) have been utilized to acquire some geophysical data within the area scanned by Abdallatif et al. (2010). These techniques have been applied to selected zones to investigate specific objects and oriented to solve the problems questioned by the local archaeological inspectors. The study conveyed a superior image of the whole measured site and helped to identify most of the detected artifacts. Furthermore, the margins of the causeway and its infrastructure have been perfectly delineated. However, the possible locations for the pyramid’s eastern entrance and the valley temple have been tentatively identified.
Mekkawi et al. (2013) conducted a conceptive work using a proton magnetic gradiometer to scan what is known as Mastaba (tomb) and Tell Athery (archeological hill) located to the south of the Bent Pyramid. The results indicated a distribution of some buried archeological features that are mostly tombs from the Old Kingdom.
Field Survey and Data Acquisition
The field survey was conducted in the study area to discover the archaeological structures made up of mud bricks and limestones such as tombs, temples, and walls. The sites were chosen close to existing or known archaeological features. Furthermore, site selection and their extensions were controlled by the ground topography and surface features. Two sites were surveyed to investigate the western and southern extensions of the valley temple of the Bent Pyramid. Meanwhile, another two sites were chosen to the east near the Nile Valley, where it was expected to have harbor and laborers’ accommodation and facilities during the construction process of Dahshour pyramids.
Typical pyramid complex in the Fourth Dynasty usually consists of a valley temple, a causeway, a mortuary temple, and the king’s pyramid. However, King Sneferu starts his ruling period by continuing building the Meidum Pyramid which seems never to have been completed. Beginning with Sneferu and to the 12th Dynasty, all pyramids had a valley temple, which is missing at Meidum. However, a mortuary temple was found under the rubble at the base of the Meidum Pyramid.
The remaining parts of what is believed to be the valley temple of the Bent Pyramid Complex of King Sneferu lie somewhere between the Pyramid of Sneferu and the Nile River (about 650 m northwest of the pyramid). Examination of the temple design and the features enclosed within it presumed that it is similar to the Meidum temple. In actuality, the Bent Pyramid’s prelude to the valley temple indicates that it is indeed somewhat a valley temple and a halfway funeral temple, containing components of both kinds of constructions, which makes it a unique design that resembles a transition in the construction strategy between the Third and the Fourth Dynasties. Since it is the principal temple associated with the pyramid complex, it has been explored archeologically (Baines and Malek, 1992). However, missing inscriptions and important features make archeologists believe that it has an associated complementary structure.
The temple is connected to the causeway from the west side and has a large opening on the eastern side that could connect it to the harbor. There may have been another causeway that led down to a harbor, but there are no excavated archaeological features that can prove this assumption yet (Hill, 2020).
Magnetic and GPR Data Acquisition
Acquisition Strategy
Four sites were surveyed using the vertical magnetic gradiometer FM36 (Geoscan Research, 1987). Each site was divided into small grids. The survey was conducted along parallel traverses with a station separation of 0.5 m. Standard working precautionary measures included instrument warm-up and site tidy up. A zero-reference point in a steady territory was chosen and utilized for instrument adjustment.
Powerful information obtaining is subject to a very much planned study and successful usage. Therefore, based on the magnetic survey results, two sites have been chosen to be further investigated using the GPR method. The survey was conducted using the SIR2000 instrument from GSSI with a monostatic antenna of a central frequency of 200 MHz. Each site is studied as one grid with a set of zigzag profiles. The offset distance between successive lines was 1 m. The radar was set up to procure 20 scans/m and a sampling rate of 512/trace over an absolute scope of 150 ns. A survey wheel that was utilized to control the studied distance and to trigger the electromagnetic wave was appended to the system.
Data Acquisition
Site (A)
Site A (Figure 1B) covers 120 m × 80 m (9600 m2) at the western side of the north–south–oriented valley temple of the Sneferu Bent Pyramid. The vertical magnetic gradient survey was conducted in a half-meter station separation and a 1-m traverse separation. The survey began with an area of 40 m × 80 m. In light of the outcomes obtained from this underlying region, the survey was stretched out to follow up recognized highlights, covering 20 grids altogether, with every grid being 20 m × 20 m. The estimations were signed into the instrument each half-meter on 1 m dispersed traverses. Working more than 2 days, 16,000 readings were gathered and put away in the FM36 memory. Unavailable areas were viewed as fake grids (the grid layout is presented in Supplementary Figure S1a).
The procured data were then introduced in gray scale (the raw data are presented in Supplementary Figure S1b). The acquired raw data appear as if they were taken from an aerial photography. The dark areas in the gray scale magnetic image (Supplementary Figure S1b) indicate positive anomalies, while the lighter areas indicate negative anomalies. It shows some archeological structures that could be made from mud brick. The vertical magnetic gradient over this site was ranged from −10 to 10 nT/m. The surface topography was practically flat and suitable for the gradiometer survey. The estimations were not diurnally amended because diurnal varieties barely influence gradient data. They additionally favor close-by sources, given the quick tumble off of magnetic gradient amplitudes (converse fourth force of distance for dipole sources).
Site (B)
Site B (Figure 1B) is situated on the eastern side of the valley temple of the Sneferu Bent Pyramid. The area covers 60 m × 40 m (2400 m2), which was divided into 10 grids, with each being 20 m × 10 m. This site was scanned in more detail than site A. The readings were signed each half-meter on half-meter spaced traverses. After working for more than 1 day, 8,000 readings were gathered and put away in the FM36 memory (see Supplementary Figure S2a for grid layout). The procured data were then introduced in gray scale (see Supplementary Figure S2b for raw data plot). The acquired raw data show an overall vertical magnetic gradient ranging between −200 and 60 nT/m.
Within Site B, a chosen area of 20 m × 40 m (see Supplementary Figure S5a) was further scanned using GPR to outline and follow the anomalies that appear in the magnetic survey. The GPR survey was carried out in the N–S direction along 20 zigzag profiles, with each being 40 m in length.
Site (C)
The investigation area covers 120 m × 40 m (4800 m2) (Figure 1B). The Magnetic survey covers 12 grids, with each being 20 m× 20 m. The estimations were signed into the instrument each half-meter on 1 m traverses. Working more than 2 days, 9,600 readings were gathered and put away in the FM36 memory (the grids' layout is presented in Supplementary Figure S3a). The obtained data were then introduced in gray scale (see Supplementary Figure S3b). The attained raw data have an overall vertical magnetic gradient ranging between −220 and 60 nT/m.
Additionally, an area of 40 m× 40 m at site C (see Supplementary Figure S5b) was scanned using GPR to correlate them with the magnetic results. The GPR survey was carried out in the E–W direction along 40 zigzag profiles with 40 m length.
Site (D)
This site covers an area of 10 m × 20 m (200 m2) (Figure 1). The survey covers one grid altogether. The estimations were signed into the instrument each half-meter on half-meter separated traverses. 800 readings were gathered and put away in the FM36 memory (see Supplementary Figure S4a). The procured data were then introduced in gray scale (see Supplementary Figure S4b) with an overall vertical magnetic gradient ranging between −60 and 40 nT/m.
GPS Data Acquisition
The field hardware incorporates receiver units and assistant gadgets like meteorological sensors, tribrachs with optical plummets, tribrach connectors, stands, compass, batteries, and other subordinate equipment. Geodetic receivers which perform exact baseline vector estimations should be thought of. Double recurrence receivers with P-code capacity are fundamental for the most exact positioning applications. The fieldworks of the GPS Greater Cairo geodetic network were completed by utilizing dual-frequency Trimble receiver 4,000 SSI with P-code and antennas compact L1/L2 with the ground plane. The Trimble receiver 4,000 SSI is naturally procured and tracks GPS satellites on the L1 and L2 stations. It additionally joins astoundingly low-noise code estimations with transporter and smoothing procedures to give exact position, velocity, and time solutions. Ten GPS campaigns from 2005 to 2011 were conducted with double-frequency Trimble 4000 SSI. The Greater Cairo network data of the ten GPS campaigns were handled utilizing Bernese V.5.0 (Dach et al., 2007).
Data Processing
Magnetic Data Processing
The raw magnetic data of sites (A, B, C, and D) are display magnetic impacts from numerous sources. Apart from the visible anomalies that appear at some parts of the images, most other archeologically critical peculiarities are not noticeable because of noise field abandons and other noise sources. To beat this, we actualized a handling arrangement that was recommended by the instrument producer. A run-of-the-mill preparing arrangement at first is to show and audit the data, cut outrageous qualities from the data, recognize the impact of major topographical and ferrous features, eliminate data assortment absconds, and at last, improve and present the archeological response. The introductory section diminishes the impact of iron spikes. Defect removal includes i) removal of grid slope, ii) removal of grid discontinuities, and iii) removal of traverse stripe effects. Improvement and introduction incorporate i) evacuation of iron spikes and ii) smoothing and insertion. The processing was conducted using the Geoplot software (Geoscan Research, 2005). More details about each processing step are provided by Geoscan Research (2005). The request for preparing can be vital for certain capacities—for instance, despiking ought to be performed before applying a low-pass channel to stay away from the spike energy spreading out. Some of the processing functions, however, may not be advisable to apply to the data as they could introduce artifacts and remove the archaeological features.
A few grids may show a progression of stripes orientated in the traverse direction. This impact is known as traverse stripping and was caused because of a slight contrast in the base level of substitute traverses. This difference could occur because of instrument tilting and the change in carrying angle while measuring in successive traverses. The difference in the mean gradient values between grids was corrected using a zero mean grid (ZMG) function, whereas the effect of traverse stripping was corrected using the zero mean traverse (ZMT) function. A low-pass filter (LPF) was utilized to stifle higher frequency parts, like noise in the data, and simultaneously save low frequency and enormous scope spatial anomalies, subsequently upgrading and smoothing the huge weak features. The low-pass filter with perusing window size two delivered the best outcomes and shows unmistakably the enormous, extended anomaly.
GPR Data Processing
The overall goal of data preparation, as applied to GPR, is to deliver an image that can be deciphered to distinguish buried targets. The gathered data were handled in 1D and 2D (time slicing). Manataki et al. (2015) gave a good review of the GPR practice and processing for archaeological investigation.
All through the 1D analysis, the data were exposed to noise removal and signal upgrade preparation. Four preparing steps were played out: a) Zero time adjustment (static shift): it is applied to connect zero time with zero depth, so any time offset because of instrument recording was eliminated before interpretation. b) X flip profile: it is applied to flip the profiles in the x-direction (reverse profiles). c) Background removal: filters follow up on the picked number of traces to take out transiently the predictable clamor from the entire profile and consequently perhaps make the signals visible. It additionally smothers horizontal coherent energy. Its impact is additionally to underscore signals, which differ laterally, for example, diffractions. d) Band-pass Butterworth: a low-pass vertical filter of 300 MHz was applied to remove the high-frequency signals, while a high-pass vertical filter of 80 MHz was applied to remove low-frequency signals. Filtering the data typically removed the unwanted background noise resulting from the electronic ringing of the antenna and power transmission line located in the survey area, etc. The GPR data processing was conducted using the Reflexw software package (Sandmeier, 2016).
GPS Data
First, the Greater Cairo network data were processed together with the Helwan (PHLW) permanent station and one of the IGS stations, so we used it as a fixed point.
Second, the data were processed session-by-session, and normal equations for all the sessions of each campaign were stored. Then, these normal equations were combined to obtain the final solutions for each campaign. Repeatability of station coordinates of the different campaigns was calculated to estimate the precision of the coordinates; hence, crustal deformation rates were estimated. The data were processed annually; that is, the parameters of the crustal deformation were computed for every year and finally for the total period from 2005 to 2011 to compute the mean velocity at each station.
Main Results and Discussion
Magnetic Survey Results
Site (A)
The processed data image (Figure 2A) mirrors the principal discoveries uncovered by the magnetic technique in the zone situated on the western side of the Bent Pyramid valley temple. Four fundamental anomalies have been distinguished as S1, S2, S3, and S4 (Figure 2A), which could reflect four archeological constructions covered around there. We expect the major part of these constructions to be made up of mud bricks. Our assumption depends on the positive extremity of the magnetic anomalies of these designs, the surface archeological record of the site, and the historical backdrop of old Egyptian constructions.
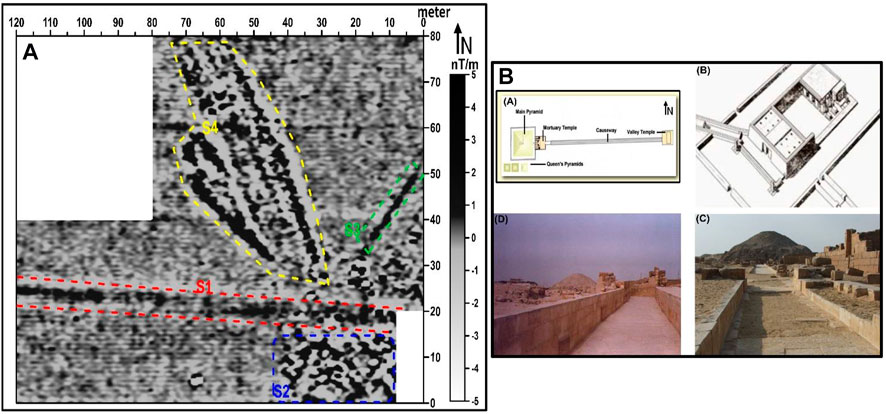
FIGURE 2. (A) Gradiometer data of site A, after applying the processing functions. This plot shows the interested magnetic anomaly zones. S1, S2, S3, and S4 delineate the main discoveries in this study. (B) (a) A sketch of Sneferu Pyramid shows the causeway connects to the valley temple. (b) The ruins of the valley temple. (c) and (d) Examples for two causeways of two exposed pyramids at Saqqara (the causeway consists of parallel walls made up of limestone).
Structure S1 is an elongated high magnetic anomaly of about 100 m long and 5 m in width. This is strongly proposed to be part of the causeway. The causeway is a very important archaeological feature (Figure 2B) as it interfaces the funeral home temple with the valley temple, and its walls contain the popular pyramid contents composed by the most recent Egyptian Dynasty.
Structure S2 is represented by scattered positive magnetic anomalies that cover an area of about 30 m × 20 m which is considerably large enough to resemble some collapsed structure. This structure is not clear for deciding its archaeological origin.
Structure S3 is represented by a connected positive magnetic anomaly. This anomaly is about 20 m long and is parallel to the valley temple wall. This feature may be a mud-brick wall.
Structure S4 is represented by several dissected and ambiguous negative and positive anomalies with different shapes and sizes. However, its edges resemble straight lines. This structure is hazy and not clear for deciding its archaeological origin. However, the western edge of this anomaly is at a right angle to the detected feature S3.
Site (B)
The processed image (Figure 3A) shows an archaeological structure S1, which may be an extension of the causeway in the direction of the Nile Valley. The feature is resampled by scattered positive anomalies that are bounded by negative anomalies. This suggested that the positive (dark color) part of feature S1 is made up of mud, and the boundary negative anomaly (light color) is made up of limestone. Therefore, the GPR survey was proposed in this location to confirm the nature of these findings.
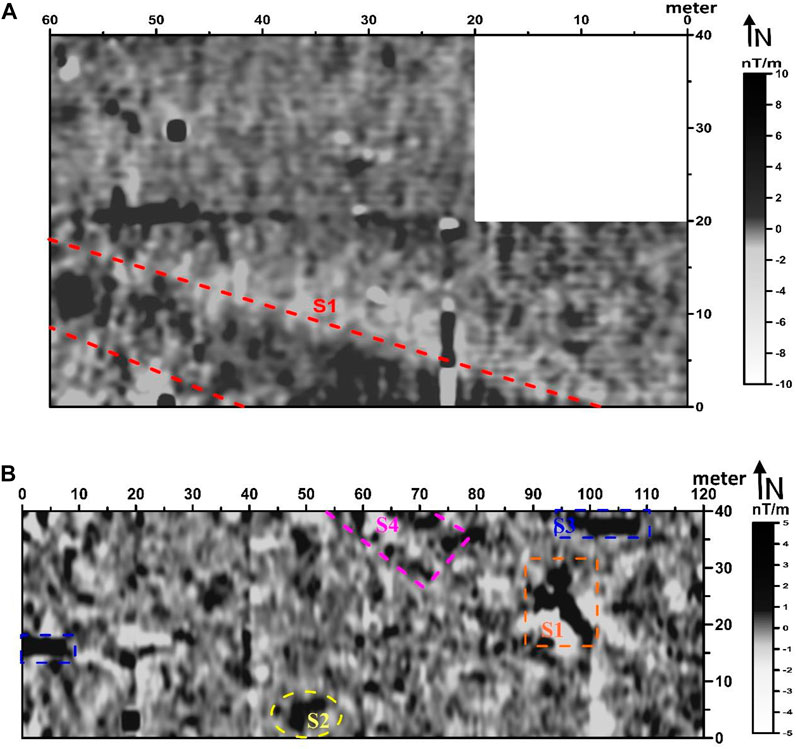
FIGURE 3. (A) Gradiometer data of site B, after applying the processing functions. This plot shows the anomaly zone S1. (B) Gradiometer data of site C, after applying the processing functions. This plot shows the interested magnetic anomaly zones. S1, S2, S3, and S4 delineate the main discoveries in this area.
Site (C)
The processed image (Figure 3B) mirrors the primary revelations uncovered by the magnetic technique around there. Four primary atypical areas have been recognized as S1, S2, S3, and S4 (Figure 3B).
Structure S1 is addressed by a major associated positive magnetic anomaly. Moreover, it is seen that there are little irregular negative inconsistencies (white color), which may allude to the presence of an underground cavity structure that has been regularly filled with sediments. The first zone may address a mud-brick wall.
Structure S2 has a three-sided shape and may allude to the passage of burial place. In addition, it is seen that the little irregular negative anomalies (white color) are not addressing a magnetic dipole impact. These negative parts may allude to the presence of an underground cavity structure that has been frequently filled with silt (i.e., tomb).
Structure S3 is represented by a connected positive magnetic anomaly. This zone might be a piece of a mud-brick wall.
Structure S4 is addressed by an associated positive magnetic anomaly prolonged with a rectangular shape. The zone may address a burial place made up of mud-bricks.
Moreover, the results show an enormous number of small (1 m × 2 m) negative anomalies, which is a typical grave size. To further identify the nature of these anomalies, a GPR survey was proposed to start from the western side of feature S4 to cover feature S2 and extended 30 m to the west.
Site (D)
The prepared image (Figure 4) mirrors the fundamental discoveries uncovered by the magnetic technique around there. Three primary anomaly areas have been recognized as S1, S2, and S3 (Figure 4), reflecting single archeological designs covered around there.
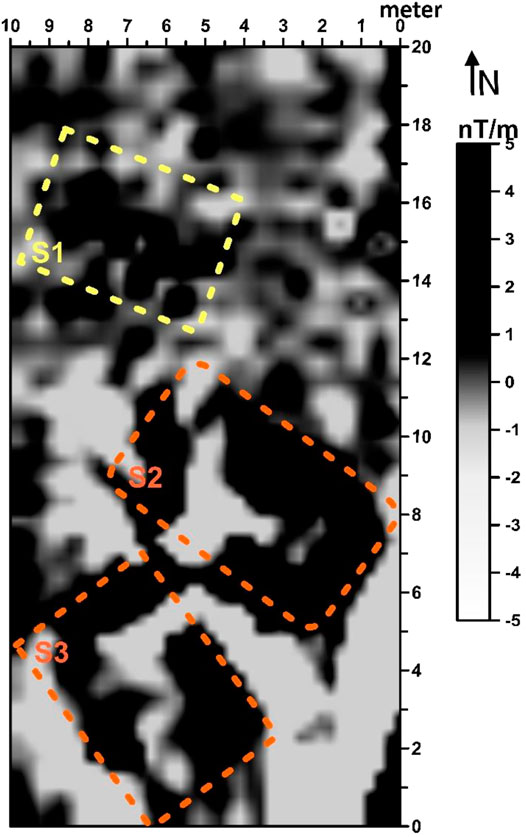
FIGURE 4. Gradiometer data of site D, after applying the processing functions. This plot shows the interested magnetic anomaly zones. S1, S2, and S3 delineate the main discoveries in this area.
Structure S1 is addressed by a major associated positive magnetic anomaly and recommends a piece of rectangular shape. This zone might be a mud-brick wall.
Structures S2 and S3 are represented by a big connected positive magnetic anomaly with a square shape. It may be the presence of buried walls (mud-brick wall structure supposed to be a tomb) with an entrance that leads to an inner chamber. Additionally, it is seen that the little irregular negative anomalies (white color) may allude to the presence of underground cavity structures that are regularly filled with sediments.
GPR Survey Results
Site (B)
The GPR data interpretation is usually based on the reflector’s shapes and the horizontal continuity of the reflections. In this site, a convergence of reflections is seen in a zone of high reflectivity, for the most part between 0.2 m and 2 m depth in numerous GPR profiles.
Profile No.5 (P5): Trends N–S with a total length of about 40 m (Figures 5A,B). It shows two anomalies, which reveal parts of the two walls of the causeway. The two anomalies are far from each other separated by a distance of about 2.5 m. A disturbance zone is noticed between distances (26 and 31 m), which may be generated due to the presence of buried walls (mud-brick wall structure).
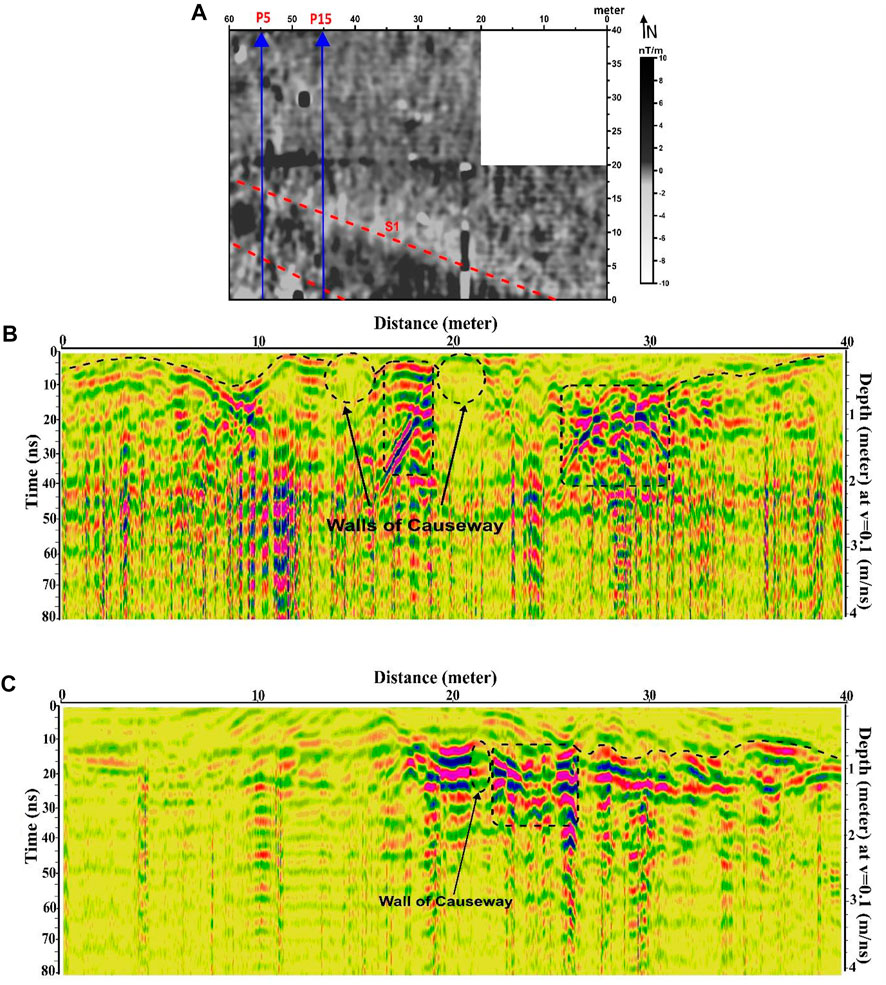
FIGURE 5. (A) The location of the GPR profiles P5 and P15 at site B. (B) GPR display of radar profile P5. (C) GPR display of radar profile P15.
Profile No.15 (P15): Trends N–S with a total length of about 40 m (Figures 5A,C). This profile is located at a 10-m distance from the profile (P5). Its results are quite similar to those in the previous profile (P5), but the depth of the causeway increases to 0.4 m. A disturbance zone is noticed between distances 22 and 26 m, which may be generated due to the presence of buried walls (mud-brick wall structure).
Site (C)
A convergence of reflections is seen in a zone of high reflectivity, for the most part between 0.5 and 3 m depth in numerous GPR profiles around the site.
Profile No.5 (P5): Trends W–E with a total length of about 40 m (Figure 6A). Through this profile, two anomalies appear obviously at distances of 10 m and 24 m, and comparable time of 8 and 10 ns, respectively (Figure 6B). These features correspond with the observed magnetic features. Their mean depth varies from 0.5 to 1 m.
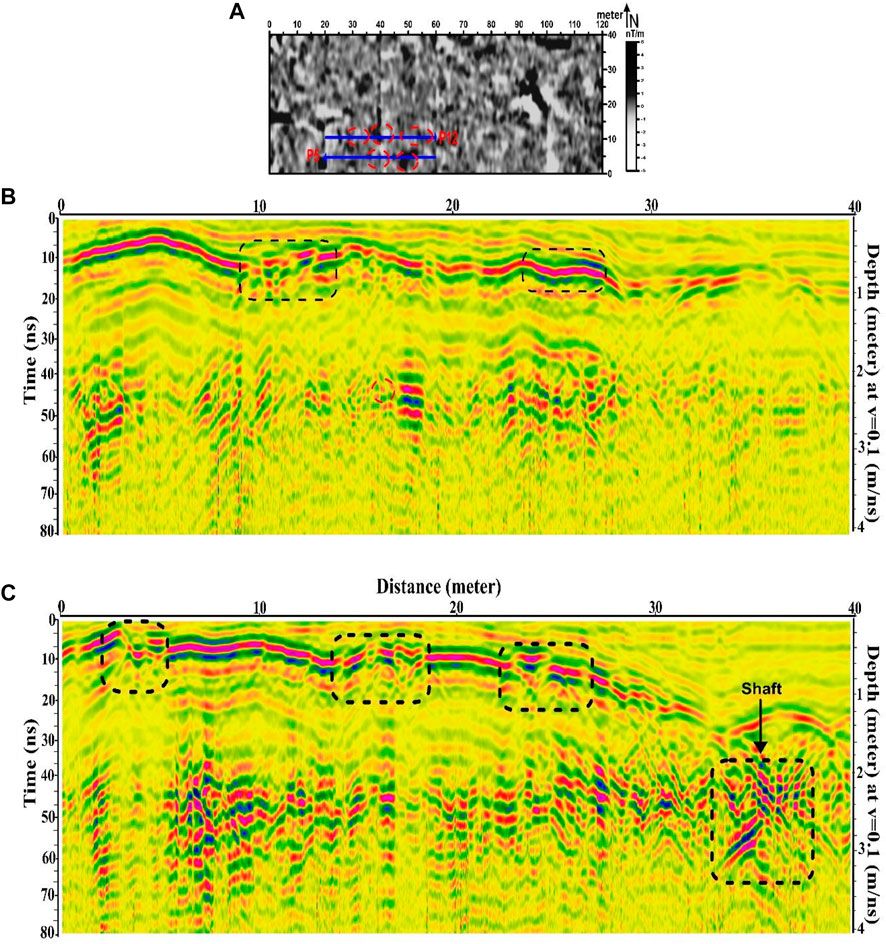
FIGURE 6. (A) The location of the GPR profiles P5 and P12 at site C. (B) GPR display of profile P5. (C) GPR display of profile P12.
Profile No.12 (P12): Trends W–E with a total length of about 40 m (Figure 6A). Through this profile, four anomalies appear obviously at distances of 4, 14, 22, and 34 m, and comparable times of 2, 4, 5, and 30 ns, respectively (Figure 6C).
The disturbance zones along this anomaly do not exist in the magnetic results, which may be owing to its nonmagnetic nature (e.g., limestone). The origin of these features may reflect a presence of a shaft. The walls of the shaft section can be observed from the surface. This mud-brick building of the shaft might have also been originally cased on the inner side of the courts with limestone. Also, they are filled with sand and gravel deposits in the entrance of the shaft. The shaft entrance may lead to several burial chambers found at the bottom.
Profile No.26 (P26): Trends W–E with a total length of about 40 m (Figure 7A). Through this profile, three anomalies appear obviously at distances of 0, 7, and 26 m, and comparable times of 1, 5, and 32 ns, respectively (Figure 7B).
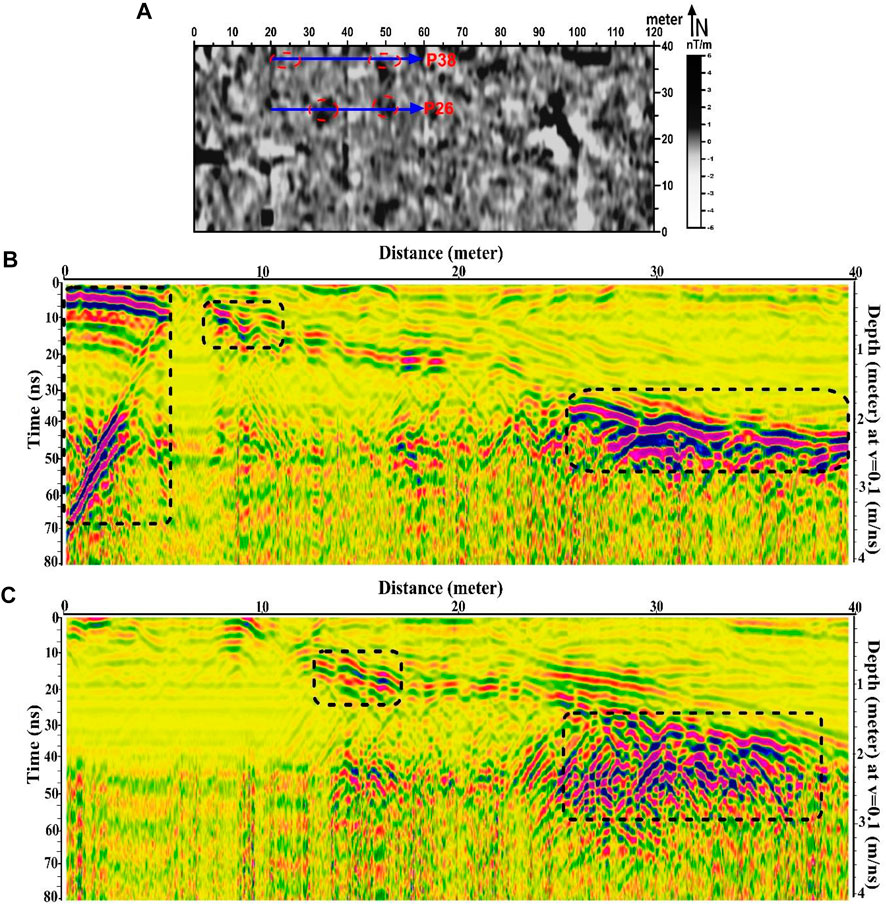
FIGURE 7. (A) Magnetic image of site (B) shows the location of the GPR profiles (P26 and P38). (B) GPR display of profile 26. (C) GPR display of profile 38.
The profile is showing a very big dipping planner reflection, which may represent an anomaly created and blown up against archaeological structure (may be considered as a vertical shaft leading to an underground burial chamber). The second anomaly appears at a distance of 7 m, which may represent a near-surface small shaft. At a distance of 28 m, we can notice a very clear and larger anomaly (at an offset from 26 to 40 m). This anomaly is too large to be interpreted as a mud-brick wall. It may be a mud-brick burial tomb, which is built of mud bricks with limestone revetments.
Profile No.38 (P38): Trends W–E with a total length of about 40 m (Figure 7A). Through this profile, two anomalies appear obviously at distances of 14 and 26 m, at comparable times of 14 and 32 ns, respectively (Figure 7C). The second anomaly may reveal a dissected area filled with sand and gravel, which may be due to the presence of mud-brick features. These features correspond with the observed magnetic features.
GPS Results
Horizontal Displacement Results
The displacement vectors at every GPS station were resolved under the imperative states of a supposition of free network adjustment. Horizontal components at each station were computed from the difference of adjusted coordinates of the stations from one epoch to another. The horizontal components of the displacement vectors with 95% confidence error ellipses and the seismicity events are shown in Figure 8 (see Supplementary Figure S6). Here, the error ellipses mean the standard error on the whole bearing around the noticed site. A few stations of the network show critical changes, while other stations demonstrate no huge changes through the time of observations. The extents of the movements are inhomogeneous over the region.
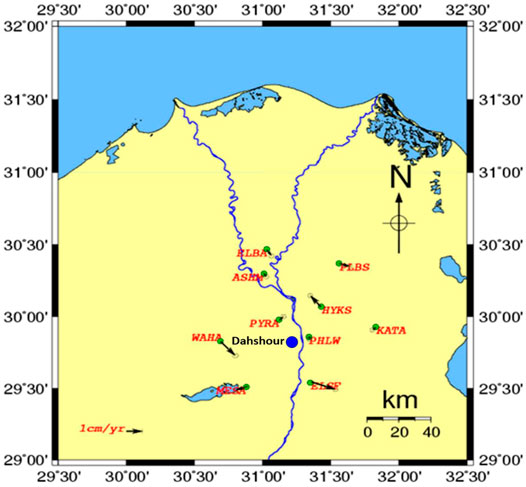
FIGURE 8. Horizontal displacement rates of the study area from 2005 to 2011.
As shown in (see Supplementary Table S1) Figure 8, for the period from 2005 to 2011, the movement rates are nearly distributed equally on the southern part of the study area, and this is clear from the horizontal displacement rates at stations of ELSF, WAHA, and MESA, and these rates are 14.8 mm/yr, 9.1 mm/yr, and 7.4 mm/yr, respectively. The northern part of the study area is not subjected to high movement rates. This is confirmed from the concentrations of the earthquake events at the southern part (see Supplementary Figure S6). This is due to the concentrations of the earthquakes that occurred in this period at the southwestern part of the study area. An earthquake with a magnitude greater than 4 mb (Richter scale) occurred in this area, between Dahshour and El-Fayoum area. Such a last feature requires additional studies to better determine the causative tectonic sources, therefore implying a thorough reevaluation of the seismic hazards in this important region.
Strain Results
The strain describes object deformation caused by external loads in terms of relative displacement of the object particles (Wu, 2005).
The horizontal components of the displacement vectors are used for estimating the strain tensor parameters: dilatations and maximum shear strains where they are estimated within the observation periods. The program used for calculating these parameters is called strain tensor (Dimitrios et al., 2018). The program implements Shen et al. (2015) method for interpolating the GPS-estimated horizontal displacement rates.
The area under study has been divided into four blocks, and the strain parameters for each block have been calculated.
Dilatation
The dilatation is the deformation component that defines the change in object volume (Dixit and Dixit, 2008). As shown in Figure 9A (see Supplementary Table S2), the Greater Cairo area was suffering from both compressional and extensional dilatation during the period from 2005 to 2011. The extensional forces are dominant at block I, 0.13 µs (microstrain), while the compressional forces are found clearly at blocks II and IV where the maximum value is −0.52 μs at block II. From the results, we can conclude that the southwestern part of the study area is suffering from both extensional and compressional forces.
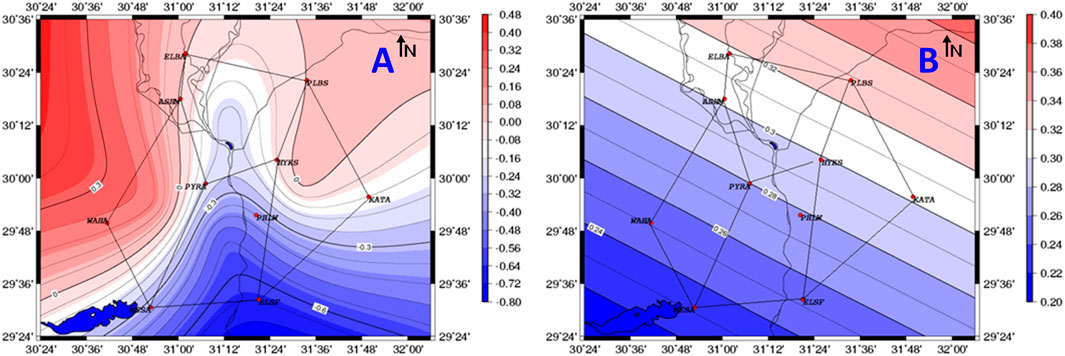
FIGURE 9. (A) Dilatation rates of the study area from 2005 to 2011. (B) Maximum shear strain rates of the study area from 2005 to 2011.
From the obtained dilatation results, we can conclude that the entire study area is suffering from both compressional and extensional dilatation forces. But the highest values are found in the southern part of the study area, especially in the southwestern part including Dahshour area.
Maximum Shear Strain
The shear strain defines the angular shape deformation of the object under stress (Beer and Johnston, 1992). Figure 9B (see Supplementary Table S2) shows the total amount of maximum shear strain in the Greater Cairo area during the period from 2005 to 2011. The area could be classified into two zones, the northeastern part represented by blocks III and IV where the shear strain rate is high, 0.3 µs, and the southwestern part represented by blocks I and II where the shear strain rate is high too, 0.26 µs (Fujii, 1995), but it is lower than that of the northeastern part.
The maximum shear result shows that significant values are to be found at the southern part of the study area, especially at the southwestern part including stations of WAHA, MESA, and PYRA.
Conclusions and Discussions
Dahshour zone has been blocked for geophysical investigation for quite a while since the 2011 uprising. The area has a historically important value, especially during the Fourth Dynasty. Significantly, the period of Sneferu witnesses a major evolution in the pyramid’s structure. The Bent Pyramid was a milestone in this progressive development in pyramid architecture.
Four archeological sites (A, B, C, and D) near the Bent Pyramid were chosen to complete the archaeo-prospection survey. The micro-magnetic survey was conducted using the FM36 fluxgate gradiometer through a raster of progressive parallel traverses. The site areas and survey grids are as follows:
• Site A covers an area of 9600 m2 (120 m × 80 m) and was surveyed using 0.5 station separation and 1 m traverse separation.
• Site B covers an area of 2400 m2 (60 m × 40 m) and was surveyed using 0.5 station separation and 0.5 m traverse separation.
• Site C covers an area of 4800m2 (120 × 40 m) and was surveyed using 0.5 station separation and 1 m traverse separation.
• Site D covers an area of 200 m2 (10 m × 20 m) and was surveyed using 0.5 station separation and 0.5 m traverse separation.
GPR survey was conducted within sites B and C to confirm the nature of the observed magnetic anomalies. The GPR surveys were conducted in zigzag lines with 1 m separation between successive lines.
The magnetic survey of Site A (Figure 2) reveals four interesting anomalies:
• S1: An elongated high-magnetic anomaly of about 100 m long and 5 m width. This is strongly proposed to be part of the causeway.
• S2: Scattered positive magnetic anomalies that cover an area of about 30 m × 20 m which is considerably large enough to resample some collapsed structure. This structure is not clear for deciding its archaeological origin.
• S3: Connected positive magnetic anomaly about 20 m long and is parallel to the valley temple wall. This feature may be a mud-brick wall.
• S4: Several dissected and ambiguous negative and positive anomalies with different shapes and sizes that are resampled in straight lines. However, the western edge of this anomaly is at a right angle to the detected feature S3.
We believe these features (S2, S3, and S4) could be the remains of a larger rectangular structure resample of another temple that was built in the same orientation as the existing valley temple. It seems that this mud structure was built even before the valley temple because the causeway is crossing it to the valley temple.
The geophysical survey at site B (Figure 3A, 5) shows an archaeological structure that could be an extension of the causeway in the direction of the Nile Valley. The feature (Figure 3A) is resampled by scattered positive anomalies that are bounded by negative anomalies. The positive anomalies represent features made up of mud, and the negative anomalies may be due to limestone blocks. This could match the old structure of the causeways where the walking path (the wide part of the causeway) is made up of mud bricks and the side walls are made up of limestone bricks. This result was confirmed using the GPR survey (Figure 5).
The geophysical survey at site C (Figures 3B, 6, 7) shows some interesting features that could be attributed to the presence of an underground cavity structure that has been regularly filled with sediments. Some cavities are engraved in the natural ground (as appears from the GPR sections in Figure 6) in the form of shafts, and the others are built with mud bricks as they have a positive magnetic anomaly. However, deeper features that appear in the GPS sections (Figure 7) indicate the presence of burial chambers. We believe that this site contains a large grave cemetery that has its entrance located in the southern part of the site.
The magnetic survey of Site D (Figure 4) reveals three interesting anomalies. These anomalies may indicate the presence of buried mud-brick walls (positive anomalies) with an entrance that leads to an inner chamber (negative anomalies). These are typical for the excavated tombs built with mud brick and are situated close to this site, which may indicate the special structure of the zone.
Furthermore, a crustal deformation investigation was conducted to estimate the stresses and the expected strain on the detected features. The achieved results indicated that the southern and the southeastern sectors of the investigated area are currently accumulating strain, and this means that there is a possibility for future earthquakes to occur around this vital archaeological area. Meanwhile, buried structures are preserved by confinement in the burial materials like a large mold. However, external load or stress can still cause damage as the mold is considered to be of a soft material regarding the stress and load size.
The obtained dilatation and maximum shear strain results show that Dahshour area is suffering from compressional dilatation forces and has a high shear strain rate. The dilatation forces are directed from south to north. Therefore, it is highly recommended that excavation starts from the southern side of the detected features to reduce the soil stress on it and to avoid walls and soil collapse.
In conclusion, this study reveals the existence of a mud-brick structure that could be an older valley temple made up of mud bricks. It seems that they started building this temple from mud bricks, and then for some reason, they stopped and built the existing valley temple from limestone. This could be a normal act from Sneferu who was pursuing perfection and greatness. Therefore, excavation is recommended to reveal the true identity and the purpose of this structure. Further to the east, the survey confirms the existence of another causeway that led to the Nile Valley. Nevertheless, this is the first work to address the stress hazard before excavation with a detailed map of the expected features and their orientation with the stress direction.
Data Availability Statement
The original contributions presented in the study are included in the article/Supplementary Material; further inquiries can be directed to the corresponding author.
Author Contributions
All contributed in data acquisition, processing, interpretation, and writing the manuscript.
Funding
This work has been funded by the National Research Institute of Astronomy and Geophysics.
Conflict of Interest
The authors declare that the research was conducted in the absence of any commercial or financial relationships that could be construed as a potential conflict of interest.
Acknowledgments
The authors are appreciative to the National Research Institute of Astronomy and Geophysics (NRIAG, Egypt) for giving the Geoscan Gradiometer (FM36), the GPR (SIR-2000), and GPS instruments and other fundamental field equipment, vehicles, and field partners. The authors also thank the Egyptian Supreme Council of Antiquities for their consent to lead the fieldworks on Dahshour site and for the field inspectors who gave us the necessary archeological information. We would like to acknowledge the time and effort devoted by the reviewers to improving the quality of the manuscript. We appreciate the detailed and useful comments that we obtained from them.
Supplementary Material
The Supplementary Material for this article can be found online at: https://www.frontiersin.org/articles/10.3389/feart.2021.674953/full#supplementary-material
References
Abbas, M.A., Atya, M., El Emam, A., Shaaban, F., Odah, H., and Lethy, A. (2011). Integrated Geophysical Studies to Image the Remains of Amenemht II Pyramid’s Complex in Dahshour Necropolis, Giza, Egypt. J. Pet. Min. Eng. 14, 27–51.
Abdallatif, T. F., Mousa, S. E., and Elbassiony, A. (2003). Geophysical Investigation for Mapping the Archaeological Features at Qantir, Sharqyia, Egypt. Archaeol. Prospect. 10 (1), 27–42. doi:10.1002/arp.190
Abdallatif, T., El Emam, A. E., Suh, M., El Hemaly, I. A., Ghazala, H. H., Ibrahim, E. H., et al. (2010). Discovery of the Causeway and the Mortuary Temple of the Pyramid of Amenemhat II Using Near-Surface Magnetic Investigation, Dahshour, Giza, Egypt. Geophys. Prospection 58, 307–320. doi:10.1111/j.1365-2478.2009.00814.x
Abdallatif, T., Odah, H. H., El Emam, A. E., and Mohsen, A. (2019). Geomagnetism Exploration of the Egyptian Archaeology: Thirty-Years of Success and Challenges Archaeogeophysics. Natural Science in Archaeology. G. El-Qady, and M. Metwaly Editors. Cham: Springer, 137–168. doi:10.1007/978-3-319-78861-6_7
Annan, A. P., Coway, S. W., and Redman, J. D. (1991). “Water Table Detection with Ground Penetrating Radar,” in 61st annual international meeting of the society of Exploration Geophysics (Houston, Texas: Society of Exploration Geophysics), 494–496. Expanded abstract.
Beer, F. P., and Johnston, E. R. (1992). Mechanics of Materials. 2nd edition. New York: McGraw-Hill.
Clark, A. J. (1986). Archaeological Geophysics in Britain. Geophysics 51, 1404–1413. doi:10.1190/1.1442189
Clark, A. J. (1990). Seeing beneath the Soil Prospecting Methods in Archaeology. London: Batsford Ltd, 176p.
Conyers, L. B., and Goodman, D. (1997). Ground Penetrating Radar. An Introduction for Archaeologists. Walnut Creek: Altamira Press.
Dach, R., Hugentobler, U., Fridez, P., and Meindl, M. (2007). in Bernese GPS Software Version 5.0 (Bern: Astronomical Institute, University of Bern).
David, B., Collins, J., Barker, B., Flood, J., and Gunn, R. (1995). Archaeological Research in Wardaman Country, Northern Territory: The Lightning Brothers Project 1990-91 Field Seasons. Aust. Archaeology 41 (1), 1–8. doi:10.1080/03122417.1996.11681574
Davis, J. L., and Annan, A. P. (1989). Ground-penetrating Radar for High-Resolution Mapping of Soil and Rock Stratigraphy1. Geophys. Prospect 37 (5), 531–551. doi:10.1111/j.1365-2478.1989.tb02221.x
Dimitrios, G. A., Papanikolaou, X., Ganas, A., and Paradissis, D. (2018). StrainTool: A Software Package to Estimate Strain Tensor Parameters (Version v1.0-rc1.0). Zenodo. doi:10.5281/zenodo.1314151
Dixit, P., and Dixit, U. (2008). Modeling of Metal Forming and Machining Processes. London: Springer-Verlag London Limited.
Doolittle, J. A. (1993). Characteristics and Monitoring the Vadose Zone with Ground Penetrating Radar: Technological Application, 26-28. Columbus, Ohio, USA: October Ohio State University, 105–119.
Fujii, Y. (1995). Characteristics of Horizontal Crustal Deformation in Japan as Deduced from Frequency Distribution of Maximum Shear Strain Rate. Pageoph 144 (No. 1), 19–37. doi:10.1007/bf00876472
Geoscan Research (1987). Instruction Manual Version 1.0 (Fluxgate Gradiometer FM9, FM18, FM36). Bradford, West Yorkshire, England: Geoscan Research.
Goodman, D., Nishimura, Y., and Rogers, J. D. (1995). GPR Time Slices in Archaeological prospect Ion. Archaeological Prospection 2, 85–89.
Goodman, D. (1994). Ground Penetrating Radar Simulation in Engineering and Archaeology. Geophysics 59 (No. 2), 224–232. doi:10.1190/1.1443584
Hashash, Y. M. A., Hook, J. J., Schmidt, B., and I-Chiang Yao, J. (2001). Seismic Design and Analysis of Underground Structures. Tunnelling Underground Space Tech. 16 (4), 247–293. doi:10.1016/s0886-7798(01)00051-7
Hill, J. (2020). Dashur: Bent Pyramid of Sneferu". Jenny Hill. Ancient Egypt Online Retrieved. Available at: https://ancientegyptonline.co.uk/bent-pyramid-dashur/ (Accessed September 25, 2020).
Hounslow, M. W., and Chroston, P. N. (2002). Structural Layout of the Suburbs of Roman Butrint, Southern Albania: Results from a Gradiometer and Resistivity Survey. Archaeol. Prospect. 9, 229–242. doi:10.1002/arp.202
Hussein, H., M., Korrat, I., M., and Abd El-Fattah, A., K. (1996). The October 12, 1992 Cairo Earthquake a Complex Multiple Shock, 30. Japan: Bulletin of the International Institute of Seismology and Earthquake Engineering, 9–21.
Jena, R., Pradhan, B., Beydoun, G., Al-Amri, A., and Sofyan, H. (2020). Seismic hazard and Risk Assessment: a Review of State-Of-The-Art Traditional and GIS Models. Arab J. Geosci. 13, 50. doi:10.1007/s12517-019-5012-x
Leckebusch, J. r. (2000). Two- and Three-Dimensional Ground-Penetrating Radar Surveys across a Medieval Choir: a Case Study in Archaeology. Archaeol. Prospect. 7, 189–200. doi:10.1002/1099-0763(200009)7:3<189::aid-arp134>3.0.co;2-n
Mahmoud, S., M., Khalil, H., Sakr, K., O., and Rayan, A. (1996). “GPS Measurements at the Area Around Great Cairo and Southern Part of Delta, Egypt,” in Proceedings of the Regional Symposium on Deformations and Crustal Movement Investigations using Geodetic Techniques, Aug. 31-Sep. 5, 1996 (Hungary: Szekesfehervar), 180–188.
Manataki, M., Sarris, A., Donati, J., Cuenca-García, C., and Kalayci, T. (2015). GPR: Theory and Practice in Archaeological Prospection. Oxford: Archaeopress. doi:10.13140/RG.2.1.3256.9363
Mekkawi, M., Arafa-Hamed, T., and Abdellatif, T. (2013). Detailed Magnetic Survey at Dahshour Archeological Sites Southwest Cairo, Egypt. NRIAG J. Astron. Geophys. 2, 175–183. doi:10.1016/j.nrjag.2013.06.020
Reynolds, J. M. (1997). An Introduction to Applied and Environmental Geophysics. Chichester: John Wiley and Sons Ltd.Inc, 796.
Sandmeier, K. J. (2016). ReflexW Program for Processing of Seismic, Acoustic or Electromagnetic Reflection, Refraction and Transmission Data. Karlsruhe, Germany: Software Manual.
Scollar, I., Tabbagh, T., hesse, A., and Herzog, I. (1990). Archaeological Prospecting and Remote Sensing. Cambridge: Cambridge University Press, 692p.
Shen, Z. K., Wang, M., Zeng, Y., and Wang, F. (2015). Optimal Interpolation of Spatially Discretized Geodetic Data. Bull. Seismological Soc. America 105 (4), 2117–2127. doi:10.1785/0120140247
Keywords: magnetic, GPR, earthquakes, GPS, Dahshour area
Citation: El Emam AE, Lethy A, Radwan AM and Awad A (2021) Archaeological Investigation and Hazard Assessment Using Magnetic, Ground-Penetrating Radar, and GPS Tools at Dahshour Area, Giza, Egypt. Front. Earth Sci. 9:674953. doi: 10.3389/feart.2021.674953
Received: 02 March 2021; Accepted: 17 May 2021;
Published: 07 June 2021.
Edited by:
Mohamed Sobh, Freiberg University of Mining and Technology, GermanyReviewed by:
Svetlana Kovacikova, Institute of Geophysics (ASCR), CzechiaAwad Omran, Assiut University, Egypt
Giovanni Leucci, the National Research Council (CNR), Italy
Copyright © 2021 El Emam, Lethy, Radwan and Awad. This is an open-access article distributed under the terms of the Creative Commons Attribution License (CC BY). The use, distribution or reproduction in other forums is permitted, provided the original author(s) and the copyright owner(s) are credited and that the original publication in this journal is cited, in accordance with accepted academic practice. No use, distribution or reproduction is permitted which does not comply with these terms.
*Correspondence: Ali M. Radwan, YW1yYWR3YW5lZ0B5YWhvby5jb20=