 Albert Scrieciu
 Alessandro Pagano
 Virginia Rosa Coletta
 Umberto Fratino
 Raffaele Giordano
95% of researchers rate our articles as excellent or good
Learn more about the work of our research integrity team to safeguard the quality of each article we publish.
Find out more
ORIGINAL RESEARCH article
Front. Earth Sci. , 05 July 2021
Sec. Geohazards and Georisks
Volume 9 - 2021 | https://doi.org/10.3389/feart.2021.674618
This article is part of the Research Topic Flood Susceptibility and Risk Maps as a Crucial Tool to Face the Hydrological Extremes in Developing Countries: Technical and Governance Aspects Linked by a Participatory Approach View all 4 articles
There is a growing interest worldwide on the potential of nature-based solutions (NBSs) as measures for dealing with water-related risks while producing multiple co-benefits that can contribute to several societal challenges and many of the sustainable development goals. However, several barriers still hamper their wider implementation, such as mainly the lack of stakeholders’ engagement and the limited integration of stakeholders’ knowledge throughout the phases of NBS design and implementation. This is a crucial aspect to guarantee that the multidimensional implications of NBSs are adequately understood and considered by decision-makers. Innovative methods and tools for improving NBS design and supporting decision-makers in overcoming the main barriers to implementation, ultimately enhancing their effectiveness, are therefore needed. The present work proposes a combined approach based on the integration of fuzzy cognitive maps, hydraulic modeling, and participatory Bayesian belief networks aiming to facilitate the stakeholders’ engagement and the knowledge integration process in NBS design and assessment. The approach was developed and implemented within the NAIAD project in the Lower Danube demo site, specifically oriented to support the process of the Potelu Wetland restoration. First, fuzzy cognitive maps are adopted as a problem structuring method for eliciting stakeholders’ risk perception and problem understanding, and for constructing a causal model describing the system as a whole, with specific attention to the expected role of the NBS in reducing flood risk and addressing the key local challenges. Second, hydraulic modeling is used to analyze the effect of extreme floods starting from the retrospective analysis of a specific event and to model the potential benefits of risk reduction measures. Last, a Bayesian belief network is used to support the model integration process and a scenario analysis with a user-friendly tool. The whole process can be replicated in other areas and is particularly suitable to support an active engagement of stakeholders (both institutional and not) in the process of NBS design and assessment.
There is an ever-increasing number of research articles and projects dealing with the design of nature-based solutions (Albert et al., 2017; Raymond et al., 2017; Calliari et al., 2019), proving NBS suitability as valid alternatives to gray infrastructures for dealing with natural hazards (Palmer et al., 2015) and specifically with water-related risks (Ruangpan et al., 2020). A summary of the evidences from recent EU-funded NBS projects in support of policy instruments and identifying current gaps has been recently provided by Vojinovic (2020). As described by several authors, the success of NBSs is not exclusively related to the reduction of natural risks, but it is due to their capability to produce a wide set of socioeconomic and environmental co-benefits, whose integration in the frameworks for assessing NBS effectiveness has been advocated by several authors (Alves et al., 2018, Alves et al., 2019; Pagano et al., 2019). Despite the advanced scientific knowledge on NBS design and evaluation, their implementation is still hampered by several barriers. Scholars demonstrated that social (e.g., the perceived effectiveness), institutional (e.g., the longer time needed by NBSs to provide benefits and the limited cross-sectoral cooperation), and economic (high construction and maintenance costs for NBSs) barriers are at least as important as the physical ones (O‘Donnell et al., 2017; Sarabi et al., 2020; Vojinovic, 2020). First, Kabisch et al. (2016), Ruangpan et al. (2020) demonstrated how the lack of stakeholders’ engagement and the limited integration of stakeholders’ and scientific knowledge in NBS design represent a barrier hampering their implementation. Second, Alves et al. (2019), Giordano et al. (2020) showed that institutional actors should be capable to account for the different needs and concerns related to NBS design and implementation, in order to avoid trade-offs among different stakeholders and potential conflicts. Finally, ineffective cooperation among different decision-makers and stakeholders could hamper NBS implementation and/or reduce its effectiveness, as discussed by Shrestha and Dhakal (2019) and Gómez Martín et al. (2020).
Therefore, methods and tools for supporting decision-makers in detecting the barriers to NBS implementation, to define measures for overcoming those barriers, and to enhance the NBS effectiveness are needed. In line with the works of Raymond et al. (2017), Alves et al. (2018), we assume that NBS effectiveness is not simply related to the risk reduction but also to the production of co-benefits, defined as the various benefits related to a wide range of societal challenges (e.g., environmental, economic, and societal) that can be simultaneously provided by an NBS over a certain period (Jiang et al., 2016; Raymond et al., 2017; Giordano et al., 2020; Coletta et al., 2021). To this aim, a participatory modeling approach, based on the integration between stakeholders’ and scientific knowledge, was implemented in this work. Participatory modeling involves the engagement of stakeholders in the modeling process, which can be accomplished in various forms, ranging from direct participation in model construction to consultation on model validity and testing of a complete simulation model (Voinov et al., 2016; Halbe et al., 2018). Several benefits were already highlighted concerning the stakeholders’ engagement for environmental modeling. By building a model, stakeholders can express their points of view, learn about other perspectives, and examine factual knowledge and subjective perceptions to create formalized and shared representations of the reality (Voinov et al., 2016). The construction of simulation models allows testing the assumptions and thereby supports collaborative learning about the system structure and dynamic (Voinov et al., 2016; Halbe et al., 2018).
Among the different approaches for participatory modeling development, this work adopts a participatory Bayesian belief network (BBN). BBNs are probabilistic graphical models that conceptually represent a system of interactions between variables via a cause–effect diagram (Phan et al., 2016). BBNs have been widely accepted as a valuable tool for modeling complex and uncertain issues, and support an active stakeholders’ engagement (Sperotto et al., 2017; Xue et al., 2017). Several scholars demonstrated that BBNs are extremely powerful for integrating data and knowledge from different sources and domains, for combining scientific and stakeholders’ knowledge, and for describing physical and socio-institutional processes, thus supporting decision-making helping reasoning from uncertain evidence to uncertain conclusions (Henriksen et al., 2012; Giordano et al., 2013; Uusitalo et al., 2015; Xue et al., 2017; Pagano et al., 2018b).
In this work, the BBNs’ potentialities were combined with those of the fuzzy cognitive maps (FCMs), in order to enable the stakeholders’ engagement and facilitate the knowledge integration process. FCMs and BBNs are both causal modeling tools which could be merged to improve their efficiency and capability to describe and simulate complex systems (Azar and Dolatabad, 2019). FCMs can be defined as the graphical representation of the ideas of a group of stakeholders or individuals to give an interpretation to a complex system (Eden, 1992). An FCM is composed by interrelated variables and directional edges, that is, connections—representing the causal relationships between variables (Kok, 2009; Giabbanelli et al., 2017). In this work, FCMs were adopted as a problem structuring method for eliciting stakeholders’ risk perception and for problem understanding, as well as for constructing the causal model. Stakeholders’ knowledge was used for describing “soft” variables in the BBN, that is, those variables related to sociocultural and institutional aspects (e.g., risk awareness), that are difficult to quantify (Pagano et al., 2018a; Santoro et al., 2019; Giordano et al., 2020). “Hard” variables—that is, the quantitative ones obtained from hydraulic models—were translated into the BBN form for describing physical processes related to water-related risks and NBS impacts. The BBN allowed simulating “what-if” scenarios mainly related to the re-naturalization process over the area. Some of the key issues in using FCMs for developing BBNs have been addressed in this work, with specific reference to the development of the conditional probability table (CPT) starting from the FCM weights (as detailed in “Materials and Methods” and in the Supplementary Material). The activities were organized in order to provide answers to the following research questions, that is, i) to what extent did the integration between FCMs and BBNs allow accounting for the diversities in risk perceptions among the involved stakeholders? ii) Was the participatory modeling approach capable of fostering collective learning process concerning barriers and enabling factors for NBS implementation? iii) Is the proposed BBN model capable to integrate scientific knowledge (on flood risk) with stakeholders’ knowledge to provide a thorough assessment of the effectiveness of NBSs in producing benefits (in terms of flood risk reduction) and co-benefits?
The combined FCM–BBN approach was implemented within the NAIAD framework in the Lower Danube demo site. The framework aimed at enabling the co-design and implementation of NBSs for dealing with flood risk. The activities described here were meant to enable the engagement of stakeholders in the definition of barriers and enabling factors for the implementation of the selected NBS, that is, the Potelu Wetland restoration project.
This work is organized as follows. After the present Introduction, “Materials and Methods” provides full details on the methodological approach used, with specific attention to the adopted methods (FCMs, HM, and BBNs) which are individually detailed, and their integration described. “Result,” after an overview of the case study, includes a summary of the main results. A critical discussion is provided in “Discussion and Concluding Remarks,” along with the concluding remarks.
The main scope of this work is to demonstrate the suitability of the combined FCM–HM–BBN method for supporting the adoption of NBSs in dealing with flood risks, through the detection, analysis, and overcoming of barriers to their implementation. To this aim, stakeholders’ and scientific knowledge were integrated. Figure 1 shows the different phases of the adopted approach. Three main clusters of activities were implemented, that is, the participatory modeling, the flood risk assessment, and the integrated BBN development.
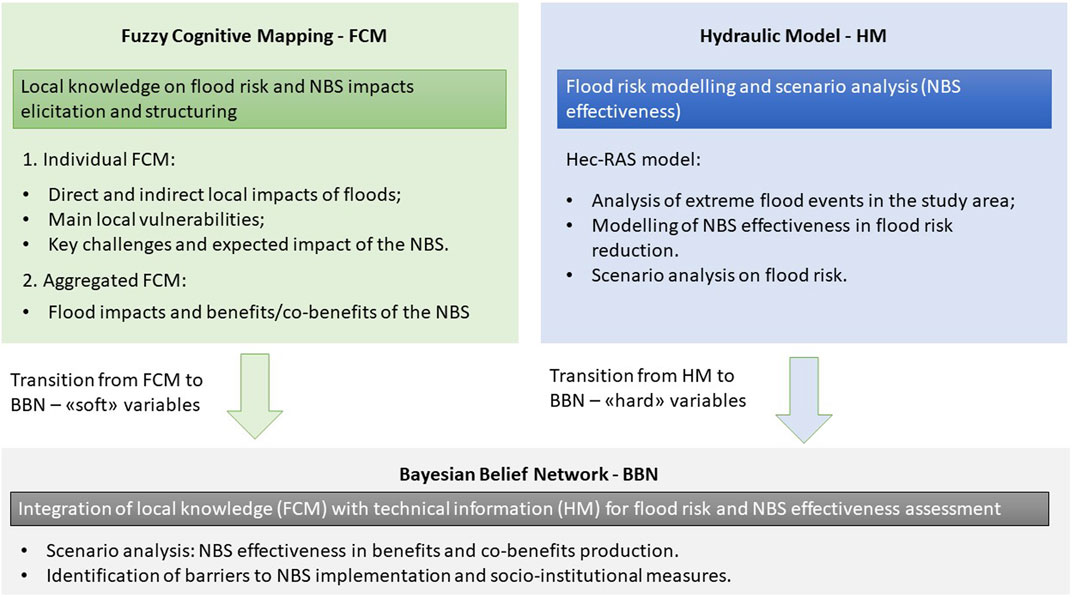
FIGURE 1. Overview of the adopted approach.
This phase of the adopted methodological approach aimed at engaging stakeholders in developing a model representing their knowledge related to the flood risk at the local level and the expected impacts of NBS implementation. To this aim, two sequential activities were carried out, that is, i) modeling flood risk perception and ii) developing the stakeholder-based BBN.
Since the seminal work of Renn (1998), the integration of stakeholders’ risk perception in risk management has been widely investigated by several scholars (Corfee-Morlot et al., 2011; Castán Broto and Bulkeley, 2013). Handling collective relevant risk issues has been shifted from central, state-based, approach toward distributed, multilevel risk governance. This innovative multi-actor alliance goes beyond the institutional system. Risk management claims for an increasingly multilayered and diversified socio-institutional landscape, characterized by multiple actors with their own risk perceptions and diversity of knowledge (Renn, 2011). Institutional diversity in risk management can offer considerable advantages when complex, uncertain, and ambiguous risk problems need to be addressed. First, redundancy makes nonhierarchical adaptive and integrative risk governance systems more resilient and therefore less vulnerable. Second, the larger number of actors facilitates knowledge exchange, cross-fertilization, and learning (Renn, 2011). However, divergences in values, beliefs, and problem frames may lead to collaboration structures that encourage stakeholders and decision-makers to avoid each other, turning the participatory activities for risk management into a controversial and futile process (Brugnach and Ingram, 2012; Howe et al., 2014; Jacobs et al., 2016; Wam et al., 2016; Giordano et al., 2017; Small et al., 2017; Shrestha and Dhakal, 2019). Multilevel risk governance claims for a clear understanding of the diversities in risk perception among the different actors in risk management.
In order to enhance the richness and diversity of the knowledge used for developing the flood risk perception model, the adopted participatory modeling approach was based on a combination of individual inputs and group modeling. First, individual risk perceptions were elicited through semi-structured interviews. Stakeholders were required to describe i) the main impacts at the local level (both direct and indirect) due to flood events (e.g., socioeconomic impacts), ii) the main elements affecting those impacts (i.e., local vulnerabilities), and iii) the most important issues (social challenges) that need to be addressed in order to increase the effectiveness of the flood risk management actions and improve the system conditions (Bain et al., 2016). Finally, stakeholders were required to specify the expected roles of the NBS in reducing flood risks and addressing the social challenges. For more detailed descriptions of the framework used during the interviews, refer to the Supplementary Material “Introduction.”
The results of the interviews were, hence, structured in an individual FCM. An FCM can be defined as a bidirectional graph of nodes (i.e., variables) and causal connections between them. The connection strength indicates the stakeholder’s perceived influence of two variables on each other (Ozesmi and Ozesmi, 2003). Graphically, an FCM is represented as an oriented graph with feedbacks, consisting of nodes and weighted arcs. Variables in the FCM take values in the range between [−1,1] and the weights of the arcs are in the interval [−1,1] (Papageorgiou and Kontogianni, 2012). For more details concerning the method for translating stakeholders’ argumentation into an FCM, a reader could refer to Giordano et al. (2020). An example of the translation of stakeholders’ argumentation into an FCM is also provided in the Supplementary Material.
The individual FCM was, then, aggregated in order to develop the stakeholders’ model. The mathematical aggregation procedure suggested by Kosko (1986) was adopted in this work. The individual FCMs were translated into square adjacency matrices of the same size, and then added and divided by the total number of individual matrices. This operation results in a new matrix, the entries of which are the average of the weight assigned by the stakeholders. In this work, we did not introduce a credibility weight to the stakeholders in the aggregation process. Therefore, stakeholders’ inputs were considered of the same importance. The process stops when all stakeholders’ FCMs are added. The mathematical aggregation of the FCM requires some upfront work, such as the standardization of the variables’ names. Furthermore, when respondents characterize the same variable as concept and dis-concept (e.g., “community awareness” and “lack of community awareness”), one of the variables needs to be converted (Kosko, 1986). To preserve the direction of causality, the converted variable’s connecting arrow needs to be changed to the opposite direction.
The aggregated FCM represented the stakeholders’ knowledge concerning the flood risk at the local level. This model was, hence, used as basis for developing the stakeholder-based BBN, as described in the next section.
Despite the suitability of both FCMs and BBNs in addressing similar issues—for example, environmental resource management (Phan et al., 2016; Mourhir, 2021) and risk management (Kabir and Papadopoulos, 2019; Tepes and Neumann, 2020; Kaikkonen et al., 2021)—they have been mostly applied separately even in similar issues, and very few works aimed at their combination (Nadkarni and Shenoy, 2001, 2004; Azar and Dolatabad, 2019), with pros and cons thoroughly described in Azar and Dolatabad (2019). In such cases, FCMs are mainly used for defining the causal structure of the BBN model, and a procedure is required to convert the FCM into the causal model of BBNs by making some structural changes to the map. The definition of conditional probability tables (CPTs), which is the most challenging task, could be either performed from FCMs (Azar and Dolatabad, 2019) but, mainly, using experts’ knowledge (Xue et al., 2017). However, experiences demonstrated that engaging stakeholders in defining the CPTs for the variables of a complex model such as those related to flood risk could provoke stakeholders’ fatigue, and, consequently, lead participants to abandon the process (Shi et al., 2020). In order to avoid this risk and in line with the study by Azar and Dolatabad (2019), this work used the FCM for deriving i) the causal structure of the BBN and ii) the CPT. Concerning the first point, structural modifications of the FCM are needed prior to use the cause–effects network for the development of the causal model of the BBN. As pointed out by Nadkarni and Shenoy (200), the issues related to circular relations (i.e., loops in the FCM), variable dependency, and conditional independency need to be addressed. The methods described in Nadkarni and Shenoy (2001), Giordano et al. (2013) were implemented here for adapting the FCM structure to the BBN characteristics. Specifically, all causal independencies in the aggregated FCM were checked by the analysts in order to ensure the conditional independency of the BBN (Nadkarni and Shenoy, 2001). Moreover, the circular relationships among the FCM variables were detected and modified, since the BBN requires an acyclic structure. In case of dynamic loops, de-aggregating the variables into sequential variables allows addressing this issue (Azar and Dolatabad, 2019). Last, it is worth to highlight that keeping the BBN as simple as possible (i.e., with short cause–effect chains) typically allows reducing the propagation of uncertainty from parent nodes to child nodes. A long chain of nodes could, in general, show a reduced sensitivity to model drivers and should therefore be avoided so that any input evidence will not be “diluted” (Cain, 2001). This ultimately helps better evaluating the influence of changes in variables’ states in the scenario analysis.
Different methods were described in the scientific literature for building the CPT of the BBN starting from the FCM (e.g., Azar and Dolatabad, 2019). Most of these methods adopt complicated mathematical procedures to this aim. In order to be consistent with the goal of making the developed models easily understood by the stakeholders, we decided to refer to the FCM simulation potentialities and the linguistic function used for describing the state of the different variables for defining the CPTs in the stakeholder-based BBN. To describe the adopted method, we could consider the simplest form of the FCM, with two variables (A and B) affecting the value of a third one (Figure 2A). The causal links are characterized by a weight, representing the strength of the causal connection (Giordano et al., 2020).
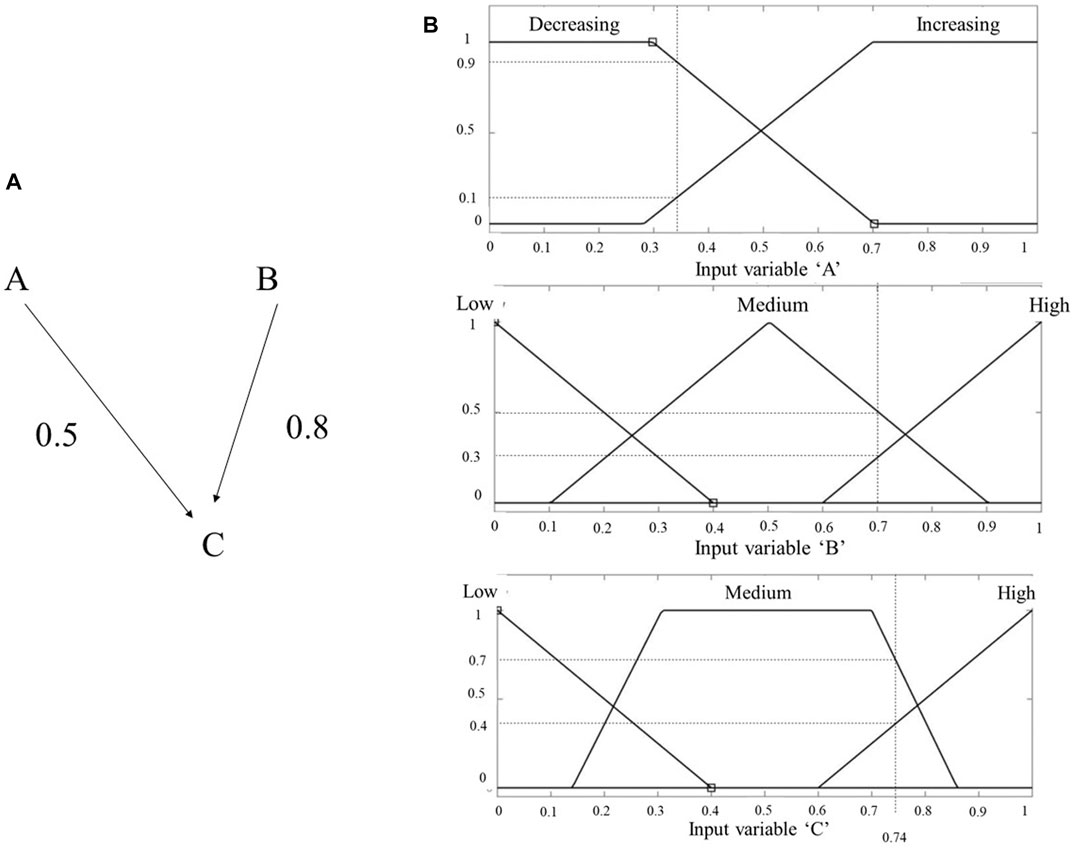
FIGURE 2. (A) Simple example of FCMs with two variables A and B affecting the variable C. (B) Linguistic functions for variables A, B, and C.
Stakeholders describe the state of these variables using linguistic assessments. Therefore, fuzzy linguistic functions were developed referring to the stakeholders’ knowledge, as described in (Page et al., 2012). Figure 2B shows the fuzzy linguistic functions for both the input variables—that is, A and B—and for the output C. The variable A assumes the value 0.35, and the variable B has the value 0.7. Contrarily to a Boolean assessment, in which a value could belong to one set, in a fuzzy linguistic function, a value could belong to more than a set, and it is characterized by a membership degree. In the example in Figure 2, 0.35 for the variable A belongs to the set “Decreasing” with a membership degree µD 0.9, and it belongs to set “Increasing” with a membership degree µD 0.1. Similarly, the variable B assumes the crisp value 0.7 which belongs to the set “Medium” with a membership degree µM 0.5, and to the set “High” with a membership degree µH 0.3.
The fuzzy inference equation (Eq. 2) was adopted for calculating the value of the variable C based on the values of A and B, and on the weights of the connecting links (Figure 2A). This equation derives from the FCM formulation provided in Kosko (1986) and has been revised according to (Kok, 2009).
Let us consider the initial state vector of the FCM: S (t0) = (A (t0), B (t0), C (t0)) = (0.35, 0.7, 0). The adjacency matrix of the FCM, which is composed by the weights of the links between the variables, is as follows:
In this example, 0.5 is the weight of the link between the variable A and the variable C, and 0.8 is the weight of the link between the variable B and the variable C.
The new state vector of the FCM is calculated as in the following equation:
Considering that there are no connections affecting the values of A and B, C is the only variable whose value changes due to Eq. 2. The calculation of the new state vector is repeated iteratively until the values of the variables reach a stable state. To this aim, and to avoid that the value of C becoming 0 after the first iteration, the values along the adjacency matrix diagonal are set to one for the variables A and B, which are the input variables in this example.
The stable states of the FCM variables are used for interpreting the relationships among the variables and their impacts on the system dynamic (Kok, 2009). In this example, C assumes the value 0.74, that is considered as “Medium” (µM 0.7) and “High” (µH 0.4).
In order to develop the CPT, the membership degrees of the variable C to the three fuzzy linguistic sets need to be translated into probabilities. The following formula was used for assessing the conditional probability that the variable C assumes the value “Low”:
CPC(L) is the conditional probability that C assumes the value “low,” µL is the membership degree of the variable C to the fuzzy linguistic set “low,” µM is the membership degree of the variable C to the fuzzy linguistic set “medium,” and µH is the membership degree of the variable C to the fuzzy linguistic set “high.” Similarly, the other combinations of the values for the input variables were used for assessing the values for the output variables C. Therefore, the CPT for assessing the value of C according to the FCM can be developed accordingly.
At the end of this phase, the stakeholders’ FCM was translated into the stakeholder-based BBN. The next phase concerns the combination of this BBN with the BBN for the assessment of the flood risk.
The development of a hydraulic model is useful for a twofold purpose: i) to analyze the effect of extreme floods starting from the retrospective analysis of a specific event and ii) to model the potential benefits of risk reduction measures on an event with the same magnitude. Concerning the latter point, the HEC-RAS hydraulic model (USACE, 2010) can be used to perform a “scenario analysis,” that is, a quantitative assessment of the effectiveness of measures under different conditions. The main evidence and outcomes of the hydraulic model are then translated into the common BBN sets. This is useful to capture the relationships among physical factors influencing flood risk and to characterize the behavior of the selected measure in different conditions, along with related uncertainty, while explicitly modelling the relationships with the economic, social, and environmental factors mentioned by the local stakeholders.
Specifically, the transition from the hydraulic model into a BBN considers the variables and the connections summarized in Table 1. Basically, the “flood risk assessment” part of the BBN requires the identification of key hydraulic information, in a reference cross section (i.e., a relevant cross section for the analysis) and the following inputs to be set: 1) flood duration (T); 2) H, that is, the water elevation in the reference cross section; and 3) for the purposes of the present work, the dike elevation (Hd), which affects the size of the water retention structure. Given the H value, the discharge (Q) in the reference cross section is directly computed from the stage–discharge relationship produced by the HEC-RAS model. This, along with the information on the flood duration T, allows computing the flood volume (V). This is calculated considering two components, that is, a constant base-flow (during the whole flood duration) and a peak flow (a triangular component depending on the maximum discharge, and duration T/2). The contribution of the wetland area (design area, Aw) to flood risk reduction is expressed by the storage volume (Vw), which depends on the dike elevation Hd. Similarly, the available storage volume can be calculated in a specific way for any other NBSs. It directly affects both the “Cost” of the measure (and thus its “Economic feasibility”) and the technical effectiveness (“Flood Risk Reduction”), which is expressed by two components: the “Pressure on dikes” (a significant stored volume reduces the pressure on the other dikes located downstream) and the “Flood volume downstream” (Vd). Additionally, a value for the variable “Wetland Area,” which is an input or the co-benefit assessment part, is produced. As discussed in detail in Table 1, some variables are calculated using an equation, whereas others are calculated using CPTs that are built based on expert judgement, which is case-specific.
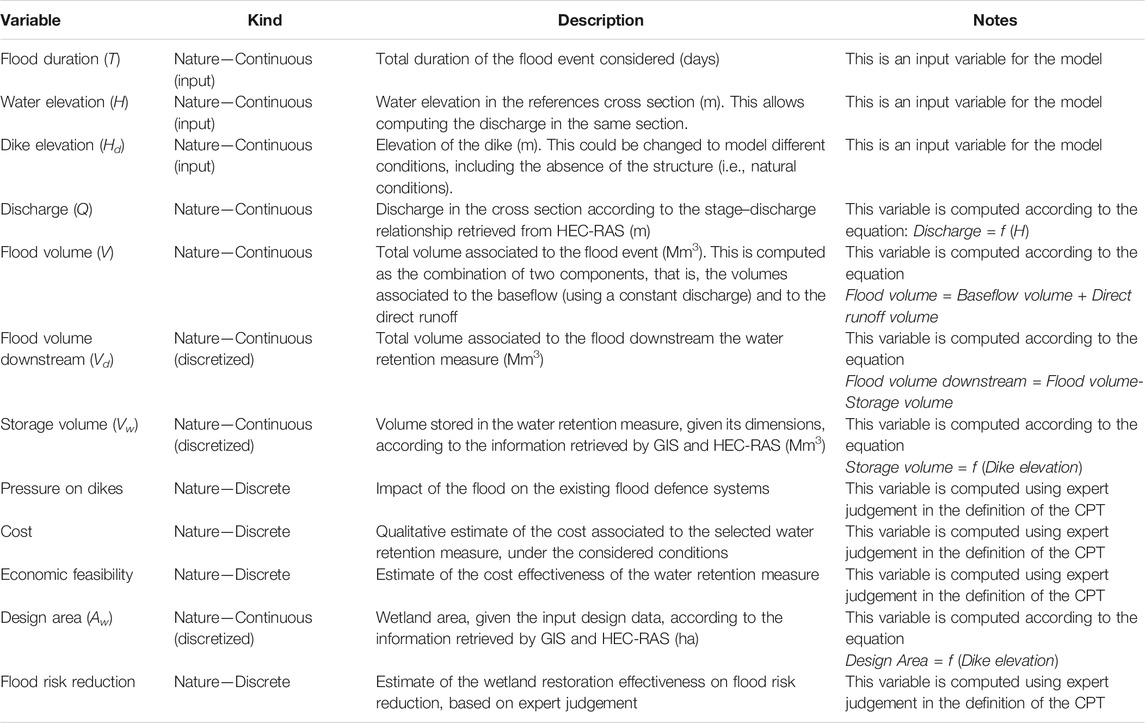
TABLE 1. Description of the variables used for the flood risk assessment in the BBN.
In this phase of the adopted methodological approach, the stakeholder-based BBN and the hydraulic-based BBN were integrated and used for assessing NBS effectiveness and detecting potential barriers to NBS implementation. To this aim, this work assumes that the NBS effectiveness is related to its capacity both to reduce flood risk and to produce the expected co-benefit. The integration was carried out through the detection of connecting variables in the two BBNs. Causal connections were drawn, and the corresponding CPT defined as a combination of the CPTs in both the stakeholder-based BBN and the hydraulic-based BBN. Further details on this process are included in the Supplementary Material section. Since the formal structure of a BBN is crucial for facilitating the discussion with the stakeholders, it was structured considering three main parts: that is, the flood risk assessment (see Hydraulic-Based Bayesian Belief Network for the Flood Risk Assessment), the expected co-benefit production, and the perceived causal connections affecting the flood risk reduction.
The integrated BBN was used for detecting the main barriers hampering the NBS effectiveness and for supporting the definition of the measures to be implemented in order to overcome those barriers. It is worth mentioning that in this work, we assume that an NBS is effective if it contributes to reduce the flood risk and to produce the expected co-benefits. To detect the key barriers to NBS effectiveness and suggestion measures to overcome those barriers, the integrated BBN can be used to simulate different intervention scenarios and to assess the effectiveness of the NBS, under different design and operating conditions. Specifically, the scenario analysis helps both activating the “technical” variables connected with the NBS implementation and testing the effectiveness of measures aiming to change the socioeconomic and institutional system.
The results of this analysis were, then, discussed with key stakeholders to define measures to positively affect the NBS effectiveness.
The study site is located in the lower Danube Romanian area and refers specifically to the Dabuleni–Potelu–Corabia wetland area (Figure 3). This site has been highly exposed to flood events, and, in the 60s, it has been fully drained (14,666 ha) with a dam having a length of 32.4 km, and through the opening of the Celeiu channel and the activation of five pumping stations (Corabia, Stejarul, Valcovia, Răcari, and Celei). Part of the enclosure (2,860 ha) is currently used for irrigated agriculture.
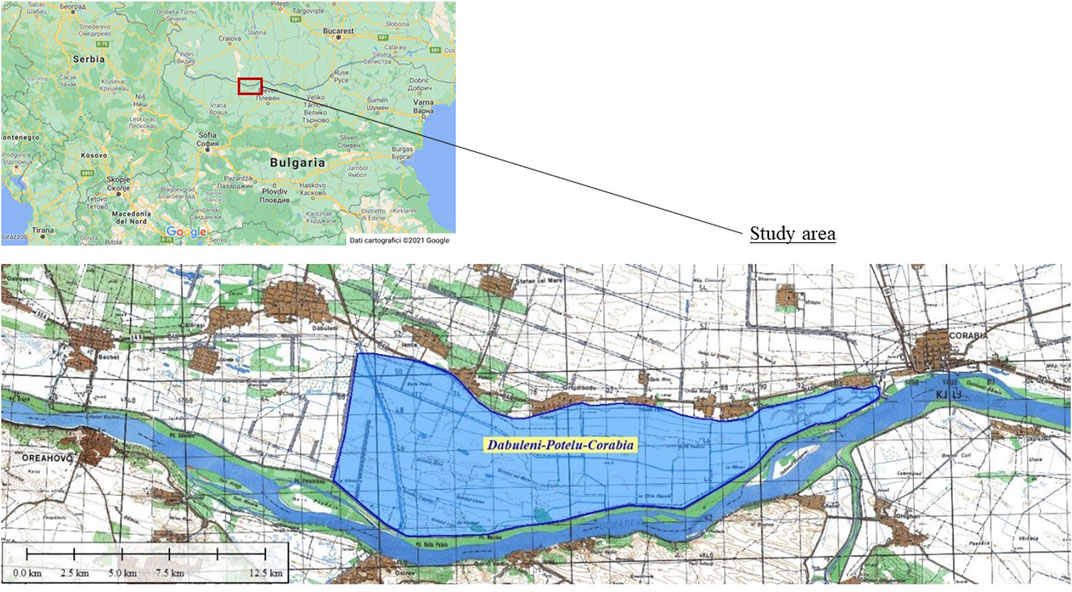
FIGURE 3. Location of the study area.
An extreme flood occurred in 2006, with significant impacts on the study area. During this event, several dike overflows and breaks were recorded, with the subsequent flooding of wide areas. The values of both flow and water volume recorded during this flood are associated to a probability of annual exceedance of 1%. More specifically, the recorded values of the peak flow rate were 15990 m3/s at Calafat, 15970 m3/s at Bechet, and 16450 m3/s at Giurgiu. The flood was also characterized by a high volume (116,000 × 106 m3 of water) due to an extended period of time (from March 2006 to July 2006) with high flows.
Following the Water Framework Directive 2000/60/EC (European Commission, 2000) and the Flood Directive 2007/60/EC (European Commission, 2007), an increasing number of studies are oriented to improve flood risk mitigation by repairing and restoring the ecological characteristics of (part of) the floodplain, restoring the “natural” conditions as before the construction of flood defense systems, as well as ensuring the sustainable development of the adjacent areas. An approach for designing and implementing a wetland restoration process in the study area was started by the Romanian branch of the WWF. The project was positively evaluated by the local communities because it was considered as an effective solution to stop the economic decline of the areas and the consequent depopulation process. However, the implementation of the project has been hampered due to the lack of involvement of key institutional actors, such as the Romanian Waters and other national authorities. Therefore, we assumed a multilevel governance approach in designing the participatory process and in selecting the stakeholders to be involved.
The stakeholders listed in the following Table 2 (taken from Giordano et al., 2020) were engaged in the participatory process:
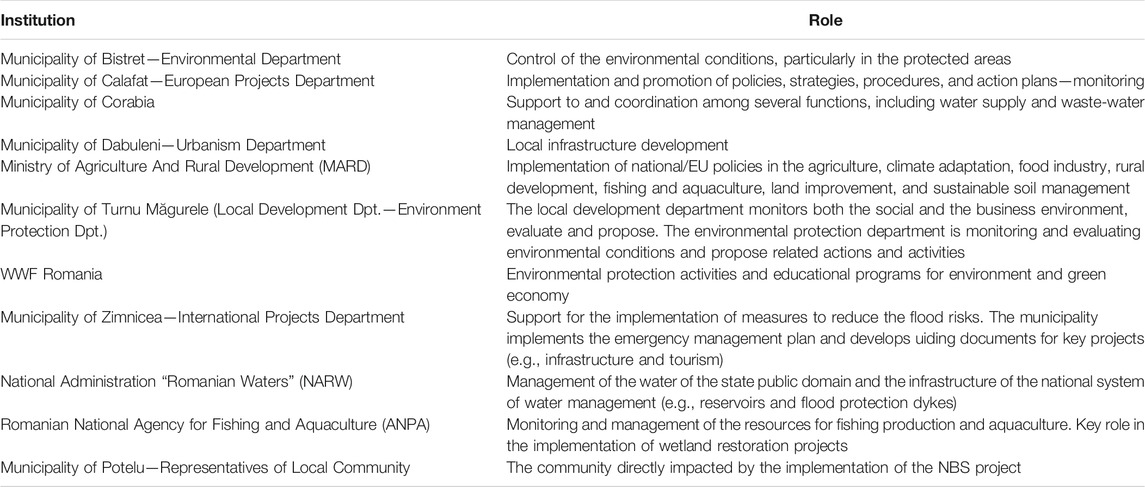
TABLE 2. List of the stakeholders involved in the case study activities.
The selection was carried out adopting the “snowball sampling” approach (Reed et al., 2009). That is, starting from the key stakeholders—for example, the local branch of the WWF and the representatives of the local municipalities—other key stakeholders to be involved were identified. Specifically, the representative of the local municipalities allowed us to discuss with some of the local citizens and small farmers. Concerning the agricultural sector, it is worth mentioning that only few farmers were involved in our activities since most of the cultivated land is managed by an international firm that did not accept our invitation.
Individual semi-structured interviews were carried out referring to the framework for the interview described in “Materials and Methods.” The results of the interviews were coded in an individual FCM by detecting causal connections in the stakeholders’ argumentation. The FCM aggregation process based on Kosko (1986) and described in Modelling Flood Risk Perceptions was implemented at this stage. Figure 4 shows the obtained FCM. This model represents the stakeholders’ perception about the main water-related risks and the expected role of NBSs both in terms of risk reduction and co-benefit production. A validation phase of the aggregated FCM, to check the consistency of variables, connections, and strength, was carried out with the most experienced stakeholders in the group, namely, the WWF and the majors of the villages in the study area. It is worth mentioning that the validation of the FCM was carried out accounting for the qualitative nature of the model. FCMs were implemented in this work because of their capability to create a useful and formalized description of the perception of a group of stakeholders of the problem under consideration (Jetter and Kok, 2014). Therefore, contrarily to most of the quantitative models used in environmental science, an FCM should be considered validated if it adequately describes the participants’ understanding about the subject matter. The validation was carried out by describing to the most experienced stakeholders the complex causal networks affecting the behavior of the key variables in the FCM, accounting for both direct and indirect effects, and by discussing the system behavior in simple cases for the key variables. The results of the discussion were used for improving the FCM capability to describe the participants’ understanding of the system dynamic.
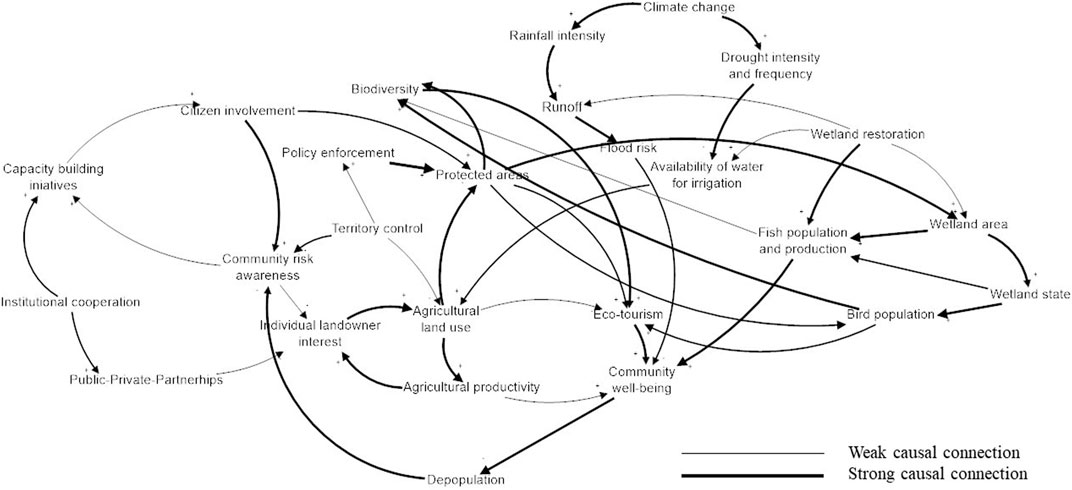
FIGURE 4. Aggregated FCM for the Potelu area.
Prior to aggregating the stakeholders-driven model with the scientific model, the FCM was transformed into a BBN. As already described in “Materials and Methods,” this phase requires to i) adapt the structure of the FCM to the BBN requirements and ii) develop the CPT for each variable starting from the causal connections in the FCM.
Concerning the first point, two issues need to be addressed. Namely, the variable dependency and conditional independency, and circular relationships. First, the connection among the different variables was checked with the local experts involved in the validation of the FCM. This phase was meant to identify redundant and/or missing connections among the variables in the FCM. The experts decided to delete some of the existing connections which were considered as redundant. For example, the connection between the variables “wetland area” and “fish production” was deleted, because this connection was indirectly considered through the variable “wetland state.” Most of the efforts in this phase were carried out in order to detect and redefine circular relationships. By checking the direct vs. indirect causal connections, some of the detected loops were eliminated in this phase. It is worth mentioning that these loops do not affect the capability of the FCM to represent and model the stakeholders’ knowledge. This FCM simplification phase was needed to transform the FCM in a BBN, which needs to be acyclical. Other circular relationships were included in the FCM because they indicated dynamic relationships between the variables.
Figure 5A shows one of the loops in the aggregated FCM. This loop describes a dynamic relationship among the variables “capacity building,” “citizen involvement,” and “community risk awareness.” According to this loop, capacity-building initiatives enhance the involvement of the community in risk management, and, in turn, this is expected to provoke an increase of the community risk awareness. Then, a more aware community might lead to an increasing effectiveness of the capacity-building initiative. In order to allow the development of the BBN, this circular relation was de-aggregated. Specifically, the variable “capacity building” was de-aggregated in two sequential variables, that is, “capacity-building initiatives,” which refers to initial decision to carry out capacity-building activities, and “engagement effectiveness,” which refers to the impacts of the increasing/decreasing community risk awareness. Figure 5 shows the comparison between the FCM before (A) and after (B) the de-aggregation of the circular relationships.
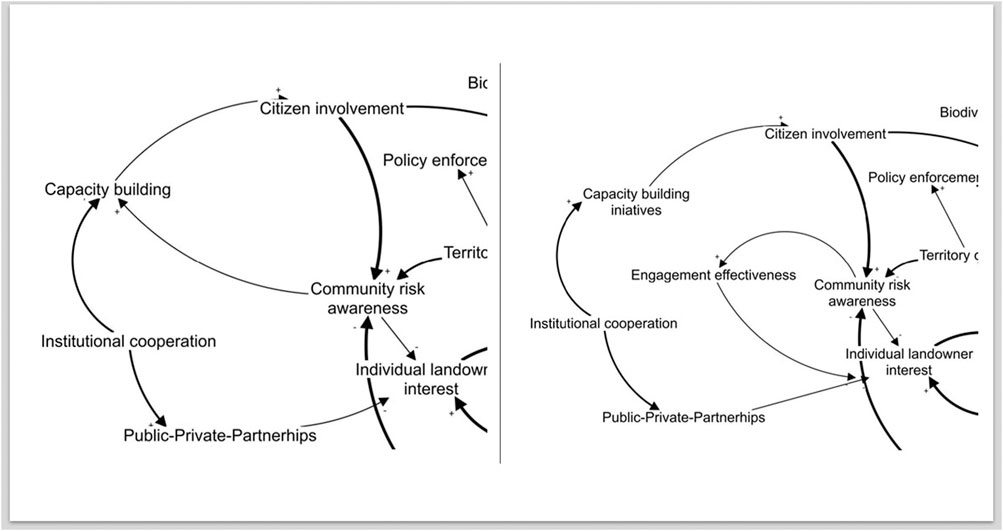
FIGURE 5. (A) Structure of the map before the de-aggregation of circular relationships and (B) structure of the map after the de-aggregation of circular relationships.
Next step was the development of the conditional probability table (CPT) for each variable in the BBN. As described in “Materials and Methods,” the CPTs were developed referring to the weights of the causal connections in the FCM. As an example, we could consider the variable “protected areas” that represents the extension of the areas protected by the national authority. According to the stakeholders’ knowledge, the potential states of this variable are “increasing” and “decreasing.” The parental variables are “community awareness” (high and low), “landowner interests” (high and low), and “policy enforcement” (satisfactory and non-satisfactory). The states of the parental variables are between brackets. The fuzzy linguistic functions of these variables were used for developing the CPT for the variable “protected areas.” The FCM was used for calculating the value of the variable “protected areas,” given the values of the parent nodes. Table 3 shows the results of the FCM calculation.
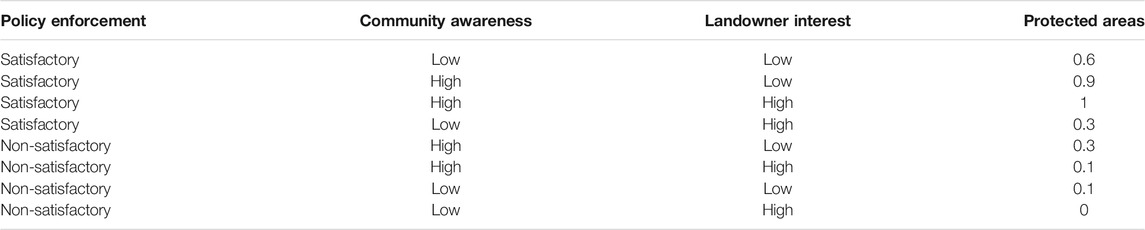
TABLE 3. Results of the FCM for the variable “protected areas.”
Figure 6 shows the fuzzy linguistic function describing the variable “protected areas,” as developed during the stakeholders’ engagement process. These values were, then, used for developing the CPT for the variable “Protected areas.” To this aim, the crisp values calculated referring to the Kosko equation were reported in the fuzzy linguistic function, in order to assess the membership degrees to the two fuzzy linguistic sets—that is, “Decreasing” and “Increasing.” A qualitative value was used in this case for defining the X-axis since this variable refers to the capability of the authorities to enforce the national law for protecting the natural areas. The value “1” was assigned in case of high capacity. As shown in Figure 6, the crisp value 0.6 could be considered as “increasing” with a membership degree equal to µi = 0.75, and as “decreasing” with a membership degree equal to µd = 0.50.
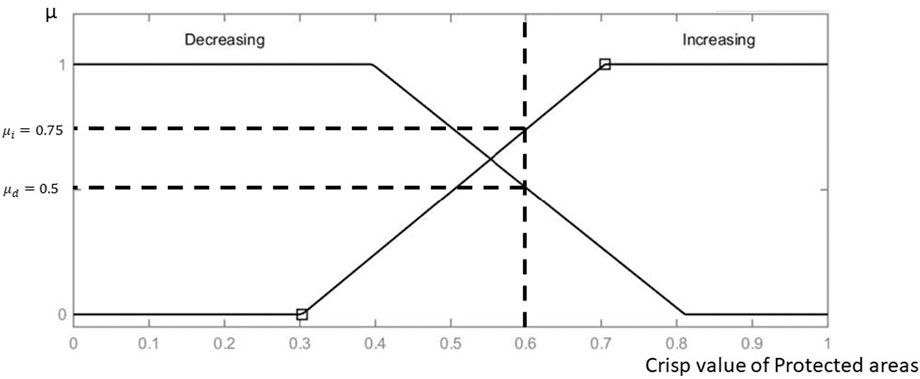
FIGURE 6. Membership degree assessment for the crisp value 0.6 of the variable “Protected areas.”
Therefore, the conditional probabilities of the values “decreasing” and “increasing” (CP(1) and CP(d), respectively) can be calculated as follows:

TABLE 4. Summary of the transition from the FCM to the CPT for the variable “protected areas.”
Similarly, the FCM was used for defining the CPT for the other variables in the BBN (see the Supplementary Material for additional details).
A hydraulic model for the Danube River in the study area was built using HEC-RAS software. The study area is delimited by two hydrological stations (Bechet—upstream, and Corabia—downstream). The developed model consists of a 1-D model for the Danube River channel and a 2-D model for the Dăbuleni–Potelu–Corabia wetland. For the retrospective analysis of the 2006 flood, the connection between the 1-D and the 2-D hydraulic model was achieved considering two spills, located in areas where two main breaches appeared in the dikes.
The developed model has the following features (full details are included in the Supplementary Material):
• The distance between the cross sections is approx. 1 km, and their location corresponds to the Danube kilometer landmarks.
• The numerical model of the terrain consists of a grid with a 5-m resolution. For the two-dimensional model area, the grid cell size is set to 30 m.
The hydraulic model was calibrated aligning model results with hydrological observations in the 2006 event (i.e., flow rate, time to flood peak, total volume, and rating curves) by trial and error. The calibration was performed first through the roughness coefficients (regulating the hydraulic resistance of the river channel), which is a challenging yet essential procedure for building a solid HM (USACE, 2010; Ardıçlıoğlu and Kuriqi, 2019). This was set as 0.03 in the channel and 0.07 in the floodplain, while the reference values (Chow, 1959) for the landcover were used for the area (refer to the Supplementary Material “Discussion and Concluding Remarks” for additional information). Second, other model parameters were considered, such as the cross-sectional storage (ineffective areas) and the backwater areas to improve the reproduction of flow hydrographs. Last, from the computational point of view, time step and distance calculation steps along the river (DT and DX), and the number of cycles for integrating equations were considered. The calibration of the hydraulic model in terms of flow and level hydrographs, and of rating curves has been performed in both hydrometric stations (Bechet and Calafat) as detailed in the Supplementary Material.
The proposed hydraulic model was then used to perform a “scenario analysis,” that is, a quantitative assessment of the effectiveness, in terms of flood risk reduction, of the re-naturalization process of the Dăbuleni–Potelu–Corabia wetland. Starting from the results of the participatory process described by Giordano et al. (2020), Coletta et al. (2021), the main physical characteristics of the wetland (e.g., area and location) needed for the modelling were defined. The hydraulic model was then translated into a BBN, as described in Hydraulic-Based Bayesian Belief Network for the Flood Risk Assessment, in order to support analyzing different wetland restoration scenarios, ranging from a partial to a total flooding of the area. Specifically, the state of some of the variables included in Table 1 and their mutual connections were defined, including information directly retrieved from HEC-RAS, as detailed in the following.
First, a reference cross section for the analysis was set. In order to properly compare the results in case of water retention measures with different characteristics, a section located upstream the wetland was chosen. In this section, the stage–discharge relationship (relating the discharge Q to the water level H) was defined through the HEC-RAS model, and is represented by the following equation:
The stage–discharge relationship is included in the BBN to calculate the discharge as a function of variable values of the water level in the selected cross section.
Second, the model was used to define the main characteristic curves of the wetland area, in variable conditions. Specifically, the curves represent 1) the available volume for storage in case of flood (Vw), for different dike elevation (Hd) values; and 2) the corresponding wetland area (Aw). The value 28 m represents the condition of absence of flood defense dikes, which could be achieved with re-naturalization of the river. The volume-elevation equation and the area-elevation equation derived by the HEC-RAS model and reported in the following text are included in the BBN to compute, respectively, the “Storage volume” (Eq. 6) and the “Design Area” (Eq. 7) of the wetland:
Third, the flood volume was computed in a simplified way starting from the flow hydrograph, as described in Hydraulic-Based Bayesian Belief Network for the Flood Risk Assessment. We referred to the flow hydrograph associated to the 2006 flood event, which was used for the following Eq. 8. Given the flood duration (T) and the discharge (Q) as input, the flood volume (V) was calculated considering a combination of the baseflow (constant, 10,000 m3/s) and of the direct runoff volume (triangular and for a duration set as T/2, but variable), according to the following equation:
Considering the results provided by HEC-RAS simulations, the effect of the wetland restoration in “optimal” conditions (i.e., Aw is approx. 14,000 ha) is a decrease of the maximum flows by about 430 m3/s in the downstream section and a decrease of the maximum level of approx. 36 cm. This effect does not significantly reduce (directly) the flooded areas for such extreme events, but contributes to reduce the pressure on the existing defense dikes, which is highly relevant for the reduction of flood risk. This was discussed in detail with local experts and used for building the CPT for the probabilistic estimate of the variable “Flood risk reduction.” The BBN built for the flood risk assessment is shown in Figure 7.
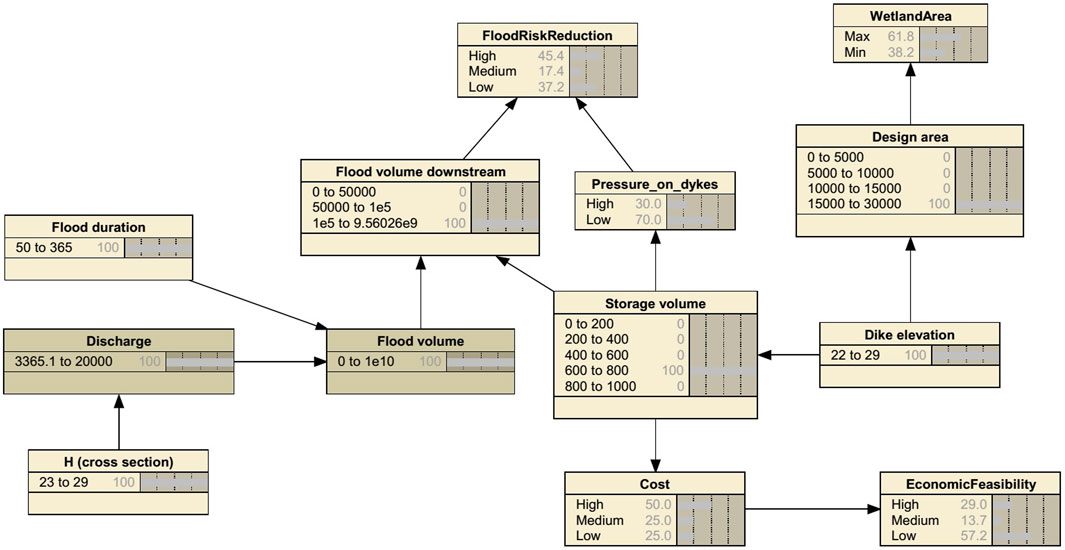
FIGURE 7. Flood risk assessment part of the BBN.
For the sake of simplicity, in the present work, we considered deterministic values for defining the state of the input variables. However, it should be considered that BBN allows defining the input variables’ states using a distribution of probability, and related uncertainty in such case is propagated through the model.
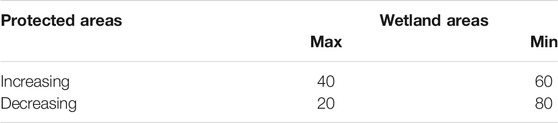
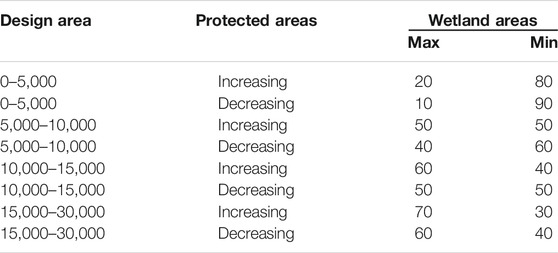
As already described in Development of the Integrated Bayesian Belief Network and Assessment of Nature-based Solutions Effectiveness, this phase of the process aimed at connecting the two developed BBNs. The connecting variable here was the “wetland area,” which was connected to the variable “protected areas” in the stakeholder-based BBN—representing the authorities’ capabilities in enforcing regulations for protecting natural areas—and the variable “design area” in the hydraulic-based BBN—representing the area available for the wetland restoration, according to the results of the hydraulic model, for different values of the dike elevation.
The process for combining the two CPTs is shown in Table 5.

TABLE 5. (A) CPT of the variable “Wetland areas” in the stakeholder-based BBN. (B) CPT of the variable “Wetland areas” in the hydraulic-based BBN. (C). CPT of the variable “Wetland areas” in the combined BBN.
. (A)

. (B)
. (C)
Figure 8 shows the combined BBN that was used for detecting potential barriers hampering the effectiveness of the NBS in the study area. To this aim, the NBS effectiveness was conceptualized as related to the NBS capability to both reduce the flood risk and produce the expected co-benefits.
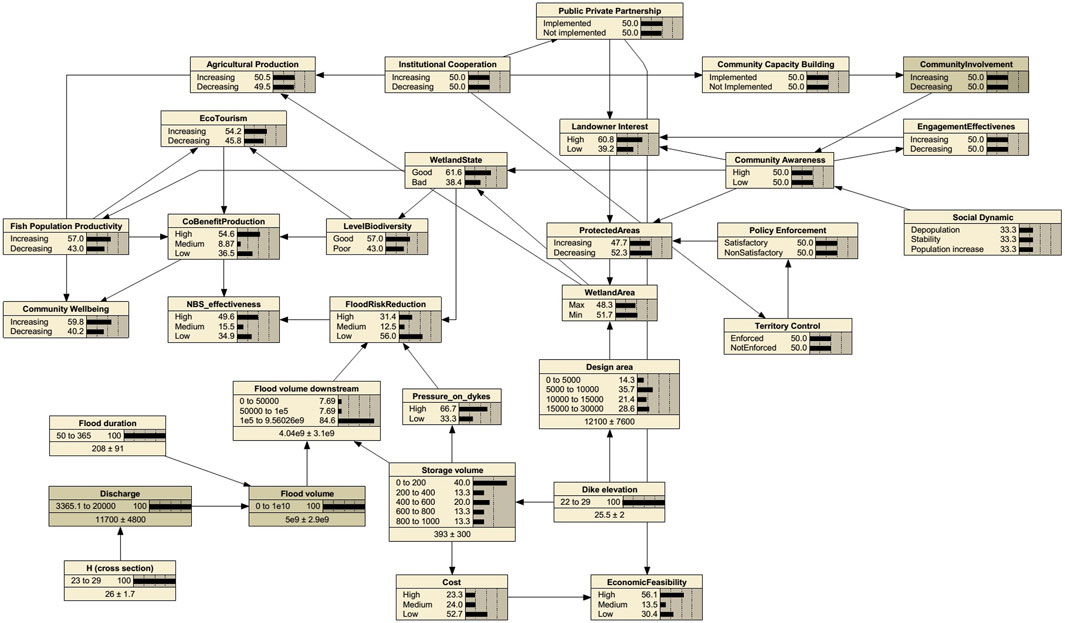
FIGURE 8. Integrated BBN for the study area.
The integrated BBN has been used to support a scenario analysis useful to identify current problems and bottlenecks, along with measures and actions that might contribute to improve the effectiveness of the selected NBS. In the following Figures 9, 10, the variables in gray define input variables for the scenarios, whose state is set as known (i.e., 100% probability), to perform the analysis.
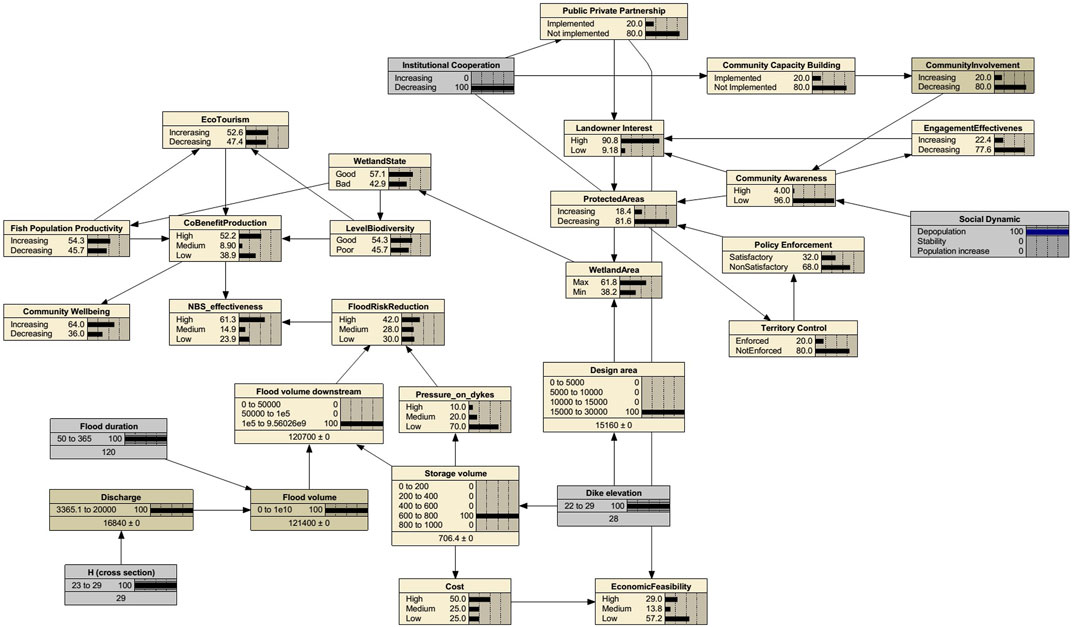
FIGURE 9. Scenario analysis: 1) “Current restoration” scenario.
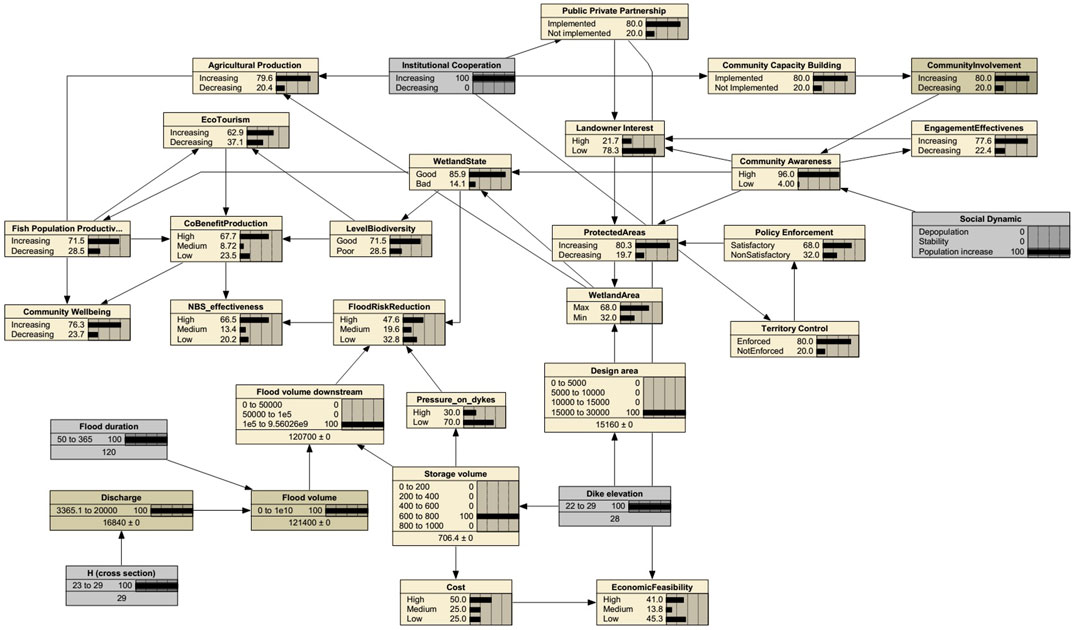
FIGURE 10. Scenario analysis: 2) “Improved awareness/cooperation” scenario.
Figure 9 describes the “Current restoration” scenario. The technical performances of the selected NBS are satisfactory (the “Flood Risk Reduction” is rather high), also considering that an extreme event is being modeled. However, the model has been tested for ordinary events as well (i.e., reducing flood duration and discharge, which is not reported here for the sake of brevity), and the “Flood Risk Reduction” capability significantly increases. As requested, besides reducing the flood volume, a key technical benefit associated to the introduction of the NBS is to keep the “Pressure on dykes” low. However, it should also be noticed that such restoration scenario has also high costs, and therefore a low “Economic Feasibility.” It is worth highlighting that the “wetland state” (which is heavily conditioned by the low “community awareness”) is a limiting factor for the flood risk reduction capability. Furthermore, it should also be stressed that the area devoted to the wetland might also limit the potential for agricultural production over the area, due also to the currently low institutional cooperation. This aspect significantly affects the population well-being, along with the production of co-benefits associated to the wetland restoration.
The Scenario 2, analyzed in Figure 10, is obtained by improving the state of two “soft” variables, which may represent limiting factors with respect to the NBS effectiveness, that is, the “institutional cooperation” and the “community awareness.” In the current condition, as suggested by the local stakeholders, both variables are significantly hampering the development of the area and might condition the chance to fully exploit the potential of the wetland restoration. With respect to the “community awareness,” it has a direct effect on the improvement of the “wetland state.” The flood risk reduction capability of the NBS is limitedly affected, since a better state of the wetland might to some extent guarantee a better hydraulic response to flood events. However, it is clearly highlighted that the mentioned variable may directly contribute to increase the co-benefit production and, as a consequence, the overall NBS effectiveness as well as, and ultimately, the community well-being. It should also be stressed that the community well-being is positively affected by the impact of an increasing “institutional cooperation” on the “agricultural production.” This is a crucial aspect for the evolution of the area, also considering the mainly problems highlighted by the local stakeholders. In fact, improving the institutional cooperation would help on the one hand small landowners to have a more central role in agricultural activities with respect to big companies and, on the other hand, could improve the willingness to restore and value the wetland. Furthermore, an increased institutional cooperation, which facilitates Public Private Partnership initiatives, is also expected to positively contribute to the economic impact of the restoration scenario.
The present work aimed to demonstrate the suitability of the BBN to support integration between FCMs and HM, for enhancing the effectiveness assessment of the NBS in dealing with flood risk. In this direction, the proposed integrated modeling aims to support the detection, analysis, and overcoming of barriers to NBS implementation, thus also suggesting potential strategies, through the explicit integration of stakeholders’ and scientific knowledge. The present section aims to critically discuss to what extent the proposed work contributes to answer the research questions raised in the Introduction.
First, with respect to the capability of FCMs and BBNs to account for the diversity of stakeholders’ problem understanding, it is worth stressing the key role of FCMs in structuring individual knowledge and clearly identifying strategic objectives, vulnerabilities, and challenges for the area according to the single stakeholder’s perception. However, the main goal of this work was to develop a knowledge-based model capable to account for the diversities among the involved stakeholders. Starting from the analysis of the differences, an aggregation process was carried out to develop a model representing the stakeholders’ knowledge, which is specifically targeted on the co-benefit production (with particular attention to the potential onset of trade-offs). The mathematical aggregation procedure provides a formal basis to support a straightforward transition to the BBN form, which also requires that the circular relationships between variables are solved and that CPTs are built. Both steps were performed along with local stakeholders, and, particularly, the latter was based on the use of fuzzy functions, which supports structuring the linguistic information provided by the stakeholders in a mathematically sound form without increasing the stakeholders’ fatigue, as in previous works. Key stakeholders were involved throughout model building, analysis, and validation, thanks also to the visually effective structure of the model. It is worth considering that the model, in its current form, does not consider any weight for different stakeholders, whose knowledge is therefore assumed as “equally important” for model building.
The proposed methodological approach contributes also to answer the second research question, which is specifically related to the potential of the participatory BBN to support a collective learning process on NBS implementation. Specifically, the added value of the proposed model is related to the thorough identification of the enabling factors to the introduction of the NBS, and strongly highlighted the need of activating socio-institutional measures to improve the effectiveness of the NBS and to facilitate their implementation. Indeed, although well-consolidated models such as HM provide a deep understanding of the technical performances of the NBS, the proposed BBN allows identifying the influence of socio-institutional strategies as well. For example, in the analyzed model, the role of the “community awareness” (which is currently relatively low according to stakeholders’ understanding) has a crucial role to support improving the state of the wetland, ultimately contributing to hamper/increase the effectiveness in terms of flood risk reduction and co-benefit production. Indeed, this is currently identified as one of the main barriers to NBS implementation, and therefore one of the key policies to be implemented in order to enhance the NBS effectiveness.
Third, the use of a BBN model allowed integrating scientific knowledge on flood risk with stakeholders’ knowledge. HM for the study area was built using a well-known software, and used for both analyzing extreme flood events and for a scenario simulation on the flood risk reduction potential of the wetland restoration. The main results of the model were translated into the BBN sets and fed the “flood risk assessment” part of the BBN. The “flood risk assessment” variable specifically provides information on the effectiveness of the selected measure with respect to a target flood event. The stakeholders’ knowledge complemented the BBN model, specifically describing the process of co-benefit production, which concur to the definition of a global “NBS effectiveness,” and identifying the role of some “soft” variables (i.e., those related to sociocultural and institutional aspects). However, the two “sub-models” are also tightly interconnected, since the “soft” variables have a crucial role on the wetland state and therefore on its flood risk reduction capability, as well as on the economic feasibility of the proposed intervention. Such influences, which are difficult to quantify, are effectively caught by the BBN model, which provides a clear description of the bottlenecks to NBS implementation and of the potential strategies/policies to overcome them.
The experience carried out in this work allowed us to also detect key drawbacks in the adopted methodology. The most important one concerned the use of FCMs as basis for the BBN development. In the FCM, the more complex is the structure, the richer is the knowledge represented in the model. Conversely, in the BBN simulation, the length of the path connecting two variables affects the actual impact of one variable over the other. This issue needs to be carefully considered while performing the transition from the FCM to the BBN, particularly if the scope of the BBN is to simulate intervention scenarios.
Additionally, as far as the HM part is concerned, it should be carefully considered that adjustments might be needed to adopt the proposed methodology for different applications. The use of simplified information (such as those deriving from the Q–H curves) might not be suitable to deal with particularly complex conditions such as pluvial floods in urban areas. In such cases, the results of specific numerical models and/or GIS data should be translated into the BBN form and adapted to the model. This aspect represents one of the key upgrades foreseen for the proposed model.
The raw data supporting the conclusions of this article will be made available by the authors, without undue reservation.
AS, AP, and RG contributed to conception and design of the study. AS, AP, VC, and RG organized and performed the activities with the stakeholders. UF and AP supported physical model integration. AS, AP, and RG wrote the first draft of the manuscript. VC and UF wrote sections of the manuscript. All authors contributed to manuscript revision, read, and approved the submitted version.
The research activities described in this work were supported by the H2020 NAIAD project (Grant agreement no. 730497).
The authors declare that the research was conducted in the absence of any commercial or financial relationships that could be construed as a potential conflict of interest.
We would like to thank the project team for the many stimulant discussions and kind cooperation. Furthermore, we also extended our heartfelt thanks to the institutional and noninstitutional stakeholders who provided their knowledge and expertise. We would like to thank also the Core Program (Program Nucleu) – “Developing integrated management for pilot areas of the Romanian Danube sector, influenced by climate change and anthropic interventions, by applying complex research methodologies,” contract no. 13N/08.02.2019, carried out by NIRD GeoEcoMar.
The Supplementary Material for this article can be found online at: https://www.frontiersin.org/articles/10.3389/feart.2021.674618/full#supplementary-material
Albert, C., Spangenberg, J. H., and Schröter, B. (2017). Nature-based Solutions: Criteria. Nature 543, 315. doi:10.1038/543315b
Alves, A., Gersonius, B., Sanchez, A., Vojinovic, Z., and Kapelan, Z. (2018). Multi-criteria Approach for Selection of Green and Grey Infrastructure to Reduce Flood Risk and Increase CO-benefits. Water Resour. Manage. 32, 2505–2522. doi:10.1007/s11269-018-1943-3
Alves, A., Vojinovic, Z., Kapelan, Z., Sanchez, A., and Gersonius, B. (2020). Exploring Trade-Offs Among the Multiple Benefits of green-blue-grey Infrastructure for Urban Flood Mitigation. Sci. Total Environ. 703, 134980. doi:10.1016/J.SCITOTENV.2019.134980
Ardıçlıoğlu, M., and Kuriqi, A. (2019). Calibration of Channel Roughness in Intermittent Rivers Using HEC-RAS Model: Case of Sarimsakli Creek, Turkey. SN Appl. Sci. 1, 1080. doi:10.1007/s42452-019-1141-9
Azar, A., and Mostafaee Dolatabad, K. (2019). A Method for Modelling Operational Risk with Fuzzy Cognitive Maps and Bayesian Belief Networks. Expert Syst. Appl. 115, 607–617. doi:10.1016/j.eswa.2018.08.043
Bain, P. G., Milfont, T. L., Kashima, Y., Bilewicz, M., Doron, G., Garðarsdóttir, R. B., et al. (2016). Co-benefits of Addressing Climate Change Can Motivate Action Around the World. Nat. Clim Change 6, 154–157. doi:10.1038/nclimate2814
Brugnach, M., and Ingram, H. (2012). Ambiguity: the challenge of Knowing and Deciding Together. Environ. Sci. Pol. 15, 60–71. doi:10.1016/j.envsci.2011.10.005
Cain, J. (2001). Planning Improvements in Natural Resources Management—Guidelines for Using Bayesian Networks to Support the Planning and Management of Development Programmes in the Water Sector and beyond. Wallingford: Centre for Ecology & Hydrology, Crowmarsh Gifford.
Calliari, E., Staccione, A., and Mysiak, J. (2019). An Assessment Framework for Climate-Proof Nature-Based Solutions. Sci. Total Environ. 656, 691–700. doi:10.1016/j.scitotenv.2018.11.341
Castán Broto, V., and Bulkeley, H. (2013). A Survey of Urban Climate Change Experiments in 100 Cities. Glob. Environ. Change 23, 92–102. doi:10.1016/j.gloenvcha.2012.07.005
Coletta, V. R., Pagano, A., Pluchinotta, I., Fratino, U., Scrieciu, A., Nanu, F., et al. (2021). Causal Loop Diagrams for Supporting Nature Based Solutions Participatory Design and Performance Assessment. J. Environ. Manage. 280, 111668. doi:10.1016/j.jenvman.2020.111668
Corfee-Morlot, J., Cochran, I., Hallegatte, S., and Teasdale, P.-J. (2011). Multilevel Risk Governance and Urban Adaptation Policy. Climatic Change 104, 169–197. doi:10.1007/s10584-010-9980-9
Eden, C. (1992). ON THE NATURE OF COGNITIVE MAPS. J. Manage. Stud. 29, 261–265. doi:10.1111/j.1467-6486.1992.tb00664.x
European Commission (2000). Directive 2000/60/EC of the European Parliament and of the Council of 23 October 2000 Establishing a Framework for Community Action in the Field of Water Policy. Documents in European Community Environmental Law. 879–969. doi:10.1017/cbo9780511610851.056
European Commission (2007). Directive 2007/60/EC of the European Parliament and of the Council of 23 October 2007 on the Assessment and Management of Flood Risks. (Text with EEA relevance).
Giabbanelli, P. J., Gray, S. A., and Aminpour, P. (2017). Combining Fuzzy Cognitive Maps with Agent-Based Modeling: Frameworks and Pitfalls of a Powerful Hybrid Modeling Approach to Understand Human-Environment Interactions. Environ. Model. Softw. 95, 320–325. doi:10.1016/j.envsoft.2017.06.040
Giordano, R., D’Agostino, D., Apollonio, C., Lamaddalena, N., and Vurro, M. (2013). Bayesian Belief Network to Support Conflict Analysis for Groundwater protection: The Case of the Apulia Region. J. Environ. Manage. 115, 136–146. doi:10.1016/j.jenvman.2012.11.011
Giordano, R., Pagano, A., Pluchinotta, I., del Amo, R. O., Hernandez, S. M., and Lafuente, E. S. (2017). Modelling the Complexity of the Network of Interactions in Flood Emergency Management: The Lorca Flash Flood Case. Environ. Model. Softw. 95, 180–195. doi:10.1016/j.envsoft.2017.06.026
Giordano, R., Pluchinotta, I., Pagano, A., Scrieciu, A., and Nanu, F. (2020). Enhancing Nature-Based Solutions Acceptance through Stakeholders’ Engagement in Co-benefits Identification and Trade-Offs Analysis. Sci. Total Environ. 713, 136552. doi:10.1016/j.scitotenv.2020.136552
Gómez Martín, E., Giordano, R., Pagano, A., van der Keur, P., and Máñez Costa, M. (2020). Using a System Thinking Approach to Assess the Contribution of Nature Based Solutions to Sustainable Development Goals. Sci. Total Environ. 738, 139693. doi:10.1016/j.scitotenv.2020.139693
Halbe, J., Knüppe, K., Knieper, C., and Pahl-Wostl, C. (2018). Towards an Integrated Flood Management Approach to Address Trade-Offs between Ecosystem Services: Insights from the Dutch and German Rhine, Hungarian Tisza, and Chinese Yangtze Basins. J. Hydrol. 559, 984–994. doi:10.1016/j.jhydrol.2018.02.001
Henriksen, H. J., Zorrilla-Miras, P., de la Hera, A., and Brugnach, M. (2012). Use of Bayesian Belief Networks for Dealing with Ambiguity in Integrated Groundwater Management. Integr. Environ. Assess. Manag. 8, 430–444. doi:10.1002/ieam.195
Howe, C., Suich, H., Vira, B., and Mace, G. M. (2014). Creating Win-Wins from Trade-Offs? Ecosystem Services for Human Well-Being: A Meta-Analysis of Ecosystem Service Trade-Offs and Synergies in the Real World. Glob. Environ. Change 28, 263–275. doi:10.1016/j.gloenvcha.2014.07.005
Jacobs, S., Dendoncker, N., Martín-López, B., Barton, D. N., Gomez-Baggethun, E., Boeraeve, F., et al. (2016). A New Valuation School: Integrating Diverse Values of Nature in Resource and Land Use Decisions. Ecosystem Serv. 22, 213–220. doi:10.1016/j.ecoser.2016.11.007
Jetter, A. J., and Kok, K. (2014). Fuzzy Cognitive Maps for Futures Studies-A Methodological Assessment of Concepts and Methods. Futures 61, 45–57. doi:10.1016/j.futures.2014.05.002
Jiang, P., Xu, B., Geng, Y., Dong, W., Chen, Y., and Xue, B. (2016). Assessing the Environmental Sustainability with a Co-benefits Approach: a Study of Industrial Sector in Baoshan District in Shanghai. J. Clean. Prod. 114, 114–123. doi:10.1016/j.jclepro.2015.07.159
Kabir, S., and Papadopoulos, Y. (2019). Applications of Bayesian Networks and Petri Nets in Safety, Reliability, and Risk Assessments: A Review. Saf. Sci. 115, 154–175. doi:10.1016/j.ssci.2019.02.009
Kabisch, N., Frantzeskaki, N., Pauleit, S., Naumann, S., Davis, M., Artmann, M., et al. (2016). Nature-based Solutions to Climate Change Mitigation and Adaptation in Urban Areas: Perspectives on Indicators, Knowledge Gaps, Barriers, and Opportunities for Action. E&S 21, 39. doi:10.5751/ES-08373-210239
Kaikkonen, L., Parviainen, T., Rahikainen, M., Uusitalo, L., and Lehikoinen, A. (2021). Bayesian Networks in Environmental Risk Assessment: A Review. Integr. Environ. Assess. Manag. 17, 62–78. doi:10.1002/ieam.4332
Kok, K. (2009). The Potential of Fuzzy Cognitive Maps for Semi-quantitative Scenario Development, with an Example from Brazil. Glob. Environ. Change 19, 122–133. doi:10.1016/j.gloenvcha.2008.08.003
Kosko, B. (1986). Fuzzy Knowledge Combination. Int. J. Intell. Syst. 1, 293–320. doi:10.1002/int.4550010405
Mourhir, A. (2021). Scoping Review of the Potentials of Fuzzy Cognitive Maps as a Modeling Approach for Integrated Environmental Assessment and Management. Environ. Model. Softw. 135, 104891. doi:10.1016/j.envsoft.2020.104891
Nadkarni, S., and Shenoy, P. P. (2001). A Bayesian Network Approach to Making Inferences in Causal Maps. Eur. J. Oper. Res. 128, 479–498. doi:10.1016/S0377-2217(99)00368-9
Nadkarni, S., and Shenoy, P. P. (2004). A Causal Mapping Approach to Constructing Bayesian Networks. Decis. Support Syst. 38, 259–281. doi:10.1016/S0167-9236(03)00095-2
O’Donnell, E. C., Lamond, J. E., and Thorne, C. R. (2017). Recognising Barriers to Implementation of Blue-Green Infrastructure: a Newcastle Case Study. Urban Water J. 14, 964–971. doi:10.1080/1573062X.2017.1279190
Ozesmi, U., and Ozesmi, S. (2003). A Participatory Approach to Ecosystem Conservation: Fuzzy Cognitive Maps and Stakeholder Group Analysis in Uluabat Lake, Turkey. Environ. Manage. 31, 518–531. doi:10.1007/s00267-002-2841-1
Pagano, A., Pluchinotta, I., Giordano, R., and Fratino, U. (2018a). Integrating “Hard” and “Soft” Infrastructural Resilience Assessment for Water Distribution Systems. Complexity 2018, 1–16. doi:10.1155/2018/3074791
Pagano, A., Pluchinotta, I., Giordano, R., Petrangeli, A. B., Fratino, U., and Vurro, M. (2018b). Dealing with Uncertainty in Decision-Making for Drinking Water Supply Systems Exposed to Extreme Events. Water Resour. Manage. 32, 2131–2145. doi:10.1007/s11269-018-1922-8
Pagano, A., Pluchinotta, I., Pengal, P., Cokan, B., and Giordano, R. (2019). Engaging Stakeholders in the Assessment of NBS Effectiveness in Flood Risk Reduction: A Participatory System Dynamics Model for Benefits and Co-benefits Evaluation. Sci. Total Environ. 690, 543–555. doi:10.1016/j.scitotenv.2019.07.059
Page, T., Heathwaite, A. L., Thompson, L. J., Pope, L., and Willows, R. (2012). Eliciting Fuzzy Distributions from Experts for Ranking Conceptual Risk Model Components. Environ. Model. Softw. 36, 19–34. doi:10.1016/j.envsoft.2011.03.001
Palmer, M. A., Liu, J., Matthews, J. H., Mumba, M., and D’Odorico, P. (2015). Manage Water in a green Way. Science 349, 584–585. doi:10.1126/science.aac7778
Papageorgiou, E., and Kontogianni, A. (2012). “Using Fuzzy Cognitive Mapping in Environmental Decision Making and Management: A Methodological Primer and an Application,”in International Perspectives On Global Environmental Change (New York, NY: InTech). doi:10.5772/29375
Phan, T. D., Smart, J. C. R., Capon, S. J., Hadwen, W. L., and Sahin, O. (2016). Applications of Bayesian Belief Networks in Water Resource Management: A Systematic Review. Environ. Model. Softw. 85, 98–111. doi:10.1016/j.envsoft.2016.08.006
Raymond, C. M., Frantzeskaki, N., Kabisch, N., Berry, P., Breil, M., Nita, M. R., et al. (2017). A Framework for Assessing and Implementing the Co-benefits of Nature-Based Solutions in Urban Areas. Environ. Sci. Pol. 77, 15–24. doi:10.1016/j.envsci.2017.07.008
Reed, M. S., Graves, A., Dandy, N., Posthumus, H., Hubacek, K., Morris, J., et al. (2009). Who’s in and Why? A Typology of Stakeholder Analysis Methods for Natural Resource Management. J. Environ. Manage. 90, 1933–1949. doi:10.1016/j.jenvman.2009.01.001
Renn, O. (1998). The Role of Risk Perception for Risk Management. Reliability Eng. Syst. Saf. 59, 49–62. doi:10.1016/S0951-8320(97)00119-1
Renn, O. (2011). The Social Amplification/attenuation of Risk Framework: Application to Climate Change. Wires Clim. Change 2, 154–169. doi:10.1002/wcc.99
Ruangpan, L., Vojinovic, Z., Di Sabatino, S., Leo, L. S., Capobianco, V., Oen, A. M. P., et al. (2020). Nature-Based Solutions for Hydro-Meteorological Risk Reduction: A State-Of-The-Art Review of the Research Area. Nat. Hazards Earth Syst. Sci. 20, 243–270. doi:10.5194/nhess-2019-12810.5194/nhess-20-243-2020
Santoro, S., Pluchinotta, I., Pagano, A., Pengal, P., Cokan, B., and Giordano, R. (2019). Assessing Stakeholders’ Risk Perception to Promote Nature Based Solutions as Flood protection Strategies: The Case of the Glinščica River (Slovenia). Sci. Total Environ. 655, 188–201. doi:10.1016/j.scitotenv.2018.11.116
Sarabi, S., Han, Q., Romme, A. G. L., de Vries, B., Valkenburg, R., and den Ouden, E. (2020). Uptake and Implementation of Nature-Based Solutions: An Analysis of Barriers Using Interpretive Structural Modeling. J. Environ. Manage. 270, 110749. doi:10.1016/j.jenvman.2020.110749
Shi, H., Luo, G., Zheng, H., Chen, C., Bai, J., Liu, T., et al. (2020). Coupling the Water-Energy-Food-Ecology Nexus into a Bayesian Network for Water Resources Analysis and Management in the Syr Darya River basin. J. Hydrol. 581, 124387. doi:10.1016/j.jhydrol.2019.124387
Shrestha, S., and Dhakal, S. (2019). An Assessment of Potential Synergies and Trade-Offs between Climate Mitigation and Adaptation Policies of Nepal. J. Environ. Manage. 235, 535–545. doi:10.1016/j.jenvman.2019.01.035
Small, N., Munday, M., and Durance, I. (2017). The challenge of Valuing Ecosystem Services that Have No Material Benefits. Glob. Environ. Change 44, 57–67. doi:10.1016/j.gloenvcha.2017.03.005
Sperotto, A., Molina, J.-L., Torresan, S., Critto, A., and Marcomini, A. (2017). Reviewing Bayesian Networks Potentials for Climate Change Impacts Assessment and Management: A Multi-Risk Perspective. J. Environ. Manage. 202, 320–331. doi:10.1016/j.jenvman.2017.07.044
Tepes, A., and Neumann, M. B. (2020). Multiple Perspectives of Resilience: A Holistic Approach to Resilience Assessment Using Cognitive Maps in Practitioner Engagement. Water Res. 178, 115780. doi:10.1016/j.watres.2020.115780
Uusitalo, L., Lehikoinen, A., Helle, I., and Myrberg, K. (2015). An Overview of Methods to Evaluate Uncertainty of Deterministic Models in Decision Support. Environ. Model. Softw. 63, 24–31. doi:10.1016/j.envsoft.2014.09.017
Voinov, A., Kolagani, N., McCall, M. K., Glynn, P. D., Kragt, M. E., Ostermann, F. O., et al. (2016). Modelling with Stakeholders—Next Generation. Environ. Model. Softw. 77, 196–220. doi:10.1016/j.envsoft.2015.11.016
Vojinovic, Z. (2020). Nature-based Solutions for Flood Mitigation and Coastal Resilience: Analysis of EU-Funded Projects. Berlin: Springer. doi:10.2777/374113
Wam, H. K., Bunnefeld, N., Clarke, N., and Hofstad, O. (2016). Conflicting Interests of Ecosystem Services: Multi-Criteria Modelling and Indirect Evaluation of Trade-Offs between Monetary and Non-monetary Measures. Ecosystem Serv. 22, 280–288. doi:10.1016/j.ecoser.2016.10.003
Keywords: Bayesian belief networks, nature-based solutions, flood risk assessment, co-benefits, stakeholder engagement, fuzzy cognitive maps, hydraulic modeling
Citation: Scrieciu A, Pagano A, Coletta VR, Fratino U and Giordano R (2021) Bayesian Belief Networks for Integrating Scientific and Stakeholders’ Knowledge to Support Nature-Based Solution Implementation. Front. Earth Sci. 9:674618. doi: 10.3389/feart.2021.674618
Received: 01 March 2021; Accepted: 09 June 2021;
Published: 05 July 2021.
Edited by:
Valerio Acocella, Roma Tre University, ItalyReviewed by:
Hans Jørgen Henriksen, Geological Survey of Denmark and Greenland, DenmarkCopyright © 2021 Scrieciu, Pagano, Coletta, Fratino and Giordano. This is an open-access article distributed under the terms of the Creative Commons Attribution License (CC BY). The use, distribution or reproduction in other forums is permitted, provided the original author(s) and the copyright owner(s) are credited and that the original publication in this journal is cited, in accordance with accepted academic practice. No use, distribution or reproduction is permitted which does not comply with these terms.
*Correspondence: Alessandro Pagano, YWxlc3NhbmRyby5wYWdhbm9AYmEuaXJzYS5jbnIuaXQ=
Disclaimer: All claims expressed in this article are solely those of the authors and do not necessarily represent those of their affiliated organizations, or those of the publisher, the editors and the reviewers. Any product that may be evaluated in this article or claim that may be made by its manufacturer is not guaranteed or endorsed by the publisher.
Research integrity at Frontiers
Learn more about the work of our research integrity team to safeguard the quality of each article we publish.