
94% of researchers rate our articles as excellent or good
Learn more about the work of our research integrity team to safeguard the quality of each article we publish.
Find out more
ORIGINAL RESEARCH article
Front. Earth Sci., 29 June 2021
Sec. Solid Earth Geophysics
Volume 9 - 2021 | https://doi.org/10.3389/feart.2021.673753
This article is part of the Research TopicRock Physics and Geofluid DetectionView all 27 articles
 Martin Balcewicz1,2*
 Mirko Siegert1,2
 Marcel Gurris1
 Matthias Ruf3
 David Krach3
 Holger Steeb3,4
 Erik H. Saenger1,2,5
Over the last 3 decades, Digital Rock Physics (DRP) has become a complementary part of the characterization of reservoir rocks due to the non-destructive testing character of this technique. The use of high-resolution X-ray Computed Tomography (XRCT) has become widely accepted to create a digital twin of the material under investigation. Compared to other imaging techniques, XRCT technology allows a location-dependent resolution of the individual material particles in volume. However, there are still challenges in assigning physical properties to a particular voxel within the digital twin, due to standard histogram analysis or sub-resolution features in the rock. For this reason, high-resolution image-based data from XRCT, transmitted-light microscope, Scanning Electron Microscope (SEM) as well as geological input properties like geological diagenesis, mineralogical composition, sample’s microfabrics, and estimated sample’s porosity are combined to obtain an optimal spatial segmented image of the studied Ruhr sandstone. Based on a homogeneity test, which corresponds to the evaluation of the gray-scale image histogram, the preferred scan sample sizes in terms of permeability, thermal, and effective elastic rock properties are determined. In addition, these numerically derived property predictions are compared with laboratory measurements to obtain possible upper limits for sample size, segmentation accuracy, and a geometrically calibrated digital twin of the Ruhr sandstone. The comparison corresponding gray-scale image histograms as a function of sample sizes with the corresponding advanced numerical simulations provides a unique workflow for reservoir characterization of the Ruhr sandstone.
Digital Rock Physics (DRP) and its use of non-destructive methods to determine permeability or effective elastic rock properties have become a complementary part in reservoir characterization over the past 3 decades (e.g., Blunt and King, 1991; Iassonov et al., 2009; Andrä et al., 2013a; Andrä et al., 2013b). Whether in estimating the total reservoir volume, potential reservoir production rates, or interpreting seismic lines above reservoirs, DRP contributes in all major subfields (e.g., Fan et al., 2010; Aljamaan et al., 2017). To cover the increasing demand for energy supply (e.g., Scheer et al., 2013; Araújo, 2014) and to achieve the climate targets that have been set (e.g., Rogelj et al., 2016), currently non-fossil reservoirs are studied, such as in geothermal energy projects (e.g., Fridleifsson et al., 2008; Goldstein et al., 2011). For this purpose, the determination of the thermal conductivity, as well as the heat capacity, is becoming increasingly important in DRP. In the course of future regional explorations of the geothermal potentials in North Rhine-Westfalia, western Germany (e.g., Knutzen, 2017; Lippert et al., 2019; Kruszewski et al., 2020; Weiß, 2020; Balcewicz et al., 2021a; Jüstel, 2021; Lippert et al., 2021), results from DRP will become more important for this region. The Ruhr sandstone is to be the start of a comprehensive DRP investigation of the Upper Carboniferous Ruhr cyclothem, which occupies a predominant part in the Rhine-Ruhr metropolitan region, featuring the largest European district heating network (AGFW, 2009). One of the essential questions to be answered in the coming years is: Which geological horizons are suitable for geothermal projects? DRP will be used to further investigate the specific rock properties of the Ruhr sandstone, which so far can only be answered with great effort using classical laboratory methods.
Although high-resolution X-Ray Computed Tomography (XRCT) technology has opened up many possibilities through the visualization of the third spatial plane, it is not a stand-alone tool for material characterization (e.g., Holzer and Cantoni, 2012). This is especially true for fine-pored phases in carbonates or grain and phase boundaries in general (e.g., Saenger et al., 2016b). Nevertheless, in order to use the three-dimensional information provided by XRCT, it is necessary to utilize additional sources of information. An already established source of information is laboratory measurements that can provide rock properties such as permeability or porosity at ambient or elevated pressure and temperature conditions (e.g., Ahrens et al., 2018; Schepp and Renner, 2021). However, such laboratory measurements are resource and cost intensive, which is why the application of DRP is particularly interesting for small sample quantities. Nevertheless, basic laboratory measurements are helpful for appropriate XRCT interpretation, but they are not sufficient. Recent studies have already shown that by using additional imaging techniques (e.g., transmitted light microscope or Scanning Electron Microscope, SEM), features unrecognized by the XRCT can be visualized and implemented into the digital rock model (e.g., Saxena et al., 2017; Karimpouli et al., 2019). However, an additional source of information should always be the rock’s provenance. Especially in geological formations, diagenesis as well as the current geological setting is of crucial importance and can lead to internal changes in the rock at all scales. This study, therefore, focuses specifically on geologic features of the Ruhr sandstone formed during the diagenesis and the possibility of incorporating corresponding observations from thin sections into the segmentation process. In the context of the sandstone’s microstructure, this study takes a special role compared to similar studies of the Berea sandstone or the Fontainebleau sandstone (e.g., Bourbie and Zinszner, 1985; Churcher et al., 1991; Øren and Bakke, 2003), since eight individual phases were assigned to the digital twin of the Ruhr sandstone, showing indications of pressure dependencies, microporosities, and phase transformations. However, the workflow presented in this study implies more than just the assignment of gray-scale intensities within the XRCT volume. Rather, it is a process that begins before the actual segmentation and ends with assigning physical mineral properties to the corresponding segmented phases, which properties may have to be adjusted due to the prevailing microstructure. The incorporation of geologically based information for geophysical interpretations is already well established in areas of image processing, such as seismic reflection image interpretation, large-scale velocity modeling, or time reverse imaging interpretations (e.g., Ritzmann et al., 2007; Finger and Saenger, 2020). In DRP, a comparable geological interpretation of gray-scale images is not well established, yet. Despite this, the combination of all information sources is indispensable to perform an appropriate rock characterization-especially when it comes to the interpretation of reduced image information such as the gray-scale images of a XRCT volume. To obtain meaningful results, a Representative Elementary Volume (REV) must be used for the respective numerical studies (Bear and Braester, 1972; Ostoja-Starzewski, 1999). A studied rock sample may show different grain sizes (from
Deriving permeability, thermal, or effective elastic rock properties from a digital twin require a five-step workflow: 1) Preparation of an XRCT volume, 2) tomographic reconstruction, 3) assessment and handling of the X-Ray artifacts 4) segmentation of pore and grain phases, respectively, and 5) solving equations due to the demanded properties. However, these strictly separated processes are increasingly becoming blurred by cross-process procedures, such as the process of reconstruction and segmentation (e.g., Yoon et al., 2010; Storath et al., 2015). This study will demonstrate that the derivation of a digital Ruhr sandstone twin cannot be reduced to just one of these five steps, but that the presented workflow is a cross-disciplinary method to produce reasonable numerical results for the complex microstructure of the Ruhr sandstone. Finally, the geological optimized digital twin can assist in minimizing the uncertainty of predicted rock properties at the mesoscopic and macroscopic scale in a non-destructive manner.
In the following, the geological formation of the Ruhr sandstone is presented first. Then, the Ruhr sandstone’s microfabrics and basic laboratory methods are described. Finally, after presenting the laboratory and numerical results, we discuss the workflow as a tool for deriving the digital twin of the Ruhr sandstone.
The studied Ruhr sandstone from the Oberste quarry in Dortmund, Germany, is assigned to Namur B (Kaisberg) and Wesphalian A formation of the Upper Carboniferous. It is part of the Upper Carboniferous Ruhr cyclothem, which consists of clay-, silt-, mud-, sandstones and interbedded coal seams. These sedimentary deposits were chemically and mechanically compacted, folded, and faulted during the Hercynian orogeny. Therefore, paleo high burial depths of up to 6,000 m can be assigned to the Ruhr sandstone, which is located in a complex geologic setting in the Rhine-Ruhr metropolitan area (Drozdzewski, 1993; Karg et al., 2005).
The preparation of the studied thin sections was provided by the preparation facility of the Institute of Geology, Mineralogy, and Geophysics, at the Ruhr-Universität Bochum. Due to temporal tool limitations the thickness of the thin sections is 38 µm. This results in abnormal interference colors for the studied minerals (Figure 1A). The thin sections were digitized using the Keyence digital microscope, VHX-2000D, combined with a VH-Z100UR lens. The SEM images are open access and were acquired by the Ruhr-Universität Bochum using the high-resolution thermal-assisted field emission SEM Gemini2 Merlin HR-FESEM from ZEISS (Balcewicz et al., 2021c).
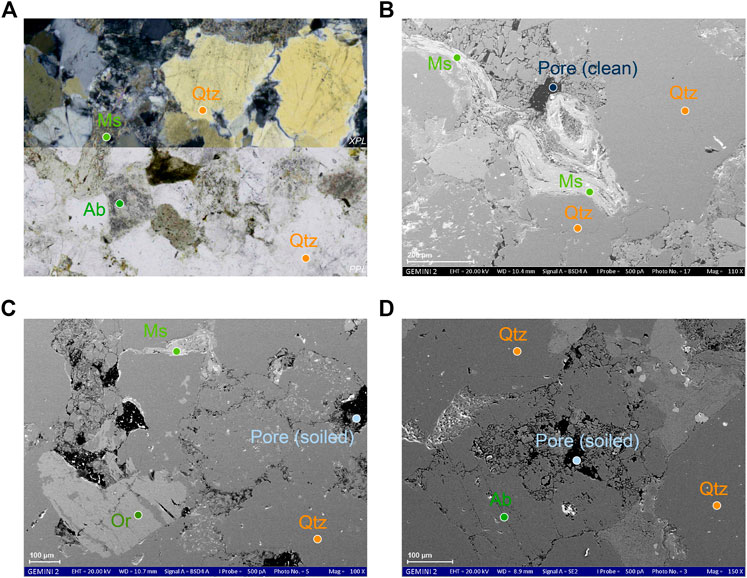
FIGURE 1. (A) Thin section of Ruhr sandstone shown in the upper half in crossed polars (XPL) and in the lower half in plane light (PPL). SEM images of Ruhr sandstone showing (B) broken quartz grains, (C) soiled pore space, and resulting (D) microporosities due to the sericitization process in feldspars. The abbreviations of the rock-forming minerals like Qtz (quartz), Ms (muskovite), Ab (albite), and Or (orthoclase) are used according to Kretz (1983).
Typically, Ruhr sandstone consists mainly of quartz ca.
Quartz grains indicate both types of grain boundaries, high angle and low angle grain boundaries. Some grains show undulous extinction, other low angle boundaries have already transformed into quartz subgrains (Figure 1A). All intermediate steps of the transformation can be observed in the studied specimens. In addition, trans- and intragranular fluid inclusion trails can be observed in quartz (Figure 1A). Some high angle grain boundaries show sutured or concavo-convex grain boundaries. Further SEM analysis shows partially broken quartz grains in size between 10 and 100 µm (Figure 1B). The sericitic phase was pushed close to the quartz phase boundaries during diagenesis in the course of coalification, folding, overburdening, and alteration, indicating low porosity due to its cementing effect (e.g., Kneuper, 1957). In addition, the SEM images showed two types of pore spaces. On the one hand, free pore spaces corresponding to open cavities in the sandstone were found. On the other hand, pore spaces occupied by rock fragments such as debris or Quartzites could be identified (Figures 1B,C). The source of these fragments is mainly the host material. In the following, the pore spaces are referred to as clean pore (open cavities) and soiled pore (occupied by rock fragments). It is important to note that ankerite and bicarbonate solutions from mudstone deposits migrated into the Ruhr sandstone. Paleoenvironmental influences and precipitation of ankerite favored sericitization of the feldspars. This cementation by silica occurred at all depths and resulted in a quartzitic grain-to-grain structure observed in the microstructure analysis, which was found to be clearly temperature and depth dependent (e.g., Scherp, 1963; Hesemann, 2013).
Cored samples were drilled from a Ruhr sandstone cube with an edge length of 0.15 m. At the time of drilling, the orientation of the cube specimen in the field was not known. Nevertheless, macroscopic anisotropy was suspected, so the cube was cored in three direction x, y, and z. A total of 24 samples with a diameter of 20 mm and a mean length of 80 mm were extracted by diamond core drilling. Additionally, a cylindrical core sample with a diameter of 5 mm and a length of about 10 mm was extracted from x direction of the initial Ruhr sandstone cube for a high-resolution XRCT image. All samples were sawed perpendicular to the sample axis and their faces were ground square to the maximum possible length. All steps of the preparation were performed with water as the cooling medium. Basic petrophysical properties were determined on identically prepared samples at ambient conditions.
Bulk density
The ultrasonic P-and S-wave velocities,
Thermal conductivity
The scan of the sample was performed in a self-built, modular µXRCT system employing an open micro-focus tube FineTec FORE 180.01C TT with a tungsten transmission target from Finetec Technologies GmbH, Germany in combination with a Shad-o-Box 6K HS detector with a CsI scintillator option from Teledyne DALSA Inc., Waterloo, Ontario, Canada. Latter provides a resolution of 2,940
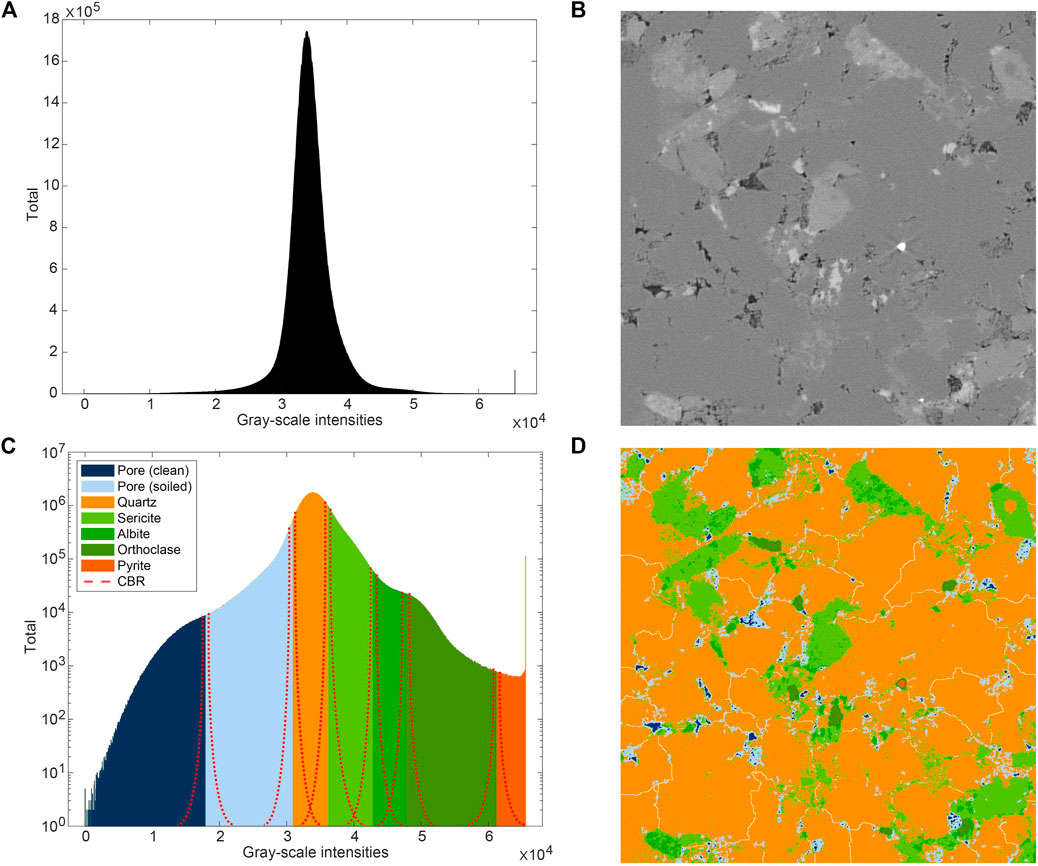
FIGURE 2. (A) Gray-scale intensities after a subsequent
The voxel size
Based on the microfabrics analysis, eight phases were segmented in the respective 8003 and 4003 voxel subvolumes: 1) clean pore, 2) soiled pore, 3) quartz, 4) sericitic phase, 5) albite, 6) orthoclase, 7) pyrite, and 8) quartz high angle phase boundaries. All segmentation was done in Avizo (2019) with basic installed modules. Both segmented subvolumes are open access (Balcewicz et al., 2021b). All applied segmentation processes are based on simplified gray-scale thresholding methods which are probably the simplest way to binarize an image. Nevertheless, some adjustments were made to avoid known problems such as overlapping phase boundaries (e.g., Sheppard et al., 2004). The applied segmentation can thus basically be assigned to the supervised multistage approaches (e.g., Sezgin and Taşaltın, 2000; Wu and Amin, 2003). Starting with a global threshold value that roughly divides the Ruhr sandstone into the individual phases, followed by a local threshold to incorporate additional information such as geological input parameters into the segmentation. In the course of adaptive methods, morphological post-processing operators such as “remove small holes” or logical difference operators were used (Table 3).
After the initial gray-scale thresholding, a geologic review was performed before further steps could be applied. During the geological review, the segmented image was compared and evaluated with thin section images, SEM images, and porosity measurements. The geological verification may result in some modifications to the segmented image, such as fitting the pore space or elimination of incorrectly assigned phases due to X-ray artifacts. The geological verification was based on qualitative and quantitative evaluation criteria such as adjacent mineral phases or calculation of pore space (Table 1; c.f. Table 3). This process of adjusting the initial segmentation results was repeated until the geologic input parameters, such as phase or porosity fractions, approximately matched the binarized phases.
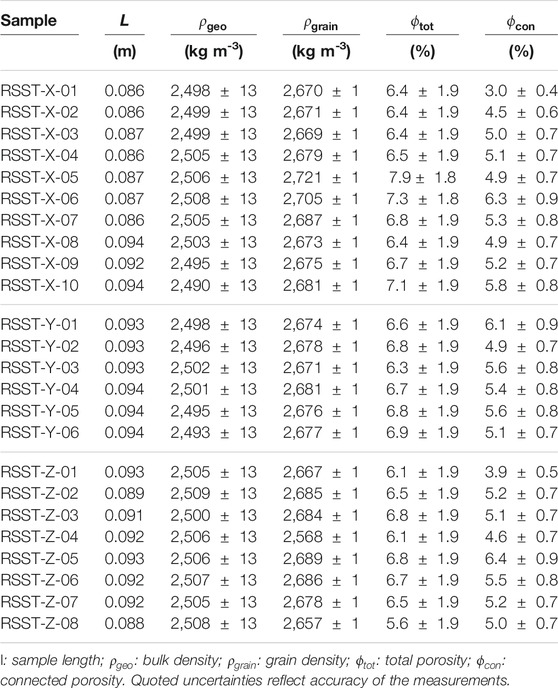
TABLE 1. Matrix properties determined by laboratory measurements on Ruhr sandstone samples from the Oberste quarry in Dortmund. All measurements were conducted at ambient conditions. The abbreviations RSST and e.g., X indicate the rock sample Ruhr sandstone and the drilled direction from the parent cube, respectively.
After all individually segmented phases passed the geologic verification, a location-dependent model of the digital Ruhr sandstone twin was generated. This includes the merging of seven individually segmented phases into a single binary object. Afterwards, a watershed algorithm was applied to the segmented volume according to Beucher and Meyer (1992) to automatically assign unassigned voxels to the appropriate phases. The watershed algorithm is based on the idea of a gray-scale image interpreted as a topographic relief, provided that the pixel values are considered as altitudes. Based on this idea, the watershed algorithm calculates the catchment basin located between two maxima. These catchment basins define the image partitions. This results into a simplified digital twin of the Ruhrsandstone.
In a final step, the quartz grain boundaries were added to the Ruhr sandstone model. For this purpose, the quartz phase was isolated from the rest of the location-dependent digital twin and processed individually. The “separate objects” module was used to implement grain boundaries. This module is a high-level combination of watershed, distance transform, and numerical reconstruction algorithms which computes the watershed lines of a binary image. The selected properties are 3D interpretation, voxels with a least one common vertex are considered connected, marker extent is set to seven, output type is set to line, and a repeatable algorithm method for a conservative chosen method. Followed by an erosion module to set the quartz boundaries to a maximum size of one voxel. Finally, all segmented phases were merged resulting into the digital twin of the Ruhr sandstone (Figure 2D).
Smoothed Particle Hydrodynamics (SPH) is a fully-Lagrangian mesh-free collocation method, which has proven feasible for the calculation of flows through porous materials. In SPH the continuous weakly compressible Navier–Stokes equations are transformed in discrete summation of short-range interaction forces.
For the calculation of the permeabilities the
In order to determine the effective thermal conductivity, the steady-state heat conduction equation is solved using the finite volume method (Siegert et al., 2021). To limit the numerical error, the interfacial conductivity is modelled with two different averaging approaches, namely the harmonic mean (HM) and the arithmetic mean (AM). Each phase of the numerical model is assigned a fixed thermal conductivity to determine the effective thermal conductivity of the entire sample, these are:
Effective elastic P- and S-wave velocity were derived by using the rotated staggered finite difference grid technique (Saenger and Bohlen, 2004). This numerical scheme allows modeling of seismic waves in complex viscoelastic and anisotropic media with strong contrast interfaces of arbitrary shape. All calculations were performed with second-order spatial finite-difference operators and with a second-order time update. The method was successfully compared with other approaches (see in Andrä et al., 2013b; Saxena et al., 2019). The segmented phases (A) clean pore, (B) soiled pore, (C) quartz, (D) sercitic phase, (E) albite, (F) orthoclase, and (G) pyrite were assigned with the corresponding elastic moduli c11, c44, and
Twenty-four samples were obtained from one Ruhr sandstone cube with an edge length of 0.15 m. Samples were drilled parallel to the three directions x, y, and z. All ten samples drilled in the x direction showed macroscopic indications of weathering, which decreased gradually from top to bottom. Except for this, no large fractures were observed in the Ruhr sandstone. The mean grain densities of the samples retrieved from x, y, and z direction are 2,676
Mean total and connected porosity results show slightly higher total and connected porosities for samples drilled in x direction. The derived mean total porosities are 6.58
Ultrasound P- and S-wave velocities of dry Ruhr sandstone range between 4,667 and 2,303 ms-1, respectively (Table 2). P-wave velocities measured in x direction appear to be up to 300 ms-1 lower than corresponding measurements in y and z direction. P-wave velocities measured in y direction show the highest values of about 4,667 ms-1. Equivalent measurements in z direction show a small variation from P-wave velocities determined in y direction. The mean P-wave velocities for x, y, and z directions are 4,363, 4,644, and 4,542 ms-1, respectively. Similar to the P-wave velocities, determined S-wave velocities in x direction appeared to be the lowest among all measurements. Mean S-wave velocities for x, y, and z direction are 2,368, 2,507, and 2,558 ms-1, respectively.
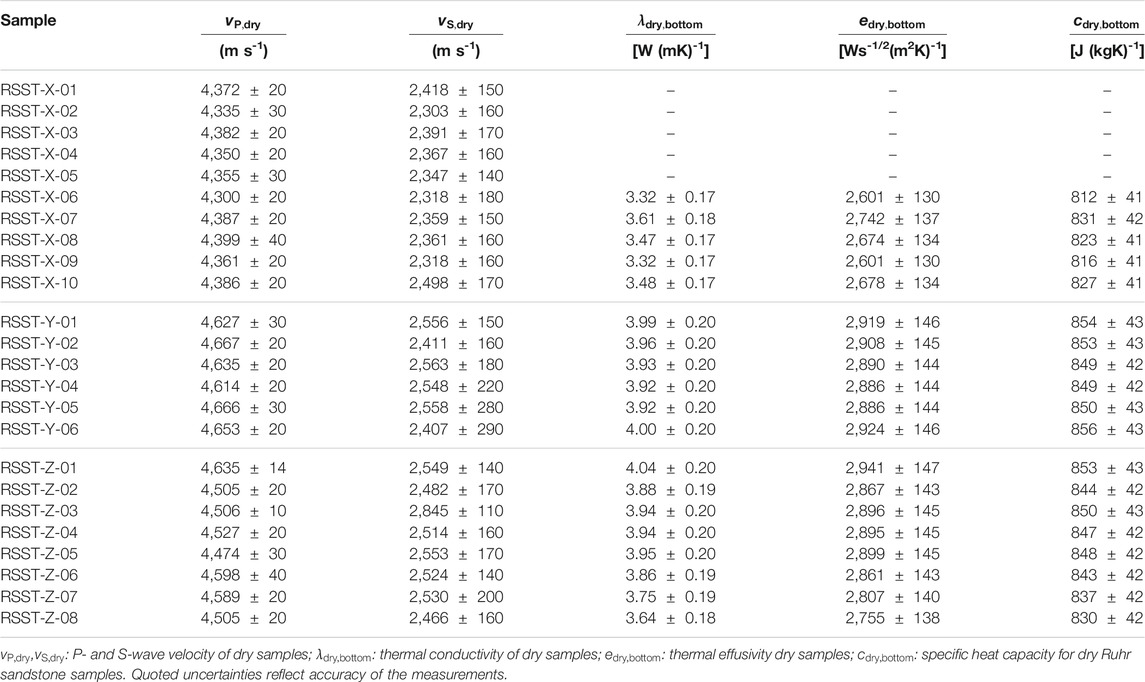
TABLE 2. Ultrasound velocities, thermal conductivity, thermal effusivity, and specific heat capacity derived by laboratory measurements for Ruhr sandstone from Oberste quarry in Dortmund. All measurements were conducted at ambient conditions. The abbreviations RSST and e.g., X indicate the rock sample Ruhr sandstone and the drilled direction from the parent cube, respectively.
Thermal conductivity results show similar values for samples oriented in y and z direction. The derived maximum and minimum thermal conductivity for samples oriented in y and z direction are 3.64 and 4.03 W (mK)-1, respectively. Mean thermal conductivity results for samples oriented in y or z direction are 3.96 and 3.87 W (mK)-1 (Table 2). Compared to this, samples oriented in x direction show a lower thermal conductivity on average. Here, the mean thermal conductivity is 3.44 W (mK)-1. The mean measured thermal effusivity for samples in x direction is 2,659 Ws-1/2(m2K)-1 with a minimum and maximum thermal effusivity of 2,601 and 2,678 Ws-1/2(m2K)-1, respectively. Samples oriented in y and z direction show a mean thermal effusivity of 2,902 and 2,865 Ws-1/2(m2K)-1, respectively. The maximum thermal effusivity was measured for sample RSST-Z-01 with a result of 2,941 Ws-1/2(m2K)-1. Average derived thermal heat capacities were measured for the same amount of samples as thermal conductivity and thermal effusivity. The mean thermal heat capacities for samples taken from x, y, and z direction are 822, 852, and 844 J (kg K)-1, respectively (Table 2).
The presented segmentation resulted in the corresponding fractions for both 8003 voxel subvolume phases (A
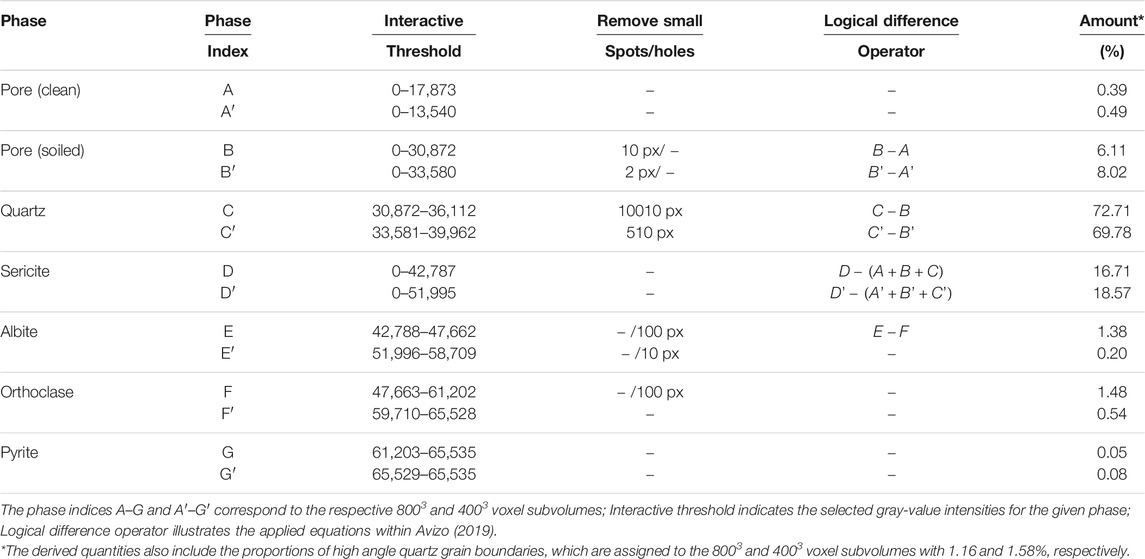
TABLE 3. Phase segmentation matrix with applied settings and derived phase quantities for the subvolumes of Ruhr sandstone 8003 and 4003 voxel.
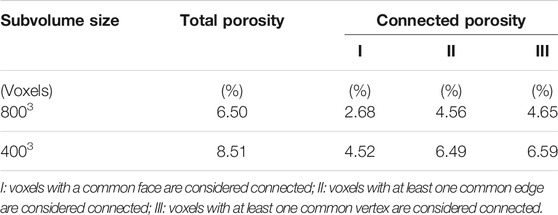
TABLE 4. Derived porosity measurements considering three cases of segmented pore voxels obtained for the 8003 and 4003 voxel subvolume, respectively.
Numerical permeability was calculated using the SPH method for the
The entries that do not lie on the main diagonal can be computed using the entries in the velocity vector perpendicular to the direction of the driving force. In this case, however, these are in the small single-digit per mille range relative to the main diagonal. Thus, a consideration of
The segmented 8003 and 4003 voxel subvolumes were further subdivided into: 1) subvolumewatershed, corresponding to the segmented digital twin with high angle quartz grain boundaries and 2) subvolumesolid, without watershed segmented quartz grain boundaries. This results in a total of 24 simulations for the thermal conductivity. Results based on the AM-approach for the 8003watershed voxel subvolume in x, y, and z direction are 4.049, 4.121, and 4.123 W (mK)-1, respectively. Corresponding results for 8003solid show 4.139, 4.246, and 4.247 W (mK)-1 for x, y, and z directions, respectively. Lower results are derived for the simulations based on the HM-approach. Here, the results of the 8003watershed voxel subvolume are 3.721, 3.696, and 3.706 W (mK)-1 for the x, y, and z directions. The corresponding results for the 8003solid voxel subvolume show higher values than for 8003watershed and read as 3.922, 4.068, and 4.068 W (mK)-1 for x, y, and z directions, respectively.
Derived thermal conductivity results for the corresponding 4003watershed and 4003solid show comparable tendencies for the individual measurements. Simulations based on the AM-approach vary in the range of 3.902 and 4.115 W (mK)-1 for 4003watershed and 4003solid. Results of the HM-approach vary in the range of 3.512 and 3.880 for the corresponding 4003watershed and 4003solid subsamples. This results in total lower values for 4003 voxel subvolumes than for 8003 voxel subvolumes and generally lower values for segmented digital twins with high angle quartz grain boundaries than for those without (cf. Table 5 and Figure 3).
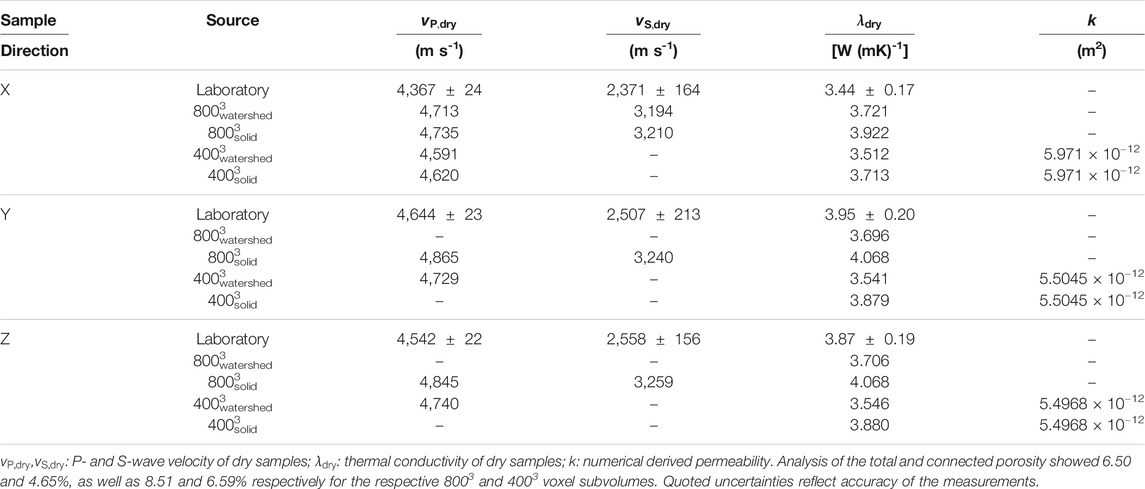
TABLE 5. Correlation between laboratory and numerical derived results.
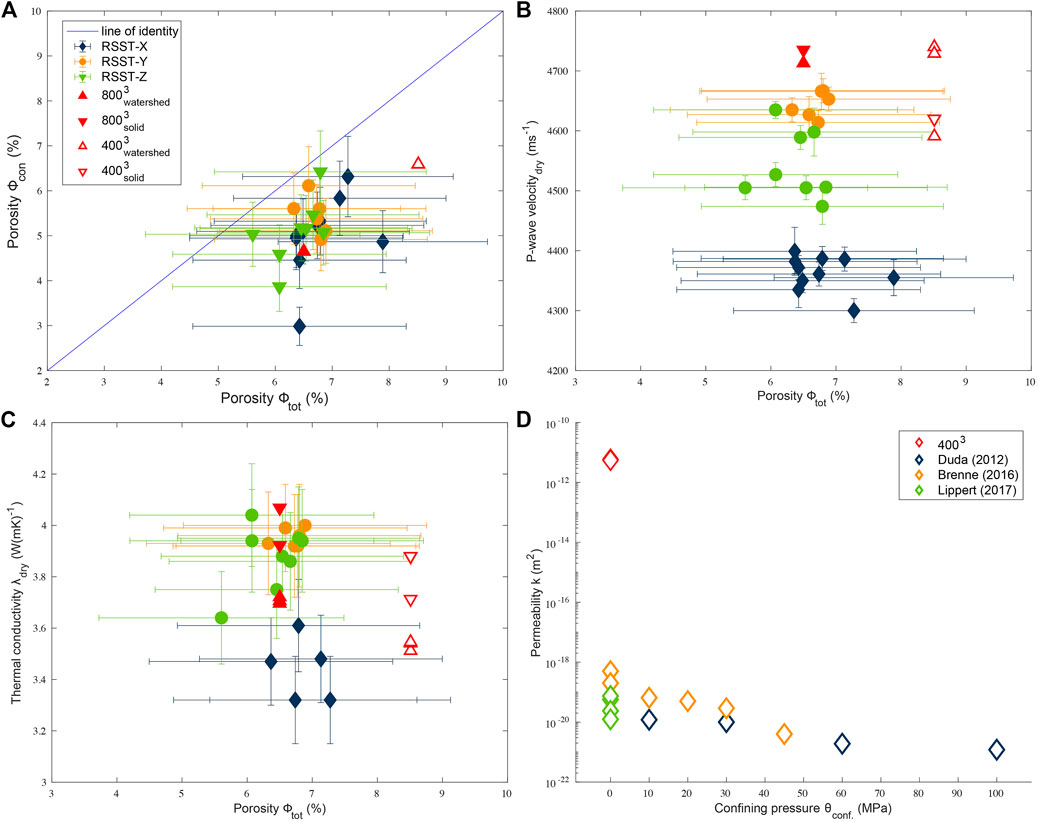
FIGURE 3. Correlation between (A) connected and total porosity, (B) P-wave velocity and total porosity, (C) thermal conductivity and total porosity, and between (D) permeability and confining pressure [see permeability measurements in Duda (2012), Brenne (2016), Lippert (2017)]. Filling and coloring of markers indicate sample and sample direction, respectively. Measurement uncertainties are indicated by error bars. Where error bars do not exceed marker size, uncertainties appear to be small. The blue line in panel (A) indicates identity, i.e., connected porosity corresponds exactly to total porosity. Filled and unfilled red triangles indicate different numerical approaches for 8003 and 4003 voxel subvolumes, respectively. Measurements in panel (A–C) were conducted at ambient conditions. Laboratory measurements in panel (D) have not been determined in the scope of this study and can be looked up for detailed information in Duda (2012), Brenne (2016), Lippert (2017). The abbreviations RSST and e.g., X indicate the rock sample Ruhr sandstone and the drilled direction from the parent cube, respectively.
Effective P-and S-wave velocities were modelled for 8003 and 4003 voxel subvolumes of the Ruhr sandstone. Similar to thermal conductivity models, the segmented subvolumes were subdivided into subvolumewatershed and subvolumesolid. Derived P- and S-wave velocities for the 8003solid voxel subvolume were modelled without the segmented high angle quartz grain boundaries and result in 4,735, 4,845, and 4,865 ms-1 for x, y, z directions, respectively. Determined S-wave velocities read as 3,210, 3,259, and 3,240 ms-1 for the corresponding subvolumesolid in x, y, and z directions, respectively. Modeled P- and S-wave velocity in x direction with segmented quartz grain boundaries 8003watershed result in 4,713 and 3,194 ms-1, respectively.
Computed P-wave velocity results for 4003watershed show 4,591, 4,740, and 4,729 ms-1 for the three directions. The 4003solid P-wave velocity in x direction is 4,620 ms-1. Additionally, the P-wave velocity was determined for the 4003 voxel subvolume with assigned quartz grain boundaries of either 10% of quartz moduli or equal to pore moduli. Corresponding results are 4,540 and 4,500 ms-1 for 10% of quartz moduli and equal to pore moduli, respectively.
To develop a digital Ruhr sandstone twin a three-step interdisciplinary geological driven workflow is proposed, starting with the 1) pre-segmentation process, followed by the 2) assignment of gray-scale intensities to the resolved phases, and finally a 3) numerical characterization approach of the digital Ruhr sandstone twin in terms of permeability, thermal conductivity, and effective elastic wave propagation (Figure 4). In the pre-segmentation process, geological properties serve as input, such as Ruhr sandstone’s diagenesis, or mineralogical composition. Additionally, the raw XRCT data set must be technically evaluated based on the gray-scale histogram, existing X-ray artifacts, and the agreement with a REV. The gray-scale assignment to the corresponding mineralogical phases presented in this study is based on the simple gray-scale thresholding method, which allows a maximum of individual manipulation to ensure a first approximation of a meaningful segmented Ruhr sandstone model. The manipulation of the assigned phases is contrasted with four geological verification steps, which are intended to ensure a meaningful result during the segmentation process (Figure 4). The first geological verification is the number of expected phases based on the mineralogical composition and the accepted, high-quality XRCT image. The second geological review is during the individual phase segmentation based on visual evaluation of wrongly assigned voxels and the inspection of segmented phase fractions. The latter criterion results from the geological input properties. After individual phase segmentation, all phases are merged into a location-dependent model of the digital twin, which is supported technically by watershed algorithms and assisted by the third geological verification based on the geological property input. The last geological driven verification is the additional implementation of features, which cannot be resolved by the XRCT but might show a significant impact on further numerical characterizations. For Ruhr sandstone, this applies to high angle quartz grain boundaries.
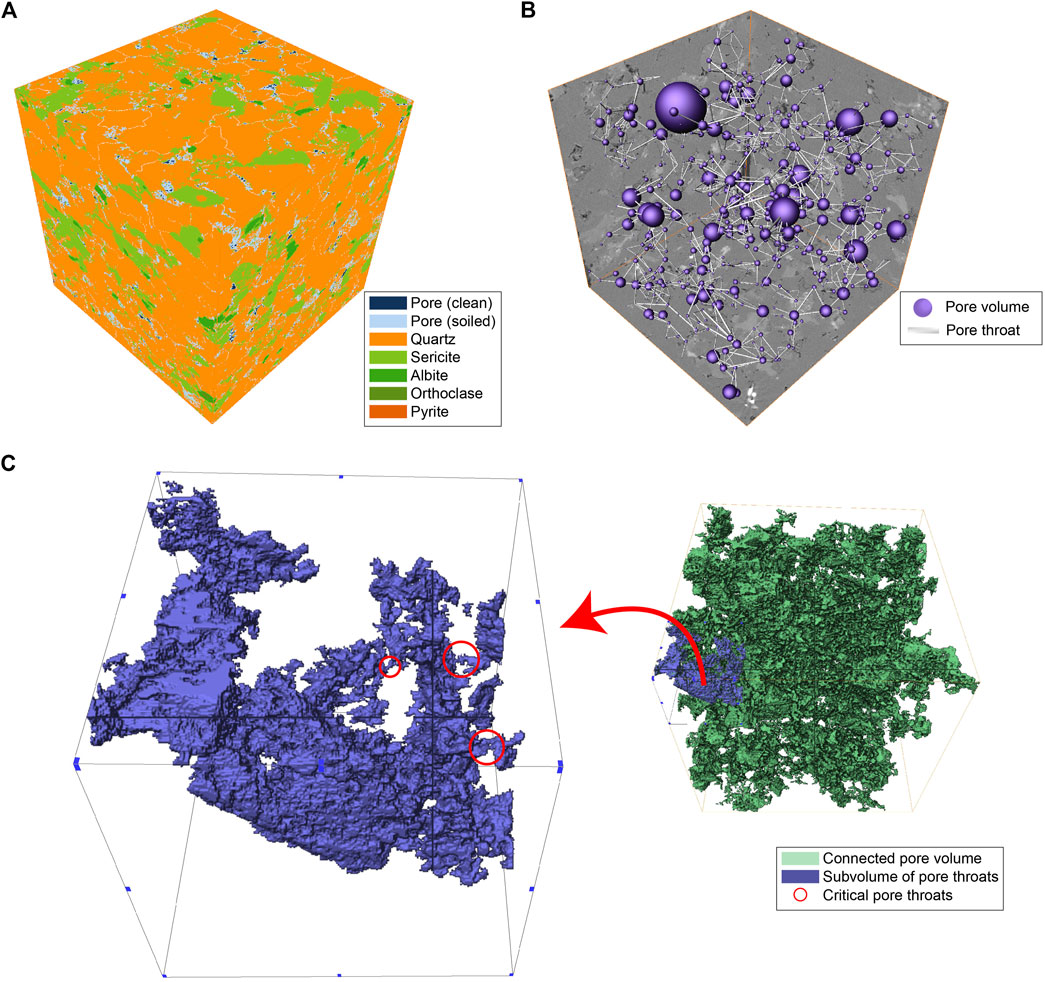
FIGURE 4. (A) Segmented 8003 voxel subvolume with additional implemented high angle quartz grain boundaries in a white color. (B) Corresponding connected pore network. The ball sizes are indicating the pore size volumes. Visualized pore throats show the connectivity between two pore volumes. (C) Visualized connected porosity of panel (B) indicating critical pore throats in a subvolume. All figures were created with Avizo (2019).
The reconstructed gray-scale intensities result from the materials’ mass attenuation coefficients which, in case of this study, can be defined as the phase attenuation coefficient
The applied binning procedure increased the contrast of the 4003 voxel subvolume compared to the 8003 voxel subvolume at the sacrifice of imaged small particles in the XRCT volume. This results in a higher total and connected porosity for the 4003 than for the 8003 voxel subvolume (cf. Table 4 and Figure 3A). Results of the modeled thermal conductivity as well as the effective elastic wave propagation show that the chosen coarsening of the data set is not in disadvantage for the mentioned physical investigations. This suggests that both the
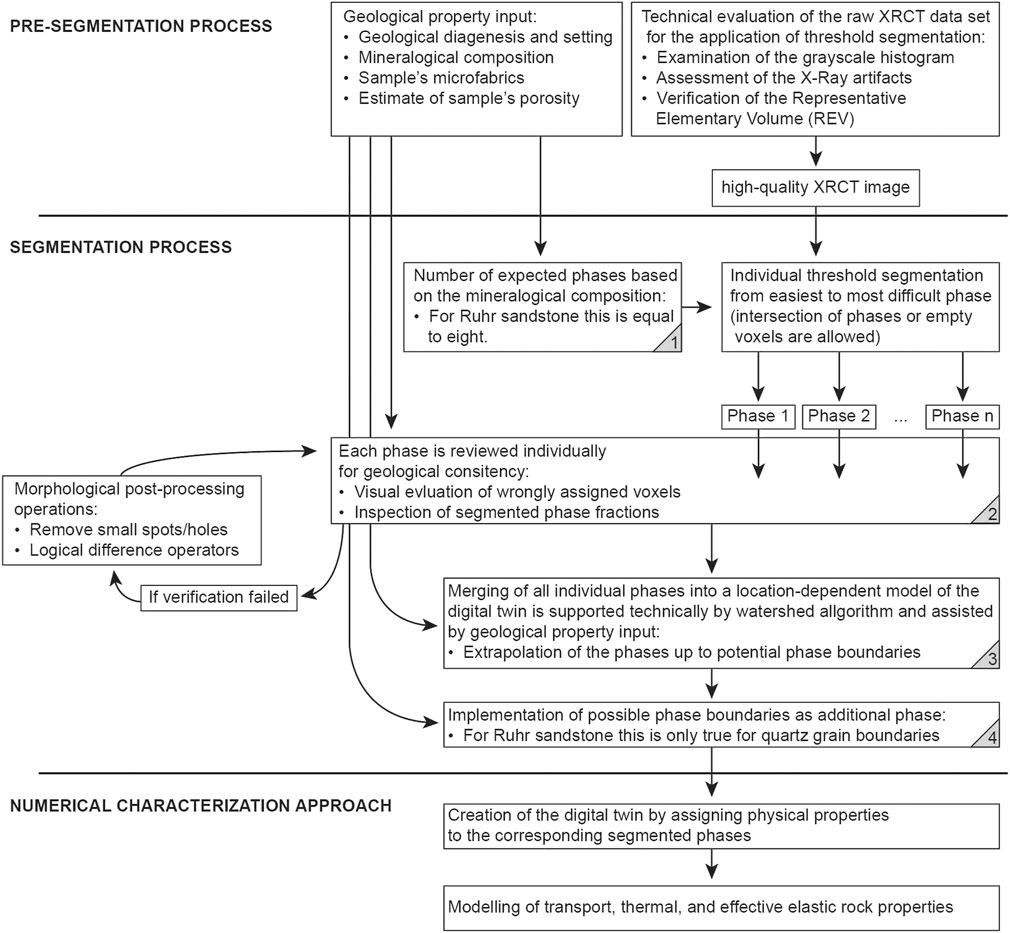
FIGURE 5. Schematic representation of the geologically driven workflow. It should be noted that geological input parameters such as geological diagenesis, mineral composition, existing microstructure, or estimated sample porosity are repeatedly consulted in the segmentation process in order to obtain meaningful results. The so-called geological verification thus takes place a total of four times during the threshold segmentation.
Primarily, the applied segmentation workflow is based on the observed mineral structure in the examined thin sections. Minor differences may occur within the studied microstructures of the Ruhr sandstone due to local geologically influenced processes (cf. Kneuper, 1957). Subsequently, the reconstructed XRCT volume must be compared to the given microfabrics and the observations of the available reconstructed gray-scale histogram. The gray-scale histogram already gives a good indication of which phases could be resolved by the XRCT (see Figure 2A).
The presented workflow is based on a repeated application of gray-scale thresholding. In this approach, the minima and maxima of the gray-scale intensities of a phase are segmented, resulting in strict boundaries between the two phases. However, studies have shown that, e.g., in terms of noise in the gray-scale histogram due to multiple phase attenuation coefficients, this is not necessarily correct (e.g., Ketcham and Carlson, 2001; Sheppard et al., 2004; Jones et al., 2007; Wildenschild and Sheppard, 2013). Therefore, critical boundary regions arise during the segmentation of the individual phases (Figure 2C). Critical boundary regions close to two peaks can be approximated by a watershed algorithm. However, the main idea of the presented segmentation workflow is to reduce critical boundary regions between two peaks to minimize possible watershed errors, i.e., exact numerical assignment of gray-scale intensities, which, however, is not geologically meaningful. Furthermore, the presented segmentation method allows control over the segmentation process, which in our opinion is not necessarily the case with e.g., watershed-based segmentations. Jones et al. (2007) presented a method for minimizing critical boundary regions by the use of intensity–gradient histograms. The extent to which the described segmentation also provides meaningful results for the example of the Ruhr sandstone must be further analyzed. First segmentation attempts using the intensity-gradient-histogram did not yield satisfactory results. The reason for this could be that the described phase contrasts of the Ruhr sandstone’s minerals, i.e., the mean of total observed phase attenuation coefficients, is much lower than the phase contrasts between the scaffold of a bone and air in the gray-scale histograms of the examined biomaterials. Based on the presented segmentation idea, only those phases can be assigned which phase attenuation coefficients is sufficient to be detected by the given XRCT. Furthermore, these distinguishable phases must be large enough to exceed the occurring signal-to-noise ratio (SNR). The presented segmentation workflow has shown that phases that have very similar gray-scale intensities (e.g., both feldspar phases) can be separated clearly from each other, by manipulating false-assigned gray-scale intensities. The presented manipulation does not only imply the separation of phase contrasts at possible grain boundaries, but also assigns gray-scale intensities within grain boundaries to the correct phases - without a necessarily application of watershed algorithms. Due to the subsequent correction of mismatched gray-scale intensities, we expect a clear quality improvement of the segmented images compared to the simple threshold based phase separation e.g., multi-thresholding segmentation. Nevertheless, the segmentation workflow does not work entirely without watershed algorithms. Primarily, it is used to assign individual unassigned voxels to the appropriate ambient phase in the final process of segmentation. This step is mandatory to ensure that the resulting segmentation model does not contain any unassigned voxels that may have been created during processing. Although the critical boundary regions were previously reduced to a minimum, we cannot exclude the possibility of voxels being incorrectly assigned at this point due to the automation of the watershed algorithm. However, with regard to the corresponding model sizes of 4003 and 8003 voxel subvolumes, these incorrectly assigned voxels are assumed to be neglected.
A much more critical process of segmentation occurs during the implementation of grain boundaries (i.e., high angle quartz grain boundaries). Madonna et al. (2012) already presented a possible implementation of unresolved features within a XRCT image, almost ten years ago. We have adopted the described process by Madonna et al. (2012), which is based on watershed algorithms and assumed pressure-dependent quartz contact zones (Saenger et al., 2016a). However, numerical P- and S-wave velocity modelling results indicated further pressure-dependent features. These numerical results are in a good agreement with the observed quartz microfabrics (e.g., low angle quartz grain boundaries). Based on the geological setting, we assume at least a third pressure-dependent phase - namely the sericitic phase.
The used threshold segmentation can be applied to a single XRCT dataset with fairly inexpensive effort. This differs from the approach used for advanced machine learning algorithms, which require a critical amount of training data to produce satisfactory initial results. Consequently, the presented segmentation workflow should present a possible approach how future neural network based segmentation methods can be trained. The obvious advantages of unsupervised segmentation methods are the expected consistency, repeatability, and comparability of the segmented results (e.g., Chauhan et al., 2016; Alqahtani et al., 2021). These arguments gain importance especially when a segmented model of the digital twin is already accepted. However, these arguments can only apply to a limited extent when it comes to the first approximations to create a new verified 3D binary. This is where geological verification comes in for DRP. The steps presented in this study are intended to illustrate that operator bias can be well estimated by microfabric analyses (phase fractions or phase transformations) or by simple laboratory experiments (e.g., determination of porosity) and does not have to be characterized as arbitrariness of the operator. Finally, with respect to the results from the microfabric analysis or laboratory measurements, it can be considered that the raw XRCT data set has been reasonably segmented. In the future, these initial observations need to be applied to a larger data set and verified with appropriate methods. Here, the application of neural network based segmentation methods can make a major contribution to future Ruhr sandstone segmentations.
Diagenesis reconstructions have shown that the Ruhr sandstone was covered at depths of up to 6,000 m (Karg et al., 2005). Assuming a normal gradient, this results in a pressure of about 150 MPa, which was applied to the Ruhr sandstone. Karg et al. (2005) also reconstructed possible temperatures of above 120°C that must have acted on the Ruhr sandstone. These P-T conditions fit both the presented microfabrics and the generally accepted highly complex geologic setting (e.g., Balcewicz et al., 2021a, and references therein). Saenger et al. (2016a) have already shown that pressure-dependent indicators of a Berea sandstone sample at 20 MPa confining pressure cannot be resolved in the XRCT. This resulted in pressure-dependent grain contact zones. The presented microfrabric analyses also show highly stressed quartz grains. Implemented high angle quartz grain boundaries decrease the results for the effective elastic wave propagation as well as for the numerically derived thermal conductivity approach. These results fit to the insulating character of thin segmented phases assigned with elastic moduli properties of air. To be specific regarding thermal conductivity results, comparing the two averaging methods, it also becomes clear that the HM-approch reflects the insulating character of the contact phase much more strongly than the AM-approach. The reason for this is the low resolution of the contact phase. In such a case, the AM-approach cannot fully capture the isolating effect. However, additional low angle quartz grain boundaries, subgrains, fluid inclusion trails, and sutured grain boundaries could be identified for quartz grains compared to the observations in Saenger et al. (2016a). For this reason, we conclude that it is mandatory to assign reduced elastic properties to the digital rock twin in order to achieve meaningful agreements with laboratory results. This results in reduced elastic properties for the quartz phase by ca. 30% (cf. Bass, 1995; Saenger et al., 2016a). It must be pointed out that the degree of reduction derived in Saenger et al. (2016a) is not necessarily correct for the Ruhr sandstone (Figure 3B). An explicit numerical calibration of the elastic quantities must follow this study of geometrical calibration to answer open questions. The purpose of this study is to demonstrate that the geologically driven workflow potentially opens up the possibilities to answer subsequent questions. A corresponding numerical calibration should therefore also be investigated for all further segmented phases. Due to the geological diagenesis of the Ruhr sandstone and the resulting segmentation possibilities we want to inspire other research groups to focus on the soiled pore phase and the sericitic phase for future studies.
SEM images (Figures 1B–D) have shown that the pore space in the Ruhr sandstone occurs in at least two different types. The process of segmentation can be approximated as a function of the applied time vs. the location-dependent accuracy of the segmented phases. For this reason, only two pore space observations were segmented: 1) clean pore and 2) soiled pore phase. While the explanation of the clean pore space and further handling for numerical purpose is obvious, more extensive aspects have to be considered for the soiled pore space. Particles located in this soiled pore space can have different influence on the rock properties. Mineral fragments from the Ruhr sandstone are likely to be present within the soiled pore space. However, these particles may seal off the connected porosity during permeability measurements, which would effectively result in lower permeabilities being measured in the laboratory. This observation should be taken into account, especially when evaluating numerical permeability results with comparable microfabrics. Besides sealing the connected porosity, the mineral particles can also influence hydrochemical reactions. Tran et al. (2020) studied mine waters in the Rhine-Ruhr metropolitan area and the influence on the local rheological units (e.g., Ruhr sandstone). First results showed that mine waters were weakly acidic to neutral, resulting in significant water-rock interaction correlations. Transport or hydrochemical induced clogging indicate that numerical permeability results tend to be too high compared to laboratory measurements (Figure 3D). In this respect, we recommend explicit investigations of particle transport or mineral scaling in the Ruhr sandstone based on XRCT and other imaging techniques (e.g, Weinhardt et al., 2021). Until then, the segmented soiled pore phase provides an opportunity for other research groups to adapt their numerical approaches to the observed Ruhr sandstone’s microfabric and incorporate possible reduced permeabilities.
Another phase that was segmented due to the workflow, but needs to be studied in more detail as part of a numerical calibration, is the sericitic phase. The segmented sericite phase consists of a mixture of different mineral phases. Basically, this is due to the feasibility of XRCT resolution of microporosities and extremely fine-grained mineral phases (e.g., pore diameter
During preparation, macroscopic indications of weathering were observed assuming macroscopic anistropy. Laboratory results show a weak anistropy for samples drilled in x direction. This is especially true for derived P- and S-wave velocities (cf. Figure 3B and Table 2). Similar observations were made for laboratory derived thermal conductivity results. Samples taken from x direction tend to show lower thermal conductivity results than samples from y and z direction, respectively (Figure 3C). However, this observation cannot be made for the comparison between total and connected porosities (Figure 3A). Advanced numerical approaches to determine permeability, thermal conductivity, and P- and S-wave velocity were applied for a cylindrical core sample parallel to laboratory determined sample results in x direction. Due to the cylindrical shape of the scanned sample, true y and z directions could not be reconstructed for the digital rock twin. The numerical results have shown a fairly good agreement with the results obtained in the laboratory, considering the XRCT resolution as well as the assignment of the elastic moduli to the segmented phases. In addition, weak anisotropies were determined independently from the respective numerical approaches.
The thermal conductivities in y and z direction show almost identical results, while the thermal conductivity in x direction seems to be lower. In the case of implemented high angle quartz grain boundaries, this effect seems to be suppressed for the thermal conductivity results. The numerically derived P- and S-wave velocity results do also show weak but clear anisotropy for x direction. Modeled P- and S-wave velocity show up to 100 ms-1 lower results for x direction of the 8003 voxel subvolume and up to 200 ms-1 lower results for x direction of the 4003 voxel subvolume compared to y and z directions, respectively. These observations are in good agreement with the mean velocity differences determined in the laboratory of approx. 300 ms-1, which are smaller for the x direction than for the y and z directions. Löer et al. (2018) have demonstrated the degree of anisotropy using installed seismic arrays in the Parkfield area. This verified anisotropy, which could be determined from surface wave measurements, is in the range of about 100 ms-1. Thus, because of the explicit alignment of our samples with respect to the assumed anisotropy, we can demonstrate a comparable degree of anisotropy. The influence of an anisotropy of about 300 ms-1 is shown by the interpretation of a velocity model in a geothermal field in Los Humeros (Mexico). The combination of a geological subsurface model and a geophysical velocity model shows a good agreement between both interpretations, which provide either a resolution of tens of meters or hundreds of meters per second, respectively (Löer et al., 2020).
Due to the observed macroscopic anisotropy of the samples, further investigations were considered. Thus, it was initially assumed that the anisotropy occurring in the color of the rock samples was caused by the intrusion of the pyrites. A comparison of the modeled P-wave velocities, in which all phases except the pyrites were assigned to quartz, did not provide clear evidence for this hypothesis. In a second set of tests, all phases were set equal to quartz except for the sericitic phase, which was shown to be the result of alteration of the feldspars. This comparison of the modeled P-wave velocities also did not confirm any anisotropy due to the solid phases. In a final numerical run, all phases were assigned equal to quartz moduli except for the two pore phases, i.e., clean and soiled pore. The result for this analysis reads as 4,484, 4,615, and 4,626 ms-1 for x, y, and z directions, respectively.
The applied SPH based permeability solver confirms the observed anisotropy in the x direction. Nevertheless, the comparison between the numerical and laboratory derived results reveals that not all physical quantities can be derived with the same degree of sophistication using the identical segmented model. In particular, the resolution of micro porosities and the associated pore throats make, for example, the segmented 4003 voxel subvolume an inappropriate choice for such permeability simulations. However, the same segmented data set gives reasonable results for both numerical thermal conductivity and effective elastic wave propagation results. From this, we conclude that valuable numerical thermal conductivity or effective elastic wave propagation results can be expected from segmented volumes after binning processes as described in this study. We consider this observation to be equivalent to the lower resolution in XRCT images. Whereas numerical permeability approaches at this reduced resolution can no longer provide reasonable results. This implies high resolutions in microtomography processing are necessary to visualize critical volume zones in the pore throats for very low porosity rocks like Ruhr sandstone (see supplementary materials).
Thus, we summarize that the main anisotropy is due to the Ruhr sandstone’s pore network (Figure 5). This result indicates that the apparent seismic anisotropy at the field-scale (Löer et al., 2018) can not only stem from fault systems but from the pore network, too. Future studies may analyze the implications regarding fluid flow directions in reservoirs.
Based on the example of the Ruhr sandstone, we presented a simple segmentation approach that takes into account geological properties such as mineralogy, microfabrics, and basic laboratory measurements like total and connected porosity. To create the digital twin of the Ruhr sandstone sample we have prepared a cylindrical core sample with a diameter of 5 mm and a length of about 10 mm to provide an appropriate REV. The created XRCT volume resulted in a 8003 voxel subvolume with a voxel size of 4 µm. Due to the limitation of the numeric simulation schemes a second 4003 voxel subvolume with a voxel size of 8 µm was prepared. The geological driven workflow was applied on both subvolumes, primarily based on gray-scale threshold segmentation. By the additional use of e.g., logical difference operators or watershed segmentation, a digital Ruhr sandstone twin with eight phases could be acquired. The presented segmentation workflow is intended to serve as a first approach to train future neural network-based segmentation approaches with sufficiently accurate segmentation phases.
The laboratory results indicate a transversely isotropic medium whose properties vary only with the x direction studied, but not with the y or z directions studied. After comparing the laboratory measurements with the numerical results, a weak anisotropy was confirmed by the numerical approaches, i.e., modeling permeability, thermal, and effective elastic rock properties. Further investigations suggest that the observed anisotropy is due to the existing pore network in the Ruhr sandstone. Moreover, we present the complex microstructure of the Ruhr sandstone with its altered and clay-rich matrix on the basis of thin section and SEM images. On the one hand, the assigned properties are intended to reflect the investigated rock properties, such as low porosity, and on the other hand, they are intended to provide suggestions for matching the numerical results more closely to the laboratory measurements. We encourage other research groups to take advantage of our segmented datasets and use the elaborated phases to address open questions, such as how to assign elastic moduli for pressure- and temperature-dependent phases or how to simulate the effect of clogging or hydrochemical reactions during flow modeling.
The datasets presented in this study can be found in online repositories. The names of the repository/repositories and accession number(s) can be found in the article/Supplementary Material.
Seven authors have contributed to this paper. MB was the lead author and carried out laboratory measurements, sample characterization, segmentation, and analytical calculations. MS helped with numerically derived thermal conductivity. MG was involved in interpreting numerical derived results. MR provided high-resolution XRCT images. DK was involved in numerical permeability calculations and their interpretations. HS provided helpful background knowledge and laboratory as well as numerical resources. ES was involved in effective elastic wave propagation simulations, provided helpful background knowledge, and was involved in the data interpretation. All authors contributed to writing the manuscript.
MB and ES acknowledge generous funding by the Federal Ministry of Education and Research and geomecon GmbH for the project 3D-RuhrMarie (“FHprofUnt2016”; Project No. 13FH279PX6). MR and HS acknowledge funding from the German Science Foundation (DFG) through Project No. STE 969/13-1. HS thanks the DFG for supporting this work under Grant No. SFB 1313 (Project No. 327154368). The authors declare that this study received funding from geomecon GmbH. The funder was not involved in the study design, collection, analysis, interpretation of data, the writing of this article or the decision to submit it for publication.
The authors declare that this study received funding from geomecon GmbH. The funder was not involved in the study design, collection, analysis, interpretation of data, the writing of this article or the decision to submit it for publication.
We thank all students and researchers involved in the laboratory measurements, in particular Mandy Duda. We especially thank Claudia Finger for fruitful discussions and helpful comments on an earlier draft of the manuscript. Furthermore, we would like to thank the editor Pascal Audet and the two reviewers Steffen Berg and Arne Jacob for their comments and discussions on the manuscript.
The Supplementary Material for this article can be found online at: https://www.frontiersin.org/articles/10.3389/feart.2021.673753/full#supplementary-material
AGFW (2009). Arbeitsgemeinschaft für Wärme und Heizkraftwirtschaft: Technisches Handbuch Fernwärme Technik und Normung (Frankfurt am Main: AGFW-Projektges. für Rationalisierung, Information und Standardisierung).
Ahrens, B., Duda, M., and Renner, J. (2018). Relations between Hydraulic Properties and Ultrasonic Velocities during Brittle Failure of a Low-Porosity sandstone in Laboratory Experiments. Geophys. J. Int. 212, 627–645. doi:10.1093/gji/ggx419
Aljamaan, H., Ross, C. M., and Kovscek, A. R. (2017). “Multiscale Imaging of Gas Adsorption in Shales,” in SPE Unconventional Resources Conference. Society of Petroleum Engineers, 1–26. doi:10.2118/185054-MS
Alqahtani, N. J., Chung, T., Wang, Y. D., Armstrong, R. T., Swietojanski, P., and Mostaghimi, P. (2021). Flow-Based Characterization of Digital Rock Images Using Deep Learning. SPE J. 1–12. doi:10.2118/205376-PA
Avizo (2019). Version 2019.1 (Waltham, Massachusetts: Thermo Fisher Scientific and Zuse Institute Berlin).
Anderson, J. A., Lorenz, C. D., and Travesset, A. (2008). General Purpose Molecular Dynamics Simulations Fully Implemented on Graphics Processing Units. J. Comput. Phys. 227, 5342–5359. doi:10.1016/j.jcp.2008.01.047
Andrä, H., Combaret, N., Dvorkin, J., Glatt, E., Han, J., Kabel, M., et al. (2013a). Digital Rock Physics Benchmarks-Part I: Imaging and Segmentation. Comput. Geosciences 50, 25–32. doi:10.1016/j.cageo.2012.09.005
Andrä, H., Combaret, N., Dvorkin, J., Glatt, E., Han, J., Kabel, M., et al. (2013b). Digital Rock Physics Benchmarks-Part II: Computing Effective Properties. Comput. Geosciences 50, 33–43. doi:10.1016/j.cageo.2012.09.008
Araújo, K. (2014). The Emerging Field of Energy Transitions: Progress, Challenges, and Opportunities. Energ. Res. Soc. Sci. 1, 112–121. doi:10.1016/j.erss.2014.03.002
Balcewicz, M., Ahrens, B., Lippert, K., and Saenger, E. H. (2021a). Characterization of Discontinuities in Potential Reservoir Rocks for Geothermal Applications in the Rhine-Ruhr Metropolitan Area (Germany). Solid Earth 12, 35–58. doi:10.5194/se-12-35-2021
Balcewicz, M., Ruf, M., Steeb, H., and Saenger, E. H. (2021b). Digital Rock Physics: A Geological Driven Workflow for the Segmentation of Anisotropic Ruhr Sandstone: Segmented Subvolumes. [Dataset] DaRUS. doi:10.18419/darus-1435
Balcewicz, M., Ruf, M., Steeb, H., and Saenger, E. H. (2021c). Digital Rock Physics: A Geological Driven Workflow for the Segmentation of Anisotropic Ruhr Sandstone: SEM Images. [Dataset] DaRUS. doi:10.18419/darus-1812
Bass, J. D. (1995). “Elasticity of Minerals, Glasses, and Melts,” in Mineral Physics & Crystallography: A Handbook of Physical Constants, 2 Washington, DC: Wiley Online Library, 45–63. doi:10.1029/RF002p0045
Bear, J., and Braester, C.IAHR (1972). “On the Flow of Two Immscible Fluids in Fractured Porous Media,” in Fundamentals of Transport Phenomena in Porous Media. Of Developments In Soil Science (Elsevier), Vol. 2, 177–202. doi:10.1016/S0166-2481(08)70538-5
Beucher, S., and Meyer, F. (1992). “The Morphological Approach to Segmentation: The Watershed Transformation,” Mathematical Morphology in Image Processing. Editor E. Dougherty (Boca Raton: Taylor & Francis Inc), 1, 433–481.
Blunt, M., and King, P. (1991). Relative Permeabilities from Two- and Three-Dimensional Pore-Scale Network Modelling. Transport Porous Med. 6, 407–433. doi:10.1007/bf00136349
Bourbie, T., and Zinszner, B. (1985). Hydraulic and Acoustic Properties as a Function of Porosity in Fontainebleau Sandstone. J. Geophys. Res. 90, 11524–11532. doi:10.1029/JB090iB13p11524
Brenne, S. (2016). Hydraulic Fracturing and Flow Experiments on Anisotropic and Pre-fractured Rocks. Ph.D. Thesis Bochum: Ruhr Universität Bochum.
Buzug, T. M. (2011). Computed Tomography – from Photon Statistics to Modern Cone-Beam CT. Berlin, Heidelberg: Springer. doi:10.1007/978-3-540-39408-2
Chauhan, S., Rühaak, W., Khan, F., Enzmann, F., Mielke, P., Kersten, M., et al. (2016). Processing of Rock Core Microtomography Images: Using Seven Different Machine Learning Algorithms. Comput. Geosciences 86, 120–128. doi:10.1016/j.cageo.2015.10.013
Churcher, P. L., French, P. R., Shaw, J. C., and Schramm, L. L. (1991). “Rock Properties of Berea Sandstone, Baker Dolomite, and Indiana Limestone,” in SPE International Conference on Oilfield Chemistry. All Days, 431–449. doi:10.2118/21044-MS
Clauser, C., and Huenges, E. (2013). “Thermal Conductivity of Rocks and Minerals,” in AGU Reference Shelf. Washington D.C. American Geophysical Union, 105–126. doi:10.1029/rf003p0105
Drozdzewski, G. (1993). The Ruhr Coal basin (Germany): Structural Evolution of an Autochthonous Foreland basin. Int. J. Coal Geology 23, 231–250. doi:10.1016/0166-5162(93)90050-k
Duda, M. (2012). An Integrated Experimental Study on Elastic and Inelastic Properties of Sandstones and the Role of Transient Pore Pressure. Ph.D. Thesis, Ruhr Universität Bochum.
Duda, M., and Renner, J. (2013). The Weakening Effect of Water on the Brittle Failure Strength of sandstone. Geophys. J. Int. 192, 1091–1108. doi:10.1093/gji/ggs090
Fan, L., Thompson, J. W., and Robinson, J. R. (2010). “Understanding Gas Production Mechanism and Effectiveness of Well Stimulation in the Haynesville Shale through Reservoir Simulation,” in Canadian Unconventional Resources and International Petroleum Conference. Society of Petroleum Engineers, 1–15. doi:10.2118/136696-MS
Feng, X., Zeng, J., Zhan, H., Hu, Q., Ma, Z., and Feng, S. (2020). Resolution Effect on Image-Based Conventional and Tight sandstone Pore Space Reconstructions: Origins and Strategies. J. Hydrol. 586, 124856. doi:10.1016/j.jhydrol.2020.124856
Finger, C., and Saenger, E. H. (2020). Sensitivity Maps for Time-Reverse Imaging: an Accuracy Study for the Los Humeros Geothermal Field (Mexico). Geophys. J. Int. 222, 231–246. doi:10.1093/gji/ggaa160
Fridleifsson, I. B., Bertani, R., Huenges, E., Lund, J. W., Ragnarsson, A., and Rybach, L. (2008). “The Possible Role and Contribution of Geothermal Energy to the Mitigation of Climate Change.,” in IPCC Scoping Meeting on Renewable Energy Sources, Proc. Luebeck, Germany (Citeseer) 20, 59–80. doi:10.500.11850/13474
Garfi, G., John, C. M., Berg, S., and Krevor, S. (2020). The Sensitivity of Estimates of Multiphase Fluid and Solid Properties of Porous Rocks to Image Processing. Transp Porous Med. 131, 985–1005. doi:10.1007/s11242-019-01374-z
Glaser, J., Nguyen, T. D., Anderson, J. A., Lui, P., Spiga, F., Millan, J. A., et al. (2015). Strong Scaling of General-Purpose Molecular Dynamics Simulations on GPUs. Comput. Phys. Commun. 192, 97–107. doi:10.1016/j.cpc.2015.02.028
Goldstein, B., Hiriart, G., Tester, J., Bertani, B., Bromley, R., Gutierrez-Negrin, L., et al. (2011). “Great Expectations for Geothermal Energy to 2100,” in Proceedings 36th Workshop on Geothermal Reservoir Engineering, 1–8.
Guan, K. M., Nazarova, M., Guo, B., Tchelepi, H., Kovscek, A. R., and Creux, P. (2019). Effects of Image Resolution on sandstone Porosity and Permeability as Obtained from X-ray Microscopy. Transp Porous Med. 127, 233–245. doi:10.1007/s11242-018-1189-9
Harvey Blatt, H. (1967). Provenance Determinations and Recycling of Sediments. Sepm Jsr Vol. 37, 1031–1044. doi:10.1306/74D71825-2B21-11D7-8648000102C1865D
Holzer, L., and Cantoni, M. (2012). “Review of FIB-Tomography,” in Nanofabrication Using Focused Ion and Electron Beams: Principles and Applications. New York: Oxford University Press, 410–435.
Hsieh, J. (2009). Computed Tomography: Principles, Design, Artifacts, and Recent Advances. second edn. Bellingham, Washington USA: SPIE press.
Iassonov, P., Gebrenegus, T., and Tuller, M. (2009). Segmentation of X-ray Computed Tomography Images of Porous Materials: A Crucial Step for Characterization and Quantitative Analysis of Pore Structures. Water Resour. Res. 45. doi:10.1029/2009WR008087
Jones, A., Arns, C., Sheppard, A., Hutmacher, D., Milthorpe, B., and Knackstedt, M. (2007). Assessment of Bone Ingrowth into Porous Biomaterials Using MICRO-CT. Biomaterials 28, 2491–2504. doi:10.1016/j.biomaterials.2007.01.046
Jüstel, A. (2021). Increasing the Knowledge Base for Deep Geothermal Energy Exploration in the Aachen-Weisweiler Area, Germany, through 3D Probabilistic Modeling with GemPy and Quantitative Data Analysis. Master’s thesis Aachen: RWTH Aachen.
Karg, H., Carter, A., Brix, M. R., and Littke, R. (2005). Late- and post-Variscan Cooling and Exhumation History of the Northern Rhenish Massif and the Southern Ruhr Basin: New Constraints from Fission-Track Analysis. Int. J. Earth Sci. (Geol Rundsch) 94, 180–192. doi:10.1007/s00531-005-0467-2
Karimpouli, S., Faraji, A., Balcewicz, M., and Saenger, E. H. (2020). Computing Heterogeneous Core Sample Velocity Using Digital Rock Physics: A Multiscale Approach. Comput. Geosciences 135, 104378. doi:10.1016/j.cageo.2019.104378
Ketcham, R. A., and Carlson, W. D. (2001). Acquisition, Optimization and Interpretation of X-ray Computed Tomographic Imagery: Applications to the Geosciences. Comput. Geosciences 27, 381–400. doi:10.1016/s0098-3004(00)00116-3
Khan, F., Enzmann, F., and Kersten, M. (2016). Multi-phase Classification by a Least-Squares Support Vector Machine Approach in Tomography Images of Geological Samples. Solid Earth 7, 481–492. doi:10.5194/se-7-481-2016
Kneuper, G. (1957). Zur Petrographie der Sandsteine des flözführenden Ruhrkarbons. Mitt. Westfäl. Berggewerkschaftskasse (Kukuk-festschrift) 12, 47–57.
Knutzen, L. K. (2017). Geothermal and Spatial Coupled Site Selection for the Connection of Deep Geothermal Plants to Existing District Heating Networks on the Example of the Ruhr Metropolitan Region. Ph.D. Thesis Bochum: Ruhr-Universität Bochum.
Kruszewski, M., Montegrossi, G., Backers, T., and Saenger, E. (2020). “The In-Situ Stress State of the Rhine-Ruhr Region and its Implications for the Geothermal Energy Utilization,” in EGU General Assembly Conference Abstracts, 4246.
Leu, L., Berg, S., Enzmann, F., Armstrong, R. T., and Kersten, M. (2014). Fast X-ray Micro-tomography of Multiphase Flow in berea sandstone: A Sensitivity Study on Image Processing. Transp Porous Med. 105, 451–469. doi:10.1007/s11242-014-0378-4
Lippert, K., Nehler, M., Balcewicz, M., Bracke, R., and Immenhauser, A. (2021). ”Assessment of the Reservoir Potential of Devonian Carbonates in the Rhine-Ruhr Area, Germany,” in World Geothermal Congress 2020+1 (World Geothermal Congress 2020 Reykjavik), 11141.
Lippert, K., Nehler, M., Balcewicz, M., Bracke, R., and Immenhauser, A. (2019). “Facies-Related Evaluation of the Geothermal Reservoir Potential of Devonian Carbonates in North Rhine-Westphalia, Germany,” in 81st EAGE Conference and Exhibition 2019, 1–5. European Association of Geoscientists & Engineers.
Lippert, K. (2017). The Effect of Cyclic thermal Loading on the Permeability of the Upper Carboniferous Strata in the Ruhr Area. Master’s thesis Aachen: RWTH Aachen.
Löer, K., Riahi, N., and Saenger, E. H. (2018). Three-component Ambient Noise Beamforming in the Parkfield Area. Geophys. J. Int. 213, 1478–1491. doi:10.1093/gji/ggy058
Löer, K., Toledo, T., Norini, G., Zhang, X., Curtis, A., and Saenger, E. H. (2020). Imaging the Deep Structures of Los Humeros Geothermal Field, Mexico, Using Three-Component Seismic Noise Beamforming. B. Seismol. Soc. Am. 91, 3269–3277. doi:10.1785/0220200022
Madonna, C., Almqvist, B. S. G., and Saenger, E. H. (2012). Digital Rock Physics: Numerical Prediction of Pressure-dependent Ultrasonic Velocities Using Micro-CT Imaging. Geophys. J. Int. 189, 1475–1482. doi:10.1111/j.1365-246X.2012.05437.x
Mery, D. (2015). Computer Vision for X-Ray Testing. Switzerland: Springer International Publishing: Springer. doi:10.1007/978-3-319-20747-6
Münch, B., Trtik, P., Marone, F., and Stampanoni, M. (2009). Stripe and Ring Artifact Removal with Combined Wavelet-Fourier Filtering. Opt. Express 17, 8567–8591. doi:10.1364/OE.17.008567
Nehler, M. (2018). Evaluation of Porositiy and Permeability Estimates for Rock Samples Based on X-ray Micro-tomography. Ph.D. Thesis Bochum: Ruhr-universität Bochum.
Normenausschuss Bauwesen (NABau) (2011). Determination of Density of Solid Particles – Capillary Pyknometer, Wide Mouth Pycnometer, Gas Pycnometer. Berlin: Beuth).
Øren, P.-E., and Bakke, S. (2003). Reconstruction of berea sandstone and Pore-Scale Modelling of Wettability Effects. J. Pet. Sci. Eng. 39, 177–199. doi:10.1016/s0920-4105(03)00062-7
Osorno, M., Schirwon, M., Kijanski, N., Sivanesapillai, R., Steeb, H., and Göddeke, D. (2020). A Cross-Platform, High-Performance SPH Toolkit for Image-Based Flow Simulations on the Pore Scale of Porous Media. Comput. Phys. Commun 267, 108059. doi:10.1016/j.cpc.2021.108059
Ostoja-Starzewski, M. (1999). Scale Effects in Materials with Random Distributions of needles and Cracks. Mech. Mater. 31, 883–893. doi:10.1016/S0167-6636(99)00039-3
Ritzmann, O., Maercklin, N., Inge Faleide, J., Bungum, H., Mooney, W. D., and Detweiler, S. T. (2007). A Three-Dimensional Geophysical Model of the Crust in the Barents Sea Region: Model Construction and Basement Characterization. Geophys. J. Int. 170, 417–435. doi:10.1111/j.1365-246X.2007.03337.x
Rogelj, J., Den Elzen, M., Höhne, N., Fransen, T., Fekete, H., Winkler, H., et al. (2016). Paris Agreement Climate Proposals Need a Boost to Keep Warming Well below 2 °C. Nature 534, 631–639. doi:10.1038/nature18307
Rosenfeld, U. (1967). Zur Stratigraphie der Kaisberg-Schichten (oberes Namur) im Ruhr-Karbon. Geol. Rundsch 56, 494–520. doi:10.1007/bf01848739
Rossmann, K. (1969). Point Spread-Function, Line Spread-Function, and Modulation Transfer Function. Radiology 93, 257–272. doi:10.1148/93.2.257
Ruf, M., Balcewicz, M., Saenger, E. H., and Steeb, H. (2021). Digital Rock Physics: A Geological Driven Workflow for the Segmentation of Anisotropic Ruhr Sandstone: Micro-XRCT Data Set. [Dataset] DaRUS. doi:10.18419/darus-1152
Ruf, M., and Steeb, H. (2020). An Open, Modular, and Flexible Micro X-ray Computed Tomography System for Research. Rev. Scientific Instr. 91, 113102. doi:10.1063/5.0019541
Saenger, E. H., and Bohlen, T. (2004). Finite‐difference Modeling of Viscoelastic and Anisotropic Wave Propagation Using the Rotated Staggered Grid. Geophysics 69, 583–591. doi:10.1190/1.1707078
Saenger, E. H., Lebedev, M., Uribe, D., Osorno, M., Vialle, S., Duda, M., et al. (2016a). Analysis of High-Resolution X-ray Computed Tomography Images of Bentheim sandstone under Elevated Confining Pressures. Geophys. Prospecting 64, 848–859. doi:10.1111/1365-2478.12400
Saenger, E. H., Vialle, S., Lebedev, M., Uribe, D., Osorno, M., Duda, M., et al. (2016b). Digital Carbonate Rock Physics. Solid Earth 7, 1185–1197. doi:10.5194/se-7-1185-2016
Saxena, N., Hofmann, R., Alpak, F. O., Dietderich, J., Hunter, S., and Day-Stirrat, R. J. (2017). Effect of Image Segmentation & Voxel Size on Micro-CT Computed Effective Transport & Elastic Properties. Mar. Pet. Geology 86, 972–990. doi:10.1016/j.marpetgeo.2017.07.004
Saxena, N., Hofmann, R., Hows, A., Saenger, E. H., Duranti, L., Stefani, J., et al. (2019). Rock Compressibility from Microcomputed Tomography Images: Controls on Digital Rock Simulations. Geophysics 84, WA127–WA139. doi:10.1190/GEO2018-0499.1
Saxena, N., Hows, A., Hofmann, R., O. Alpak, F. F., Freeman, J., Hunter, S., et al. (2018). Imaging and Computational Considerations for Image Computed Permeability: Operating Envelope of Digital Rock Physics. Adv. Water Resour. 116, 127–144. doi:10.1016/j.advwatres.2018.04.001
Scheer, D., Konrad, W., and Scheel, O. (2013). Public Evaluation of Electricity Technologies and Future Low-Carbon Portfolios in Germany and the USA. Energ. Sustain. Soc. 3, 8. doi:10.1186/2192-0567-3-8
Schepp, L. L., and Renner, J. (2021). Evidence for the Heterogeneity of the Pore Structure of Rocks from Comparing the Results of Various Techniques for Measuring Hydraulic Properties. Transp Porous Med. 136, 217, 243. doi:10.1007/s11242-020-01508-8
Scherp, A. (1963). Die Petrographie der paläozoischen Sandsteine in der Bohrung Münsterland 1 und ihre Diagenese in Abhängigkeit von der Teufe. Fortschr. Geol. Rheinl.-Westf. 11, 251–282.
Schlüter, S., Sheppard, A., Brown, K., and Wildenschild, D. (2014). Image Processing of Multiphase Images Obtained via X-ray Microtomography: a Review. Water Resour. Res. 50, 3615–3639. doi:10.1002/2014wr015256
Sezgin, M., and Taşaltı́n, R. (2000). A New Dichotomization Technique to Multilevel Thresholding Devoted to Inspection Applications. Pattern Recognition Lett. 21, 151–161. doi:10.1016/s0167-8655(99)00142-7
Sheppard, A. P., Sok, R. M., and Averdunk, H. (2004). Techniques for Image Enhancement and Segmentation of Tomographic Images of Porous Materials. Physica A: Stat. Mech. its Appl. 339, 145–151. doi:10.1016/j.physa.2004.03.057
Siegert, M., Gurris, M., and Saenger, E. H. (2021). Validation Suite for Numerical Solvers Calculating Effective thermal Conductivity in Porous media. J. Appl. Geophys. 189, 104323. doi:10.1016/j.jappgeo.2021.104323
Sivanesapillai, R., Steeb, H., and Hartmaier, A. (2014). Transition of Effective Hydraulic Properties from Low to High Reynolds Number Flow in Porous media. Geophys. Res. Lett. 41, 4920–4928. doi:10.1002/2014gl060232
Stöckhert, F. (2015). Fracture Mechanics Applied to Hydraulic Fracturing in Laboratory Experiments. Ph.D. Thesis, Ruhr-Universität Bochum.
Storath, M., Weinmann, A., Frikel, J., and Unser, M. (2015). Joint Image Reconstruction and Segmentation Using the Potts Model. Inverse Probl. 31, 025003. doi:10.1088/0266-5611/31/2/025003
Tran, T. Q., Banning, A., Wisotzky, F., and Wohnlich, S. (2020). Mine Water Hydrogeochemistry of Abandoned Coal Mines in the Outcropped Carboniferous Formations, Ruhr Area, Germany. Environ. Earth Sci. 79, 1–16. doi:10.1007/s12665-020-8821-z
Vlassenbroeck, J., Dierick, M., Masschaele, B., Cnudde, V., Van Hoorebeke, L., and Jacobs, P. (2007). Software Tools for Quantification of X-ray Microtomography at the UGCT. Nucl. Instr. Methods Phys. Res. Section A: Acc. Spectrometers, Detectors Associated Equipment 580, 442–445. doi:10.1016/j.nima.2007.05.073
Weinhardt, F., Class, H., Vahid Dastjerdi, S., Karadimitriou, N., Lee, D., and Steeb, H. (2021). Experimental Methods and Imaging for Enzymatically Induced Calcite Precipitation in a Microfluidic Cell. Water Res. 57, e2020WR029361. doi:10.1029/2020WR029361
Weiß, E.-G. (2020). Renewable Geothermal Energy–Latest Developments in Geothermics in North Rhine-Westphalia: New Finds. New Projects. New Research Facilities. Mining Rep. 156, 533–540.
Wildenschild, D., and Sheppard, A. P. (2013). X-ray Imaging and Analysis Techniques for Quantifying Pore-Scale Structure and Processes in Subsurface Porous Medium Systems. Adv. Water Resour. 51, 217–246. doi:10.1016/j.advwatres.2012.07.018
Wu, S., and Amin, A. (2003). “Automatic Thresholding of gray-level Using Multistage Approach,” in Seventh International Conference on Document Analysis and Recognition, 2003. Proceedings. (IEEE), 493–497.
Keywords: digital rock physics, anisotropy, multi-phase segmentation, digital twin, pore network, tight sandstone, high-resolution x-ray computed tomography
Citation: Balcewicz M, Siegert M, Gurris M, Ruf M, Krach D, Steeb H and Saenger EH (2021) Digital Rock Physics: A Geological Driven Workflow for the Segmentation of Anisotropic Ruhr Sandstone. Front. Earth Sci. 9:673753. doi: 10.3389/feart.2021.673753
Received: 28 February 2021; Accepted: 04 June 2021;
Published: 29 June 2021.
Edited by:
Pascal Audet, University of Ottawa, CanadaReviewed by:
Steffen Berg, Shell, NetherlandsCopyright © 2021 Balcewicz, Siegert, Gurris, Ruf, Krach, Steeb and Saenger. This is an open-access article distributed under the terms of the Creative Commons Attribution License (CC BY). The use, distribution or reproduction in other forums is permitted, provided the original author(s) and the copyright owner(s) are credited and that the original publication in this journal is cited, in accordance with accepted academic practice. No use, distribution or reproduction is permitted which does not comply with these terms.
*Correspondence: Martin Balcewicz, bWFydGluLmJhbGNld2ljekBocy1ib2NodW0uZGU=
Disclaimer: All claims expressed in this article are solely those of the authors and do not necessarily represent those of their affiliated organizations, or those of the publisher, the editors and the reviewers. Any product that may be evaluated in this article or claim that may be made by its manufacturer is not guaranteed or endorsed by the publisher.
Research integrity at Frontiers
Learn more about the work of our research integrity team to safeguard the quality of each article we publish.