 Andong Xu
 Yonghong Zhao
 Teng Wang
95% of researchers rate our articles as excellent or good
Learn more about the work of our research integrity team to safeguard the quality of each article we publish.
Find out more
ORIGINAL RESEARCH article
Front. Earth Sci. , 04 June 2021
Sec. Solid Earth Geophysics
Volume 9 - 2021 | https://doi.org/10.3389/feart.2021.672809
This article is part of the Research Topic The Earthquake Cycle: What Do We Know? View all 8 articles
The moment magnitude (Mw) 6.4 and 7.1 Ridgecrest earthquake sequence that occurred on July 4 and 6, 2019, ruptured a conjugate fault system within the eastern California shear zone. In addition to the ∼50 km surface ruptures, the sequence activated a series of structures with lengths ranging from 1 to 10 km, which are well illuminated by phase gradient maps of Synthetic Aperture Radar (SAR) interferograms. The deformation patterns and mechanisms of these fractures have been well studied, yet the controlling factors of their spatial distribution are less discussed, which are important for understanding how the accumulated strain is released via distributed faulting in the earthquake cycle. Here, we use multi-source SAR images to derive three-dimensional (3D) surface displacement along the main ruptures and the east–west strain across the detected small fractures caused by the 2019 Ridgecrest earthquake sequence. We find that the distribution of these fractures is related to the displacement pattern along the main rupture. Specifically, more fractures appeared in areas with larger slips normal to the main rupture as well as in the junction of the conjugated ruptures. We also conduct uniaxial loading rock experiments to evaluate the strain distribution before the samples were broken. Rock experiments show that rupturing of a conjugated fault system may produce local strain concentration along the main rupture, indicating the important role of the orthogonal faults in generating small fractures with different striking angles and deformation patterns. The 2019 Ridgecrest earthquake sequence exhibits complicated crust behaviors by rupturing an immature fault system, implying that the simple elastic rebound theory may be insufficient to model the coseismic deformation during the earthquake cycle, particularly in the zone with weak crust.
The eastern California shear zone (ECSZ) accommodates ∼20% of the relative motion between the Pacific and North American Plates and continues to generate large strike-slip earthquakes (e.g., Hauksson et al., 1995; Fialko et al., 2002; Surpless, 2008; Unruh and Humphrey, 2017). On July 4, 2019, an Mw 6.4 foreshock ruptured an NE–SW-striking fault in the ECSZ, which played an important role in triggering the Mw 7.1 mainshock that happened about 34 h later (Wang et al., 2020). The spatial distribution of aftershocks that occurred between the foreshock and the mainshock indicates an “L”-shaped conjugated fault system (Ross et al., 2019; Lin, 2020; Shelly, 2020) (Figure 1). Observed by field survey and satellite imagery (Brandenberg et al., 2019; Ross et al., 2019; Fielding et al., 2020), the mainshock ruptured a series of NW–SE-striking fault strands with a right-lateral slip forming a ∼50 km rupture zone, and around its southeast tip, several subparallel strands terminated just north of the Garlock Fault (Liu et al., 2019; Ross et al., 2019; Chen et al., 2020; Feng et al., 2020; Wang and Zhan, 2020).
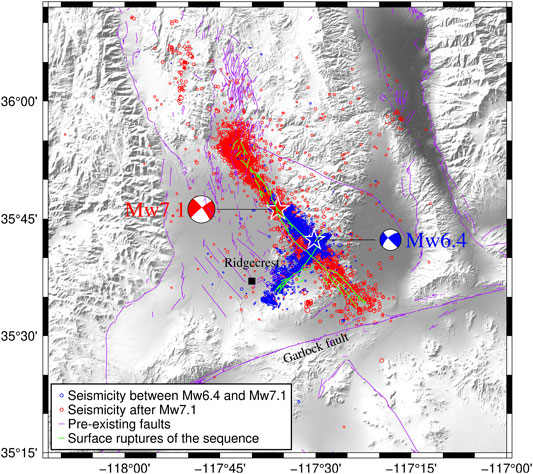
FIGURE 1. Regional tectonic setting and aftershock distribution in the 2019 Ridgecrest earthquake sequence region. Blue and red beach balls represent the moment tensors of the Mw 6.4 and Mw 7.1 events, respectively (United States Geological Survey, USGS). Blue dots indicate aftershocks that occurred between the Mw 6.4 and Mw 7.1 events, and red dots indicate aftershocks following the Mw 7.1 event. Purple lines show the previously mapped faults, while green lines represent the surface ruptures of the 2019 Ridgecrest sequence based on field survey and optical remote-sensing images (Brandenberg et al., 2019).
Corresponding to surface ruptures, the coseismic displacement of the Ridgecrest sequence has been well illuminated by both ascending and descending Synthetic Aperture Radar (SAR) images of the Sentinel-1, ALOS-2, and COSMO-SkyMed satellites (e.g., Xu et al., 2020a; Feng et al., 2020; Wang et al., 2020). High-resolution optical remote-sensing images are also used to study the coseismic displacement and strain along the surface ruptures, showing detailed strain tensors along ruptures of the foreshock and mainshock (e.g., Barnhart et al., 2020; Milliner and Donnellan, 2020). In addition to the right-lateral slip along the NW–SE Mw 7.1 rupture and the left-lateral slip along the NE–SW Mw 6.4 rupture, the sequence activated a series of structures with lengths ranging from 1 to 10 km, which are well revealed by phase gradient maps of SAR interferograms (Xu et al., 2020a; Xu et al., 2020b). Small fractures were also identified in the 1992 Landers and 1999 Hector Mine earthquakes (Sandwell et al., 2000; Fialko et al., 2002; Fialko et al., 2004), both occurred in the ECSZ.
Xu et al. (2020b) propose models to explain the mechanisms of shear deformation across these fractures. Specifically, the triggered frictional slip model is applied to explain the deformation prograde to the direction of tectonic stress. A contrast of shear modules between the compliant fault zone and the surrounding crust is applied to explain slips in the opposite direction of the prevailing tectonic stress. Their results imply that earthquakes can produce permanent, inelastic deformation on preexisting structures off the main faults. However, the relation between the main ruptures and the small fractures is less discussed. The role of the orthogonal faults in the generation of these fractures is unclear either.
Aiming at qualitatively evaluating the relation between the main ruptures and the fracture distribution, we calculate surface displacement using multi-source SAR images and conduct uniaxial loading rock experiments to study the distribution of fractures produced by the 2019 Ridgecrest sequence. We obtain the 3D coseismic displacement from multi-source SAR images using pixel-offset tracking. We also calculate the east–west deformation and strain across the detected small fractures from two Sentinel-1 interferograms acquired on exactly the same date. Our results show that fracture density is higher in the areas with larger slips normal to the main rupture as well as in the junction of the conjugated ruptures. The rock experiments show that the orthogonal ruptures play an important role in producing a complicated stress regime that promotes the generation of fractures. The 2019 Ridgecrest earthquake sequence reveals the complicated crust behaviors when rupturing an immature fault system, implying the simple elastic rebound theory may be insufficient in accounting for the coseismic displacement during earthquake cycles.
We collect C-band Sentinel-1 SAR images from ascending (AT64) and descending (DT71) tracks and L-band ALOS-2 ScanSAR SAR images from the ascending track (AT65), which all spanned the 2019 Ridgecrest sequence (see Table 1 for information about SAR data). Particularly, the ascending and descending Sentinel-1 interferograms acquired on exactly the same dates (July 4–16, 2019) are used to map the deformation across small fractures. Such data configuration can avoid the influence of using measurement with different post-seismic deformations during decomposition. We process these images and obtain coseismic interferograms (Supplementary Figure S1), pixel-offset maps (Supplementary Figure S2), and phase gradient images (Supplementary Figure S3) to map the surface displacement. We also carry out uniaxial loading experiments on marble samples with one prefabricated fault and two conjugated prefabricated faults (Supplementary Figure S4), respectively, to study the strain distribution similar to the fault configuration of the 2019 Ridgecrest sequence.
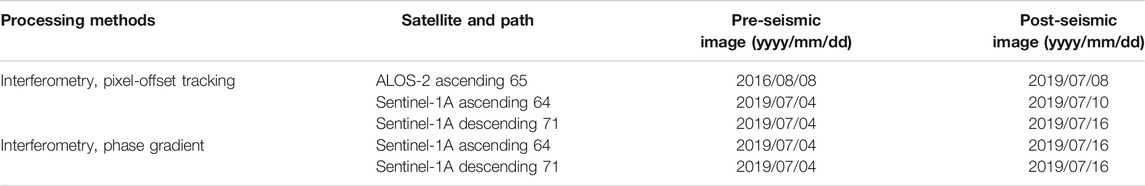
TABLE 1. Multi-source SAR images and handling methods.
The coseismic interferograms (Supplementary Figures S1A,B) of Sentinel-1 SAR images are obtained using the Sentinel-1 Interferometry Processor (http://sarimggeodesy.github.io/software; Jiang et al., 2017) and then are unwrapped by the Statistical-cost Network-flow Algorithm for Phase Unwrapping (SNAPHU; Chen, 2001; Chen and Zebker, 2001). The unwrapped interferograms are converted to the line-of-sight (LOS) deformation (Supplementary Figure S1). We use the unwrapped interferograms for calculating the east–west and the vertical/north–south surface deformation across the detected small fractures that will be described in Surface Deformation Across Fractures.
Pixel-offset tracking of SAR images can map displacement along the radar line of sight (LOS), i.e., range direction, and the satellite flight, i.e., azimuth direction. Because of the slant-range imaging geometry, the SAR range offset is sensitive to the vertical displacement, allowing for deriving the 3D coseismic displacement for large displacements (Pathier et al., 2006; Wang and Jonsson, 2015; Ruch et al., 2016; Schaefer et al., 2017). We first co-register SAR images acquired before and after the earthquake sequence based on the orbital information and SRTM DEM. Then, we distribute image patches covering the epicenter area and calculate pixel offsets using cross-correlation (Wang and Jonsson, 2015). We calculate pixel offsets of the ALOS-2 images in the epicenter area (Supplementary Figures S2A,B). For the Sentinel-1 SAR images, we carry out co-registration and pixel-offset tracking burst by burst and then merge them into one map (Supplementary Figures S2C–F). The pixel offsets are converted to deformation by multiplying the pixel spacing of corresponding sensors. For each coseismic image pair, we obtain deformation along the range and azimuth directions, which are used to constrain the 3D coseismic displacements.
The coseismic interferograms show clear discontinuity along the ruptures of the foreshocks and mainshocks (Supplementary Figure S1). However, we are not able to reveal small fractures from these interferograms because the deformation across those small fractures is too small to generate a significant phase pattern. The phase gradient is sensitive to detect discontinuities by differential phase of adjacent positions in the north–south direction and the east–west direction (Supplementary Figure S3) (Xu et al., 2020a; Xu et al., 2020b). We identify 461 fractures (Figure 2) from phase gradient maps derived from Sentinel-1 ascending and descending interferograms acquired on the same dates, facilitated by coseismic interferograms and pixel offsets. The distribution of the detected small fractures is consistent with that reported by Xu et al. (2020a) and clearly exhibits a certain pattern associated with the surface ruptures and coseismic displacement along the ruptures.
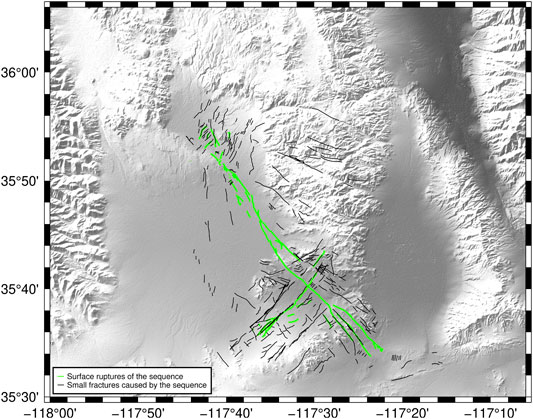
FIGURE 2. Distribution of small fractures in the Ridgecrest region after the earthquake sequence. Green lines show the surface ruptures (Brandenberg et al., 2019), and black lines represent the small fractures mapped on phase gradient maps facilitated also by coseismic interferograms and pixel offsets.
We derive the 3D coseismic displacement along surface ruptures, which is important for revealing the relation between the displacement caused by the main rupture and the generation of small fractures. The 3D coseismic displacement needs to be calculated using at least three independent observations. The range and azimuth offsets of multi-source SAR images (Supplementary Figure S2) can be served as these independent observations, which are obtained by pixel-offset tracking. We distribute small patches through the study area with different dimensions according to the distance to the main ruptures (e.g., Wang et al., 2018). For each patch, if at least three independent offsets
with
where
In order to investigate the detailed displacements distributed along the surface rupture, we further distributed patches with a dimension of 3-by-3 km across the rupture to calculate the 3D displacement and decompose the horizontal displacement into directions parallel and normal to the strike of the NW–SE main rupture (Figure 3).
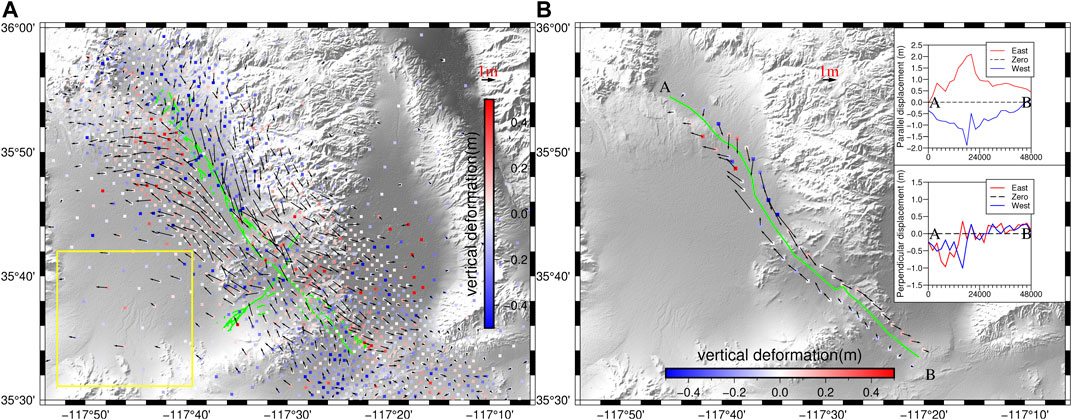
FIGURE 3. Three-dimensional (3D) coseismic displacements in the Ridgecrest region. Colored squares indicate the vertical displacements, and black arrows represent the direction and magnitude of the horizontal displacements. The area enclosed by a yellow rectangle is chosen for accuracy evaluation assuming very smooth coseismic deformation. The standard deviation of measurement points within the yellow rectangle is 0.11, 0.13, and 0.12 m along the east–west, north–south, and up–down directions, respectively. (A) Green lines show the surface ruptures of the 2019 Ridgecrest sequence (Brandenberg et al., 2019). (B) The green line shows the simplified NW–SE main rupture that we mapped according to the coseismic interferogram, phase gradient map, and pixel offsets (Supplementary Figures S1–S3). The inset shows the decomposed displacements parallel and normal to the main rupture.
We analyze the east–west deformation across small fractures using ascending and descending interferograms acquired on exactly the same dates (July 4–16, 2019). By using such interferograms, we can largely ensure the measured LOS deformations are projected from the same surface deformation for ascending and descending data, preventing the systematic errors that may be introduced by stacking interferograms acquired on different dates for deformation decomposition (e.g., Xu et al., 2020b). The coseismic deformation is a result of the main rupture superimposed over the deformation produced by small fractures, while we are interested in the local deformation across those small fractures at the surface. We thus remove the coseismic deformation produced by a slip model inverted from seismic and geodetic data (Yue et al., 2021, in review) and then eliminate a 2D linear plane fitted from the residuals around each small fracture. We firstly estimate the east–west and north–south/up–down motions similar to the solution of 3D coseismic deformation (e.g., Xu et al., 2020a). Because the deformations across fractures are small, we can only use unwrapped phases from the ascending and descending tracks, i.e., only deformations from two independent directions along the radar’s LOS directions. Consequently, we are not able to separate the vertical and north–south components to study the shear and normal deformations across fractures. Instead, we use the east–west component, which is the most reliable measurement, to analyze the deformation pattern across these fractures. If the striking angle of a fracture is close to the north–south direction, the east–west deformation difference indicates the strain normal to the fracture; if the striking angle of a fracture is close to the east–west direction, the east–west deformation difference indicates the shear strain across the fracture.
We prepare two marble samples, one with a prefabricated fault and the other with two prefabricated orthogonal faults for uniaxial loading experiments (Supplementary Figure S4). The parameters of prefabricated faults are scaled to 1:1,000,000 based on previous studies (Liu et al., 2019; Xu et al., 2020b; Wang and Zhan, 2020). The first marble sample is with only one prefabricated fault that is similar to the main rupture of the 2019 Ridgecrest sequence. The striking of the prefabricated fault is 48°E to the loading direction, which is calculated from the striking angle of the main rupture (41°W) and of the background tectonic stress (7°E) (Wang and Zhan, 2020). The length of the fault is 38 mm, while the width and depth are 0.5 and 2 mm, respectively. The second marble sample is with two orthogonal prefabricated faults on its surface with a shorter one similar to the foreshock rupture. The length of the shorter fault is 15 mm, while the width and depth are the same as the longer one. We spray speckles on the surface of these cuboid marbles with prefabricated faults and fix them under the press along the Y-axis, which can exert surface force in the direction 48°E to the longer prefabricated fault. A high-speed optical camera that can take four photos per second is applied to capture images of the sample surface during the loading process. These images all have random gray features constructed by speckles that we spray, which can be used in the digital speckle correlation method (DSCM) (Yamaguchi, 1981; Peters and Ranson, 1982; Ma et al., 2004). The principle of the DSCM is similar to pixel-offset tracking, which uses the images acquired by the same camera at two times to calculate the surface deformation and strain of the marble samples.
We obtain 3D coseismic displacements near the surface ruptures of the 2019 Ridgecrest sequence (Figure 3). The horizontal motion along the main rupture exhibits a typical right-lateral strike-slip pattern dominated by the mainshock. Across the surface rupture produced by the foreshock, the northwest-ward motion is slightly distorted by the left-lateral slip. In addition to the right-lateral slip, a clear subsidence area appears in the northeast lobe where the topography is relatively lower than surroundings (Figure 3), in agreement with the vertical deformation derived from optical imagery (Barnhart et al., 2020). The decomposed horizontal displacements along the NW–SE main rupture show that a large lateral slip occurred in the middle segment, maximized (∼4 m) at about 25 km from the north terminus of the main rupture (Figure 3, insets). The largest dip-slip appears in the northwest segment, with the maximum slip (over 1 m) occurring about 1 km north to the largest lateral motion, with ∼1 m of subsidence west of the rupture. The main rupture splits into several nearly parallel subfaults at the southeast tip (Brandenberg et al., 2019; Ross et al., 2019) and terminates a few kilometers from the Garlock Fault with coseismic displacement rapidly decayed to the unmeasurable level for pixel-offset tracking.
We calculate fracture densities on 1.8-by-1.8 km patches distributed in the epicenter area and display them with the magnitude of horizontal displacement (Figure 4). In general, high fracture densities appear in the region with smaller coseismic displacements except for the junction area of the conjugated surface ruptures. Along the middle segment with the largest horizontal displacement, the lowest fracture density can be observed, implying that the accumulated strain has been mainly released by the large lateral displacement along the main rupture.
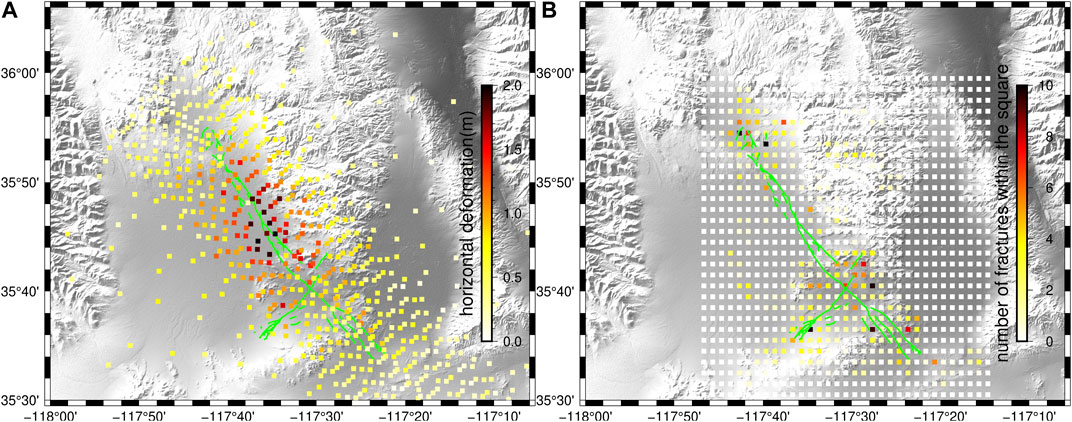
FIGURE 4. Magnitudes of horizontal coseismic displacements and fracture densities in the epicenter area. (A) Colored squares represent magnitudes of horizontal displacements based on the patches for deriving the 3D coseismic displacement field. (B) Colored squares indicate the fracture density calculated on 1.8-by-1.8 km grids. The green line shows the surface ruptures of the 2019 Ridgecrest sequence (Brandenberg et al., 2019).
In the northwest segment of the main surface rupture, both sides show west- and southwest-ward displacements (Figure 3), keeping the eastern side of the rupture under tensile stress while the western part under compressive stress. Because the rock in the crust is a typical brittle material whose tensile strength is far less than the compressive strength, fractures are more likely to form in the east of rather than the west of the rupture, which is consistent with the fracture density distribution (Figure 4B). The fracture distribution around the southeast terminus of the surface rupture is similar to the northwest tip (Figure 4 and Supplementary Figure S5). The dip-slip component shows that the area along and east of the rupture is under tensile stress with more small fractures (Figures 4, 5). High fracture density also appears around the junction area of main surface ruptures produced by the earthquake sequence. The left-lateral slip caused by the foreshock makes the stress here rather complex, associated with fractures with diverse striking angles.
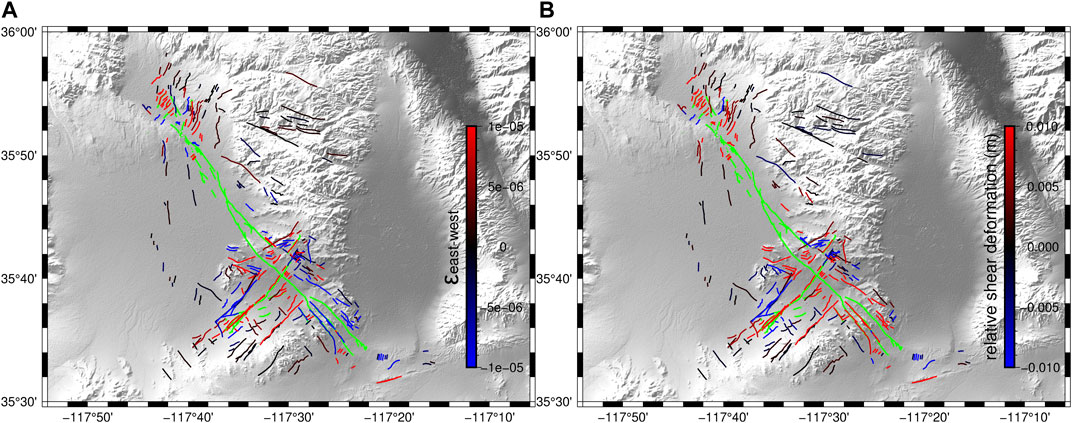
FIGURE 5. Surface deformation patterns across small fractures. (A) Colors denote the east–west strain across fractures. Blue lines indicate fractures located in the compressional strain regime, and red lines indicate fractures located in the tensional strain regime along the east–west direction. Black lines represent fractures with small east–west strain. (B) Colors represent the shear deformation across fractures. Red lines indicate the left-lateral motion, and blue lines represent the right-lateral motion. Black lines show fractures with little shear motion, i.e., the shear motion difference across the fracture is close to zero.
We derive the east–west deformation and strain across each detected fracture using the ascending and descending Sentinel-1 interferograms acquired on the same date (Table 1). We plot fractures with colors indicating the extension or compression strain across the fractures in the east–west direction (Figure 5A, red means extension, blue means compression). To verify the validity of our results, we also calculate the shear slip direction (left-lateral or right-lateral) (Figure 5B), which is basically consistent with that reported in the previous study (Xu et al., 2020a). Note that because we cannot really separate the north–south displacement from the vertical displacement, these results are obtained based on the derived east–west deformation field. In this case, the strain is normal to the fractures only when the striking angles are close to the north–south direction.
To the northeast and southwest lobes off the main rupture, most of the fractures are associated with east–west extension and subsidence (Figure 3), particularly fractures striking close to the north–south direction. This means that the generation of fractures in these regions is more associated with a larger tensional component normal to their striking direction (Figure 5A). On the contrary, around the southeast terminus of the main rupture, east–west compression dominates with mainly left-lateral slips (Figure 5B), which are prograde to the tectonic shear stress directions (Xu et al., 2020a). In the junction area of surface ruptures with dense fractures, the sense of deformation is more complex with different fracture deformation patterns.
Despite that most of the fractures occurred off the main faults of this region, a clear left-lateral slip pattern is illuminated by InSAR, along a 5-km segment of the well-known Garlock Fault (Figure 6), pointed by the southeast terminus of the main rupture. The Garlock Fault is a 260-km-long left-lateral strike-slip fault capable of producing Mw ∼7.8 earthquakes (Davis and Burchfie., 1973; Ross et al., 2019). Although the Coulomb stress change caused by the foreshock and mainshock reaches 1 bar on the central Garlock Fault (Barnhart et al., 2019), left-lateral slip is only observed along a short segment on the Garlock Fault (Figure 6). If we assume the vertical deformation from the well-known strike-slip fault is close to zero, we can decompose the LOS deformation of ascending and descending images into the deformation parallel and normal to the fracture. The result shows that the southward extensional deformation is normal to the slipped segment of the Garlock Fault (Figure 6F), showing an extensional strain pattern normal to the fault, which is consistent with the Coulomb stress analysis of the mainshock (Marlon et al., 2020).
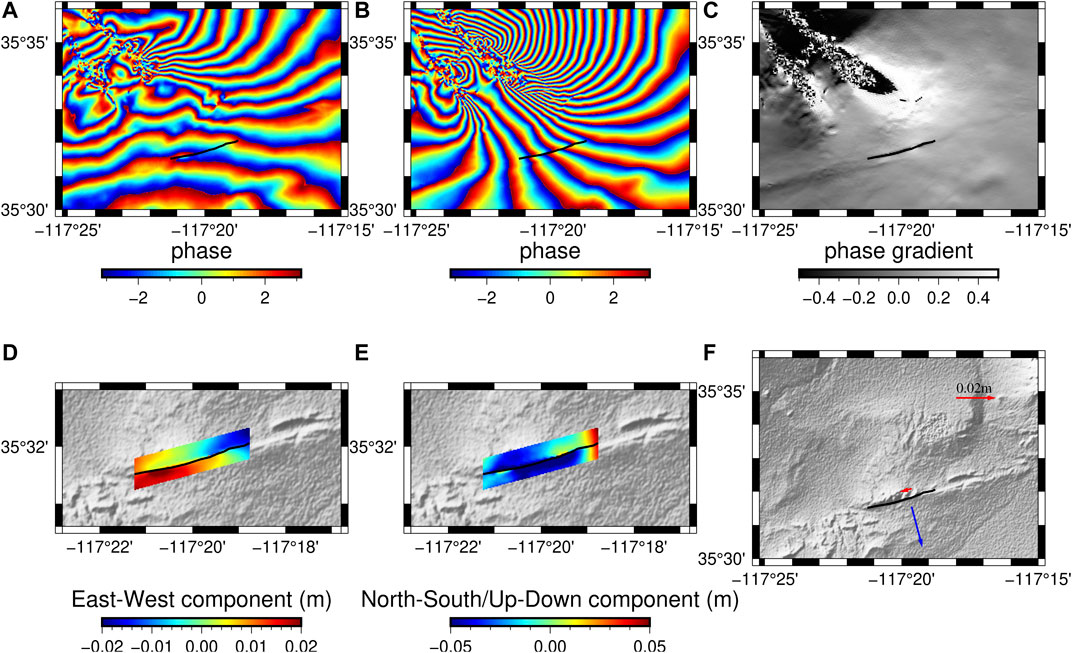
FIGURE 6. Coseismic deformation across the Garlock Fault. The thick black line indicates the segment of the Garlock Fault that slipped during the 2019 Ridgecrest sequence. Sentinel-1A interferograms of the (A) ascending track (AT64) and (B) descending track (DT71) near the Garlock Fault. The phase gradient map from the descending track (DT71) is shown in (C). (D) East–west component of displacement near the slipped segment of Garlock Fault, in which red represents slipping toward east, while blue indicates slipping toward west. (E) North–south component of displacement near the slipped segment of Garlock Fault assuming small vertical deformation, in which red represents slipping toward north, while blue indicates slipping toward south. (F) Left-lateral and tensional deformation of the slipped segment. The red arrow represents the relative slip parallel to the Garlock Fault, and the blue arrow represents the relative motion normal to the Garlock Fault.
Our rock experiments reveal the strain distributions on the marble samples before they were broken by the persistently applied unilateral loading. The strain fields are quite different between samples with only one prefabricated fault and with two orthogonal faults (Figure 7). For the single-fault configuration, the strain distribution is simple and concentrated along the east side of the main rupture. Some local strain concentration areas appear at the two tips of the main rupture, but the strain along the main ruptures shows a very similar distribution for X- and Y-direction strains, indicating the maximum strain direction is the same as the rupture (Figures 7A,B).
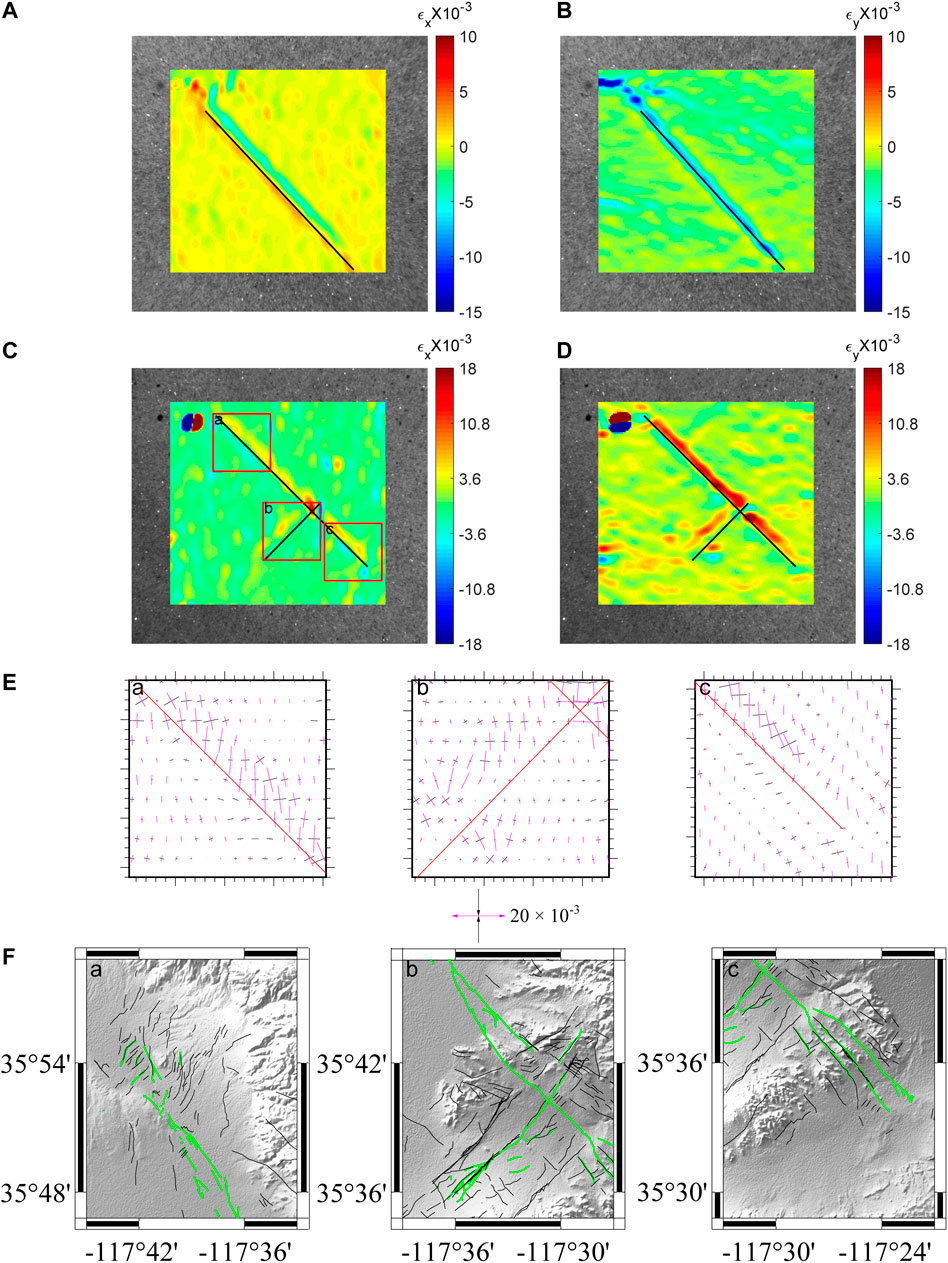
FIGURE 7. Strain fields observed before the marble samples were broken. Colors represent the strain in the direction of X-axis (A) and Y-axis (B) of the marble sample with only one prefabricated fault and of the marble sample with two orthogonal prefabricated faults (C) and (D), respectively. Positive values indicate tensional strain along the corresponding axis, while negative values indicate compressional strain along the axis. The black line indicates the prefabricated fault, and the loading direction is along the negative direction of Y-axis. The principal strain axes within the red rectangles in (C) are shown in (E). The red lines indicate the prefabricated faults, and the black lines represent compression, while the magenta lines represent extension. Surface fractures produced by the earthquake sequence in the corresponding areas are shown in (F) for comparison.
Compared with the single-fault configuration, the existence of another weak zone imitated the foreshock rupture, making the mean strain increase significantly. In the area near the main and foreshock faults, the local strain clearly increases especially in the Y-direction that is parallel to the loading direction (Figures 7C,D). More importantly, the strain pattern along the main rupture changes from compressional (blue) to tensional (red) (Figure 7). Accordingly, the stress required to break the marble samples is also smaller for the sample with two prefabricated faults.
The sample with the conjugated fault system also shows a more complicated strain distribution, which exhibits certain consistency with fracture distribution. At the two terminuses of the NW–SE main rupture, obvious strain concentration can be observed for both samples, but the magnitude is enhanced when the foreshock rupture exists. We obtain the horizontal principal strain (compression and extension) of each sampling point on the surface (Figure 7E). Thus, we can determine the optimal angles from principal strain axes by rotating 45–60° for newly formed fractures, which is roughly consistent with the fracture striking in the earthquake sequence (Figure 7F).
The X-direction strain at the northwest tip of the NW–SE main rupture is weaker than the Y-direction strain here. This can promote the formation of NNE–SSW and NNW–SSE fractures, consistent with the striking angles of fractures in this region especially in the east part of the northwest tip (Figures 7E,F). The X-direction strain at the southeast terminus of the NW–SE main rupture is almost negative that is similar to the Y-direction strain in this region (the western part of the rectangle c in Figure 7C), with a much smaller magnitude than that of the northwest tip, which is corresponding to the lower density fractures observed from InSAR than around the northwest terminus. The X- and Y-direction strains in the eastern part of the main fault show tensile strain that is helpful to generate fractures compared to the western part, consistent with the fact that most fractures close to the main rupture are located to the east of it. We also find that the strain presents local concentration with high magnitudes and complicated patterns around the junction of the two ruptures, which facilitates to generate high-density fractures with various striking angles (Figures 2, 7E,F).
The east–west strain analysis shows that more fractures are located in the areas with tensional strain normal to their striking directions, reducing the normal stress and, consequently, the friction across pre-existing structures and facilitating the motion under shear stress. The middle segment of the main rupture is typical shear dominating with slip parallel to the main rupture (Figure 3). However, our results show that displacements normal to the ruptured fault strongly affect the fracture distribution. Most of the fractures are distributed in the northeast and southwest lobes of the conjugated fault system, where relatively larger dip-slip components can be observed (Figure 3B and inset). Under the maximum principal stress, the tensile state in these regions is prone to causing fractures east of the rupture around the northwest tip and west of the rupture around its southwest tip. In contrast, the western part of the northwest tip and the eastern part of the southeast tip are in a compressional stress regime, where much fewer fractures can be formed. Very few fractures were generated in the middle segment of the main rupture with almost purely lateral slips with the largest magnitudes (Figures 3, 4).
Along the subparallel fault at the southeast tip of the mainshock rupture, the aftershocks occurred and extended close to the Garlock Fault (Figure 1). However, the focal mechanism of the earthquakes that are located less than 1 km from the Garlock Fault shows significant different striking directions to the Garlock Fault, indicating its central segment may not be triggered seismically during the Ridgecrest sequence (Wang and Zhan, 2020). Our deformation decomposition shows that the extensional deformation is large across the slipped segment of the Garlock Fault (Figure 6), suggesting that the slip is a release of the accumulated stress due to both the prograde shear stress and the lowered normal stress by the extensional deformation across it. This is consistent with the detailed Coulomb stress analysis of the earthquake sequence (Marlon et al., 2020), implying that the normal stress serves as a gate that allows or prohibits slip from occurring but the shear stress determines the direction of the slip (Xu et al., 2020b).
Note that our discussion is based on the observation of surface displacements rather than the Coulomb stress analysis based on a slip model (e.g., Xu et al., 2020b; Marlon et al., 2020). By doing this, we can avoid assumptions on physical parameters of shallow crust and reduce the effect of uncertainty in slip distribution inverted based on the dislocation model in an elastic medium. Nevertheless, to quantitively interpret the relation of local strain/stress and the distribution of fractures, further modeling attempt is needed.
The 2019 Ridgecrest sequence broke a series of strike-slip faults as well as many small fractures, indicating a rather complex stress regime in this region, especially around the junction area of the conjugated surface ruptures. Our simple rock experiments show that the conjugated fault system decreases the loading that is required to break the sample and significantly increases the number and the magnitude of local strain anomalies. The strain pattern near the foreshock fault presents petal shape (Figures 7C,D), which has significant influence on the change in strain state in this region. The distribution of local strain anomalies fits roughly with the fracture distribution as we observed from InSAR, which may be responsible for the fractures in this region with different failure patterns. We ensure that there is no visible fracture in the surface of initial rock samples except for the prefabricated structures in our experiment. Therefore, our rock experiment may also imitate the initial statues when these fractures were newly formed in the tensional strain field.
Fractures have been observed also after the 1992 Mw 7.3 Landers (Fialko et al., 2004) and 1999 Mw 7.1 Hector Mine (Fialko et al., 2002) earthquakes that occurred in the ECSZ. However, fewer fractures were observed during these earthquakes with similar magnitudes and rupture style to the mainshock in 2019. One reason is the lack of short repeating-time SAR images at that time (Xu et al., 2020b). However, the surface ruptures of these two earthquakes, particularly the 1999 Hector Mine earthquake, are relatively simpler than the ones produced by the 2019 Ridgecrest sequence, and the fractures are mainly distributed around the two terminuses of the surface ruptures (Fialko et al., 2002). This also implies the important role of the orthogonal faults in generating large amount of fractures during the 2019 sequence.
From the classic elastic rebound theory proposed by Reid (1910), earthquake is a transit behavior to release the elastic strain accumulated during the interseismic stage. For the 2019 Ridgecrest earthquake sequence, the ratio of the mainshock stress drop to the background stress is about 0.5–0.9 near the epicenter region, which indicates that a large amount of background deviatoric stress was released by the mainshock (Wang and Zhan, 2020). The accumulated energy was released mostly by the right-lateral slip during the mainshock, and low fracture density, thus, appears in the area with the largest lateral displacement (Figures 3–5). In contrast, the deformation across fractures, particularly the normal deformation, may be inelastic along with the formation of these fractures.
After the 2019 Ridgecrest sequence, the ruptured strike-slip faults and activated small fractures should begin to accumulate strain again. However, the two high-density fractures in the northeast and southwest lobes may have altered the rock integrity during this earthquake sequence, which may significantly affect the reoccurrence of earthquakes in the future. Therefore, it is important to study the post-seismic deformation not only along the main ruptures but also along these small fractures to investigate if the motion was only triggered by earthquakes or they behaved similar to large faults to accumulate strain in the interseismic stage, which we leave as further work.
In this study, we derived the 3D coseismic displacement of the 2019 Ridgecrest sequence using multi-source SAR images. Meanwhile, many unmapped small fractures activated by the sequence were detected by the phase gradient map. High fracture density appears in the tensile regions at the northeast and southwest lobes of the main rupture. In contrast, low fracture density appears in the area with large, smooth lateral coseismic displacement with small dip components. By analyzing the east–west strain across these fractures, we find that most of the fractures to the northeast and southwest lobes are located associated with extensional strain in the east–west direction. Uniaxial loading rock experiments offer a qualitative view to understand the influence of the orthogonal faults in producing fractures with various striking angles and deformation patterns. Our results reveal that the inelastic deformation may be accommodated by forming small fractures when rupturing an immature, complicated fault system, implying that the crustal behavior in the earthquake cycle can be more complicated than simple elastic rebound theory describes.
The original contributions presented in the study are included in the article/Supplementary Material, and further inquiries can be directed to the corresponding author.
TW conceived the study. AX conducted the InSAR data processing and uniaxial experiments. CR and HY provided the coseismic slip model. TW and YZ provided funding and supervised the study. AX wrote the manuscript with contributions from TW and YZ. All authors discussed and interpreted the results and the manuscript.
This work was supported by the National Key Research and Development Program of China (2019YFC1509204 and 2018YFC1504203) and the National Science Foundation of China (NSFC Grants: 42021003 and 41974017).
The authors declare that the research was conducted in the absence of any commercial or financial relationships that could be construed as a potential conflict of interest.
Sentinel-1 SAR data are copyrighted by the European Space Agency and are additionally distributed by the Alaska Satellite Facility. ALOS-2 SAR images are provided by the Japan Aerospace Exploration Agency (JAXA) via the Research Project ER2A2N050. Additional data related to this paper may be requested from the corresponding author.
The Supplementary Material for this article can be found online at: https://www.frontiersin.org/articles/10.3389/feart.2021.672809/full#supplementary-material
Barnhart, W. D., Gold, R. D., and Hollingsworth, J. (2020). Localized Fault-Zone Dilatancy and Surface Inelasticity of the 2019 Ridgecrest Earthquakes. Nat. Geosci. 13 (10), 699–704. doi:10.1038/s41561-020-0628-8
Barnhart, W. D., Hayes, G. P., and Gold, R. D. (2019). The July 2019 Ridgecrest, California Earthquake Sequence: Kinematics of Slip and Stressing in Cross-Fault Ruptures. Geophys. Res. Lett. 46 (11), 859–911. doi:10.1029/2019gl084741
Brandenberg, S. J., Wang, P., Nweke, C. C., Hudson, K., Mazzoni, S., Bozorgnia, Y., et al. (2019). Preliminary Report on Engineering and Geological Effects of the July 2019 Ridgecrest Earthquake Sequence. Geotechnical Extreme Event Reconnaissance Association.
Chen, C. W. (2001). Statistical-cost Network-Flow Approaches to Two-Dimensional Phase Unwrapping for Radar Interferometry. America: The Department of Electrical Engineering, Stanford University.
Chen, C. W., and Zebker, H. A. (2001). Two-dimensional Phase Unwrapping with Use of Statistical Models for Cost Functions in Nonlinear Optimization. J. Opt. Soc. Am. A. 18, 338–351. doi:10.1364/josaa.18.000338
Chen, K. J., Avouac, J. P., Aati, S., Milliner, C., Zheng, F., and Shi, C. (2020). Cascading and Pulse-like Ruptures during the 2019 Ridgecrest Earthquakes in the Eastern California Shear Zone. Nat. Commun. 11, 22. doi:10.1038/s41467-019-13750-w
Davis, G. A., and Burchfiel, B. C. (1973). Garlock Fault: An Intracontinental Transform Structure, Southern California. Geol. Soc. America Bull. 84, 1407–1422. doi:10.1130/0016-7606(1973)84<1407:gfaits>2.0.co;2
Feng, W. P., Samsonov, S., Qiu, Q., Wang, Y. Q., Zhang, P. Z., Li, T., et al. (2020). Orthogonal Fault Rupture and Rapid Postseismic Deformation Following 2019 Ridgecrest, California, Earthquake Sequence Revealed from Geodetic Observations. Geophys. Res. Lett. 47, e2019GL086888. doi:10.1029/2019gl086888
Fialko, Y. (2004). Probing the Mechanical Properties of Seismically Active Crust with Space Geodesy: Study of the Coseismic Deformation Due to the 1992 M(w)7.3 Landers (Southern California) Earthquake. J. Geophys. Res-sol Ea 109, 1–19. doi:10.1029/2003jb002756
Fialko, Y., Sandwell, D., Agnew, D., Simons, M., Shearer, P., and Minster, B. (2002). Deformation on Nearby Faults Induced by the 1999 Hector Mine Earthquake. Science 297, 1858–1862. doi:10.1126/science.1074671
Fielding, E. J., Liu, Z., Stephenson, O. L., Zhong, M., Liang, C., Moore, A., et al. (2020). Surface Deformation Related to the 2019 Mw 7.1 and 6.4 Ridgecrest Earthquakes in California from GPS, SAR Interferometry, and SAR Pixel Offsets. Seismol Res. Lett. 91, 2035–2046. doi:10.1785/0220190302
Hauksson, E., Hutton, K., Kanamori, H., Jones, L., Mori, J., Hough, S., et al. (1995). Preliminary Report on the 1995 Ridgecrest Earthquake Sequence in Eastern California. Seismological Res. Lett. 66 (6), 54–60. doi:10.1785/gssrl.66.6.54
Jiang, H. J., Feng, G. C., Wang, T., and Bürgmann, R. (2017). Toward Full Exploitation of Coherent and Incoherent Information in Sentinel-1 TOPS Data for Retrieving Surface Displacement: Application to the 2016 Kumamoto (Japan) Earthquake. Geophys. Res. Lett. 44, 1758–1767.
Lin, G. (2020). Waveform Cross-Correlation Relocation and Focal Mechanisms for the 2019 Ridgecrest Earthquake Sequence. Seismol Res. Lett. 91, 2055–2061. doi:10.1785/0220190277
Liu, C., Lay, T., Brodsky, E. E., Dascher‐Cousineau, K., and Xiong, X. (2019). Coseismic Rupture Process of the Large 2019 Ridgecrest Earthquakes from Joint Inversion of Geodetic and Seismological Observations. Geophys. Res. Lett. 46, 11820–11829. doi:10.1029/2019gl084949
Ma, S.-P., Xu, X.-H., and Zhao, Y.-H. (2004). The Geo-DSCM System and its Application to the Deformation Measurement of Rock Materials. Int. J. Rock Mech. Mining Sci. 41, 411–412. doi:10.1016/j.ijrmms.2003.12.007
Marlon, D. R., Jing, C. N., Prithvi, T., Huang, Y. H., and Wei, S. J. (2020). Stress Changes on the Garlock Fault during and after the 2019 Ridgecrest Earthquake Sequence. Bull. Seismological Soc. America 110 (4), 1752–1764.
Milliner, C., and Donnellan, A. (2020). Using Daily Observations from Planet Labs Satellite Imagery to Separate the Surface Deformation between the 4 July Mw 6.4 Foreshock and 5 July Mw 7.1 Mainshock during the 2019 Ridgecrest Earthquake Sequence. Seismol Res. Lett. 91, 1986–1997. doi:10.1785/0220190271
Pathier, E., Fielding, E. J., Wright, T. J., Walker, R., Parsons, B. E., and Hensley, S. (2006). Displacement Field and Slip Distribution of the 2005 Kashmir Earthquake from SAR Imagery. Geophys. Res. Lett. 33, 29–46. doi:10.1029/2006gl027193
Peters, W. H., and Ranson, W. F. (1982). Digital Image Techniques in Experimental Stress Analysis. Opt. Eng. 21 (3), 427–431. doi:10.1117/12.7972925
Reid, H. F. (1910). The California Earthquake of April 18, 1906, 2. The Mechanics of the Earthquake. Washington. D. C: Carnegie Institution of Washington, 192.
Ross, Z. E., Idini, B., Jia, Z., Stephenson, O. L., Zhong, M., Wang, X., et al. (2019). Hierarchical Interlocked Orthogonal Faulting in the 2019 Ridgecrest Earthquake Sequence. Science 366, 346–351. doi:10.1126/science.aaz0109
Ruch, J., Wang, T., Xu, W. B., Hensch, M., and Jonsson, S. (2016). Oblique Rift Opening Revealed by Reoccurring Magma Injection in central Iceland. Nat. Commun. 7, 12352. doi:10.1038/ncomms12352
Sandwell, D. T., Sichoix, L., Agnew, D., Bock, Y., and Minster, J.-B. (2000). Near Real-Time Radar Interferometry of the Mw 7.1 Hector Mine Earthquake. Geophys. Res. Lett. 27, 3101–3104. doi:10.1029/1999gl011209
Schaefer, L. N., Wang, T., Escobar-Wolf, R., Oommen, T., Lu, Z., Kim, J., et al. (2017). Three-dimensional Displacements of a Large Volcano Flank Movement during the May 2010 Eruptions at Pacaya Volcano, Guatemala. Geophys. Res. Lett. 44, 135–142. doi:10.1002/2016gl071402
Shelly, D. R. (2020). A High-Resolution Seismic Catalog for the Initial 2019 Ridgecrest Earthquake Sequence: Foreshocks, Aftershocks, and Faulting Complexity. Seismol Res. Lett. 91, 1971–1978. doi:10.1785/0220190309
Surpless, B. (2008). Modern Strain Localization in the central Walker Lane, Western United States: Implications for the Evolution of Intraplate Deformation in Transtensional Settings. Tectonophysics 457, 239–253. doi:10.1016/j.tecto.2008.07.001
Unruh, J., and Humphrey, J. (2017). Seismogenic Deformation between the Sierran Microplate and Oregon Coast Block, California, USA. California, USA. Geology 45, 415–418. doi:10.1130/g38696.1
Wang, K., Dreger, D. S., Tinti, E., Bürgmann, R., and Taira, T. a. (2020). Rupture Process of the 2019 Ridgecrest, California Mw 6.4 Foreshock and Mw 7.1 Earthquake Constrained by Seismic and Geodetic Data. B Seismol Soc. Am. 110, 1603–1626. doi:10.1785/0120200108
Wang, T., Shi, Q., Nikkhoo, M., Wei, S., Barbot, S., Dreger, D., et al. (2018). The Rise, Collapse, and Compaction of Mt. Mantap from the 3 September 2017 North Korean Nuclear Test. Science 361, 166–170. doi:10.1126/science.aar7230
Wang, T., and Jonsson, S. (2015). Improved SAR Amplitude Image Offset Measurements for Deriving Three-Dimensional Coseismic Displacements. IEEE J. Sel. Top. Appl. Earth Observations Remote Sensing 8, 3271–3278. doi:10.1109/jstars.2014.2387865
Wang, X., and Zhan, Z. W. (2020). Seismotectonics and Fault Geometries of the 2019 Ridgecrest Sequence: Insight from Aftershock Moment Tensor Catalog Using 3-D Green's Functions. J. Geophys. Res-sol Ea 125, e2020JB019577. doi:10.1029/2020jb019577
Xu, X., Sandwell, D. T., and Smith-Konter, B. (2020a). Coseismic Displacements and Surface Fractures from Sentinel-1 InSAR: 2019 Ridgecrest Earthquakes. Seismol Res. Lett. 91, 1979–1985. doi:10.1785/0220190275
Xu, X., Sandwell, D. T., Ward, L. A., Milliner, C. W. D., Smith-Konter, B. R., Fang, P., et al. (2020b). Surface Deformation Associated with Fractures Near the 2019 Ridgecrest Earthquake Sequence. Science 370, 605–608. doi:10.1126/science.abd1690
Yamaguchi, I. (1981). A Laser-Speckle Strain Gauge. J. Phys. E: Sci. Instrum. 14, 1270–1273. doi:10.1088/0022-3735/14/11/012
Keywords: Ridgecrest earthquakes, small fractures, 3D coseismic displacement, earthquake cycle, Interferometric Synthetic Aperture Radar, uniaxial loading rock experiment
Citation: Xu A, Zhao Y, Wang T, Ren C and Yue H (2021) Small Fractures Caused by the 2019 Ridgecrest Earthquake Sequence: Insights From 3D Coseismic Displacement and Uniaxial Loading Rock Experiments. Front. Earth Sci. 9:672809. doi: 10.3389/feart.2021.672809
Received: 26 February 2021; Accepted: 14 May 2021;
Published: 04 June 2021.
Edited by:
Wanpeng Feng, Sun Yat-sen University, ChinaReviewed by:
Xiaohua Xu, University of California, United StatesCopyright © 2021 Xu, Zhao, Wang, Ren and Yue. This is an open-access article distributed under the terms of the Creative Commons Attribution License (CC BY). The use, distribution or reproduction in other forums is permitted, provided the original author(s) and the copyright owner(s) are credited and that the original publication in this journal is cited, in accordance with accepted academic practice. No use, distribution or reproduction is permitted which does not comply with these terms.
*Correspondence: Teng Wang, d2FuZy50ZW5nQHBrdS5lZHUuY24=
Disclaimer: All claims expressed in this article are solely those of the authors and do not necessarily represent those of their affiliated organizations, or those of the publisher, the editors and the reviewers. Any product that may be evaluated in this article or claim that may be made by its manufacturer is not guaranteed or endorsed by the publisher.
Research integrity at Frontiers
Learn more about the work of our research integrity team to safeguard the quality of each article we publish.