 Takao Kagawa
94% of researchers rate our articles as excellent or good
Learn more about the work of our research integrity team to safeguard the quality of each article we publish.
Find out more
ORIGINAL RESEARCH article
Front. Earth Sci. , 20 August 2021
Sec. Solid Earth Geophysics
Volume 9 - 2021 | https://doi.org/10.3389/feart.2021.672613
This article is part of the Research Topic The New Frontiers of Earthquake Early Warning Systems View all 22 articles
An application of the PLUM (Propagation of Local Undamped Motion) method to real-time seismic intensity distribution from a dense seismic intensity network maintained by a local government in Japan is demonstrated. The JMA (Japan Meteorological Agency) has employed the PLUM method from March 2018 as a supplement to the traditional EEW (Earthquake Early Warning) which requires hypocenter determination. A dense observation network is desirable for upgrading accuracy and immediateness of EEW including the PLUM method. Seismic intensity meters in Tottori Prefecture, Japan, are suitable for the purpose because they have been improved to broadcast packets with peak ground acceleration and JMA seismic intensity at every 1 s. Also, 34 seismic intensity meters are installed in the target area while only six observation sites are used for the EEW by the JMA. The packet data are received at Tottori University, and the modified PLUM method considers wave propagation with damping from not only the observation points but also all evaluating grid points at a 1 km mesh. Additionally, P-wave amplitudes in preliminary tremors are also introduced to estimate seismic intensities from an empirical relationship. Applying the methodology to past earthquake data, more detailed and rapid evaluations of seismic intensity distribution are achieved. We expect the system will be utilized for earthquake disaster mitigation measures of local governments.
Real-time shake map estimation using seismic intensity meters maintained by local governments in Japan has been enhanced. To improving the accuracy and rapidness of the EEW (Earthquake Early Warning), a dense observation network is desirable. Seismic intensity meters installed in all Japanese municipalities are the most suitable equipment for this purpose, since the station installation interval is less than 5 km in some areas. The seismic intensity meters in Tottori Prefecture have been upgraded to broadcast UDP (User Datagram Protocol) packets with peak ground acceleration and JMA (Japan Meteorological Agency) seismic intensity every second. At present, the system maintained by the prefecture is the only one that broadcasts such a packet. Figure 1 shows the location of Tottori Prefecture in Japan and the layout of the 34 seismic intensity meters maintained by the prefecture. The data are received at Tottori University, Japan, and the PLUM (Propagation of Local Undamped Motion) method (Hoshiba, 2013) is applied to the data for estimating JMA seismic intensity distribution at 1 km grid points. However, in case of the 2016 Central Tottori Prefecture Earthquake, Japan, with MJMA 6.6, the seismic intensities around the observation sites were overestimated to use as a reference for initial response to the disaster, since the seismic intensities are assumed to propagate without attenuation with emphasis on issuing earlier warning at the expense of accuracy.
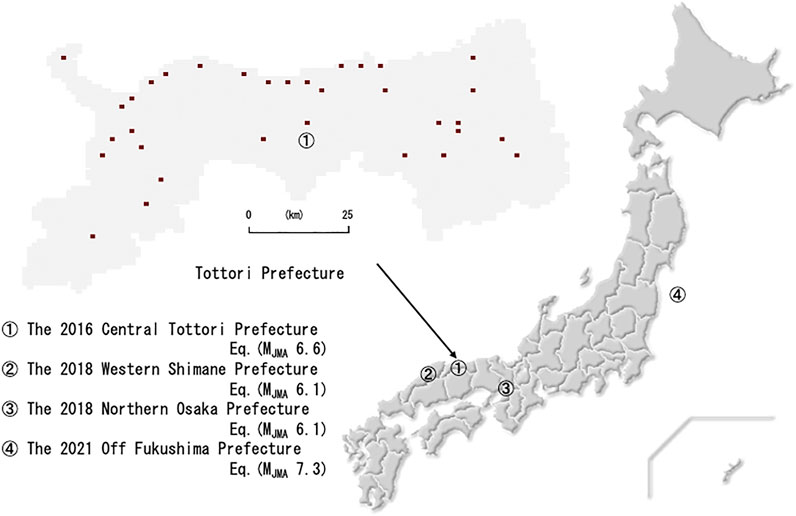
FIGURE 1. Location map of Tottori Prefecture in Japan and epicenters of earthquakes handled in this study and the distribution map of 34 seismic intensity meters maintained by Tottori Prefecture.
In this study, three additional methodologies are introduced into the system to obtain more realistic seismic intensity distribution. One is the introduction of attenuation in seismic intensity propagation from observed sites, and the other is the assumption of every 1 km grid point for seismic intensity estimation as a secondary source point (Kagawa, 2019). The third is the usage of vertical P-wave amplitudes for seismic intensity estimation (Ueda et al., 2009). Using the methodologies, seismic intensity distributions with improved accuracy and rapidness are demonstrated. Although there are some issues such as underestimation due to the bias of the observation point arrangement, it is possible to provide generally good seismic intensity distribution in real time.
We have improved the local seismic intensity meters in Tottori Prefecture so that they could send 1 s packets of peak ground acceleration and JMA seismic intensity. Since seismographs operated by local governments are used for disaster prevention purposes such as breaking news of seismic intensities immediately after an earthquake, improvements should not bother their operations. For this reason, we decided to transmit only real-time seismic intensity calculated on site and the maximum horizontal and vertical accelerations on the UDP. The seismic intensity is evaluated from 2 s data that start 1 s earlier. Data from 34 sites (Figure 1) are received at Tottori University via the Tottori Prefecture Information Highway, main line 10 Gbps and access point 1 Gbps, and when the vertical acceleration exceeds 1 cm/s2, and output files with timestamp and site number are generated. There are far more seismographs available in Tottori Prefecture than the six points of JMA observation points for EEW purpose, so it is expected that the accuracy and rapidness will be improved.
In this study, the dataset due to the 2016 Central Tottori Prefecture Earthquake is used as a sample data. The epicenter location is indicated in Figure 1. All local seismic intensity meters have operated without problems while delivering 1 s packets mentioned above, have saved waveform records, and have stably transmitted many aftershock data. However, the system to receive the packets and to visualize the results was not completed at the time of the event, so 1 s packets used in this study were reproduced from the observed waveforms.
First, we tried to apply the PLUM (Propagation of Local Undamped Motion) method (Hoshiba, 2013), which is employed in EEW operation by the JMA. Seismic intensity estimation by the PLUM method is shown in the following equation:
Here, I (r, t) is the estimated seismic intensity at time t and point r, ri is the location of the ith seismic intensity meter, and Foi is the site amplification estimated from AVS30 at the point (Midorikawa et al., 1994). Amplification at each estimating point in a 1 km grid is given from a dataset that was used for the earthquake damage estimation project of Tottori Prefecture (Tottori Prefecture, 2018), but the data are based on the national AVS30 distribution database provided by the J-SHIS map by the NIED (National Research Institute for Earth Science and Disaster Resilience, 2019). Assuming V0 as the S-wave velocity and T as the lead time for estimation, i.e., how much the future is predicted from the present time, the maximum seismic intensity that can be propagated from the observation site within the distance range of V0T is estimated considering time delay and site amplification. In this study, V0 = 4.0 km/s is used as a standard upper crustal S-wave velocity in the area, and lead time T = 4 s is assumed to cover the delay due to data transmission and data analyses. As a result, the maximum applicable distance for seismic intensity propagation is 16 km that corresponds to an averaged spacing of seismic intensity meters.
Figure 2 shows a final seismic intensity distribution of the 2016 Central Tottori Prefecture Earthquake (MJMA 6.6) with maximum values preserved. The maximum JMA seismic intensity observed was six lower, and the damage was spot limited. Figure 3 shows the seismic intensity distribution interpolated by the JMA considering the site amplification factor at each estimating point. The points with JMA seismic intensity six lower are limited, and seismic intensity four does not cover almost the whole prefecture area. The distribution by the PLUM method is overestimated; however it is unavoidable since it treats wave propagation as undamped.

FIGURE 2. Final seismic intensity distribution of the 2016 Central Tottori Prefecture Earthquake by the PLUM method with maximum values preserved.
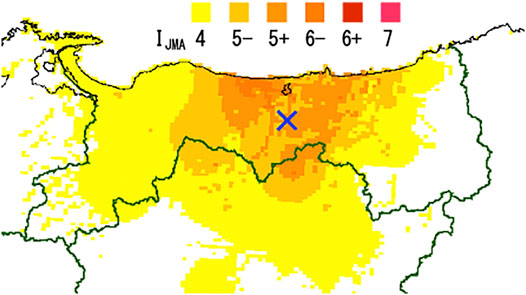
FIGURE 3. Seismic intensity distribution of the 2016 Central Tottori Prefecture Earthquake interpolated by the JMA considering the site amplification factor (modified from the Japan Meteorological Agency, 2016b).
The PLUM method employs undamped propagation since it prioritizes quickness to broadcast EEW at the expense of some accuracy of seismic intensity distribution. Our purpose is to monitor the seismic intensity distribution more accurately and utilize it for the disaster mitigation response immediately after the earthquake, which is a little different from the concept of the PLUM method.
Attenuation (damping) is introduced into wave propagation to estimate more accurate seismic intensity distribution. In addition, all estimation points are considered as secondary sources that generate attenuating waves with the maximum value at the observation point. The following equation explains the methodology:
Here, rk is the location of the kth estimating point in 1 km grids and Fok is the site amplification there. In the previous equation of the PLUM method, the maximum seismic intensity is selected from observation points ri that satisfy the distance condition within V0T. On the contrary, the proposed method searches the maximum value from all 1 km grid points rk around the target point r. If the kth grid point is the same as an observation point, estimation is updated with observed data like data assimilation of several-hour weather forecasting. The third term of the equation including a parameter α indicates attenuation. The damping parameter α is adjusted as 0.1 through trial and error. It means that JMA seismic intensity decreases 1.0 with distance 10 km. The result might be almost the same as the ground-motion–based EEW (i.e., Hoshiba and Aoki, 2015), but the methodology is simpler and values at the observation sites are assimilated every 1 s.
Figure 4 shows demonstrations of seismic intensity propagation from a single observation site without considering site amplification. The left column indicates the result by the PLUM method. At 14:07:28, three different observed values are propagated without attenuation, and it draws three circles with radius of 4, 8, and 12 km and is saturated with a seismic intensity of six lower as the maximum observed seismic intensity at the site in the bottom panel with a radius of 16 km (V0T). The timestamp in the bottom panel indicates 40 s, but it was saturated at 14:07:33 in reality. The right column shows the result by the proposed method. The seismic intensity distribution at 14:07:28 is slightly attenuated, and it propagates with attenuation farther than that of the PLUM method. It is because every grid point works as a secondary source point. Different color scales comparing the previous figures are used here to see the distribution of small seismic intensity.
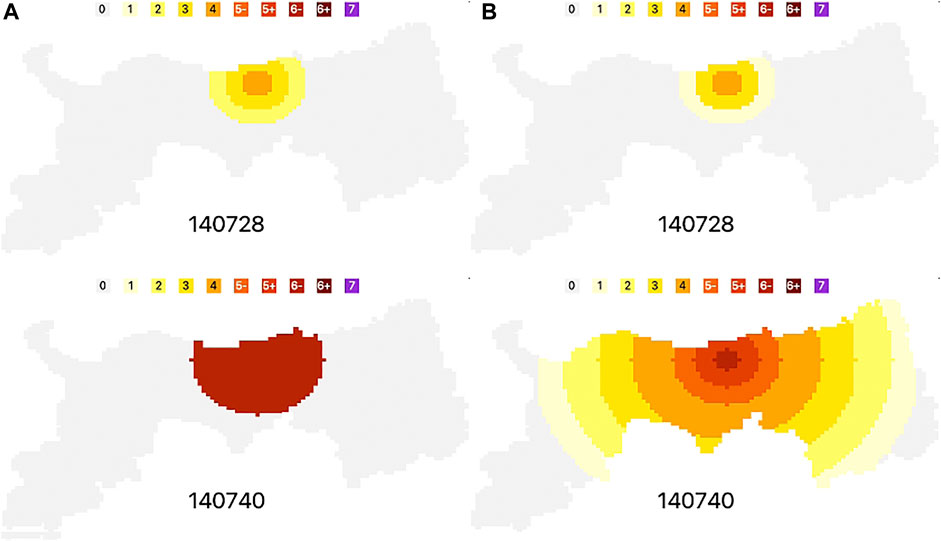
FIGURE 4. Demonstration of seismic intensity propagation from a single observation site without site amplification: (A) PLUM method; (B) proposed method.
Figure 5 shows an application to the 2016 Central Tottori Prefecture Earthquake. The final distribution of JMA seismic intensity agrees well with the interpolated distribution by the JMA in Figure 3. The intensity six lower appears as spot limited in the coastal area, and the border of intensity four is almost the same as the JMA interpolation. However, intensity five lower is smaller than the JMA interpolation, especially in the southern and western part from the source area. It is because there are few observation points maintained by Tottori Prefecture (Figure 1). The seismic intensity meters are installed mainly at town halls in populated areas. They are not installed in mountain regions around prefecture borders. Moreover, JMA and NIED seismographs are used as substitutes for urban areas with large population to complement the seismic intensity distribution in Tottori Prefecture, but they are not included in the 34 sites used for this study.
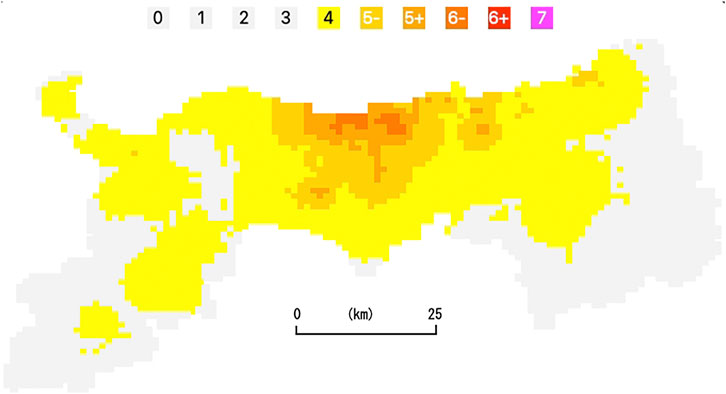
FIGURE 5. Same as Figure 2 but after introducing attenuation and secondary source points.
In order to quantitatively evaluate the results of the PLUM method and the proposed method, we compared the estimated results at observation points other than the 34 points used in this study. They are six JMA, nine K-NET, and six KiK-net sites maintained by the NIED. The left and right panels in Figure 6 show the results of the PLUM method and the proposed method, respectively. The horizontal axis indicates the observed JMA seismic intensities, and the vertical axis shows the estimated values. In the panels, approximate linear lines of intercept zero are shown with their inclination and correlation coefficients. It is clear that the PLUM method is overestimated but the proposed method is almost valid.
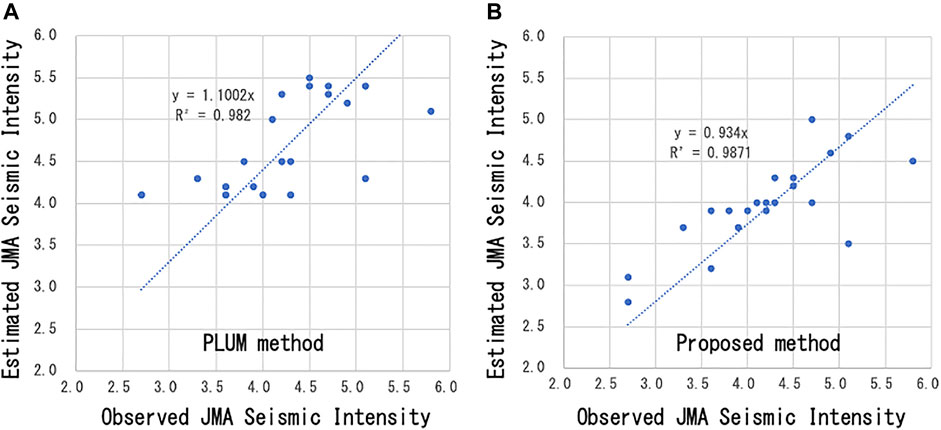
FIGURE 6. Comparison between the observed and estimated JMA seismic intensities at the sites that are maintained by other organizations: (A) PLUM method; (B) proposed method.
Figure 7 shows the examples of trial and error to obtain proper attenuation parameter α = 0.1. Comparing the results with the case in Figure 5, it is found that smaller attenuation case (α = 0.05) results in slight overestimation, and larger attenuation (α = 0.2) shows underestimation. The operational parameter α = 0.1 was determined through these checks, although it has not been sufficiently quantitatively examined.
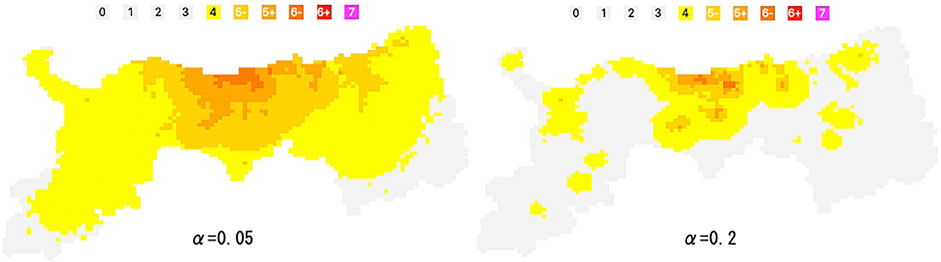
FIGURE 7. Comparison of results with varying attenuation parameter α from the case of α = 0.1 in Figure 5.
For the next approach, P-wave amplitudes are introduced for seismic intensity estimation. The 1 s packets from seismic intensity meters include maximum accelerations of horizontal and vertical components. In case that vertical acceleration is larger than the horizontal one, empirical estimation of JMA seismic intensity from P-wave amplitude (Ueda et al., 2009) is calculated, and the value is employed if it is larger than real-time seismic intensity observed at the time. The relationship is shown in Figure 8 and the following equation (Ueda et al., 2009). They used 1,570 data at 124 sites due to 55 events including the main and aftershocks of the Mid Niigata Prefecture Earthquake in 2004 (MJMA 6.8) and the Iwate-Miyagi Nairiku Earthquake in 2008 (MJMA 7.2). The following equation is derived from least-squares approximation:
where IJMA is the JMA seismic intensity and PGAP is the peak ground acceleration of the vertical P wave. Both show a good correlation, but the number of data are not enough in large amplitude range. In this study, the maximum seismic intensity estimated from P-wave amplitude is set for 4.5 as shown in Figure 8.
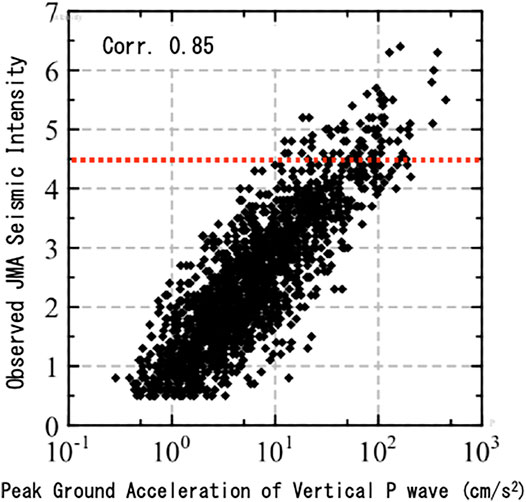
FIGURE 8. Relationship between peak ground accelerations of the vertical P wave and observed seismic intensities (modified from Ueda et al., 2009).
The methodology mentioned above is applied for the 2016 Central Tottori Prefecture Earthquake. Figure 9 shows the result under the same condition as in Figures 2, 5. The results are almost same in their final seismic intensity distributions. The most expecting advantage for using P-wave amplitude is its rapidness of estimation. Figure 10 shows the comparison of snapshots between estimation with the P wave in the right column and without the P wave in the left column. Time 14:07:28 of the upper line panels is the timing when the first forecast-type EEW by the JMA (Japan Meteorological Agency, 2016a) was broadcasted, and warning-type EEW on the third forecast was broadcasted for general public at time 14:07:36 of the lower line panels. Both columns show the possibility that we can grasp realistic seismic intensity distribution as the same or faster than current EEW in case we use the data from a denser network.
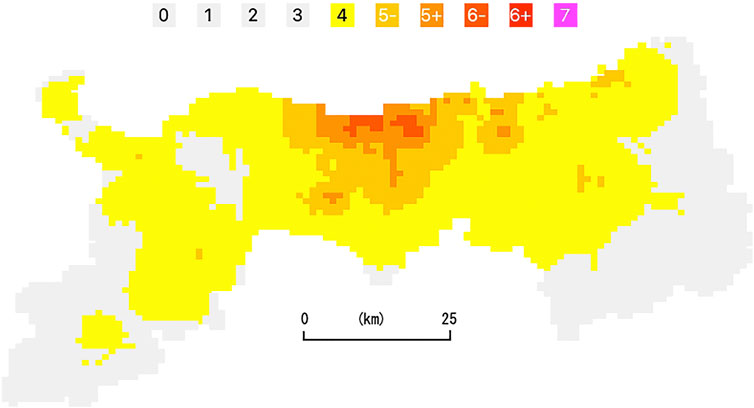
FIGURE 9. Same as Figure 5 but after introducing estimation from P-wave amplitude.
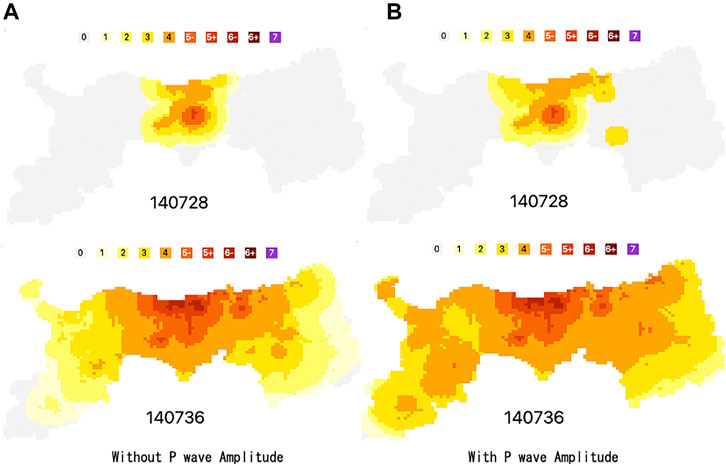
FIGURE 10. Snapshots of real-time estimated seismic intensity distributions of the 2016 Central Tottori Prefecture Earthquake: estimation with the P wave (A) and without the P wave (B).
Estimation with the P wave shows faster propagation of large seismic intensity area than that without the P wave. However, the final estimated distribution with P wave amplitude is almost the same as that without the P wave, as compared between Figures 5, 9. The right bottom panel of Figure 10 corresponds to Figure 9. Note that the color scale is changed from the previous figures to grasp the situation of small seismic intensity. The scale is applied for the following figures.
Applications for other earthquakes are shown in this section, since the proposed methodology was found to be effective but only for a single near-field earthquake. The location of the additionally handled earthquakes is shown in Figure 1.
Figure 11 shows the estimated snapshot of JMA seismic intensity distribution due to the 2018 Western Shimane Prefecture Earthquake (MJMA 6.1) on April 9 01:32. The shortest epicentral distance was about 50 km from the western prefecture border. Estimation with the P wave shows faster propagation of large seismic intensity area the same as the 2016 Central Tottori Prefecture case in Figure 10. Figure 12 shows the seismic intensity distribution interpolated by the JMA, but the color scale is slightly different from that of the previous figures. The largest JMA seismic intensity observed in the western part of the prefecture was 4 as estimated. Although a little overestimation is seen in large intensity area at southwest of the prefecture, the seismic intensity distribution is generally practical. A little underestimation is also noticed along the Yumigahama Peninsula indicated in Figure 12. The reason is considered to be the lack of observation points in the area, see Figure 1.
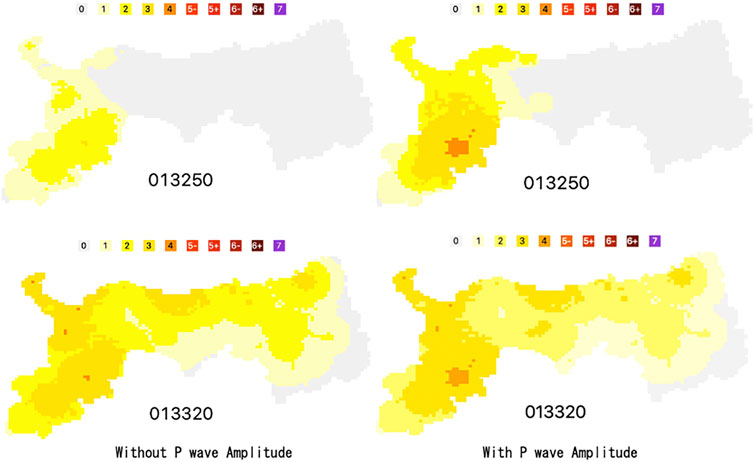
FIGURE 11. Same as Figure 10 but for the 2018 Western Shimane Prefecture Earthquake.
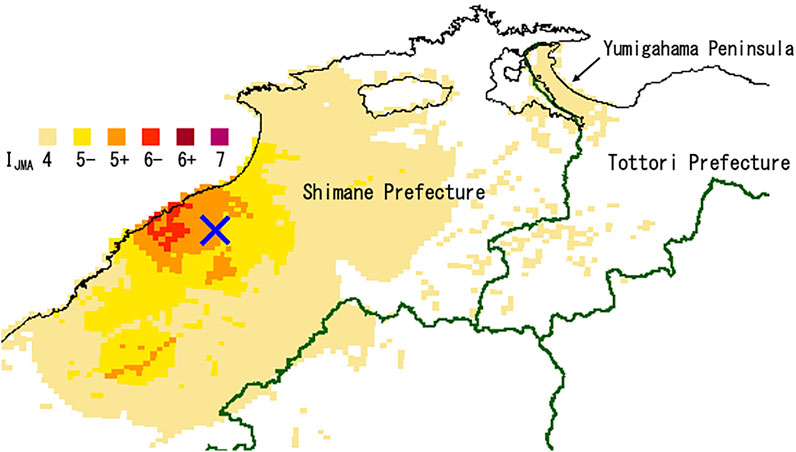
FIGURE 12. Seismic intensity distribution of the 2018 Western Shimane Prefecture Earthquake interpolated by the JMA considering the site amplification factor (modified from the Japan Meteorological Agency, 2018).
Figure 13 is the result of the 2018 Northern Osaka Prefecture Earthquake (MJMA 6.1) on June 18 07:58. The shortest epicentral distance at the southeast prefecture border was about 150 km, and the largest JMA seismic intensity observed in the eastern part of the prefecture was 3, but 4 is estimated at the coastal area in eastern part in both cases. It is caused by large amplification around the site where intensity 3 was observed. The effects of P-wave amplitudes are noticed in limited areas along the coast in central part. It is because high-frequency amplitude in P-wave acceleration is not large for slightly long-distance earthquake. Unfortunately, the area is out of the range of seismic intensity distribution map published by the JMA because the target of the map is the range of JMA seismic intensity four or higher.
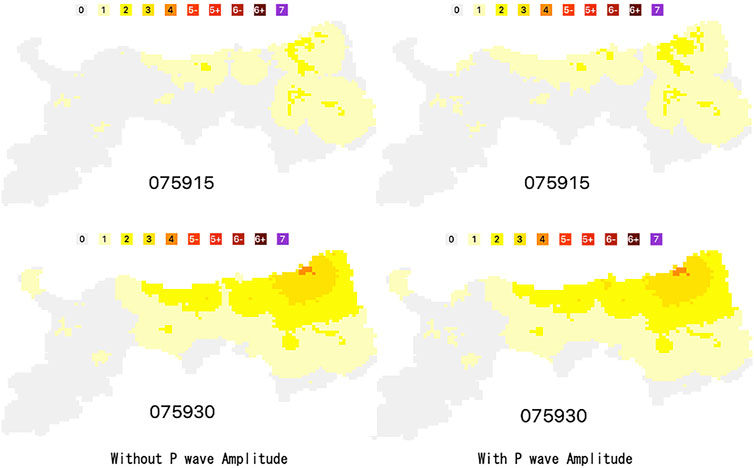
FIGURE 13. Same as Figure 10 but for the 2018 Northern Osaka Prefecture Earthquake.
Finally, a case of long-distance earthquake is shown in Figure 14, but only for the final distributions. The source is the 2021 Off Fukushima Prefecture Earthquake (MJMA7.3) on February 13 23:07. The epicentral distance is about 750 km east, and the maximum observed JMA seismic intensity was 1. They were observed at a soft ground area in the eastern, central, and western part of the prefecture, as estimated in Figure 14. Estimation from P-wave amplitude does not work on this case, and the two panels are the same. It is also because of small acceleration due to the long-distance earthquake. The area is also out of the range of the seismic intensity distribution map by the JMA.
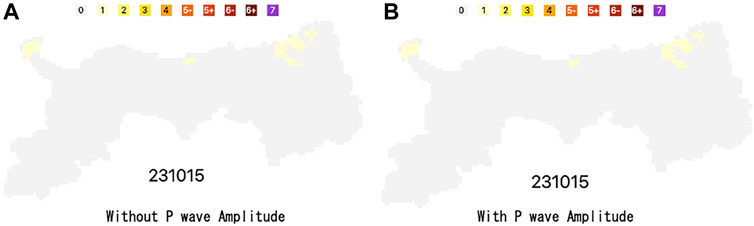
FIGURE 14. Final seismic intensity distribution of the 2021 Off Fukushima Prefecture Earthquake estimation with the P wave (A) and without the P wave (B).
Four different types of earthquakes are treated in this study. The first is a near-field event that caused a disaster in Tottori Prefecture, the second is a disaster earthquake occurred in the neighboring prefecture, the third is a slightly long-distance event in the range of 150 km, and the fourth is a long-distance large earthquake with an epicentral distance of 750 km. Althrough they are limited cases, the proposed method seems to work well through the examinations so far.
It is being planned to install the methodology in a web-based display system, and its results will be provided for municipal crisis management for immediate response to earthquake disaster. We would like to make improvements any time as a problem arises.
Real-time seismic intensity estimation is established using seismic intensity meters maintained by local governments in Japan. The 34 seismic intensity meters of Tottori Prefecture were improved to broadcast 1 s packets with real-time peak ground acceleration and JMA seismic intensity. The modified PLUM method introduces wave attenuation from all estimation points in a 1 km grid as secondary sources. Vertical P-wave amplitude is also considered for intensity estimation. The methodologies were applied for four different types of earthquakes with epicentral distance 0–750 km and JMA magnitude range 6.1–7.3. The results were practical enough to estimate almost the same intensity distribution provided by the JMA after the earthquakes. Also, the estimations are expected to be faster than those of EEW by the JMA since denser seismograph network is employed for the proposed system. We hope that such real-time seismic intensity estimations would be widely constructed using next-generation seismic intensity meters.
The raw data supporting the conclusion of this article will be made available by the authors, without undue reservation.
The author confirms being the sole contributor of this work and has approved it for publication.
This study was supported by the Ministry of Education, Culture, Sports, Science, and Technology (MEXT) of Japan, under its Earthquake and Volcano Hazards Observation and Research Program.
The author declares that the research was conducted in the absence of any commercial or financial relationships that could be construed as a potential conflict of interest.
All claims expressed in this article are solely those of the authors and do not necessarily represent those of their affiliated organizations, or those of the publisher, the editors, and the reviewers. Any product that may be evaluated in this article, or claim that may be made by its manufacturer, is not guaranteed or endorsed by the publisher.
The author is genuinely grateful to the crisis management bureau, Tottori Prefecture, for the permission to improve their seismic intensity meters and to Takamizawa Cybernetics Co., Ltd. for the development of the 1 s packet transmission function.
Hoshiba, M., and Aoki, S. (2015). Numerical Shake Prediction for Earthquake Early Warning: Data Assimilation, Real‐Time Shake Mapping, and Simulation of Wave Propagation. Bull. Seismological Soc. America 105 (No. 3), 1324–1338. doi:10.1785/0120140280
Hoshiba, M. (2013). Real-Time Prediction of Ground Motion by Kirchhoff-Fresnel Boundary Integral Equation Method: Extended Front Detection Method for Earthquake Early Warning. J. Geophys. Res. Solid Earth 118, 1038–1050. doi:10.1002/jgrb.50119
Japan Meteorological Agency (2016b). Contents of Earthquake Early Warning of the 2016 Central Tottori Prefecture Earthquake. (in Japanese) Available at: https://www.data.jma.go.jp/svd/eew/data/nc/pub_hist/2016/10/20161021140724/content/content_out.html.
Japan Meteorological Agency (2016a). Estimated Seismic Intensity Distribution Map of the 2016 Central Tottori Prefecture Earthquake. (in Japanese). Available at: https://www.data.jma.go.jp/svd/eew/data/suikei/201610211407_562/201610211407_562_1.html.
Japan Meteorological Agency (2018). Estimated Seismic Intensity Distribution Map of the 2018 Western Shimane Prefecture Earthquake. (in Japanese). Available at: https://www.data.jma.go.jp/svd/eew/data/suikei/201804090132_571/201804090132_571_2.html.
Kagawa, T. (2019). An Approach for Monitoring Real Time Seismic Intensity Distribution Using Seismic Intensity Network Maintained by Local Government - Case Study on Tottori Prefecture -. J. Jpn. Soc. Civil Eng. Ser. A1 75 (No. 4), I_674–I_677. (in Japanese with English Abstract). doi:10.2208/jscejseee.75.i_674
Midorikawa, S., Matsuoka, M., and Sakugawa, K. (1994). Site Effects on Strong Motion Records Observed during the 1987 Chiba-Ken-Toho-Oki. 9th Japan Earthquake Engineering Symposium, Japan Earthquake.
National Research Institute for Earth Science and Disaster Resilience (2019). Data Download Page of Site Amplification Factor. Available at: https://www.j-shis.bosai.go.jp/map/JSHIS2/download.html?lang=en.
Tottori Prefecture (2018). Tottori Prefecture Earthquake Disaster Prevention Survey Research Report. (in Japanese).
Keywords: real-time monitoring, seismic intensity network, PLUM method, attenuation, Tottori Prefecture
Citation: Kagawa T (2021) Application of the Modified PLUM Method to a Dense Seismic Intensity Network of a Local Government in Japan: A Case Study on Tottori Prefecture. Front. Earth Sci. 9:672613. doi: 10.3389/feart.2021.672613
Received: 26 February 2021; Accepted: 28 July 2021;
Published: 20 August 2021.
Edited by:
Simona Colombelli, University of Naples Federico II, ItalyReviewed by:
Masanori Kameyama, Ehime University, JapanCopyright © 2021 Kagawa. This is an open-access article distributed under the terms of the Creative Commons Attribution License (CC BY). The use, distribution or reproduction in other forums is permitted, provided the original author(s) and the copyright owner(s) are credited and that the original publication in this journal is cited, in accordance with accepted academic practice. No use, distribution or reproduction is permitted which does not comply with these terms.
*Correspondence: Takao Kagawa, kagawa@tottori-u.ac.jp
Disclaimer: All claims expressed in this article are solely those of the authors and do not necessarily represent those of their affiliated organizations, or those of the publisher, the editors and the reviewers. Any product that may be evaluated in this article or claim that may be made by its manufacturer is not guaranteed or endorsed by the publisher.
Research integrity at Frontiers
Learn more about the work of our research integrity team to safeguard the quality of each article we publish.