 Alicja Caputa
 Łukasz Rudziński1
 Simone Cesca
94% of researchers rate our articles as excellent or good
Learn more about the work of our research integrity team to safeguard the quality of each article we publish.
Find out more
ORIGINAL RESEARCH article
Front. Earth Sci., 14 July 2021
Sec. Geohazards and Georisks
Volume 9 - 2021 | https://doi.org/10.3389/feart.2021.671207
This article is part of the Research TopicAdvances in Monitoring, Modeling and Managing Induced SeismicityView all 11 articles
Underground exploitation of georesources can be highly correlated with induced seismic activity. In order to reduce the risk and improve the mining operations safety, the mining activity is monitored by a dedicated seismic network. Moment tensor inversion is a powerful method to investigate the rupture process of earthquakes in mines, providing information on the geometry of the earthquake source and the moment release. Different approaches have been proposed to estimate the source mechanisms, with some advantages and limitations. One of the simplest and most used methods rely on the fit of the polarity and amplitude of first P wave onsets. More advanced techniques fit the full waveforms and their spectra. Here, we test and compare moment tensor and focal mechanism estimations for both inversion techniques. In order to assess the inversion resolution, we built realistic synthetic data, accounting for real seismic noise conditions and network geometry for the Rudna copper mine, SW Poland. The Rudna mine pertains to the Legnica-Glógow Copper District, where thousands of mining induced earthquakes are detected yearly, representing a serious hazard for miners and mining infrastructures. We simulate a range of different processes and locations, considering pure double couple, deviatoric and full moment tensors with different magnitudes and located in different mining panels. Results show that the P-wave first onset inversion is very sensitive to the geometry of the seismic network, which is limited by the existing underground infrastructure. On the other hand, the quality of the moment tensor solutions for the full waveform inversion is mainly determined by the strength of mining tremor and the signal-to-noize ratio. We discuss the performance of both inversion techniques and provide recommendations toward a reliable moment tensor analysis in mines.
Seismicity induced by mining is considered to accounts for ∼37% of all human-induced earthquakes (Wilson et al., 2017). Mining operations were responsible for some of the strongest and most destructive anthropogenic earthquakes, such as the M 5.2 earthquake at the Klerksdorp mining district, South Africa (Fernandez and Van der Heever, 1984), the M 5.4 event occurred at the Ernst Thaelmann Potash Mine, Germany (McGarr et al., 2002), or the tragic collapses occurred at the Crandall Canyon Mine, Utah (Dreger et al., 2008) and Rudna Copper Mine, Poland (Lasocki et al., 2017).
Seismic activity in mining regions are monitored with a broad variety of seismic networks, including installations within mining tunnels and underground facilities. Even though, sensors are located relatively close to the seismic sources, the network geometry is strongly dependent on the underground infrastructures. An underground network is also operated at the Rudna Copper Mine, southern Poland (Figure 1). The mine is part of the Legnica–Głogów Copper District (LGCD) together with Polkowice-Sieroszowice and Lubin Mines. In LGCD area rich copper deposits are located approximately 1 km below the surface. Since the very beginning of mining operations (early 70s of the XX century), the LGCD area has been affected by high seismicity rate, associated with rockbursts hazard. More than 2,000 events with magnitude between 0.8 and 4.5 are observed in the region every year (Lasocki, 2005; Rudziński and Dineva, 2017). Detailed monitoring and seismic source analysis provide valuable information for the evaluation of risk and related hazard. The in-mine monitoring is mainly used for events localization and energy/magnitude estimation. Seismological studies further use these data to infer source mechanisms of largest mining tremors, to characterize the fault plane geometry, the rupture process and the stresses acting inside the rock mass (Lizurek and Wiejacz, 2011; Rudziński et al., 2016; Caputa and Rudziński, 2019). Unfortunately, the limited network geometry and signal clipping can limit the performance of such analysis (Caputa et al., 2015).
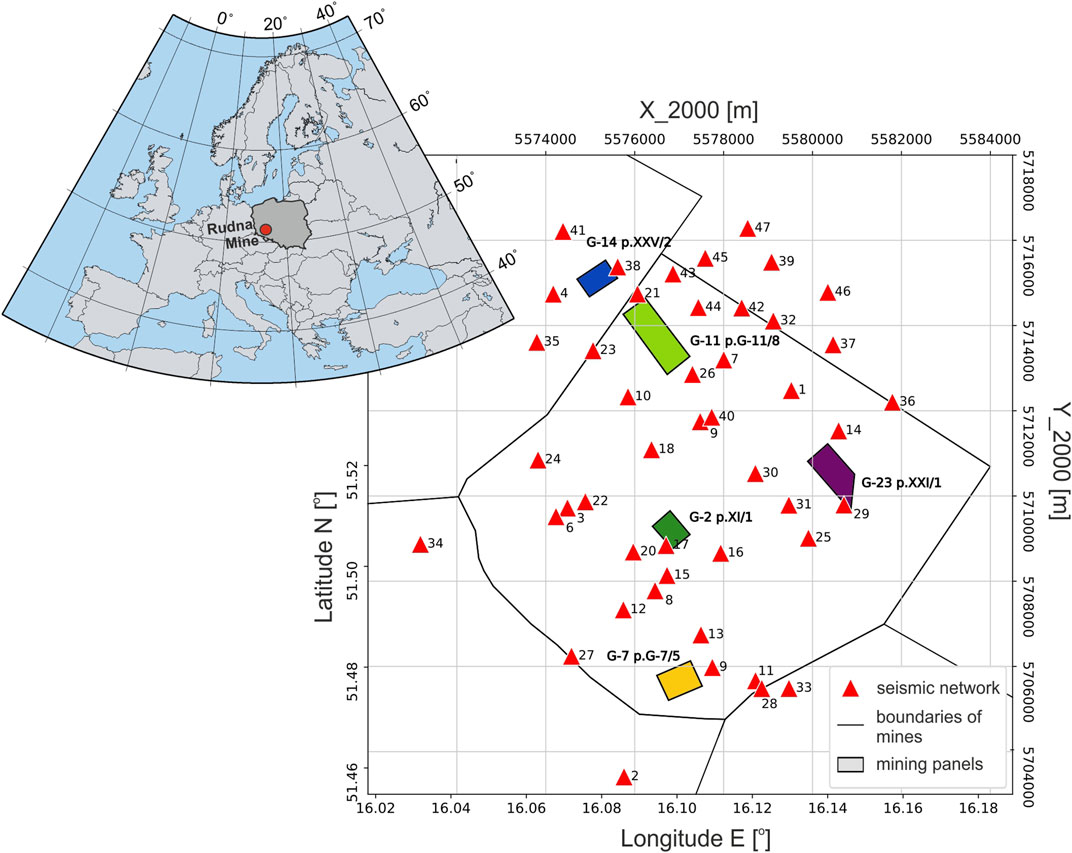
FIGURE 1. Map of Rudna mine seismic monitoring system and location of analyzed mining panels. Five panels are selected for comparison, and plotted with different colors, as referenced in the result section. Short period seismometers of the in-mine monitoring are marked by triangles and numbered. The upper left inset shows the location of the mine (red circle).
The purpose of this work is to precisely test full waveform and P-wave first onset inversions in the conditions of a real underground seismic monitoring system. Tests were set in order to determine the limitations and/or strengths of both methods in non-routine seismic analysis of mining induced seismicity. In this study we focus on the influence of the network geometry toward the estimation of source mechanisms. Our work is based on synthetic tests of various non double couple (non-DC) and double couple (DC) sources located in mining panels with active exploitation placed in different parts of Rudna mine.
First studies concerning source mechanism induced in mines have shown that mining events are similar to natural earthquakes (e.g., McGarr, 1971; Spottiswoode and McGarr, 1975; Potgieter and Roering, 1984). However, further analysis concluded that, while tectonic earthquakes are typically occurring as shear failures, mining-induced events can be the result of a variety of rupture processes. Hasegawa et al. (1989) proposed different types of failures, which can occur in underground mines. Besides shear faulting, described by DC source models, other process such as roof collapse, outburst and pillar burst are considered, and their model discussed. These processes are modeled including non-DC source components. Consequently, a robust identification of non-DC source terms is of great importance toward the safety of mining operations, as these processes are often accompanied or followed by tunnel damages. Mining seismicity source investigations have been performed at several underground mines, and for different geological conditions (e.g., Spottiswoode and McGarr, 1975; McGarr, 1992; Vavryčuk, 2001; Trifu, 2002; Šílený and Milev, 2006; Lizurek and Wiejacz, 2011; Stec and Drzewiecki, 2012; Vavryčuk and Kühn, 2012). Since non-DC components are often found in mines, mining seismicity source mechanisms are usually described by a full moment tensor (MT) which is the representation of nine equivalent force couples under a point source approximation (Aki and Richards, 2002). The MT is a symmetric tensor, with six independent components. The MT can be decomposed into an isotropic (ISO) and a deviatoric part. The deviatoric terms is often further decomposed into a DC and a compensated linear vector dipole (CLVD). While the isotropic term provides a measure of the volume change, e.g., in the case of a collapse, the deviatoric term and its decomposition can be used to describe other source models, including those proposed by Hasegawa et al. (1989), with high CLVDs. Such non-DC mechanisms have been observed in different mines, including South African gold mines (McGarr 1992; Šílený and Milev 2008), in coal mines in US (Arabasz and Pechmann, 2001; Bowers and Walter, 2002; Dreger et al., 2008), in China (Li et al., 2007; Ma et al., 2019, 2018b) and also in Polish underground coal and copper mines (Stec and Drzewiecki, 2012; Dubiński, 2013; Rudziński et al., 2016; Caputa and Rudziński, 2019; Rudziński et al., 2019).
The MT is obtained by solving an inverse problem, in which six independent MT components are obtained by fitting a range of seismic observations. Several approaches have been proposed, based on the fit of body waves polarities and/or amplitudes (Fitch et al., 1980; Bergman and Solomon, 1985; Wiejacz, 1991; Trifu et al., 2000; Vavryčuk, 2001; Hardebeck and Shearer, 2003; Zhu and Ben-Zion, 2013) surface waves (Kanamori and Given, 1981; Hong and Kanamori, 1995; Bukchin et al., 2010) or full waveform in the time and/or frequency domain (Dreger, 2003; Fletcher and McGarr, 2005; Šílený and Milev, 2006; Fichtner et al., 2008; Vavryčuk and Kühn, 2012; Cesca et al., 2013)
At the Rudna mine, the MT inversion has been done so far based on the amplitude and polarization of the P-wave first onset (Gibowicz and Kijko, 1994; Kwiatek et al., 2016), thus using only a short duration, initial part of the seismic signal. This enables to use also close stations for the MT inversion. At the same time clipped records from closest seismometers are useless in full waveform inversion approaches (Rudziński et al., 2016; Rudziński et al., 2017). In this work, we compare the performance of a method based on P wave arrivals, similar to the one in use at the Rudna mine, and a full waveform approach.
The first P-wave arrivals inversion approach relies on the method developed by Fitch et al. (1980) described by Wiejacz (1991) and implemented in the FOCI MT software (Kwiatek et al., 2016). The input information for this method is the integral of the first pulse (half-period) of the P wave, the area below the P wave onset. The misfit between observed and theoretical P wave first motion amplitudes is represented as a normalized root-mean-square (RMS) fitting error,. The moment tensor is calculated using a minimum of 6 observations (i.e. first P-wave arrivals). The method allows for the determination of a simple shear model (i.e. DC constraint), as well as a full MT solution. It has been suggested that the resolution of time domain P-wave first arrivals can be strongly affected by a poor azimuthal coverage and velocity model accuracy (Cesca and Grigoli, 2015; Lizurek, 2017; Ma et al., 2018a).
The second approach used in our study is a full waveform inversion (FW). In general, a FW consists in determining the focal mechanism based on the fitting of real waveforms with full synthetic signals generated on the basis of the Green’s functions. An important limitation of the full waveform inversion in the time domain is its sensitivity to errors and inaccuracies of the adopted velocity model. These limitations can especially affect low-energy earthquakes, where the wavelengths are shorter than the size of the heterogeneities of the geological medium (Cesca et al., 2006). Induced seismicity is mostly characterized by low magnitudes and high frequency signals, what may result in a reduction of solutions quality. The inversion approach used in this work is based on the KIWI Tools software (http://kinherd.org; Heimann, 2011). Kiwi performs a point source inversion in two steps, first in the frequency domain, fitting full waveform amplitude spectra, and then in the time domain, fitting the corresponding full waveforms (Cesca et al., 2010; Cesca et al., 2013). The frequency domain approach has shown to be less dependent on the velocity model and network geometry (Cesca et al., 2006; Domingues et al., 2013; Sen et al., 2013). We further perform additional inversions, assuming perturbed velocity models, to test the stability of the FW results. At Rudna mine, seismograms clipping at stations closest to the hypocenter can reduce the amount of available data, a general problem for in-mine networks.
The underground Rudna’s monitoring system (Figure 1) consists of 47 short period, vertical Willmore MkIII sensors and works as a seismic network with dynamic range around 66 dB (Koziarz and Szłapka, 2010). The sensors are located mainly at the deposit level, with an average depth of 800 m below the ground. Four sensors are also located in the middle of the shafts. However, these are typically not useful due to the very high noise level; thus, we do not consider them in this work. The network monitors more than 100 panels under exploitation and already mined out, with substantial differences in terms of azimuthal coverage (Figure 1).
To support our investigation, we developed a testing framework, which can be used to assess the performance of selected techniques (López-Comino et al., 2017); this is achieved by computing a broad synthetic dataset, which includes both a catalog of synthetic earthquakes and the corresponding synthetic waveforms. We consider both DC and non-DC source models, and choose locations within five selected mining panels with various azimuthal coverage (Figure 1). We also consider synthetic earthquakes with different magnitudes, ranging between Mw 1.0 and 4.0. The resulting catalog of 375 earthquakes pretends to simulating realistic mining earthquakes and contains two groups of events (Table 1): the first group consists of pure shear sources with three different fault plane configurations DC1: 190/45/89, DC2: 105/30/-90, DC3: 87/70/90. The DC sources have been chosen as the most common planes configurations on the basis of previous studies (Caputa, 2014). The second group is composed by non-DC sources, including isotropic and CLVD terms. Non-DC sources were also prepared based on earlier experience at the Rudna mine: a few real mining events with stable, mixed solutions (with both ISO and CLVD components) had been chosen as reference. To proof the performance of different inversion techniques to resolve ISO and CLVD components of different amount, we modified the scalar moment of ISO and CLVD components, forcing them to contribute with specific shares (e.g., 10, 40, 70, and 100% in Figure 6) to the full moment tensor. Note that, since some reference solutions include substantial CLVD or ISO components, the source models to discuss the resolution of isotropic sources may include also large CLVD terms (especially when the ISO percentage is low), and vice versa.
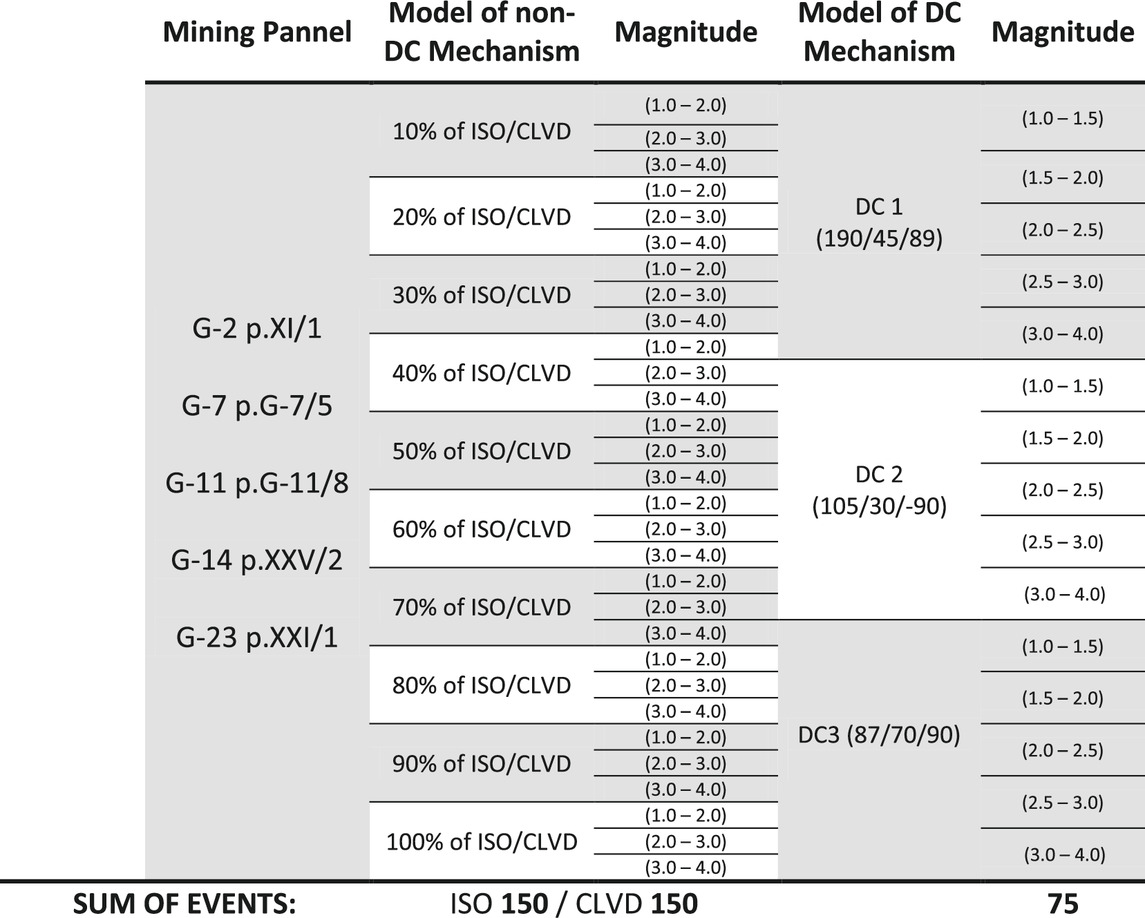
TABLE 1. Schematic table of dataset content.
The synthetic catalog is accompanied by the corresponding synthetic seismograms, produced by each source in the catalog at each sensor in the network. For the synthetic seismograms computation, we assumed a local velocity model, which describes the shallow crustal structure and geological condition inside the mine (Figure 9B). Finally, to better simulate real recordings, all synthetic seismograms were contaminated by a white noise, with station dependent amplitudes, estimated upon the typical noise level registered at each station used in our analysis (Figure 2). All waveforms were prepared with sampling rate complies with sampling rate of the monitoring system (i.e. 100 sps).
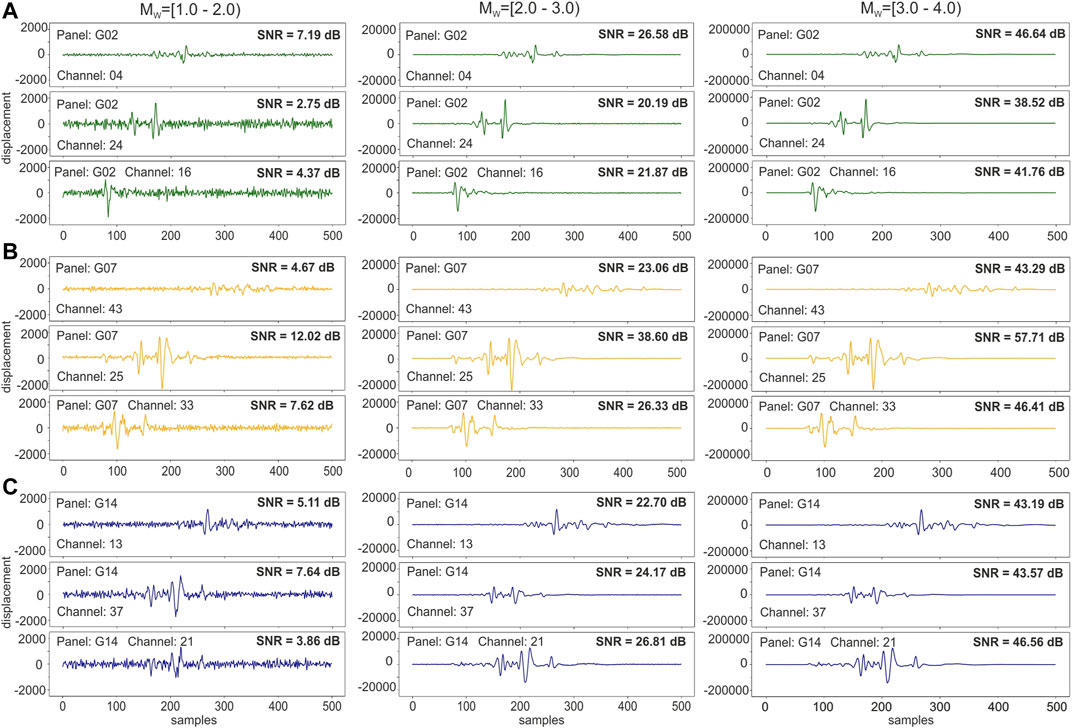
FIGURE 2. An example of noise contamination for selected waveforms of different magnitude and registration location. (A) – synthetic waveforms generated for panel G02; (B) – synthetic waveforms generated for panel G07; (C) – synthetic waveforms generated for panel G14.
The final database includes seismic catalog and corresponding seismograms for 375 source models (Table 1): 75 pure shear sources (3 different mechanisms, with five different locations and 5 different magnitudes), 150 isotropic earthquakes (a reference DC mechanism plus an isotropic component, with 10 different isotropic percentage from 10 to 100%, with five different locations and 3 different magnitudes), 150 CLVD events (a reference DC mechanism – same as ISO source - plus a CLVD component, with 10 different CLVD percentage from 10 to 100%, with five different locations and 3 different magnitudes).
Results are here discussed separately for different families of earthquakes (i.e. DC vs. non-DC source models). Results are obtained independently using the two chosen techniques, one based on P-wave first arrival signals (P) and one on full waveforms (FW). For the P-wave inversion approach, all seismograms were manually picked and the inversion was done event by event. The results for the second, full waveform approach, were obtained automatically.
First of all we discuss the moment magnitude distribution within all tested locations and both groups of model sources, DC and non-DC. In average DC magnitude estimation results are close to reference values. In group of P solutions the mean overestimation of Mw is only 0.02, while for FW solutions Mw is underestimated in average by 0.01 (Figures 3A,B). P solutions present a higher variability of magnitude errors. Largest magnitude differences are found for the weakest earthquakes (Mw 1.1), for which we find an average overestimate of 0.22; this value does not exceed 0.06 for larger magnitudes. The Mw obtained with the FW inversion are even better resolved and closer to catalog values. On average the differences varies from 0.02 (for Mw 2.7) to 0.08 (for Mw 3.5). Additionally, we do not observe any significant correlation of the magnitude error with the source location within selected mining panels.
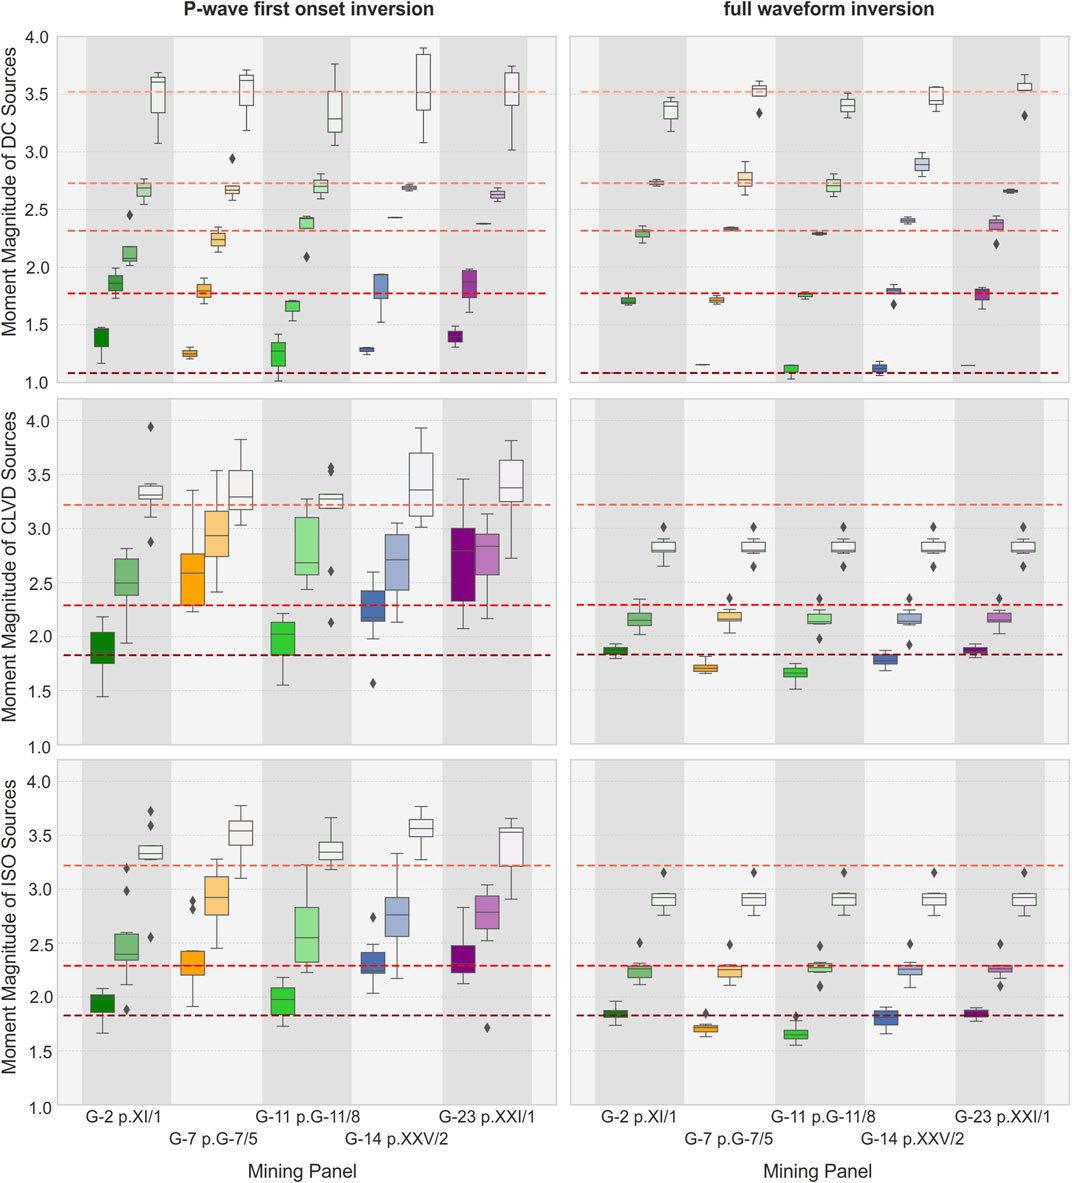
FIGURE 3. Magnitude distribution in relation to panels with reference magnitude levels (red dashed lines); Separate boxes are ploted on the basis of DC, CLVD and ISO sources prepared for selected magnitudes but different share of MT components. The median values of Mw are marked on boxplots as black lines in boxes, the bottom and top edges of each box indicate the 25th and 75th percentiles, the whiskers represent extreme data and diamonds represent outliers. Color of boxes indicate the magnitudes, low magnitudes are marked with darker colors and high Mw is representing by pale/whitish colors; (A), (C), (E) - the first P-wave inversion; (B), (D), (F) – the full waveform inversion.
For the group of non-DC sources, P magnitudes are in average overestimated by 0.32, while those of the FW inversion are underestimated by 0.19 (Figure 3). Magnitude errors of P solutions for the CLVD and ISO groups of sources are most remarkable for sources located at those panels, such as G-7 and G-23, with the poorest station coverage (Figure 7C). Here, the average Mw overestimation can be as large as 0.56 in G-23, for CLVD sources, and 0.48 in G-7, for isotropic sources (Figure 3E). The overestimation of moment magnitude for both type of non-DC sources, is significantly lower in panels G-2 and G-11, in the central part of Rudna mine.
In the case of the FW inversion, a correlation among the magnitude discrepancy and the source location is not evident. On the other hand, for both group of sources, ISO and CLVD, the amount of the magnitude discrepancy appears to be proportional to the magnitude of the considered event, i.e. underestimations of 0.33, 0.11, and 0.07 are found for reference magnitudes of Mw 3.2, 2.3, and 1.8, respectively.
We first report the inversion results for pure DC source models. A simple and effective way to quantify the difference among the true and estimated focal mechanisms is by means of the Kagan angle (Kagan, 2005, 2007), here denoted as κ, which describes the rotation angle among the two focal mechanisms. P results (Figures 4A, 5A) are characterized by a high variability of Kagan angles, for different source models and magnitudes (Figure 5A). The mean κ value in each magnitude range exceeds 9°. Worst results are found for magnitudes below 2.0 at all analyzed source locations. Nevertheless, the largest discrepancies are found for panels G-7, G-14, and G-23, located close to the edge of the mine and with a larger azimuthal gap, where κ reaches values of ∼95°–100°. For magnitudes larger than 2.0, average Kagan angles at panels G-7, G-14, and G-23 are 45°, 34°, and 34°, respectively. Conversely, for panel located well within the seismic network (i.e. those marked in green tonalities in Figure 1), mean values (m) of κ are much lower (i.e. m = 23° for G-2 and m = 20° for G-11). Different results for different panels are also characterizing the Kagan angle distributions: the standard deviations (σ) for outer panels G-7, G-14, and G-23 for events with M 2.0 is in the range 29–43°, compared to 13–14° for inner panels G-2 and G-11.
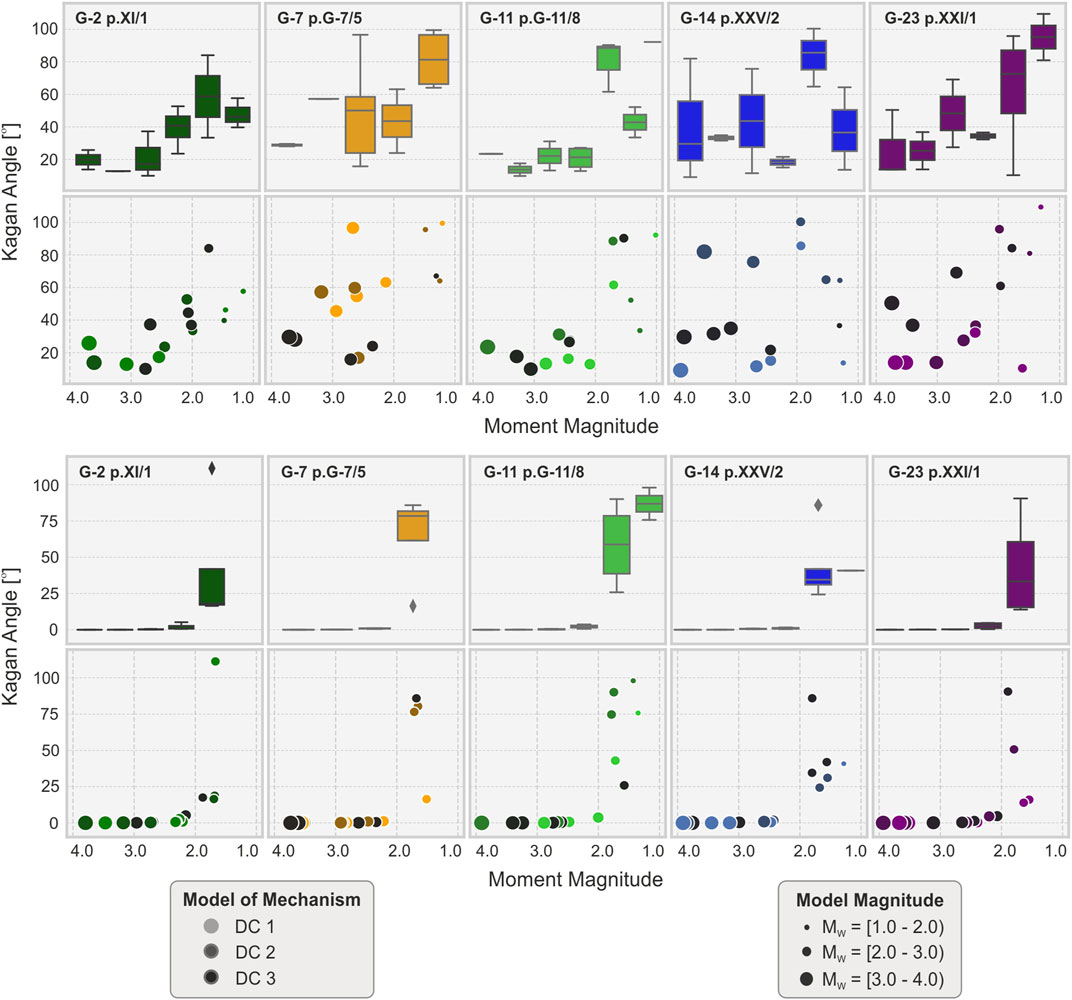
FIGURE 4. Kagan angle vs. magnitude for the P-wave inversion (A) and the full waveform inversion (B). Circle colors and size reflect different panels and magnitude, respectively, as in the bottom legends. Box plots present distribution of Kagan angle in different magnitude ranges which refer to the axis of lower scatter plots. The median values ok κ are marked on boxplots as black lines in boxes, the bottom and top edges of each box indicate the 25th and 75th percentiles and the whiskers represent extreme data.
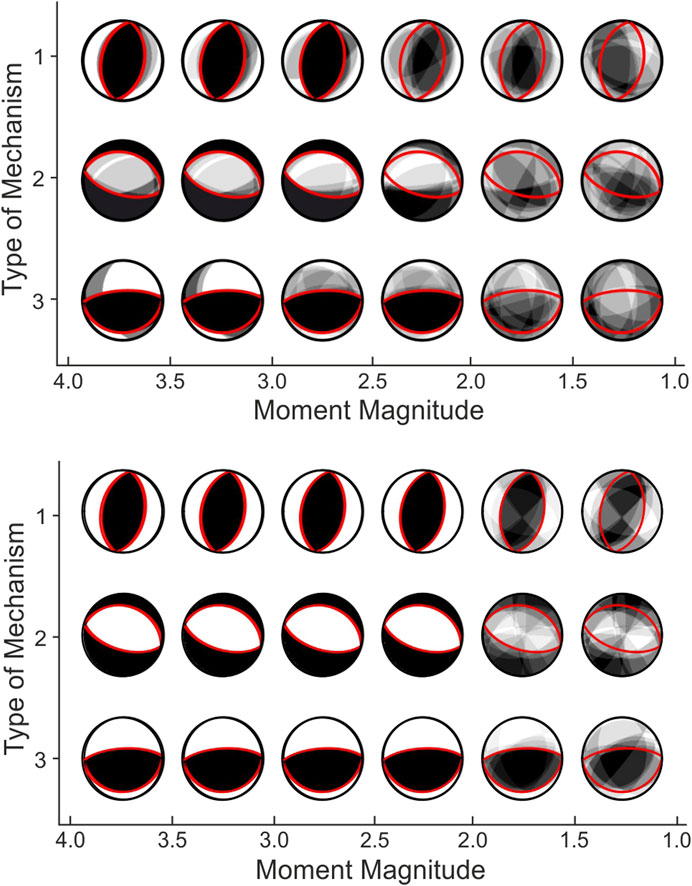
FIGURE 5. Comparison of true (red line) and resolved (black) focal spheres for double-couple earthquake using first P-wave (A) and full waveform (B) inversion. In this graphical representation, the resolved focal spheres for different panels are plotted semi-transparent and overlapped.
FW inversion results are considerably more stable (Figures 4B, 5B). The mismatch between original and resolved focal mechanism (Figure 5B) is significant only for weakest events with M < 2.0. The mean Kagan angle for these small events is highest in panel G-11 (m = 73°) and G-7 (m = 65°) and lower at panels G-2, G14, and G-23 (m ∼ 41–43°). For the magnitude range M 2.0–4.0, the κ standard deviation is less than 1° for almost all sources of the catalog. Only the smallest events with M close to 2.0 in panels G-2 and G-23 are characterized by larger σ.
In this paragraph we discuss inversion results for non-DC models, i.e. those including either ISO or CLVD sources. Firstly, it is worth to notice that for small quakes (M < 2) the solutions are very unstable for both tested methods. That is clearly visible on Hudson plots (Hudson et al., 1989) for CLVD (Figure 6A) and ISO (Figure 6B) sources.
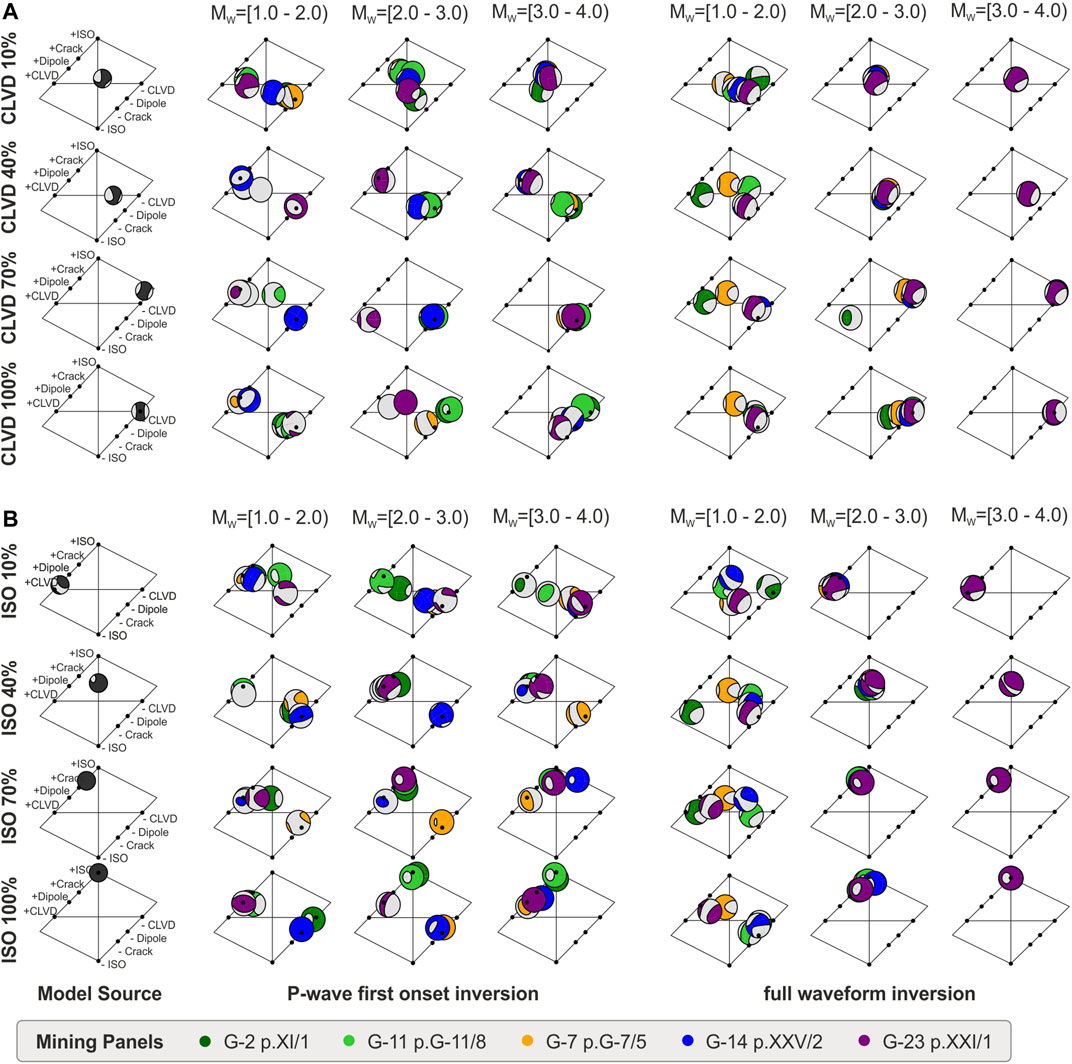
FIGURE 6. Hudson’s plots of non-DC sources. Full MT solutions of chosen CLVD sources (A) and ISO sources (B) are presented in three different magnitude ranges in comparison to modeled sources (first, left column); colors of plotted beachballs refers to the mining panels.
Further variations in our dataset are observed when we consider the particular MT parts for events with M > 2. For both methods, the CLVD term is underestimated (Figure 7): in case of P technique in average by 14%, while for the FW by 6%. In general variation between the modeled CLVD part and obtained value, is in the range from 0 to 95%. Again, we depict a dependency on the source location for the P-wave inversion approach, where the difference in the CLVD percentage are higher (15–22°) at outer panels, and lower (7–10°) at inner ones (G-2 and G-11). Differences between tested locations and inversion approaches can be noted more clearly in terms of high CLVD contribution (CLVD >70% in full MT decomposition) (Figure 7). In this group of data obtained CLVD values are on average 24% lower than assumed model, in comparison with 9% for the full waveform inversion results. Variations in full MT depending on the tested location should be also highlighted in this group where CLVD value is underestimated by 27–35° for outer panels and only 9–11° at inner locations. Concerning the full waveform inversion, we do not depict an influence of the network geometry on our solutions.
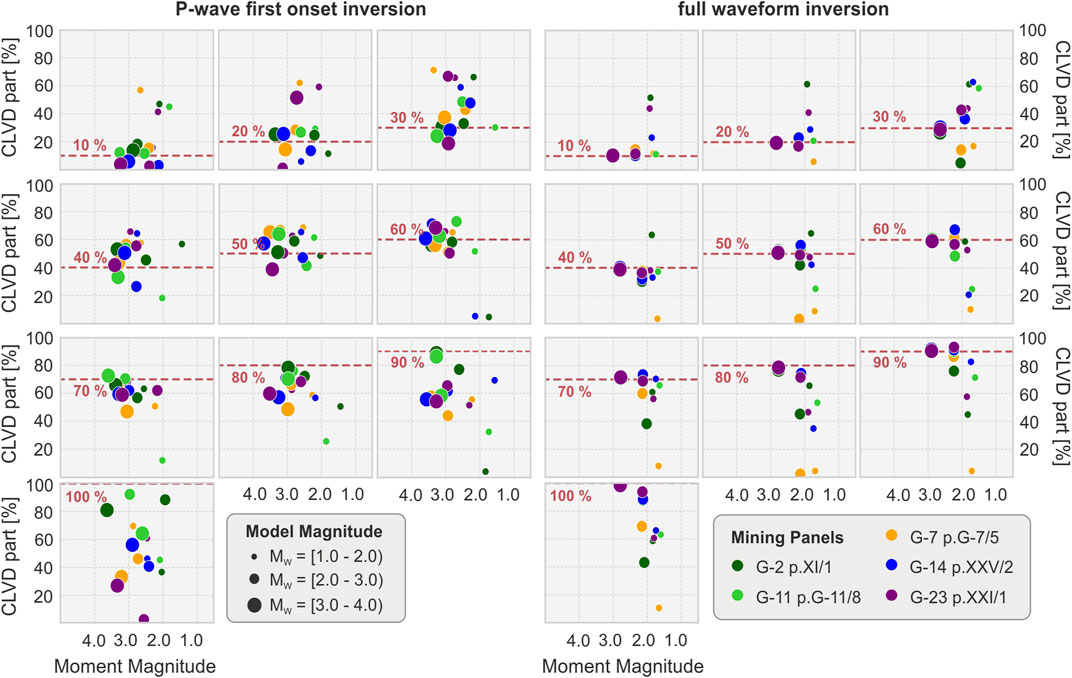
FIGURE 7. CLVD contribution in MT decomposition in terms of moment magnitude and reference CLVD level (dashed red lines).
Similar differences affect the MT inversion for sources including an isotropic component. As in the previous case, the estimation of the isotropic component can be severely biased. For both techniques, the difference between reference and estimated ISO components can vary between 0% to more than 90% (Figure 8). The mean difference between the reference isotropic percentage and obtained values is 25% for the P-wave and 16% for the full waveform inversion solutions. Disproportions are again more significant for highly isotropic sources (>70% of ISO component in full MT). In this group of sources, mean underestimation of isotropic component equals 33 and 5% for P and FW solutions, respectively. Similarly as CLVD, P solutions have a better resolution of the ISO component for sources in the central panels (ISO differences of 6–11%), than in outer panels (in average 26–33% underestimate) Again, FW solutions are more robust, and their ISO resolution decreases with magnitude, being poorly resolved below M2 (Figures 6B, 8).
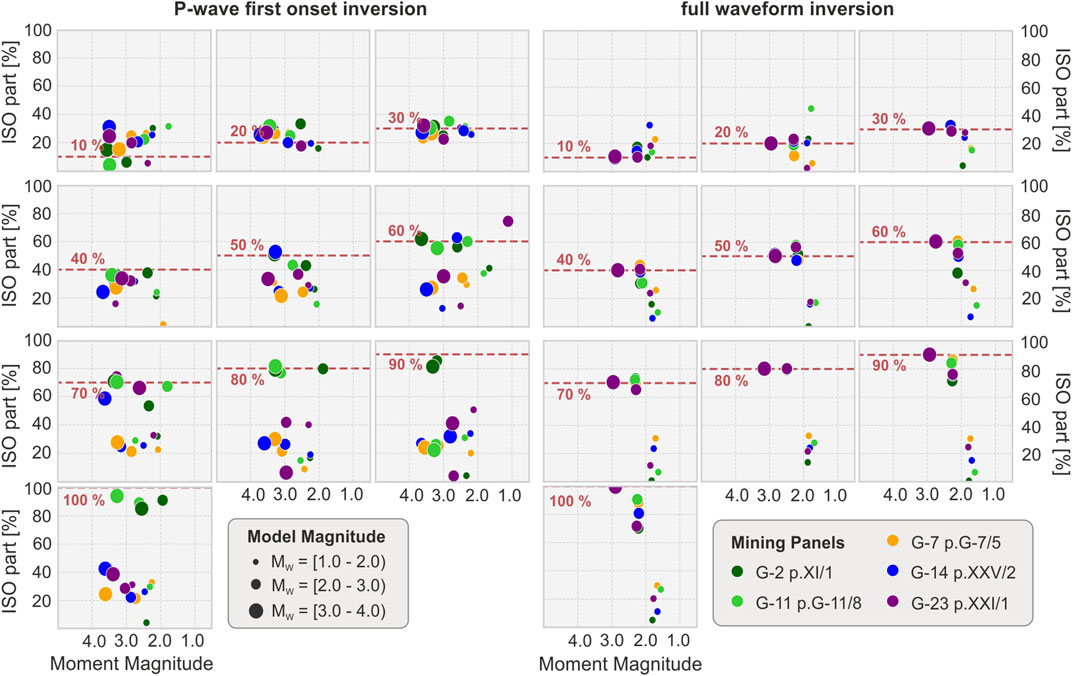
FIGURE 8. ISO contribution in MT decomposition in terms of moment magnitude and reference ISO level (dashed red lines).
Figure 9 shows the differences in misfit values between reference and synthetic seismograms calculated during both inversion procedure. They are shown in the form of Kernel Density Estimation plot (KDE), which is a standard nonparametric probability density estimation. KDE is calculated by weighting the distances over all data points (Rosenblatt, 1956; Parzen, 1962). Obtained values are presented with respect to three magnitude groups. The misfits for the P-wave first motion inversion (Figure 9A) is largest for outer panels (G-7, G-14, and G-23) and weakest earthquakes (below M2.0). Misfit plots for the FW inversion (Figure 9C) show a higher resolution and a lower dependency on the source location. The factor mostly influencing the FW inversion is the magnitude of the events, i.e. the signal-to-noize ratio.
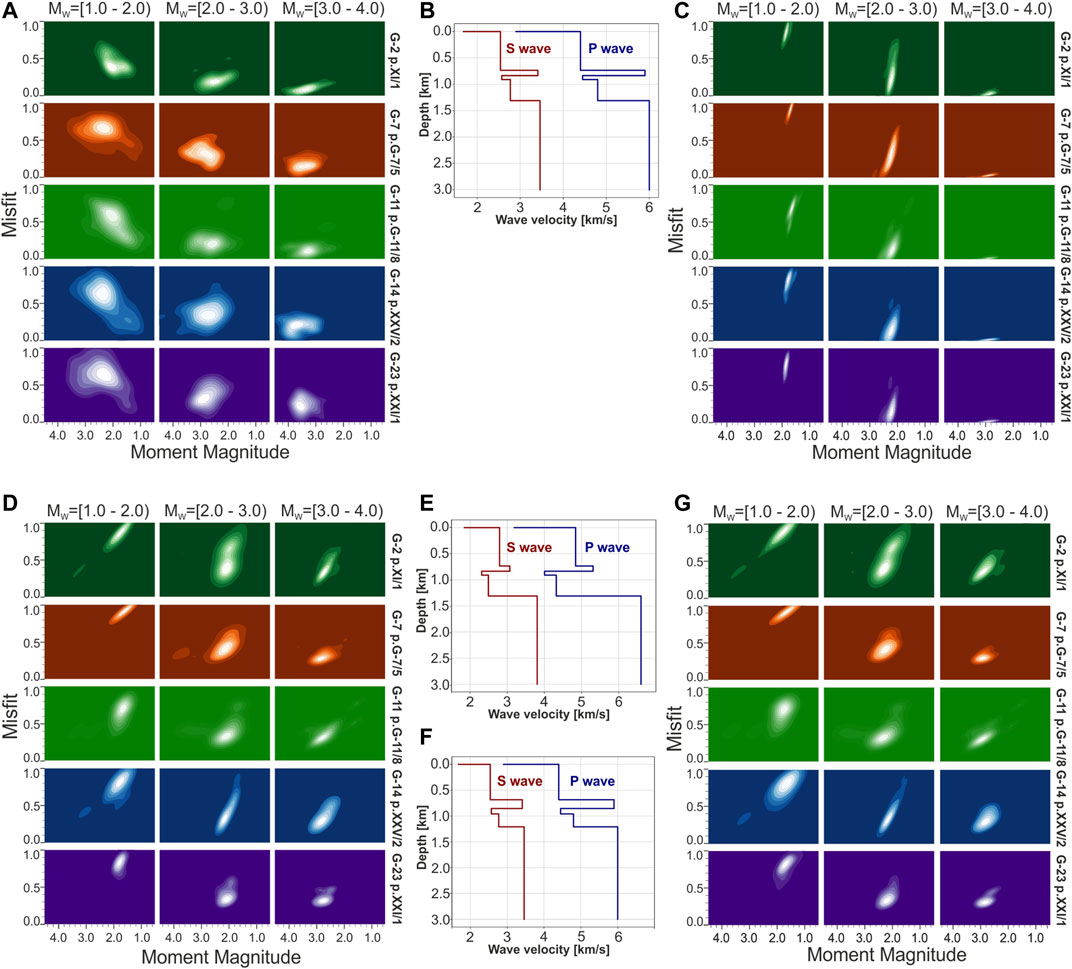
FIGURE 9. Probability density estimation (Kernel Density Estimation - KDE) plot of normalized fitting errors with velocity models used for analysis. KDE obtained for selected mining panels (marked by colors) and for three different magnitude ranges (titled by the model magnitudes above the columns), magnitudes calculated by MT inversion are presented on x-axis in a range from 0.5 to 4.5 and the misfit is presented in the range from 0 to 1.0 on y-axis of each plot; (A) – Misfit obtained for the first P-wave inversion; (C) – Misfit values obtained for the full waveform inversion with original velocity model (B); (D) - Misfit values obtained for the full waveform inversion with velocity model of disturbed velocities by 10% (E); (G) - Misfit values obtained for the full waveform inversion with velocity model of disturbed layers depth (F).
Using simplified or non accurate velocity model can strongly affect the full waveform inversion, first by producing a misalignment of synthetics and observed waveforms. This section aims at assessing the influence of the shallow crustal structure mismodeling toward the stability and accuracy of MT results. We repeated the same scheme of FW inversions as it had been conducted for “basic” research but using two disturbed velocity models. To the analysis of new models influence we used the same dataset presented in the Synthetic Data thus there have been all 375 synthetic sources taken into account. These models were prepared, perturbing the starting velocity model: the first one (velocity mismodeled model, VMM) was obtained by randomly introduced changes in P and S velocities by 10% (Figure 9E), the second one (depth mismodeled model, DMM) was created by random changes in the thickness of geological layers by 10% (Figure 9F).
As it is to be expected, MT solutions obtained using both perturbed models show higher misfits, compared to the unperturbed model. The quality of MT solutions remain however stable, as illustrated for the case of the magnitude in Figures 9D,G. Observed resolution of magnitudes presents similar patterns as for the unperturbed model (Resolution of Magnitude) and there are no significant differences between the two tested perturbed models. Magnitudes of DC sources are underestimated by ∼0.1 for both perturbed models. Magnitudes of non-DC sources deviates by ∼0.2–0.3, respect to the unperturbed case. Again, larger differences are found for larger events. Similarly as for the reference model we do not observe any spatial dependence of the magnitude resolution.
The resolved geometry of the nodal planes are also comparable for both perturned models. Higher Kagan angle are found for the weakest (M < 2) events, where the mean κ for both tested schemes is ∼57°, compared to ∼19° for events with M > 3.
The quality of the MT decomposition and resolution of non-DC terms are comparable to those assuming the reference model, described in Non-Double Couple Source Models. Largest errors in the resolved CLVD components are found for the group of solutions with CLVD >70% with a full MT decomposition. For these sources, the CLVD component may be misestimated by ∼40–50%, compared to ∼20% for the group of source models with CLVD below 70%. Similar results are found for the isotropic components, with major differences found for sources including a large isotropic component. Again, we observe no differences in the quality of MT solutions obtained for different source locations and with a different azimuthal coverage.
Seismological observations in mines are limited by the tunnels extent and their geometry. Thus, the only possibility to improve the seismological analysis, such as MT inversion, is to use novel, advanced techniques, which can provide robust results, even with sub-optimal network configurations. The first tests to perform should aim at assessing the performance of available methods and approaches; assessing source parameter uncertainties is also crucial to quantify the potential limitations of a full MT inference toward hazard assessment. On the base of an accurate testing and assessment, relying on a solid synthetic framework, one can provide recommendations, which would help stakeholders to deal with the data processing. In this work, we aim at establishing the resolution of the source mechanism estimations for typical in-mine seismic network. Hence, we used the real network geometry and built synthetic recordings for a range of source models, with different size and mechanism types.
The first parameter which we resolve is the moment magnitude. For both tested inversion techniques (i.e. P and FW approaches), as well as for all considered source types, a minimum magnitude of M2.0 appears as a threshold to obtain reliable results at Rudna. This implies that the analysis of weaker events, with a lower signal-to-noize ratio, is in general not possible with these techniques and the current network configuration. Earthquakes with magnitude above M2.0 may be ∼150 per year at the Rudna mine, in comparison to a higher rate of smaller events. Thus, the current magnitude threshold will strongly reduce the number of events for which we can infer a robust moment tensor. The quality of P and FW inversion is comparable toward the magnitude estimation. Interestingly, the P approach tends consistently to overestimate the reference magnitude, while the FW solutions slightly underestimate these; this observation is presumably controlled by a poor source resolution, in the case of P solutions, and by the data noise contamination, in the case of FW solutions. We observed a consistent magnitude underestimation with a FW inversion, with larger deviations for larger events. This issue was observed both using the reference velocity model, as well as for perturbed models. We argue that this result may be due to the intrinsic MT resolution limitations, when modeling very shallow sources using low frequency waveforms (e.g., Cesca and Heimann 2018). In these conditions, certain components of the moment tensor are poorly resolved, what can also affect also the resolution of the scalar moment and moment magnitude. For events with M > 2.0 the quality of the results depends on the chosen inversion technique. P solutions, and most of all those obtained for non-DC solutions, suggest that this approach is very sensitive to the source coverage, and solutions quality may strongly vary depending on the source location. Specifically, estimated moment tensors and magnitudes present important variability for source located close to the Rudna mine borders, where the azimuthal coverage becomes more poor and the number of sensor at local distances is smaller, extending the observation by Cesca and Grigoli (2015) and Ma et al. (2018b), that the time domain inversion methods can be affected by network geometry, to the P approach. At the Rudna mine, this issue was also raised by Lizurek (2017).
Seismic noise is partially affecting the P approach, namely reducing the accuracy of P onsets picks and the overall quality of the inversion results. Since the network geometry inside the mine is limited by the excavation area, this cannot be easily improved. In the current conditions, the events located in panels close to the Rudna mine borders are still monitored by numerous stations, but epicentral distances are considerable longer that the average network size, and the azimuthal coverage is poor. Unfortunately, with the propagation of the exploitation close to the mines boundaries, the seismic activity in this parts of the mine is increasing. Hence, one can just recommend the full waveform inversion as an alternative tool to the currently implemented approach.
Our results confirm the stability of FW solutions in difficult conditions of in-mine monitoring. There are evidences that mainly the seismic noise contamination represent a significant source for parameter uncertainties. The mismodeling of the velocity model, which is a common problem in mining seismology, can also affect the results. However, our tests did not show significant differences between results obtained using affected models. It can be a sign that the method is stable. Nevertheless, since we consider only two disturbed models, we cannot provide any kind of relation which describes behavior of FW solutions with respect to different “geological” conditions. Moreover, the FW inversion can be further affected by signals clipping, which can limit the applicability of this approach. The low dynamic range and the relatively strong ground motions produced by mining tremors can affect the stations located closest to the seismic source, spoiling the full waveform signals. Figure 10 presents an overview of the estimated influence of the event size on seismic records distortion, as a function of source-receiver distance. Clipped recordings are challenging to be used to reconstruct the true ground motions for the full waveforms, and these records need to be reconstructed with advanced methods or simply excluded by the full waveform inversion procedure. Unfortunately, seismograms clipping is commonly observed for high energy events at the Rudna underground seismic network (Rudziński, 2013; Rudziński et al., 2017) (Figure 10). Here, signal clipping typically affect S onsets and the seismogram coda, so that P phases are generally well recorded and can be used for modeling approaches.
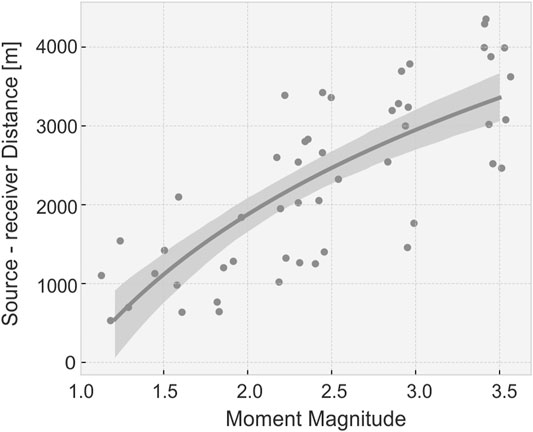
FIGURE 10. Plot of seismogram clipping as a function of magnitude and source – receiver distance based on real records of Rudna in-mine monitoring system. Gray circles reflect to the farthest clipped seismograms observed for particular moment magnitude for selected mining events. Gray line present linear regression model fit and shadow area represents 95% confidence interval for that regression. Data on y axis (source – receiver distance) is plotted in log scale.
In conclusion, given the previous considerations, an hybrid approach, combining the fit of P phases at closest distances and full waveforms at larger distances can provide the optimal setup for the future monitoring of mining seismicity, able to combine the potential of both approaches and preserving their most valuable features.
The robust inversion of source mechanism in mines remains a challenging task, and available techniques should be tested for the specific mining network to assess the quality of their solution. In this work we built a realistic synthetic catalog and a synthetic dataset to test the robustness of different moment tensor approaches to resolve the source parameters of mining induced seismicity. Such implementation is ideal to quantify the resolution power of different inversion techniques.
We find out that both approaches, namely the inversion based on the fit of P phase amplitude and polarity, and based on the full waveforms and their spectra, have specific advantages, but also strong limitations. In the case of undisturbed signals, the full waveform inversion approach is to be preferred, and it is able, for the typical noise condition of the Rudna mine, to accurately resolve DC and non-DC sources down to a magnitude M2.0. The P wave inversion technique, in contrast, is not sensitive to late clipping of the seismograms, if the P wave pulses are well preserved, but it is in general much less stable, and the solution quality is strongly affected by the source coverage, potentially affecting magnitude estimation, fault plane orientation and non-DC components. In these conditions, the quality of the moment tensor solution drastically decreases when seismicity occurs at the edges of the seismic network, as often observed with the extension of mining activity.
Toward a robust assessment of mining seismicity source parameters, we recommend an hybrid inversion approach, where P onsets are fitted at station at close epicentral distances, whenever full waveform signals are corrupted, and full waveforms are fitted at larger distances. The definition of a maximal distance, where the seismic recordings can be clipped and not be usable, can be easily defined at Rudna on the base of an early rough magnitude estimate, so that an automated inversion, taking care of the proper parametrization of the fitting procedure, can be implemented. Such hybrid approach, able to simultaneously take advantage of the potential of both approaches and to overcome their limitations, provides the optimal configuration for monitoring mining seismicity at the Rudna mine and potentially at other mines.
The raw data supporting the conclusions of this article will be made available by the authors, without undue reservation except the exact in-mine monitoring system details, which are owned by KGHM Polska Miedź.
ŁR contributed to conception of the study. The design of the analysis was given mainly by SC and AC. AC and SC prepared the database of synthetic waveforms and the catalog of synthetic events. AC performed inversion of prepared data and all analysis contained in the manuscript text. AC wrote the first draft of the manuscript. ŁR and SC wrote sections of the manuscript. All authors contributed to manuscript revision, read, and approved the submitted version.
Work of AC and ŁR was supported by a subsidy from the Polish Ministry of Education and Science for the Institute of Geophysics, Polish Academy of Sciences. The work was also partially supported within Polish National Science Center project: PRELUDIUM 13 No. 2017/25/N/ST10/01759 (AC). SC received funding by the European Union RFCD project PostMinQuake, grant 899192.
The authors declare that the research was conducted in the absence of any commercial or financial relationships that could be construed as a potential conflict of interest.
Authors wish also thank to KGHM Polska Miedź S.A. for the technical information concerning underground monitoring system in the Rudna mine.
Arabasz, W. J., and Pechmann, J. C. (2001). Seismic Characterization of Coal-Mining Seismicity in Utah for CTBT Monitoring, Technical Report UCRL-CR-143772. Livermore, CA:Lawrence Livermore National Laboratory. LLNL Research Agreement No. B344836, 1–120. Available at: www/seis.utah.edu/Reports/llnl2001.
Bergman, E. A., and Solomon, S. C. (1985). Earthquake Source Mechanisms from Body-Waveform Inversion and Intraplate Tectonics in the Northern Indian Ocean. Phys. Earth Planet. Interiors 40 (1), 1–23. doi:10.1016/0031-9201(85)90002-0
Bowers, D., and Walter, W. R. (2002). Discriminating between Large Mine Collapses and Explosions Using Teleseismic P Waves. Pure Appl. Geophys. 159 (4), 803–830. doi:10.1007/s00024-002-8660-8
Bukchin, B., Clévédé, E., and Mostinskiy, A. (2010). Uncertainty of Moment Tensor Determination from Surface Wave Analysis for Shallow Earthquakes. J. Seismol 14 (3), 601–614. doi:10.1007/s10950-009-9185-8
Caputa, A. (2014). Mechanizm Wstrząsów Po Strzelaniach W Kopalni Miedzi Rudna KGHM S.A. MSc thesis. Katowice, Poland: University of Silesia.
Caputa, A., and Rudziński, Ł. (2019). Source Analysis of Post-Blasting Events Recorded in Deep Copper Mine, Poland. Pure Appl. Geophys. 176 (8), 3451–3466. doi:10.1007/s00024-019-02171-x
Caputa, A., Talaga, A., and Rudziński, Ł. (2015). Analysis of post-blasting Source Mechanisms of Mining-Induced Seismic Events in Rudna Copper Mine, Poland. Contemp. Trends Geosci. 4 (1), 26–38. doi:10.1515/ctg-2015-0003
Cesca, S., Buforn, E., and Dahm, T. (2006). Amplitude Spectra Moment Tensor Inversion of Shallow Earthquakes in Spain. Geophys. J. Int. 166 (2), 839–854. doi:10.1111/j.1365-246X.2006.03073.x
Cesca, S., and Grigoli, F. (2015). Full Waveform Seismological Advances for Microseismic Monitoring. Adv. Geophys. 56, 169–228. doi:10.1016/bs.agph.2014.12.002
Cesca, S., and Heimann, S. (2018). “Challenges in Regional Moment Tensor Resolution and Interpretation,” in Moment Tensor Solutions. Editor S. D’Amico (Springer, Cham: Springer Natural Hazards). doi:10.1007/978-3-319-77359-9_7
Cesca, S., Heimann, S., Stammler, K., and Dahm, T. (2010). Automated Procedure for point and Kinematic Source Inversion at Regional Distances. J. Geophys. Res. 115, 1–24. doi:10.1029/2009JB006450
Cesca, S., Rohr, A., and Dahm, T. (2013). Discrimination of Induced Seismicity by Full Moment Tensor Inversion and Decomposition. J. Seismol 17 (1), 147–163. doi:10.1007/s10950-012-9305-8
Domingues, A., Custódio, S., and Cesca, S. (2013). Waveform Inversion of Small-To-Moderate Earthquakes Located Offshore Southwest Iberia. Geophys. J. Int. 192 (1), 248–259. doi:10.1093/gji/ggs010
Dreger, D. S. (2003). “85.11 TDMT_INV: Time Domain Seismic Moment Tensor INVersion,” in International Handbook of Earthquake and Engineering Seismology. Editors W.H.K. Lee, H. Kanamori, P.C. Jennings, and C. Kisslinger (London: Academic Press), 81, 1627. doi:10.1016/S0074-6142(03)80290-5
Dreger, D. S., Ford, S. R., and Walter, W. R. (2008). Source Analysis of the Crandall Canyon, Utah, Mine Collapse. Science 321, 217. doi:10.1126/science.1157392
Dubiński, J. (2013). “The Mechanisms and Consequences of strong Mining Tremors that Occur in Polish Hard Coal and Copper Mines,” in Rock Mechanics for Resources, Energy and Enviroment Editors Kwaśniewski, and Łydżba (Wroclaw, Poland), 31–38.
Fernandez, L. M., and Van der Heever, P. K. (1984). “Ground Movement and Damage Accompanying a Large Seismic Events in the Klerksdorp District,” in Proceedings 1st International Congress on Rockbursts and Seismicity in Mines, Johannesburg, 213–224. doi:10.1016/b978-0-12-812234-1.00007-8
Fichtner, A., Kennett, B. L. N., Igel, H., and Bunge, H.-P. (2008). Theoretical Background for continental- and Global-Scale Full-Waveform Inversion in the Time-Frequency Domain. Geophys. J. Int. 175 (2), 665–685. doi:10.1111/j.1365-246X.2008.03923.x
Fitch, T. J., McCowan, D. W., and Shields, M. W. (1980). Estimation of the Seismic Moment Tensor from Teleseismic Body Wave Data with Applications to Intraplate and Mantle Earthquakes. J. Geophys. Res. 85 (B7), 3817–3828. doi:10.1029/JB085iB07p03817
Fletcher, J. B., and McGarr, A. (2005). Moment Tensor Inversion of Ground Motion from Mining-Induced Earthquakes, Trail Mountain, Utah. Bull. Seismological Soc. America 95 (1), 48–57. doi:10.1785/0120040047
Gibowicz, S. J., and Kijko, A. (1994). An Introduction to Mining Seismology. San Diego: Academic Press
Hardebeck, J. L., and Shearer, P. M. (2003). Using S/P Amplitude Ratios to Constrain the Focal Mechanisms of Small Earthquakes. Bull. Seismological Soc. America 93 (6), 2434–2444. doi:10.1785/0120020236
Hasegawa, H. S., Wetmiller, R. J., and Gendzwill, D. J. (1989). Induced Seismicity in Mines in Canada-An Overview. Pure Appl. Geophys. 129 (3–4), 423–453. doi:10.1007/BF0087451810.1007/978-3-0348-9270-4_10
Heimann, S. (2011). A Robust Method to Estimate Kinematic Earthquake Source Parameters. PhD Thesis. Hamburg, Germany: Universit at Hamburg.
HongKie, T., and Kanamori, H. (1995). Moment-tensor Inversions for Local Earthquakes Using Surface Waves Recorded at TERRAscope. Bull. Seismological Soc. America 85 (4), 1021–1038.
Hudson, J. A., Pearce, R. G., and Rogers, R. M. (1989). Source Type Plot for Inversion of the Moment Tensor. J. Geophys. Res. 94 (B1), 765–774. doi:10.1029/jb094ib01p00765
Kagan, Y. Y. (2005). Double-couple Earthquake Focal Mechanism: Random Rotation and Display. Geophys. J. Int. 163 (3), 1065–1072. doi:10.1111/j.1365-246X.2005.02781.x
Kagan, Y. Y. (2007). Simplified Algorithms for Calculating Double-Couple Rotation. Geophys. J. Int. 171 (1), 411–418. doi:10.1111/j.1365-246X.2007.03538.x
Kanamori, H., and Given, J. W. (1981). Use of Long-Period Surface Waves for Rapid Determination of Earthquake-Source Parameters. Phys. Earth Planet. Interiors 27 (I), 8–31. doi:10.1016/0031-9201(81)90083-2
Koziarz, E., and Szłapka, M. (2010). Kierunki Dalszego Rozwoju Informatycznego Systemu Do Bezpośredniej Lokalizacji Zjawisk Dynamicznych W O/ZG „Rudna” KGHM „Polska Miedź” SA. Wiadomości Górnicze 3, 159–174.
Kwiatek, G., Martínez‐Garzón, P., and Bohnhoff, M. (2016). HybridMT: A MATLAB/Shell Environment Package for Seismic Moment Tensor Inversion and Refinement. Seismological Res. Lett. 87 (4), 964–976. doi:10.1785/0220150251
Lasocki, S., Orlecka-Sikora, B., Mutke, G., Pytel, W., and Rudziński, Ł. (2017). “A Catastrophic Event in Rudna Copper-Ore Mine in Poland on 29 November, 2016: what , How and Why,” in Proc. 9th International Symposium on Rockbursts and Seismicity in Mines. Editor J. A. Vallejos (Santiago, Chile:Editec S.A), 316–324.
Lasocki, S. (2005). “Probabilistic Analysis of Seismic hazard Posed by Mining Induced Events. Controlling Seismic Risk,” in Proc. 6th International Symposium on Rockburst and Seismicity in Mines 9-11 March 2005. Editors Y. Potvin, and M. Hudyma (Nedlands, Australia:Australian Centre for Geomechanics), 151–156.
Li, T., Cai, M. F., and Cai, M. (2007). A Review of Mining-Induced Seismicity in China. Int. J. Rock Mech. Mining Sci. 44 (8), 1149–1171. doi:10.1016/j.ijrmms.2007.06.002
Lizurek, G. (2017). Full Moment Tensor Inversion as a Practical Tool in Case of Discrimination of Tectonic and Anthropogenic Seismicity in Poland. Pure Appl. Geophys. 174 (1), 197–212. doi:10.1007/s00024-016-1378-9
Lizurek, G., and Wiejacz, P. (2011). “Moment Tensor Solution and Physical Parameters of Selected Recent Seismic Events at Rudna Copper Mine,” in GeoPlanet: Earth and Planetary Sciences. Editors A.F. Idziak, and R. Dubiel, 3, 11–19. doi:10.1007/978-3-642-19097-1_2
López-Comino, J. A., Cesca, S., Kriegerowski, M., Heimann, S., Dahm, T., Mirek, J., et al. (2017). Monitoring Performance Using Synthetic Data for Induced Microseismicity by Hydrofracking at the Wysin Site (Poland). Geophys. J. Int. 210 (1), 42–55. doi:10.1093/gji/ggx148
Ma, J., Dineva, S., Cesca, S., and Heimann, S. (2018a). Moment Tensor Inversion with Three-Dimensional Sensor Configuration of Mining Induced Seismicity (Kiruna Mine, Sweden). Geophys. J. Int. 213 (3), 2147–2160. doi:10.1093/gji/ggy115
Ma, J., Dong, L., Zhao, G., and Li, X. (2018b). Discrimination of Seismic Sources in an Underground Mine Using Full Waveform Inversion. Int. J. Rock Mech. Mining Sci. 106, 213–222. doi:10.1016/j.ijrmms.2018.04.032
Ma, J., Dong, L., Zhao, G., and Li, X. (2019). Focal Mechanism of Mining-Induced Seismicity in Fault Zones: A Case Study of Yongshaba Mine in China. Rock Mech. Rock Eng. 52 (9), 3341–3352. doi:10.1007/s00603-019-01761-4
McGarr, A. (1992). Moment Tensors of Ten Witwatersrand Mine Tremors. Pageoph 139 (3–4), 781–800. doi:10.1007/BF00879963
McGarr, A., Simpson, D., and Seeber, L. (2002). “40 Case Histories of Induced and Triggered Seismicity,” in International Handbook of Earthquake and Engineering Seismology. Editors W.HH Lee Kanamori, P.C Jennings, and C Kisslinger, 81, 647–661. doi:10.1016/S0074-6142(02)80243-1
McGarr, A. (1971). Violent Deformation of Rock Near Deep-Level, Tabular Excavations-Seismic Events by arthur Mcgarr. Bull. Seismological Soc. America 61 (5), 1453–1466.
Parzen, E. (1962). On Estimation of a Probability Density Function and Mode. Ann. Math. Statist. 33 (3), 1065–1076. doi:10.1214/aoms/1177704472
Potgieter, G. J., Roering, C., Gay, N. C., and Wainwright, A. H. (1984). “The Influence of Geology on the Mechanisms of Mining-Associated Seismicity in the Klerksdorp Gold-Field,” in Rockbursts and Seismicity in Mines (Johannesburg: S. Afr. Inst. Min. Metal), 45–50.
Rosenblatt, M. (1956). Remarks on Some Nonparametric Estimates of a Density Function. Ann. Math. Statist. 27 (3), 832–837. doi:10.1214/aoms/1177728190
Rudziński, L., Cesca, S., and Lizurek, G. (2016). Complex Rupture Process of the 19 March 2013, Rudna Mine (Poland) Induced Seismic Event and Collapse in the Light of Local and Regional Moment Tensor Inversion. Seismological Res. Lett. 87 (2A), 274–284. doi:10.1785/0220150150
Rudziński, Ł., and Dineva, S. (2017). “Towards Energy Magnitude for Mining Induced Seismicity,” in Proc. 9h International Symposium on Rockbursts and Seismicity in Mines. Editor J.A. Vallejos (Santiago, Chile: Editec S.A), 182–188.
Rudziński, Ł., Mirek, J., and Lizurek, G. (2017). Identification of Seismic Doublets Occurred on Rudna Mine, Poland. Acta Geophysica 65 (2), 287–298. doi:10.1007/s11600-017-0034-9
Rudziński, Ł., Mirek, K., and Mirek, J. (2019). Rapid Ground Deformation Corresponding to a Mining-Induced Seismic Event Followed by a Massive Collapse. Nat. Hazards 96 (1), 461–471. doi:10.1007/s11069-018-3552-0
Rudziński, Ł. (2013). Rozwiązanie Mechanizmu Zjawiska Sejsmicznego Poprzez Inwersję Sejsmogramów. Przegląd Górniczy 69 (5), 49–55.
Sen, A. T., Cesca, S., Bischoff, M., Meier, T., and Dahm, T. (2013). Automated Full Moment Tensor Inversion of Coal Mining-Induced Seismicity. Geophys. J. Int. 195 (2), 1267–1281. doi:10.1093/gji/ggt300
Šílený, J., and Milev, A. (2006). Seismic Moment Tensor Resolution on a Local Scale: Simulated Rockburst and Mine-Induced Seismic Events in the Kopanang Gold Mine, South Africa. Pure Appl. Geophys. 163 (8), 1495–1513. doi:10.1007/s00024-006-0089-z
Šílený, J., and Milev, A. (2008). Source Mechanism of Mining Induced Seismic Events - Resolution of Double Couple and Non Double Couple Models. Tectonophysics 456 (1–2), 3–15. doi:10.1016/j.tecto.2006.09.021
Spottiswoode, S. M., and McGarr, A. (1975). Source Parameters of Tremors in a Deep-Level Gold Mine. Bull. Seismological Soc. America 65 (1), 93–112. doi:10.1016/0148-9062(76)91997-5
Stec, K., and Drzewiecki, J. (2012). Mine Tremor Focal Mechanism: An Essential Element for Recognising the Process of Mine Working Destruction. Acta Geophys. 60 (2), 449–471. doi:10.2478/s11600-011-0036-y
Trifu, C.-I., Angus, D., and Shumila, V. (2000). A Fast Evaluation of the Seismic Moment Tensor for Induced Seismicity. Bull. Seismological Soc. America 90 (6), 1521–1527. doi:10.1785/0120000034
Trifu, C. I. (2002). The Mechanism of Induced Seismicity. Springer Basel AG. doi:10.1017/978-3-0348-8179-1
Vavryčuk, V. (2001). Inversion for Parametes of Tensile Earthquake. J. Geophys. Res. 106 (B8), 16339–16355. doi:10.1029/2001JB000372
Vavryčuk, V., and Kühn, D. (2012). Moment Tensor Inversion of Waveforms: A Two-step Time-Frequency Approach. Geophys. J. Int. 190 (3), 1761–1776. doi:10.1111/j.1365-246X.2012.05592.x
Wiejacz, P. (1991). Badania Mechanizmów Wstrząsów Górniczych Przy Wykorzystaniu Tensora Momentu Sejsmicznego. Warszawa: Wyd. Instytutu Geofizyki PAN.
Wilson, M. P., Foulger, G. R., Gluyas, J. G., Davies, R. J., and Julian, B. R. (2017). HiQuake: The Human‐Induced Earthquake Database. Seismological Res. Lett. 88 (6), 1560–1565. doi:10.1785/0220170112
Keywords: mining seismicity, moment tensor, synthetic tests, seismic monitoring, underground mining
Citation: Caputa A, Rudziński Ł and Cesca S (2021) How to Assess the Moment Tensor Inversion Resolution for Mining Induced Seismicity: A Case Study for the Rudna Mine, Poland. Front. Earth Sci. 9:671207. doi: 10.3389/feart.2021.671207
Received: 23 February 2021; Accepted: 02 July 2021;
Published: 14 July 2021.
Edited by:
Rebecca M. Harrington, Ruhr University Bochum, GermanyReviewed by:
Jan Sileny, Institute of Geophysics (ASCR), CzechiaCopyright © 2021 Caputa, Rudziński and Cesca. This is an open-access article distributed under the terms of the Creative Commons Attribution License (CC BY). The use, distribution or reproduction in other forums is permitted, provided the original author(s) and the copyright owner(s) are credited and that the original publication in this journal is cited, in accordance with accepted academic practice. No use, distribution or reproduction is permitted which does not comply with these terms.
*Correspondence: Alicja Caputa, YWNhcHV0YUBpZ2YuZWR1LnBs
Disclaimer: All claims expressed in this article are solely those of the authors and do not necessarily represent those of their affiliated organizations, or those of the publisher, the editors and the reviewers. Any product that may be evaluated in this article or claim that may be made by its manufacturer is not guaranteed or endorsed by the publisher.
Research integrity at Frontiers
Learn more about the work of our research integrity team to safeguard the quality of each article we publish.