 Tanja C. Portele1,2*
 Patrick Laux1,2
 Christof Lorenz1Annelie Janner3
 Natalia Horna4
 Benjamin Fersch1
 Maylee Iza4Harald Kunstmann1,2
- 1Karlsruhe Institute of Technology (KIT), Campus Alpin, Institute of Meteorology and Climate Research - Atmospheric Environmental Research (IMK-IFU), , Garmisch-Partenkirchen, Germany
- 2Institute of Geography, University of Augsburg, Augsburg, Germany
- 3University of Erlangen Nuremberg, Erlangen, Germany
- 4Instituto Nacional de Meteorología e Hidrología, Dirección de Estudios, Investigación y Desarrollo Hidrometeorológico, Quito, Ecuador
For climate adaptation and risk mitigation, decision makers in water management or agriculture increasingly demand for regionalized weather and climate information. To provide these, regional atmospheric models, such as the Weather Research and Forecasting (WRF) model, need to be optimized in their physical setup to the region of interest. The objective of this study is to evaluate four cumulus physics (CU), two microphysics (MP), two planetary boundary layer physics (PBL), and two radiation physics (RA) schemes in WRF according to their performance in dynamically downscaling the precipitation over two typical South American regions: one orographically complex area in Ecuador/Peru (horizontal resolution up to 9 and 3 km), and one area of rolling hills in Northeast Brazil (up to 9 km). For this, an extensive ensemble of 32 simulations over two continuous years was conducted. Including the reference uncertainty of three high-resolution global datasets (CHIRPS, MSWEP, ERA5-Land), we show that different parameterization setups can produce up to four times the monthly reference precipitation. This underscores the urgent need to conduct parameterization sensitivity studies before weather forecasts or input for impact modeling can be produced. Contrarily to usual studies, we focus on distributional, temporal and spatial precipitation patterns and evaluate these in an ensemble-tailored approach. These ensemble characteristics such as ensemble Structure-, Amplitude-, and Location-error, allow us to generalize the impacts of combining one parameterization scheme with others. We find that varying the CU and RA schemes stronger affects the WRF performance than varying the MP or PBL schemes. This effect is even present in the convection-resolving 3-km-domain over Ecuador/Peru where CU schemes are only used in the parent domain of the one-way nesting approach. The G3D CU physics ensemble best represents the CHIRPS probability distribution in the 9-km-domains. However, spatial and temporal patterns of CHIRPS are best captured by Tiedtke or BMJ CU schemes. Ecuadorian station data in the 3-km-domain is best simulated by the ensemble whose parent domains use the KF CU scheme. Accounting for all evaluation metrics, no general-purpose setup could be identified, but suited parameterizations can be narrowed down according to final application needs.
1 Introduction
Increasing demands for water until 2050 will aggravate the impacts of water scarcity on agricultural production and livelihood activities (Food and Agriculture Organization of the United Nations, 2015). To successfully deal with this projected development, sustainable management of available water resources is mandatory. For improved decision support in regional water management or agriculture, high-quality regionalized weather and climate forecasting increasingly matters (Soares et al., 2012; Müller et al., 2016) and is a key requirement for successful hydrological and crop impact modeling (Decharme and Douville, 2006; Barbosa and Lakshmi Kumar, 2016; Parkes et al., 2019). Especially in semi-arid regions and areas affected by El-Niño-Southern-Oscillation (ENSO) more profound knowledge of variations in seasonal rainfall, estimated streamflow and crop yield from regionalized model output, can help to better prepare against climate extremes. Here, our focus is on the downscaling of global hydrometeorological fields over two typical regions of South America: one area of rolling hills in Northeast Brazil and one orographically complex area in Ecuador/Peru. Hit by a multiyear drought in the last decade (Marengo et al., 2018; Martins et al., 2018) and strongly influenced by El Niño (Domínguez-Castro et al., 2018), respectively, those regions are facing high climate variability especially during their rainy seasons. Water availability in those regions not only determines the production of rainfed and irrigated agriculture, it also limits the hydroelectric energy production in their highly managed river basins (von Sperling, 2012).
One way to achieve regionalized hydrometeorological information is the application of regional atmospheric models, such as the Weather Research and Forecasting (WRF) model (Skamarock et al., 2008), to dynamically downscale coarse-grained, large-scale fields over selected areas. The performance of regional simulations highly depends on the used physical parameterization model setup, and it may vary from region to region. Therefore, these models need to be adapted in their physical setting to the region of interest. Sub-grid scale processes such as cloud microphysics (MP), cumulus convection (CU), planetary boundary layer physics (PBL), and radiation physics (RA) are parameterized in these models, and their choice and combination highly influences the modeled hydrometeorological variables (Flaounas et al., 2011; Crétat et al., 2012; Yang et al., 2012; Zhang et al., 2012; Efstathiou et al., 2013; Klein et al., 2015; Que et al., 2016; Gbode et al., 2019; Yang et al., 2021). As precipitation amounts result from the complex interaction of the applied physical schemes, they combine all uncertainties due to the model setup and are a major source of impact model uncertainty (e.g., Decharme and Douville, 2006; Barbosa and Lakshmi Kumar, 2016; Parkes et al., 2019). This study therefore focuses on the performance of the WRF setup in terms of reproduction of precipitation patterns.
Comprehensive parameterization studies are common practice to decide on the best-suited regional model setup before conducting operational weather forecasts, long-term climate projections or impact studies. Previous WRF parameterization studies, relevant for our focus regions, did not reach high resolutions below 10 km for regional applications (e.g., 30 km in the Amazon basin; Fersch and Kunstmann, 2014), chose a very limited domain (e.g., 15 km resolution over a 225 × 225 km domain in Southern Ecuador; Ochoa et al., 2016), included only parts of our study domains (e.g., 40 km resolution over South America between −10° and −50°S; Ruiz et al., 2010), did not pursue a full factorial combination of applied physics schemes (e.g., high-resolution runs at 18–6–3 km over the Peruvian Andes; Moya-Álvarez et al., 2018) or studied only short-term events (e.g., high-resolution runs at 25–5–1.66 km in Northeast Brazil for a 10-day period; Comin et al., 2020). Ochoa et al. (2016) and Ruiz et al. (2010) further lacked a profound analysis with respect to the effects of different physics schemes on precipitation. Fersch and Kunstmann (2014) already showed difficulties of the different WRF setups in reproducing the observed precipitation. Our study therefore aims at a detailed, multi-target evaluation tailored for the use of ensembles (ensemble-tailored) of the conducted high-resolution WRF physics ensemble runs including four CU, two MP, two PBL, and two RA physics in a full-factorial combination of physics schemes over a continuous 2-years period. With high-resolution, daily, global gridded precipitation reference data available, the regionalized WRF precipitation at target resolutions of 9 and 3 km can be extensively validated: gridpoint-based, domain-based and feature-based, allowing the consideration of different aspects needed when used as input for spatially distributed impact models or for running regional climate projections or weather forecasts. We first demonstrate the necessity of model parameterization studies in these regions of South America, and then differentiate the impact of different physical parameterization schemes on the distributional, temporal and spatial patterns of the high-resolution dynamically downscaled precipitation fields.
2 Methods
2.1 WRF Model Configuration
The Weather Research and Forecasting (WRF) model is a numerical weather prediction (NWP) model, used for both research and operational applications (Skamarock et al., 2008). In this project, WRF Version 3.9.1 with the Advanced Research WRF (ARW) solver was used for dynamical downscaling. Initial and lateral boundary conditions for our simulations were used from interpolated data of the European Center for Medium-Range Weather Forecasts (ECMWF) Re-Analysis (ERA) Interim (Dee et al., 2011) with a spatial resolution of 79 km, 60 vertical levels and a model top at 0.1 hPa. The initial and lateral boundary conditions used in WRF are wind components, temperature, water vapor, surface pressure, sea surface temperature (SST) and soil moisture, all of them in different atmospheric and soil height levels, respectively. The boundary conditions were updated at every WRF model time step from the linearly interpolated 6-hourly global fields.
The spatial setup of WRF consists of four domains, with the first domain (SA27) representing the 27-km-resolution parent domain with 288 × 206 grid points. In a 1-way nested approach (no feedback), the horizontal grid resolution was stepwise increased from 27 km (SA27) to 9 km (EP9 and NB9), and finally to 3 km (EP3, Figure 1). This last step to 3 km was only performed over the highly mountainous Ecuadorian-Peruvian region to be able to represent topographically induced processes. Over the topographically more homogeneous Brazilian region, the final horizontal grid resolution was 9 km. The simulated time step was 90 s for SA27 with a parent time step ratio of 1:3. For some simulations, the time step of SA27 needed to be reduced to 30 s for numerically stable simulations. In the vertical, the domains consisted of 100 terrain-following hydrostatic pressure levels with a model top at 10 hPa.
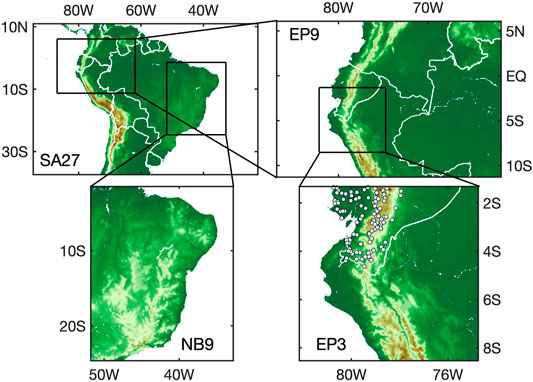
FIGURE 1. Regional dynamical downscaling over the Ecuadorian-Peruvian and Brazilian domain. In a nested approach, the input data of the ERA-Interim reanalyses is downscaled to 27 km (SA27), 9 km (EP9) and 3 km (EP3) over Ecuador-Peru and to 9 km (NB9) over Northeast Brazil. The dots in EP3 represent 106 selected precipitation gauges of the Ecuadorian Weather Service INAMHI that have less than 5% of missing values during Jul 2006–Jun 2008.
Simulations were continuously run over a period of 2.5 years (Jan 2006 to Jun 2008) to capture different wet and dry conditions during the rainy and dry seasons of the regions and including a 6-months spin-up for soil moisture equilibrium adjustment. In their sensitivity study on the effect of spin-up length to atmospheric variables like precipitation and 2-m temperature, Jerez et al. (2020) recommend a six-months spin-up period as the best compromise between required computational expense and any remaining imbalance of the soil subsystem. Analyzing the behavior of relative soil moisture content in different parameterization experiments for the 2.5 years simulation period suggests that a 6-months period is sufficient for obtaining the dynamical soil moisture equilibrium in all domains (not shown). The time period from Jan 2006 to Jun 2008 was chosen to obtain continuous simulations of medium years in the domains with respect to precipitation (Figure 2A). To allow for a better representation of regionalized climatological conditions, these years were further selected to be within the period of maximum assimilated observations in the atmospheric analysis component of ERA-Interim from 2002 till 2010 (Dee et al., 2011; Simmons et al., 2014). Ochoa et al. (2016) further recommend to include ENSO neutral years for physics parameterization studies, as high uncertainties can be introduced by ENSO especially in the western coastal regions of Ecuador and Peru. The inclusion of El-Niño-years would be an additional research question and would require the simulation of at least 10 years to average out the strong effects of El Niño. This study focuses on years with typical average climatological conditions. By excluding the spin-up period, we focus our analysis on the period Jul 2006–Jun 2008. For the validation against gridded reference data, the WRF grid was bilinearly interpolated from 9 km to 0.1° for EP9 and NB9, and from 3 km to 0.05° for EP3. For the comparison with station observation data, the nearest grid cell to the station location of the 3 km EP3 grid was used. The relaxation zones of the nested domains were omitted for the analysis.
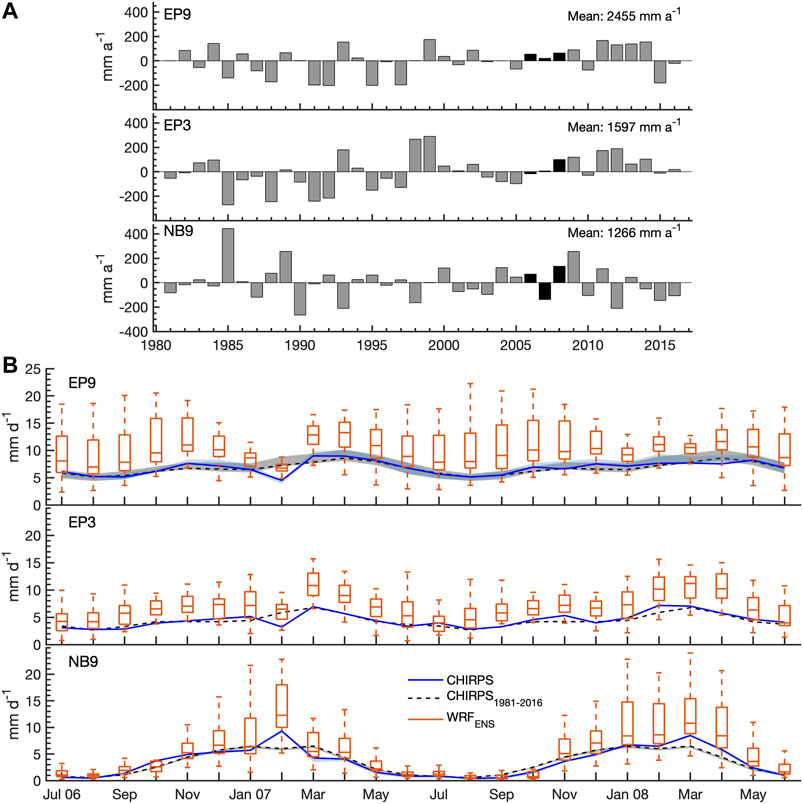
FIGURE 2. (A) Annual domain-averaged precipitation anomalies (mm a−1) of CHIRPS for EP9 (upper), EP3 (middle) and NB9 (lower) with respect to the climatological mean from 1981 to 2016. Simulated years of 2006–2008 are marked with black. (B) CHIRPS timeseries and 1981–2016 climatology, together with WRF ensemble uncertainty of monthly domain-averaged precipitation (mm d−1) for Jul 2006 till Jun 2008 for EP9 (upper), EP3 (middle) and NB9 (lower). The uncertainty in the reference data by including MSWEP and ERA5-Land for EP9 and NB9 is depicted by shaded areas.
2.2 Tested WRF Physics Parameterization Schemes
Testing all possible combinations of all available physics schemes for several years is computationally too expensive. Therefore, we chose a representative sample of WRF physics schemes, including different levels of complexity and formulation of particular processes. For precipitation generation, the cumulus and microphysics schemes are mainly responsible, representing convective and non-convective precipitation, respectively. Testing four different CU schemes, our main focus is on the performance of CU schemes that are already reported to have major impact on the simulated precipitation among the different physics scheme groups (Crétat et al., 2012; Sikder and Hossain, 2016; Ochoa et al., 2016; Yang et al., 2021), particularly in regions producing predominantly convective precipitation like in the tropics. However, also different MP, PBL and RA schemes largely contribute to precipitation uncertainties (Klein et al., 2015; Ulate et al., 2014; Efstathiou et al., 2013; Flaounas et al., 2011), especially for high spatial resolution <5 km for which convective processes are expected to be captured and CU schemes should not be used (Hsiao et al., 2013; Skamarock et al., 2008). For this reason, we also tested two different schemes each for MP, PBL and RA. In total, 32 simulations from the full factorial combination of the selected schemes were run (Table 1). Regarding land surface physics parameterizations, we fixed the Noah Land surface model (LSM; Chen and Dudhia, 2001), with soil temperature and moisture in four levels, for all runs, as previous studies (e.g., Crétat et al., 2012; Tariku and Gan, 2017) found smaller effects of different LSMs over the amount of precipitation compared to the other mentioned physics parameterization groups. Using the nested approach, all study domains (Figure 1) were run in one simulation at the same time using the same physics setup. For the 3-km-domain, CU schemes were not used, but explicitly resolved convection was assumed.
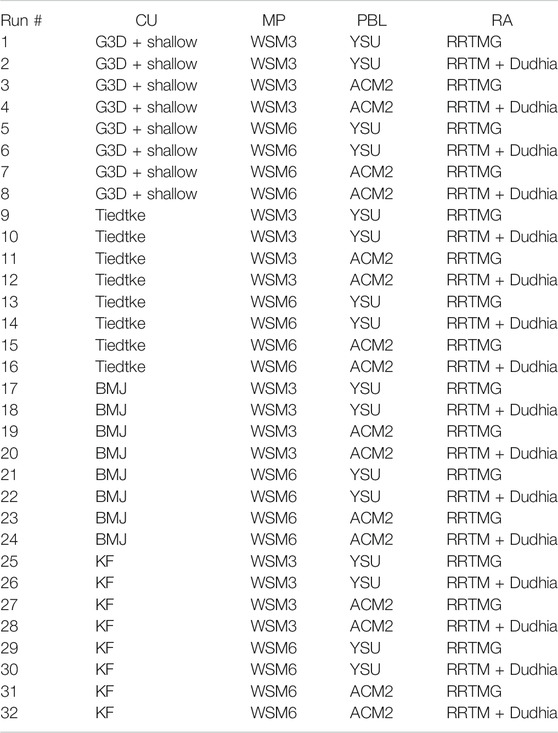
TABLE 1. Tested 32 WRF setups of parameterization combinations of 4 cumulus convection (CU), 2 microphysics (MP), 2 planetary boundary layer (PBL), and 2 radiation (RA) physics schemes.
The cumulus physics schemes manage subgrid-scale convection processes and shallow clouds. The timing and location of cumulus convection is controlled by a trigger function, and the adjustment method controls how profiles of temperature and moisture are modified according to the triggering in the convection scheme. The used schemes of Grell-3 (improved Grell-Devenyi scheme; G3D, Grell and Dévényi, 2002; Skamarock et al., 2008), New Tiedtke (Tiedtke, Zhang and Wang, 2017) and the modified version of Kain-Fritsch (KF, Kain and Fritsch, 1990; Kain, 2004) are mass-flux schemes. Mass-flux schemes have explicit updrafts to transport air from the updraft source layer upwards while reducing the convective available potential energy (CAPE). They also include compensating environmental subsidence, i.e., downdrafts, around clouds. Among the mass-flux schemes, G3D produces an ensemble of triggers and closures (determines cloud strength) and feeds back the ensemble mean to the model. G3D is especially suitable for small grid sizes as it allows the spreading of subsidence effects to neighboring grid columns (Skamarock et al., 2008). However, this subsidence spreading is only recommended for grid sizes ≤5 km (Skamarock et al., 2008; Grell and Freitas, 2014) and is therefore not used for the 9 km domain. For G3D, also the shallow convection (“ishallow”), i.e., an additional scheme for non-precipitating shallow clouds by enhanced mass-flux, is used. In contrast to the other schemes, Tiedtke is able to include momentum transport. The fourth used scheme of Betts–Miller–Janjic (BMJ, Janjic, 1994; Janjic, 2000) is based on convective adjustment of atmospheric profiles to post-convective (mixed) soundings and does not have explicit updrafts or downdrafts. In contrast to the others, BMJ also does not include cloud and ice detrainment at the cloud top.
Microphysics schemes produce clouds by resolved-scale radiative, dynamical or convective processes. They include latent heat release, cloud and precipitation processes and different particle types associated with the phase changes of water between the vapor, liquid and solid phases (Skamarock et al., 2008). The microphysics therewith provide atmospheric heat and moisture tendencies, as well as resolved-scale surface precipitation. The conditions at grid cells, e.g., supersaturation or temperature below 0°C, −40°C, determine the distribution of water among the represented species. For our study, we chose the WRF single moment 3-class simple ice scheme (WSM3) and the more complex WRF single moment 6-class (WSM6) scheme. WSM3 (Hong et al., 2004) includes simulated mixing ratios for water vapor (Qv), cloud ice crystals (Qi), and snow (Qs) and their interactions below 0°C, as well as water vapor (Qv), cloud liquid water (Qc), and rain liquid water (Qr) and their interactions above 0°C. Compared to WSM3, WSM6 (Hong and Lim, 2006) also represents graupel (Qg) and more interactions between the classes. Both WSM3 and WSM6 do not include hail (frozen drops, Qh) and do not predict number concentrations of species like double moment schemes.
Planetary boundary layer physics schemes control sub-grid-scale vertical fluxes of heat, momentum and other quantities like moisture via eddy transports in the whole atmospheric column. To obtain turbulent fluxes, a closure scheme is needed to relate the unknown turbulent flux terms in the equations to known variables like mean state or gradients. Whether fluxes depend on local or nonlocal values and gradients defines if mixing with nearby (local) or distant (nonlocal) grid cells is allowed. The two selected schemes of Yonsei University (YSU, Hong et al., 2006) and Asymmetrical Convective Model version 2 (ACM2, Pleim, 2007) are both first-order closures. YSU is a nonlocal closure scheme and explicitly treats the entrainment layer at the PBL top based on results from large-eddy simulations. As a hybrid local-nonlocal scheme, ACM2 combines explicit nonlocal exchange of the surface layer to all layers above with local eddy diffusion between the other layers and the immediately next layer above, together better representing the effect of diurnal heating (Pleim, 2007).
Radiation physics schemes are used to describe longwave and shortwave radiation processes, including absorption, reflection, and scattering, and they determine the heating of the ground and the atmosphere. We tested the combination of the rapid radiative transfer model (RRTM, Mlawer et al., 1997) for longwave radiation and the Dudhia shortwave scheme (Dudhia, 1989), and the rapid radiative transfer model for general circulation models (RRTMG, Iacono et al., 2008) for both longwave and shortwave radiation. Whereas shortwave Dudhia only performs downward integration of the solar flux per column, shortwave RRTMG considers both downward and upward (reflected) fluxes. In contrast to shortwave RRTMG, Dudhia has no ozone effect that would maintain a warm stratosphere. Both shortwave Dudhia and longwave RRTM work with a binary cloud fraction (0/1), whereas RRTMG includes subgrid-scale cloud variability with a statistical method of maximum-random cloud overlap in different layers. Longwave RRTMG uses the same basic physics and absorption coefficients as longwave RRTM, but includes some modifications to improve computational efficiency.
2.3 Validation Reference Datasets
For the validation of simulated WRF precipitation, the steady decrease in the number of precipitation gauges and the lack of a consistently best-performing global dataset (Lorenz et al., 2014) has to be kept in mind. Especially in Northeast Brazil and coastal Ecuador-Peru, the number of rain gauges dramatically decreased between 1980 and 2009 (Lorenz et al., 2014). Hence, for the validation of WRF precipitation, we focus on global publicly available daily datasets of different observational origin, that are natively provided at roughly the horizontal resolution of the WRF domains of 9 and 3 km. We use 1) blended gauge-satellite precipitation estimates of the Climate Hazards Group Infrared Precipitation with Stations version 2.0 (CHIRPS, Funk et al., 2015), 2) merged precipitation estimates from satellite and reanalysis data of the Multi-Source Weighted-Ensemble Precipitation version 2.1 (MSWEP, Beck et al., 2019), and 3) a pure reanalysis product of a land component replay of the ECMWF ERA5 (Hersbach et al., 2020) climate reanalysis (ERA5-Land, ECMWF, 2019).
The CHIRPS dataset is quasi-global (50°S–50°N) and has a spatial resolution of 0.05°. It is available from 1981 to near present, as a daily, pentadal and monthly precipitation dataset (Funk et al., 2015). In their final product, best available precipitation gauge data are blended with high resolution cold-cloud-duration-based rainfall estimates producing precipitation fields that are, as a monthly product, similar to gridded monthly station data of those like Global Precipitation Climatology Center (GPCC, Becker et al., 2013) or University of Eeast Anglia’s Climate Research Unit (CRU, Harris et al., 2014).
The MSWEP dataset wants to take full advantage of the complementary strengths of gauge, satellite and reanalysis data (Beck et al., 2017, 2019). Applying weighted averages of precipitation anomalies of gauge observations, satellite remote sensing and atmospheric model reanalyses, MSWEP provides reliable global 3-hourly precipitation estimates at a horizontal resolution of 0.1° from 1979 to 2017 (Beck et al., 2019).
ERA5-Land (ECMWF, 2019) provides hourly data at a horizontal resolution of 0.1° from 1981 to 2–3 months before the present. Despite no direct usage of observations in the production of ERA5-Land, the assimilation of observations in the ERA5 atmospheric forcing as well as the lapse rate correction of input air temperature, air humidity and pressure in the interpolation step ensure a high quality and high resolution information of surface variables.
For the comparison with the high resolution domain EP3, precipitation station data was provided by the national weather service of Ecuador (INAMHI) for the coastal and Andes region of Southern Ecuador. For our analysis, we included up to 132 stations having less than 5% of missing values during the WRF simulation period. Precipitation was measured from 07 to 07 am local time (12–12 UTC). The usage of local station data, though only for a limited part of the domain, should provide an indication for the robustness of obtained results.
2.4 Analysis Methods
For the performance analysis of the WRF ensemble, the WRF runs are grouped according to their applied physics parameterization schemes (similar to Klein et al., 2015). This ensemble approach generalizes the impact of and allows to identify the uncertainties introduced by individual physics schemes. For the four cumulus physics groups, each ensemble consists of eight members using the respective scheme. The two microphysics, two planetary boundary layer and two radiation physics groups have 16 members each.
For the validation of timeseries of domain average precipitation, we use the Taylor diagram (Taylor, 2001) which allows to compare the standard deviation, Pearson correlation coefficient and root mean square difference (RMSD) of the simulations and the reference in a single plot.
For the spatial verification of the simulated precipitation fields, we apply the ensemble Structure-Amplitude-Location (eSAL) analysis (Radanovics et al., 2018; Wernli et al., 2008, 2009) to daily precipitation fields of each domain. This feature-based method compares the simulated ensemble with a reference field in terms of amplitude A, i.e., the total precipitation of the domain, location L, i.e., the location of the center of mass of the total domain and the location of the centers of mass of individual precipitation features, and structure S, i.e., the size and shape, or volume, of the precipitation features. Any contiguous gridpoints of precipitation above a given threshold are defined as a precipitation feature or object. This threshold is independently calculated for the simulation ensemble and the reference field as R95 × f, with R95 being the 95th percentile of all nonzero gridpoint values in the domain for the current timestep (Radanovics et al., 2018). For the simulations,
f is thus always set to 1/15, except if this resulted in a threshold below the minimum reasonable nonzero value of 0.01 mm in the data (Radanovics et al., 2018). Both S and L depend on this threshold. In general, eSAL is only defined for nonzero precipitation fields in both the reference field and in at least one ensemble member of the simulations.
The ensemble amplitude error is defined as the relative difference of the ensemble mean
eA ranges from −2 to 2, with perfect agreement for eA = 0, too little simulated precipitation for eA < 0 and too high simulated precipitation for eA > 0. The ensemble structure error (eS) determines the relative difference of the ensemble mean
with
Here, rri is the precipitation sum of all connected gridpoints in feature i and
The ensemble location error (eL) consists of two parts, relating to both the entire domain (eL1) and individual features (eL2):
eL1 is defined as the relative distance of the ensemble mean
where d is the largest distance between two domain borders and
with
and
Here, xi is the coordinate vector of the center of mass of precipitation in the feature i. For the reference field, the cumulative distribution function Pref is a step-function. Both L1 and L2 range between 0 and 1. A value of L = 0 defines a perfect ensemble in terms of location. L = 2 would be found for total centers of mass located at the opposite domain border (eL1 close to 1) and for contrarily organized features, e.g., far from each other in one field and close to each other in the other field (eL2 close to 1).
2.5 Climatological Domain Characteristics
According to CHIRPS, the 9-km-Ecuador-Peru (EP9) domain that includes parts of Brazil, Colombia and Venezuela, has a mean annual precipitation of 2,455 mm. The smaller 3-km-Ecuador-Peru (EP3) domain shows a long-term mean of 1597 mm a−1. With 1266 mm a−1, the 9-km-Northeast-Brazil (NB9) domain exhibits the lowest value. Yearly precipitation anomalies for EP9 and EP3 reach up to ±200 and ±300 mm a−1, respectively, and for NB9 even up to ±400 mm a−1 (Figure 2A). In most years, annual domain-averaged precipitation anomalies of EP9 and EP3 have the same sign, but with different magnitudes. The years 2006–2008 are characterized by small positive precipitation anomalies around 50 mm a−1 for EP9. In the smaller domain EP3, the conditions in 2006 and 2007 roughly correspond to the long-term mean value, and the year 2008 is wetter by 100 mm a−1. For NB9 a wet year in 2006 alternates with a dry year in 2007 and another wet year in 2008 with anomalies up to ±140 mm a−1. In sum, the selected years 2006–2008 are a continuous period of mean precipitation conditions in the domains well suited for the WRF physics ensemble simulations.
Most of South America is dominated by a monsoon-like seasonal cycle of precipitation, with strongly contrasting conditions during austral winter and summer (Grimm, 2003; Gan et al., 2004). Correspondingly, NB9 has a distinct wet and dry season in austral summer and winter, respectively, with mean-monthly precipitation ranging between 0 and 6 mm d−1 for CHIRPS (Figure 2B). EP9 and EP3 show a less pronounced seasonal cycle with a range between 5 and 9 mm d−1, and 3 and 7 mm d−1, respectively, which seems to be related to the spatial average over different precipitation regimes (Grimm, 2003; Celleri et al., 2007). Maximum domain-averaged monthly mean precipitation in EP9 is found between March and May, in EP3 between February and April, and in NB9 between January and March (Figure 2B). The observational uncertainty when further including MSWEP and ERA5-Land as reference data is up to 2 mm d−1 for EP9 and up to 0.5 mm d−1 for NB9. For the analysis period of Jul 2006–Jun 2008, major deviations from the climatological mean are evident for February 2007 for all domains, with drier conditions in EP9 and EP3, and wetter conditions in NB9. For March 2007, anomalies reverse for EP9 and NB9 with wetter and drier conditions, respectively. Distinct positive anomalies are further found for NB9 in March and April 2008.
3 Results
3.1 Necessity of Model Parameterization Studies
For the selected 2-years analysis period, the simulated WRF ensemble uncertainty in domain-averaged monthly mean precipitation is shown in the boxplots of Figure 2B. Among differently parameterized simulations, the simulated precipitation can deviate by up to 20 mm d−1 when the respective reference precipitation is around 6 mm d−1. Both too dry and too wet WRF simulations are possible, though with an overall tendency of overestimation in all three domains. By demonstrating this large ensemble spread of simulated precipitation over EP9, EP3 and NB9, the necessity for the present model parameterization study becomes evident. The ensemble spread is by far higher than the uncertainty introduced by the different reference datasets that range between 1 and 2 mm d−1 for EP9 and around 0.5 mm d−1 for NB9. A remarkably lower WRF ensemble spread (<5 mm d−1) is only found for the distinct dry season of the Northeast Brazil domain (NB9) and for the anomalously dry February 2007 in the 9-km-Ecuador-Peru- domain (EP9).
To further demonstrate the necessity of model parameterization studies based on a spatial pattern evaluation, the WRF-simulated precipitation is compared against gridded observations from CHIRPS. This is shown exemplary for the three-months season of JFM within the rainy season in 2007 (Figures 3–5) in which largest interannual variability was evident for all three domains (Figure 2B). For CHIRPS, the JFM season is characterized by mean precipitation mainly above 4 mm d−1 in all three domains (Figures 3–5 CHIRPS). In EP9 (Figure 3A CHIRPS), high precipitation values >10 mm d−1 are evident especially in the Amazon region of West Brazil, Southeast Bolivia, at the Border of Ecuador–Peru (also for EP3, Figure 5A CHIRPS) and in the Andes region of North Ecuador, Bolivia and Peru. Values below 4 mm d−1 are found in the northern domain borders of Bolivia and Venezuela, as well as at the Peruvian coast and in the lee of the Ecuadorian Andes (also for EP3, Figure 5A CHIRPS). In NB9 (Figure 4A CHIRPS), values above 10 mm d−1 concentrate at the northwestern domain border, whereas low precipitation amounts of <4 mm d are found in the easternmost region and in the core of Northeast Brazil around 10°S and 40°W.
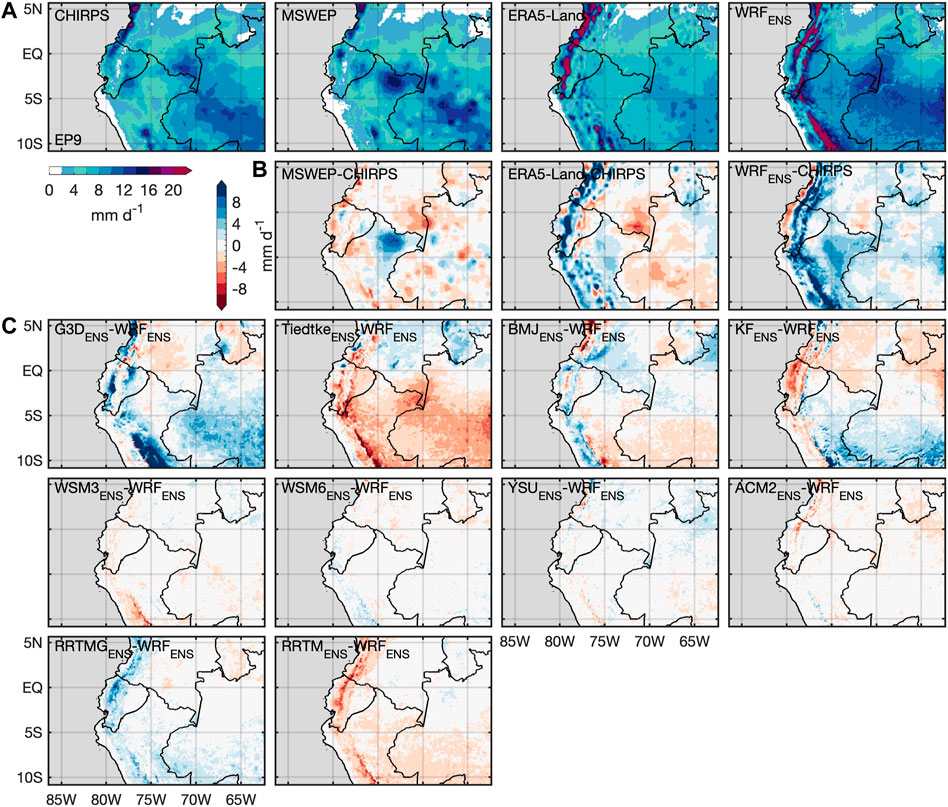
FIGURE 3. (A) Observed and simulated mean precipitation in JFM 2007 of CHIRPS, MSWEP, ERA5-Land and WRF ensemble median (WRFENS) over EP9. (B) Bias of MSWEP, ERA5-Land and WRFENS against CHIRPS. (C) Deviation of the parameterization sub-ensemble median from WRFENS.
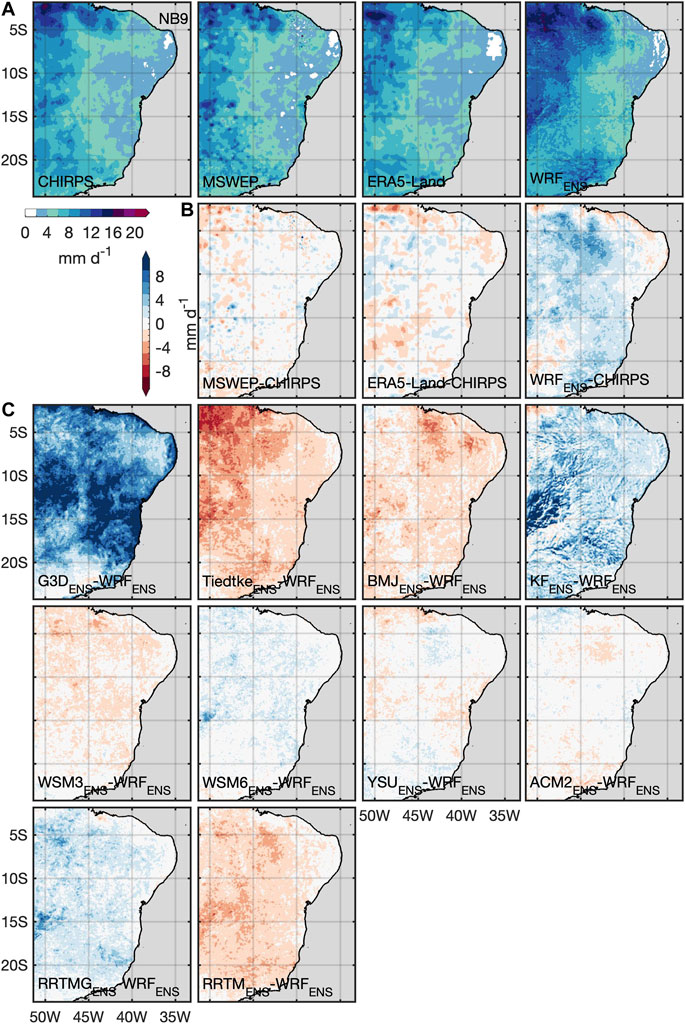
FIGURE 4. As Figure 3, but for NB9.
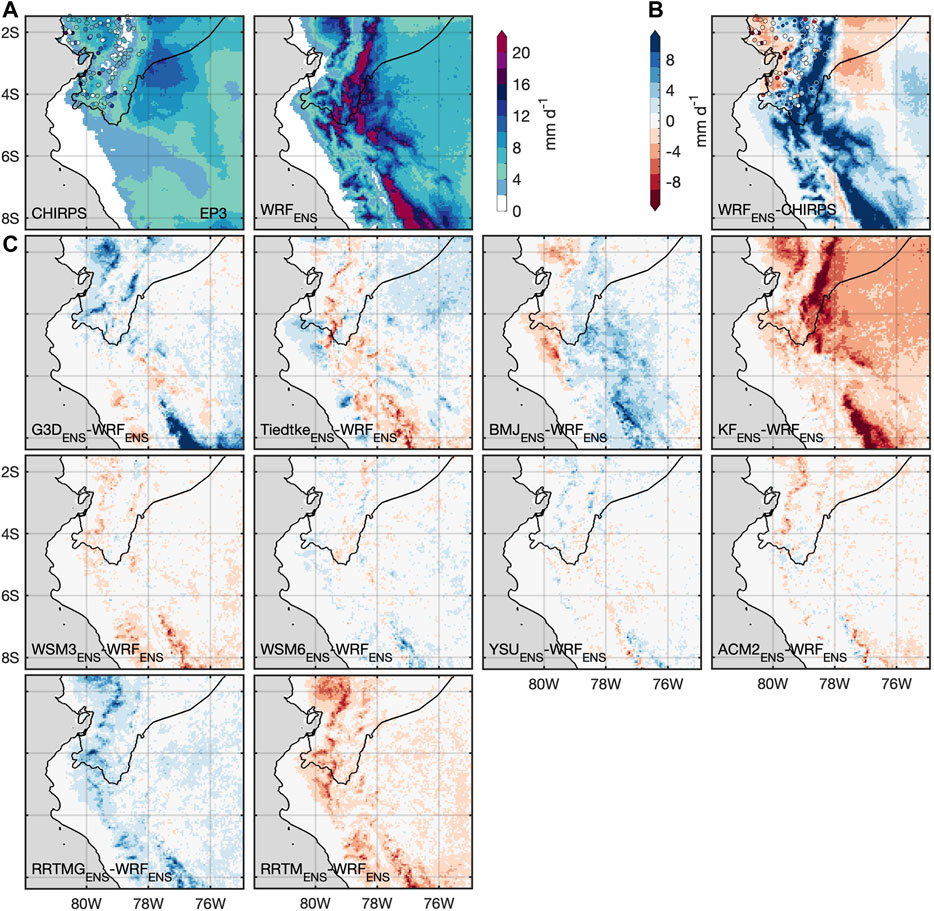
FIGURE 5. As Figure 3, but for EP3. Apart from CHIRPS, in (A) JFM mean precipitation values of and (B) WRFENS bias against 132 INAMHI stations having less than 5% of missing values during JFM 2007 are shown.
To also provide a spatial overview of reference uncertainty, fields of precipitation (Figures 3A, 4A) and biases against CHIRPS (Figures 3B, 4B) of MSWEP and ERA5-Land are presented for EP9 and NB9. For EP3, precipitation of INAMHI stations is shown along with CHIRPS (Figure 5A). Whereas only small and little structured deviations around ±2 mm d−1 against CHIRPS can be observed for MSWEP and ERA5-Land in NB9 (Figure 4B), larger bias of MSWEP or ERA5-Land against CHIRPS, i.e., larger reference uncertainty, is found for EP9 (Figure 3B). Here, ERA5-Land shows wetter conditions especially for the mountainous Andes region, in parts by more than 10 mm d−1. Drier conditions by around 4 mm d−1 are found for the Amazon region in West Brazil and Southeast Colombia. MSWEP is rather drier than CHIRPS by around 4 mm d−1, only the Amazon region in Northeast Peru shows wetter conditions. INAMHI station data and CHIRPS generally coincide for Southwest Ecuador in EP3, only some stations deviate from CHIRPS where both higher and lower values of mean precipitation are possible.
In all three domains, the WRF ensemble median (WRFENS) shows an overall positive bias against CHIRPS, especially for the mountainous regions with more than 10 mm d−1 (Figures 3–5 WRFENS). Only some coastal and inland areas are drier than CHIRPS. For EP3 (Figure 5B WRFENS), WRFENS bias against INAMHI station data generally follows the patterns of bias against CHIRPS, with a too dry simulated Ecuadorian coast and too wet simulated Ecuadorian mountain regions. Especially for EP3, higher resolved topography in WRF seems to play a role as more distinct features of higher precipitation amounts are evident in the Andes region at the Ecuador-Peru border and in the southern part of the domain. CHIRPS does not show these distinct features, resulting in a large positive bias of WRFENS. For the Ecuadorian Andes, the lack of station data within the area of largest positive bias of WRFENS against CHIRPS can also not bring further clarity to this high simulated precipitation by WRF.
To illustrate the divergence within the WRF ensemble for different applied parameterization schemes, the WRF ensemble is grouped into several sub-ensembles that all use one fixed parameterization scheme. For example, the G3DENS or RRTMGENS encompass all eight or 16 runs, respectively, that use the G3D cumulus or RRTMG radiation physics scheme. The deviation of the median of these sub-ensembles from the total WRFENS is shown in Figures 3–5. In all three domains, the variation of the deviations from WRFENS is largest within the CU and RA sub-ensembles. The MP and PBL sub-ensemble medians rather represent WRFENS. Only slight tendencies of wetter runs for WSM6ENS and drier runs of WSM3ENS are found. For the cumulus sub-ensembles in EP9 (Figure 3C), G3DENS and TiedtkeENS, as well as BMJENS and KFENS seem to behave in opposite ways: the G3DENS simulates more precipitation especially for the mountainous (more than +10 mm d−1) and Brazilian Amazon (up to +6 mm d−1) region whereas TiedtkeENS gives less precipitation in these regions with similar magnitudes. Opposite behavior for G3DENS and TiedtkeENS is also found north of the equator with a drier tendency for G3DENS and a wetter tendency for TiedtkeENS. A similar north-south division of positive and negative deviations from WRFENS is evident for BMJENS and KFENS that also behave in opposite ways, but with smaller magnitudes than G3DENS and TiedtkeENS. For NB9 (Figure 4C), the picture is more clear: G3DENS and KFENS compose the wetter runs of WRFENS, whereas TiedtkeENS and BMJENS yield drier conditions. Similar to EP9, highest magnitudes of deviations from WRFENS are found for G3DENS with large areas above +10 mm d−1 and for TiedtkeENS with regions especially in the Northwest and West up to −8 mm d−1. For EP3 (Figure 5C), the deviations from WRFENS among the CU sub-ensembles are more diverse. The pattern of higher (less) precipitation in the Andes region of G3DENS and BMJENS (TiedtkeENS and KFENS) of EP9 passes through to EP3. However, the negative deviations from WRFENS in the Andes region seem to be even amplified for EP3 KFENS, whereas the negative deviations of EP3 TiedtkeENS are dampened compared to EP9. Here, it needs to be recalled that EP3 was simulated with explicit convection, i.e., the CU parameterization was switched off. However, for the parent domain EP9 the respective CU parameterizations were active. For the radiation sub-ensembles, in all three domains, RRTMGENS composes the wetter part of WRFENS, whereas RRTMENS builds the drier part of WRFENS with similar magnitudes up to around ±6 mm d−1.
3.2 Gridpoint-Based Validation
Figures 6, 7 show the discrete probability distribution for daily gridpoint-based precipitation of the parameterization sub-ensembles compared to the different reference datasets for EP9, NB9 and EP3. Regardless of the domain, probability distributions of CHIRPS, MSWEP and ERA5-Land differ strongly and seem to be characterized by different shape and scale parameters when compared to theoretical probability distributions like the Gamma distribution. Whereas highest probabilities of MSWEP and ERA5-Land are found for lowest daily precipitation amounts below 1 mm d−1, the CHIRPS probability distribution has its maximum around 7 mm d−1 and shows a strong decline of probabilities toward lower precipitation amounts. For both EP9 and NB9, MSWEP has an exponential decrease of probabilities and shows lower probabilities than CHIRPS for precipitation values between 8 and 20 mm d−1. For EP9 (Figure 6A), greatly enhanced probabilities of ERA5-Land precipitation between 5 and 18 mm d−1 are found compared to both CHIRPS and MSWEP, with a rather constant than exponential decrease. For NB9 (Figure 6B), the probability distribution of ERA5-Land has a more exponential decrease and resembles the one of CHIRPS after CHIRPS’s maximum. For EP3, CHIRPS shows the lowest probabilities of precipitation below 2 mm d−1. The INAMHI station data in EP3, however, show high probabilities of low precipitation values and low probabilities of precipitation above 20 mm d−1.
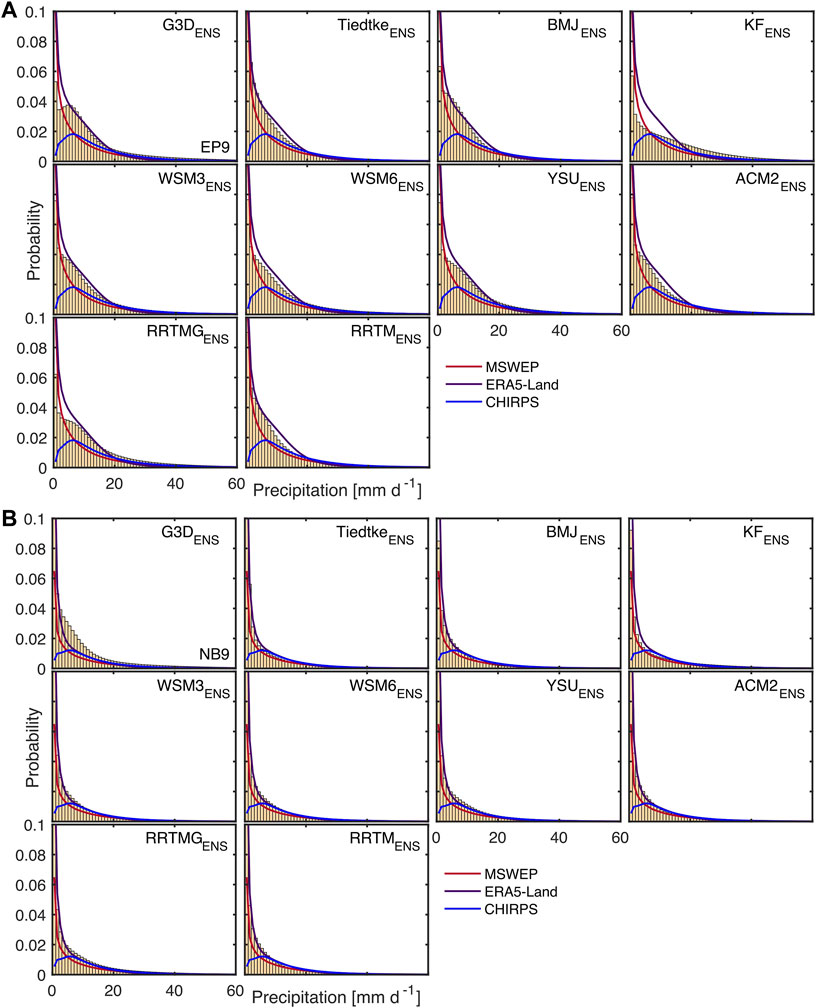
FIGURE 6. Probability distribution of the parameterization sub-ensembles compared to CHIRPS, MSWEP and ERA5-Land for daily gridpoint-based precipitation of (A) EP9 and (B) NB9 from Jul 2006 till Jun 2008.
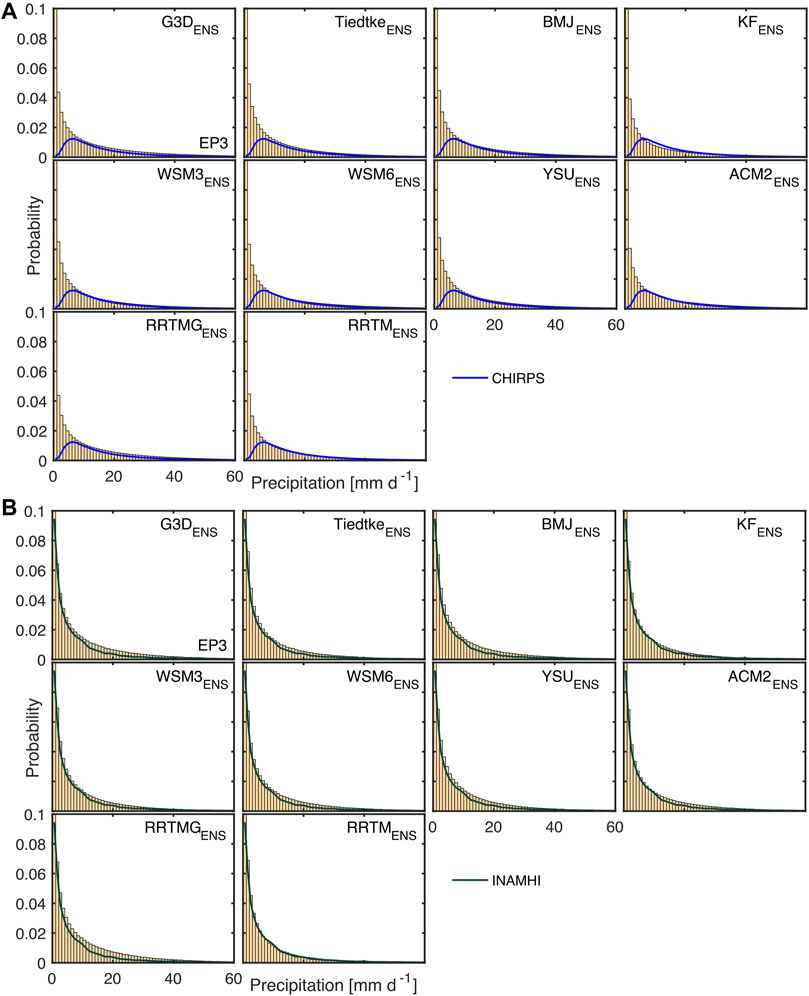
FIGURE 7. As Figure 6, but for EP3, with (A) CHIRPS reference data and (B) INAMHI station data. For (B), WRF data interpolated to the location of the 106 selected stations was used.
Regarding the probability distributions of the WRF sub-ensembles, largest differences in their shape and scale are found among the sub-ensembles for EP9 (Figure 6A). With respect to CHIRPS, all probability distributions of the sub-ensembles of EP9 show too high probabilities especially for precipitation amounts <19 mm d−1. The only exception is KFENS, that matches the probabilities for CHIRPS’s maximum, but overestimates those for both lower and higher precipitation amounts. Apart from the in general overestimated probabilities, the shape of CHIRPS’s probability distribution is best represented by the one of G3DENS for values >2 mm d−1. No probability distribution of any sub-ensemble resembles the one of MSWEP. With respect to ERA5-Land, TiedtkeENS and RRTMENS best reproduce the shape, only with slightly underestimated probabilities for precipitation amounts between 8 and 19 mm d−1. Like those of MSWEP and ERA5-Land, the probability distributions of the WRF sub-ensembles show the general problem of overestimated probabilities for small precipitation values <1 mm d−1, i.e., model drizzle. Lowest probabilities of drizzle rain is found for the G3DENS among the cumulus groups and for RRTMGENS among the radiation physics groups. For drizzle rain, about equal performance is found for the microphysics and planetary boundary layer physics groups. In sum for EP9, the parameterization sub-ensembles can be grouped in mainly two classes (classification also in comparison with the other used parameterization scheme for the same physics topic): 1) monotonous to exponential decrease of probabilities with highest probabilities for drizzle rain (TiedtkeENS, KFENS, WSM6ENS, ACM2ENS, RRTMENS), and 2) drizzle rain with highest probabilities, but enhanced probabilities also for medium precipitation amounts around 5 mm d−1 and exponential decrease thereafter (G3DENS, BMJENS, WSM3ENS, YSUENS, RRTMGENS).
For NB9 (Figure 6B) and EP3 (Figure 7), such a clear distinction between the shape of the probability distribution of the different sub-ensembles is not valid. Rather, their shape is characterized by an exponential decrease with highest probabilities for drizzle rain. For NB9 (Figure 6B), only G3DENS does not show an explicit exponential decrease for values between 4 and 15 mm d−1. YSUENS further has slightly enhanced probabilities around 8 mm d−1. For EP3, the WRF gridpoints interpolated to INAMHI station locations in general show higher probabilities of precipitation than for the entire EP3 domain. KFENS and RRTMENS best represent the distribution of the INAMHI station data.
3.3 Domain-Based Validation
In the Taylor diagrams (Figures 8, 9A), domain averaged timeseries of daily precipitation of all individual WRF runs are evaluated with respect to their Pearson correlation coefficient (CORR), standard-deviation (STD), and root-mean square difference (RMSD) as compared to CHIRPS. For EP9 and NB9 (Figure 8), the values of CORR, RMSD and STD of MSWEP and ERA5-Land compared to CHIRPS demonstrate a lower uncertainty within the reference than within the WRF ensemble. Both MSWEP and ERA5-Land have high CORR (both around 0.93 for NB9; around 0.78 and 0.87 for ERA5-Land and MSWEP for EP9), and low RMSD (both around 2.2 mm d−1 for NB9; around 2 and 1.6 mm d−1 for ERA5-Land and MSWEP for EP9) as compared to CHIRPS. The respective STD of CHIRPS is around 3.2 and 3.3 mm d−1 for EP9 and NB9. The STDs of MSWEP and ERA5-Land are around 2.4 and 2.8 mm d−1 for EP9, and around 2.9 and 3.4 mm d−1 for NB9, respectively. The comparison of WRFENS against CHIRPS for EP9 and NB9 (Figure 8) reveals in general higher CORR with smaller spread for NB9 (0.74–0.85) than for EP9 (0.28–0.64), but also higher spread of RMSD and STD for NB9 (RMSD: 1.7–5.6 mm d−1, and STD: 2–7.6 mm d−1) than for EP9 (RMSD: 2.6–5.2 mm d−1, and STD: 2.4–5.1 mm d−1).
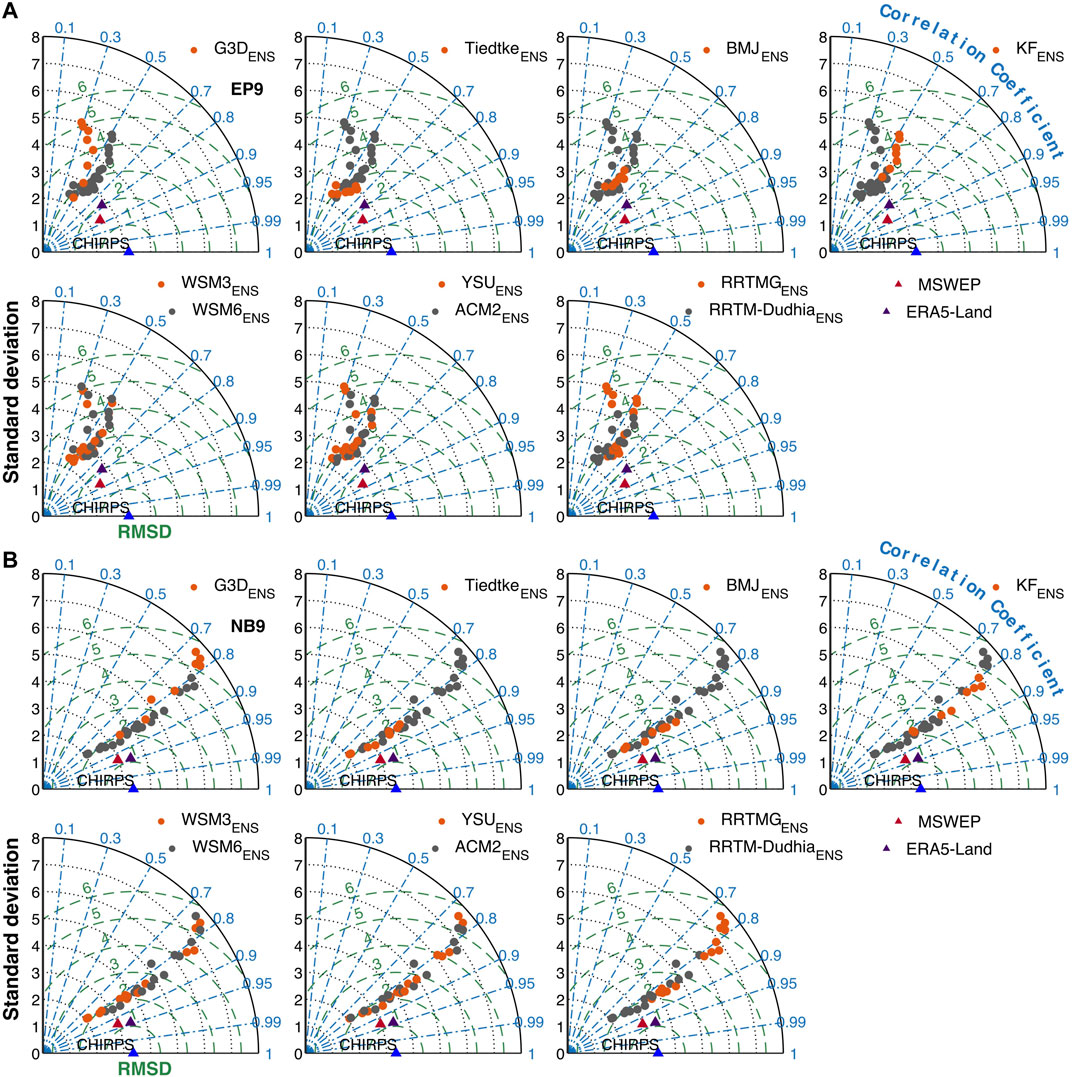
FIGURE 8. Taylor diagram for (A) EP9 and (B) NB9 including the Pearson correlation coefficient (dashed-dotted lines), the standard deviation (dotted lines, in mm d−1) and the root-mean-square difference (RMSD) of the anomalies (dashed lines, in mm d−1) between the simulated daily precipitation timeseries of the 32 WRF physics ensemble members and CHIRPS reference data for the period Jan 2006–Jun 2008. Each panel shows the differences in the physics parameterization sub-ensembles, i.e., cumulus convection (G3D, Tiedtke, BMJ, KF), microphysics (WSM3, WSM6), planetary boundary layer (YSU, ACM2), and radiation physics (RRTMG, RRTM-Dudhia).
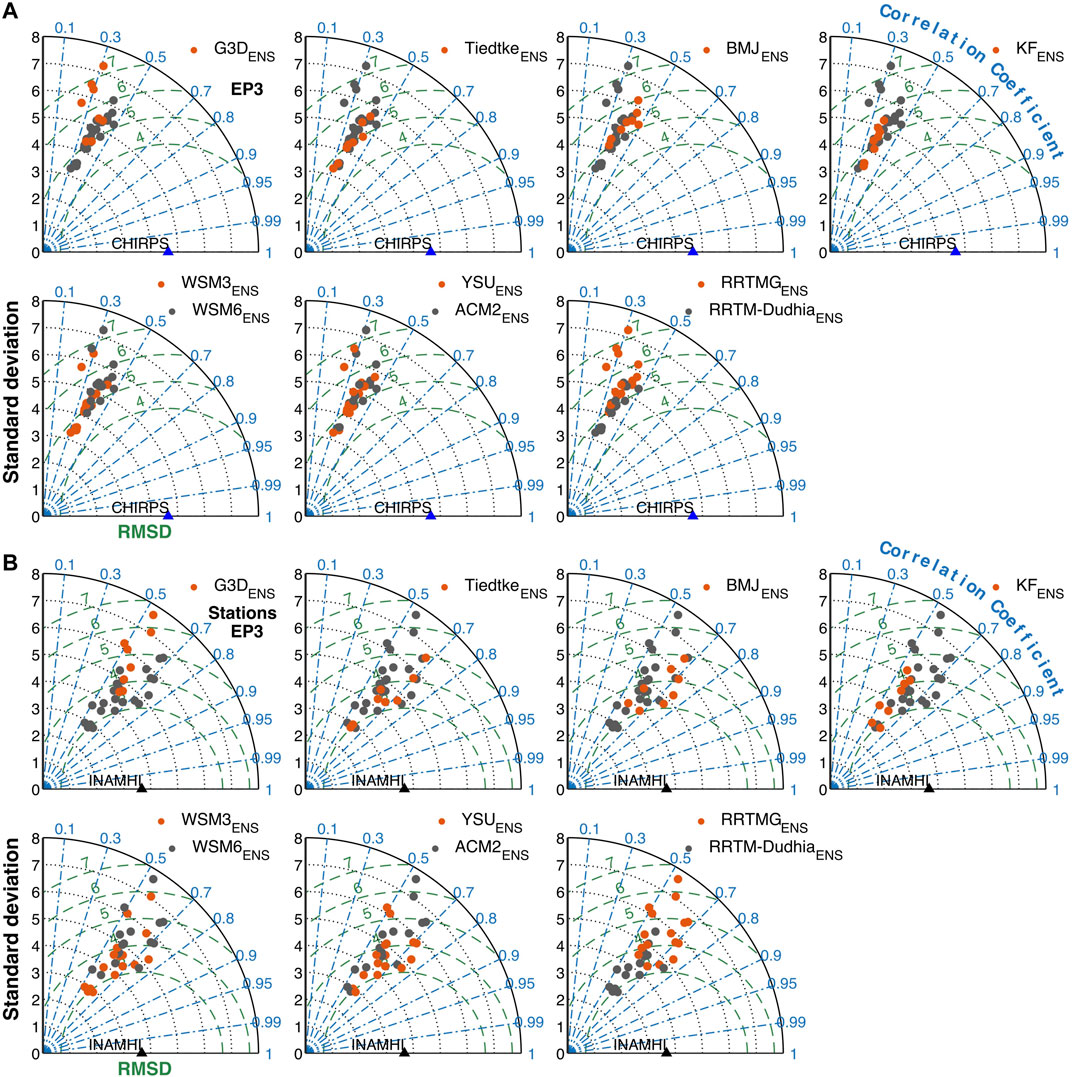
FIGURE 9. As Figure 8, but for EP3, with (A) CHIRPS reference data and (B) INAMHI station data. A direct comparison of CHIRPS and INAMHI station data on a daily scale in one plot as in Figure 8 for MSWEP and ERA5-Land is not possible due to different accumulation times of 00 UTC–00 UTC (CHIRPS) and 12 UTC-12 UTC (07–07 am local time, INAMHI stations), respectively. For the comparison with INAMHI stations, the mean of the 106 selected stations or respective modeled nearest grid-cell data was used.
For EP3, in addition to CHIRPS, further comparison is made against timeseries of INAMHI station data (Figure 9B). Here, higher CORR is found against INAMHI station data (0.48–0.75) than against CHIRPS (0.25–0.49). RMSD ranges between 4.6 and 7.3 mm d−1 against CHIRPS and between 2.7 and 6.5 mm d−1 against INAMHI station data. CHIRPS has a STD of around 4.6 mm d−1, whereas INAMHI station data has its STD around 3.7 mm d−1. Due to interpolation to station locations and considered gaps in the timeseries of INAMHI stations, the STD of WRFENS differs in the comparison against CHIRPS and INAMHI station data. It ranges between 3.2 and 7.2 mm d−1 for the entire domain and entire analysis period (CHIRPS), and between 2.8 and 7.6 mm d−1 for INAMHI station locations and periods.
Regarding different parameterization sub-ensembles, largest differences are found for the CU schemes for all three domains. The two sub-ensembles of both the MP and PBL schemes cover the entire possible range of values without clear tendencies. Among the CU sub-ensembles, G3DENS has the largest variance with respect to CORR, RMSD and STD with a tendency toward the ensemble’s lowest CORR, highest RMSD and highest STD. TiedtkeENS encompasses runs with lowest RMSD and STD and medium to high CORR. BMJENS is characterized by medium to high CORR, medium RMSD and STD, and KFENS shows medium CORR, high RMSD and STD. Only for EP3 (Figure 9), the rating especially of KFENS within the entire WRF ensemble differs, with low to medium RMSD and STD when compared both against CHIRPS and INAMHI station reference data. Among the RA sub-ensembles, RRTMGENS gives lower CORR, higher RMSD and STD than RRTMENS for all three domains.
3.4 Feature-based Validation
The overall domain precipitation as well as the feature-based location and volume of individual precipitation patterns in the WRF sub-ensembles are validated in the ensemble Structure-Amplitude-Location analysis (eSAL) of Figures 10–12. In general, for all three domains, reference domain average precipitation <5 mm d−1 of CHIRPS is mostly overestimated by WRFENS (eA > 0) and associated with too large or too flat modeled precipitation features (eS > 0) and large location error eL. The overestimation of small reference domain average precipitation is more pronounced for EP9 and EP3 than for NB9. Larger reference domain average precipitation is correctly estimated (eA ≈ 0), or slightly over- or underestimated, and shows smaller eL and too small or too peaked modeled precipitation features (eS < 0) in comparison to CHIRPS.
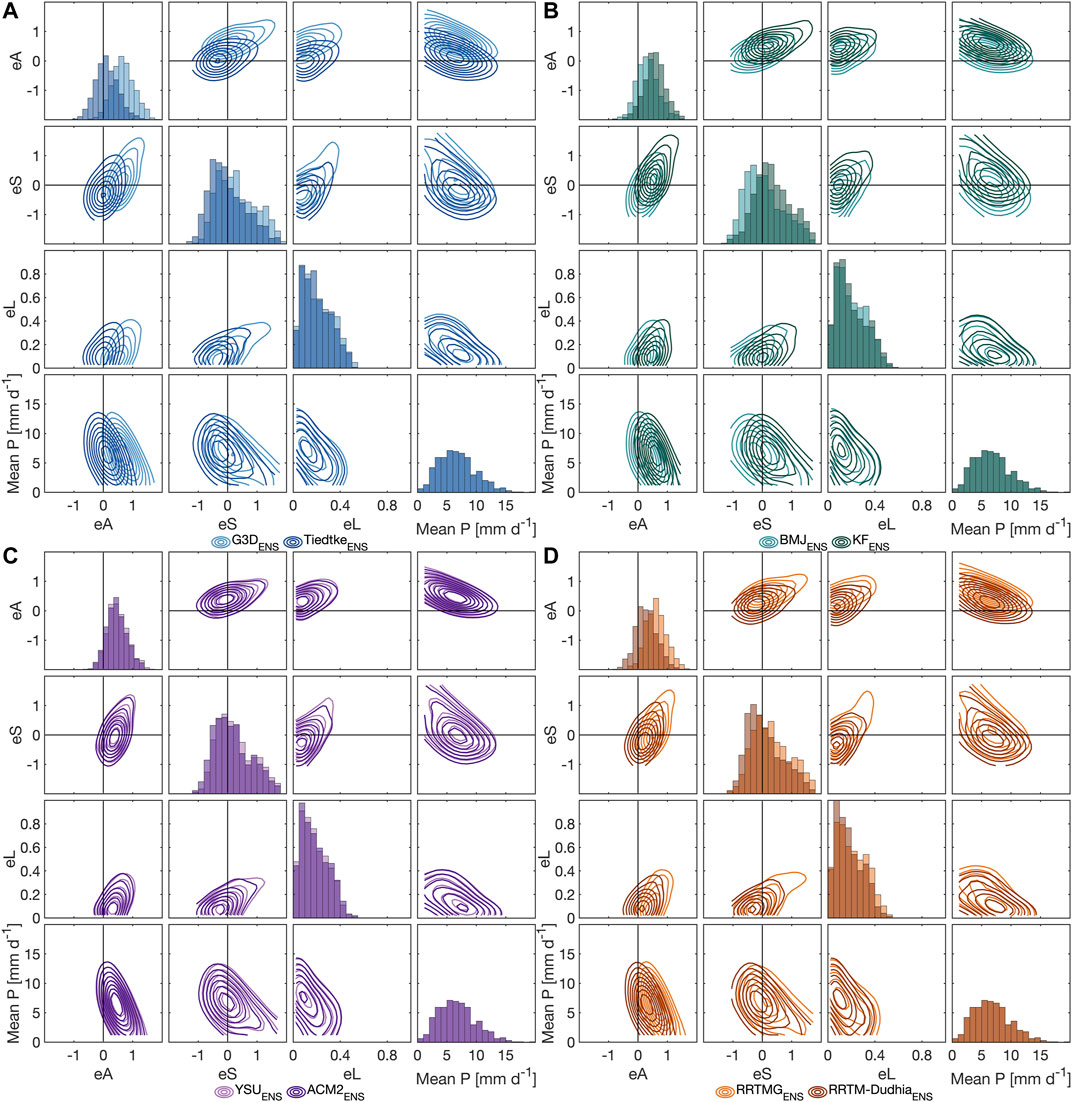
FIGURE 10. Ensemble Structure-Amplitude-Location (eSAL) analysis for EP9 with respect to CHIRPS for the physical parameterization sub-ensembles of (A) G3D and Tiedtke (B) BMJ and KF (C) YSU and ACM2, and (D) RRTMG and RRTM-Dudhia. For each physics sub-ensemble, eA, eS, eL and the reference domain average precipitation (Mean P) are juxtaposed in density contour plots of daily values from Jul 2006 till Jun 2008. The diagonal shows the probability histograms of eA, eS, eL of the respective physics ensemble and of the reference domain average precipitation (Mean P). When the transparently colored probability histograms of eA, eS, or eL overlap, darker colors are produced. As all different parameterization groups use CHIRPS as reference, histograms of reference mean P always overlap.
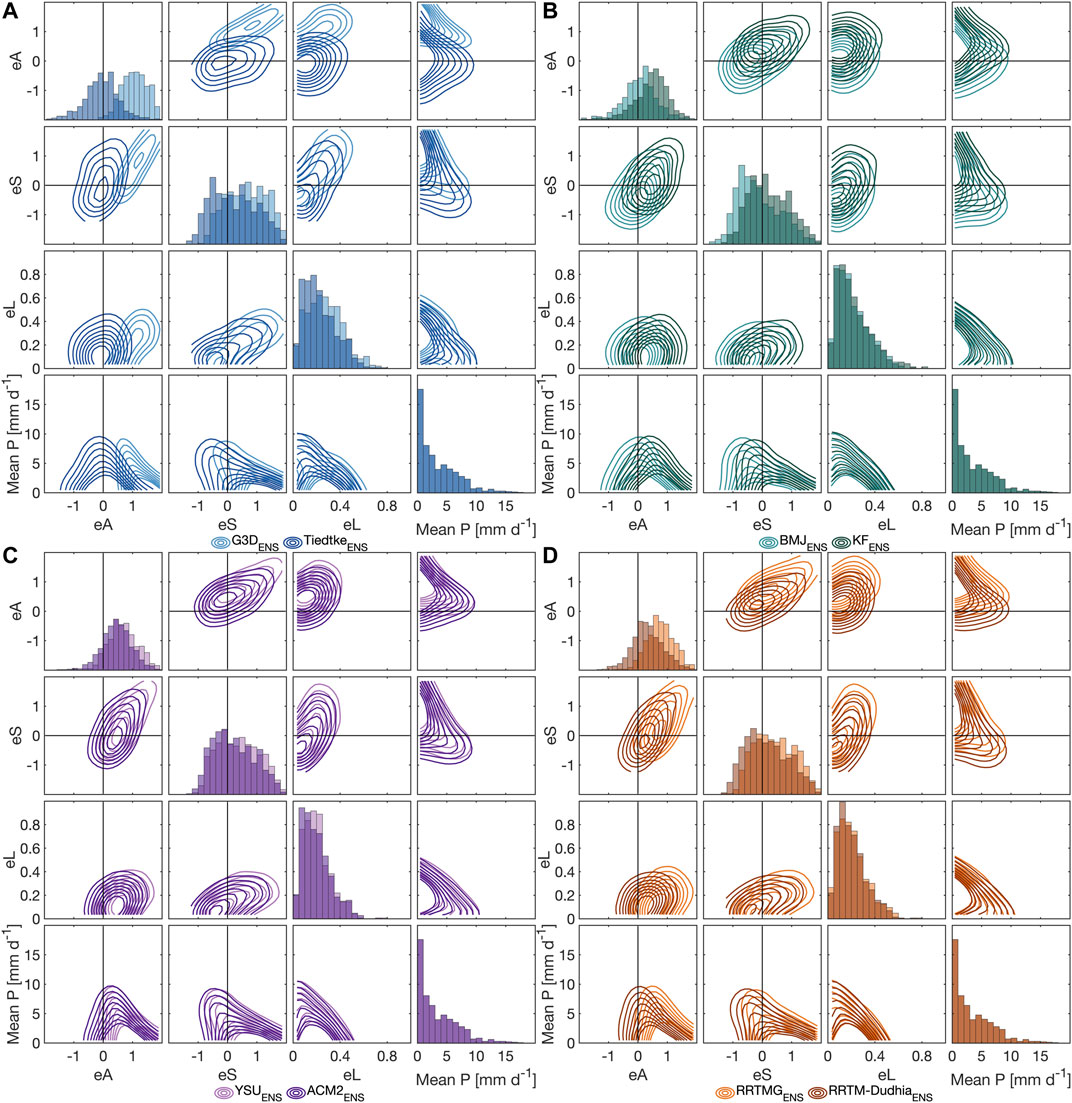
FIGURE 11. As Figure 10, but for NB9.
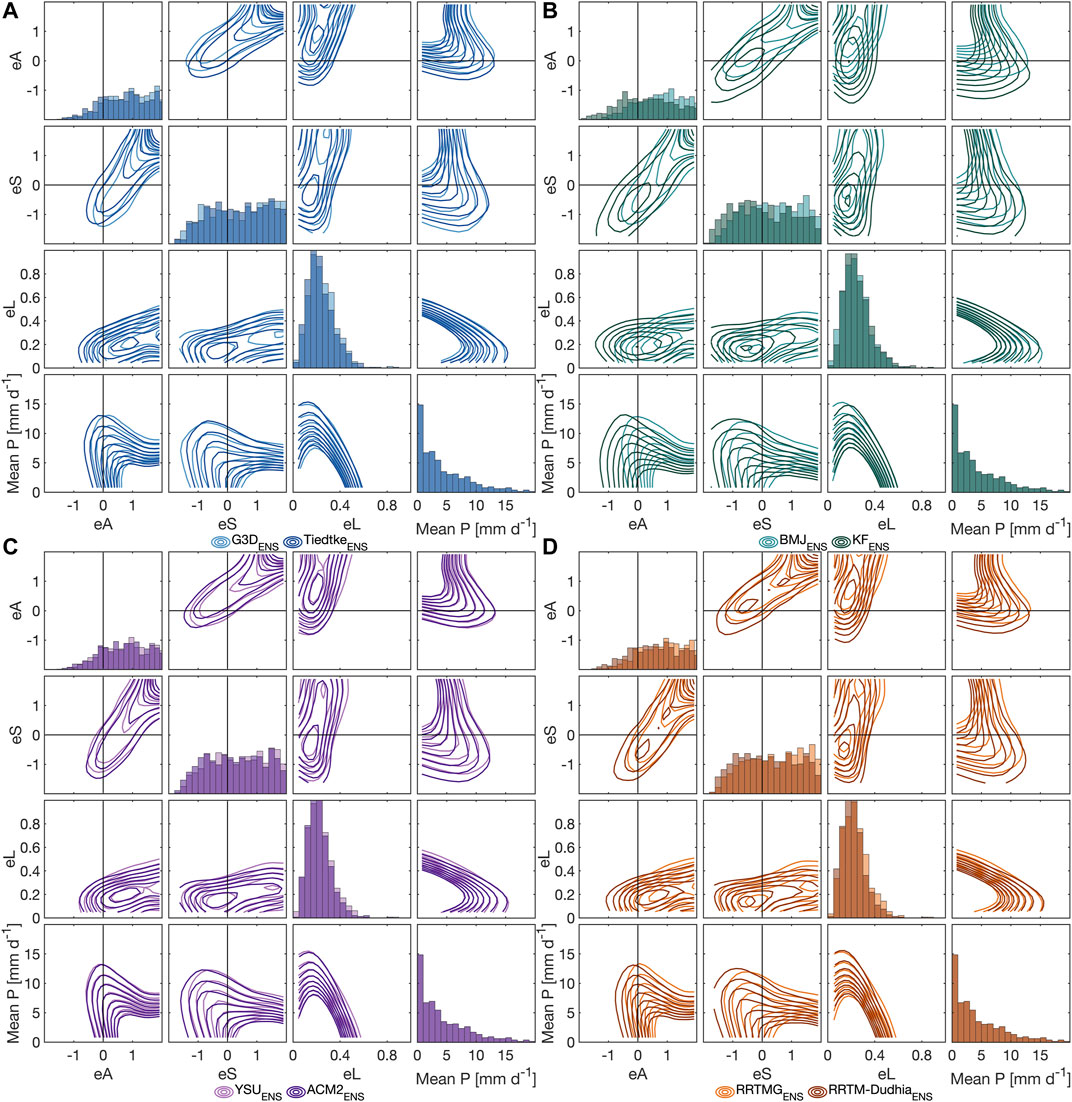
FIGURE 12. As Figure 10, but for EP3.
As for previous analysis measures in Sections 3.2 and 3.3, largest impact on the performance of WRF runs in eSAL, especially for EP9 and NB9, is given by the choice of different CU schemes, followed by different RA schemes (Figures 10, 11A,B,D). eSAL characteristics for different evaluated PBL (Figures 10, 11C), or MP (see Supplementary Material) sub-ensembles are almost identical. For EP9 (Figure 10), best eSAL characteristics among the CU schemes are found for TiedtkeENS. TiedtkeENS shows highest density for correlated eA ≈ 0 and eS ≈ 0, together with a high density of small eL. The overestimation of reference domain average precipitation <5 mm d−1 is smallest. For NB9 (Figure 11), even both over- and underestimation for TiedtkeENS is possible, but highest density is found for eA ≈ 0. BMJENS and KFENS for both EP9 and NB9 have the disadvantage of high density of either eA > 0 or eS < 0. For NB9, however, both BMJENS and KFENS show even better eL than TiedtkeENS. For both domains, G3DENS generally overestimates domain average precipitation. Its structure and location error is similar to KFENS for EP9, whereas for NB9 both largest location errors and positive structure errors of G3DENS especially for low reference precipitation are evident. Among the RA schemes, RRTMENS seems to be preferable with a generally smaller amplitude error, as well as smaller structure and location errors in particular for EP9. Whereas no distinction can be made for EP9 regarding the PBL sub-ensembles, ACM2ENS tends toward smaller amplitude, structure and location error than YSUENS for NB9.
For EP3 (Figure 12), the performance of WRFENS against CHIRPS with respect to eA and eS is poorer and shows a higher variance than for EP9 or NB9. High positive eA is common, and both positive and negative structure errors occur frequently. Location errors are similar to NB9, with lower values than for EP9. A clear distinction between different sub-ensembles turns out to be harder than for EP9 or NB9. Only the KFENS has clearly different behavior with a tendency of underestimation of domain average precipitation (eA < 0) and too small or too peaked modeled precipitation features (eS < 0). As in EP9, RRTMENS tends toward smaller amplitude error than RRTMGENS, and rather too small or too peaked modeled precipitation (eS < 0) compared to RRTMGENS with rather too large or too flat modeled precipitation (eS < 0).
4 Discussion and Conclusion
In all evaluated categories for the physics sub-ensembles in terms of deviation from the total WRF physics ensemble (gridpoint-based probability distributions, domain-averaged characteristics of standard deviation, correlation, root-mean square difference and bias, and spatial feature-based structure and location), switching between different cumulus physics (CU) schemes resulted in the largest performance variability, followed by the radiation physics (RA) schemes. The large spread among the CU sub-ensembles confirms the strong impact of different CU schemes on the simulated precipitation in the study regions. Even for the explicitly resolved convection in EP3, the effects of CU schemes used in the parent domains is still larger than those of different microphysics (MP) or planetary boundary layer physics (PBL) schemes, but in the same order of magnitude as between different RA schemes. Regarding the deviations from the ensemble median for the CU sub-ensembles, many areas reached more than ±6 mm d−1, whereas different MP and PBL sub-ensembles deviated only by around ±2 mm d−1 (Figures 3–5). In Klein et al. (2015), such large variations between different CU sub-ensembles were not observed for West Africa. Instead, these deviations were mainly in the order of ±3 mm d−1 for almost all tested CU, and in the same range as those of the MP and PBL sub-ensembles. Klein et al. (2015) further showed an overall dry bias for WSM3 compared to more sophisticated schemes, and for ACM2 compared to YSU in the Sahel and Sudano-Sahel regions. Similar, but not as pronounced tendencies within the MP and PBL schemes as in Klein et al. (2015) could be observed for our South American regions. An overestimation of precipitation by KF and an underestimation by BMJ for Northeastern Africa found by Pohl et al. (2011) and Tariku and Gan (2017), is of course relative to their respective reference, however, opposing behavior of BMJ and KF sub-ensembles with respect to the deviation from the WRF ensemble median was also evident for our focus regions. An observed wetter climate for RRTMG than for RRTM reported by Tariku and Gan (2017) can also be confirmed for all our domains. Especially for EP9, the generally small differences between WSM3 and WSM6 sub-ensembles could be related to the limited necessity of using a graupel scheme (e.g., WSM6) for horizontal resolutions above 10 km (Skamarock et al., 2008). Obviously, the 9-km-domain is still in a “gray zone” of only partly resolved updrafts producing graupel and the simpler WSM3 scheme gives similar results. However, also the convection-resolving 3-km-grid of EP3 does not produce large differences between WSM3 and WSM6 sub-ensembles for all evaluated metrics, which should be expected from Hong and Lim (2006). Thus for our study, independent of the grid resolution, the tested MP schemes introduced less uncertainties than the CU or RA schemes but similar uncertainties as the PBL schemes with respect to analyzed precipitation distributional, temporal and spatial patterns. The generally weak dependency of the modeled precipitation on the MP treatment in our study could also have its origin in the choice of tested MP schemes. Other studies (e.g., Liu et al., 2011; Klein et al., 2015) that found larger differences between MP schemes not only used single moment schemes like WSM3 and WSM6, but also used more complex double moment schemes predicting number concentration of the water and ice species that are not part of the WRF-MP series (WRF single or double moment schemes). Here, further studies are needed to investigate if the weak dependency on MP schemes still holds for more complex MP schemes.
Regarding our choice of CU schemes, it should be noticed that the 9-km grid size is at the upper end of the convective “gray zone” and we only used conventional parameterizations of convection such as BMJ, Tiedtke, and KF. These are constructed so that the parameterization acts self-contained within one grid column, assuming that the proportion of the grid column covered by active convection is small. With small grid sizes, however, this assumption is no longer valid (Grell and Freitas, 2014). G3D allows subsidence spreading to neighboring grid cells, however, this is recommended only for even smaller grid sizes (Skamarock et al., 2008; Grell and Freitas, 2014). For the 9-km-domain, it is thus assumed that the subsidence still takes place in the same grid column and G3D therefore acts conventionally. Scale-aware cumulus schemes like Grell–Freitas (Grell and Freitas, 2014) or the updated multi-scale KF (Zheng et al., 2016) attempt to smooth the transition to cloud-resolving scales by increasing deactivation of the parameterization with increasing grid resolution. However, the parameterization is still quite active at 9 km and Jeworrek et al. (2019) found a comparable performance of the scale-aware msKF and GF schemes to the conventional cumulus schemes such as BMJ, Tiedtke and KF at 9 km. For the scale-aware msKF and GF, the contribution of the resolved-scale precipitation from the microphysics scheme was comparable to BMJ at 9 km; Tiedtke even produced substantially more resolved-scale precipitation at 9 km (Jeworrek et al., 2019). This example shows that the application of conventional cumulus schemes is still justifiable at 9 km grid resolution. However, especially with respect to the conventional KF, the msKF may be preferred: In their comparison of conventional KF and msKF at 9 km, Zheng et al. (2016) found superior performance of the msKF in terms of precipitation bias, location and intensity. Future studies should therefore consider to additionally test the scale-aware GF and msKF schemes at 9 km resolution. The inclusion of the simple conventional KF in our study should also be a test in terms of required computational costs, i.e., if the simple and computationally cheap KF scheme is also able to produce reasonable results. Especially as parent domain for the 3 km EP3, KFENS proved to be closest to the reference data.
The comparison of the WRF performance in the 3-km-domain EP3 with explicit convection against the performance in the 9-km-domain EP9 showed that the bias of the WRF ensemble against CHIRPS in this region was not reduced. Also Sikder and Hossain (2016) could not find substantial improvements at higher resolution (3 km) for their mountainous study regions around the Himalaya by disabling cumulus parameterization. Noteworthy, many performance measures are substantially worse for EP3 than for EP9 with respect to CHIRPS: Correlation coefficients below 0.5, RMSD above 4.5 mm d−1 and frequent large amplitude and structure errors for EP3. However, considering the main patterns of precipitation in WRFENS and in CHIRPS for the JFM season of 2007, CHIRPS seems to contain only little topographic precipitation effects from the Andes. An underestimation of precipitation in some mountainous regions by CHIRPS and other thermal-infrared based satellite products is well known (Bai et al., 2018; Dinku et al., 2018). The better performance of WRFENS in terms of correlation and root-mean square difference with respect to INAMHI station data as compared to CHIRPS may thus suggest possible limitations for the use of CHIRPS as reference data for high-resolution simulations in mountainous domains. But still, the areas with largest positive bias above 9 mm d−1 of WRF vs. CHIRPS are also not covered by INAMHI and the general trend of overestimated precipitation around those regions by WRFENS is similarly represented if compared against INAMHI. For the WRF physics sub-ensembles, only KFENS (KF only used in parent domains) is able to diminish these peaks of precipitation overestimation, however leading to a drier Amazon basin in the Northeast of the EP3 domain.
Another aspect revealed for the 3-km-domain EP3 is that the lack of cumulus parameterizations obviously produces very similarly shaped probability distribution functions of precipitation for all parameterization sub-ensembles, including the high probabilities for precipitation below 1 mm d−1, i.e., drizzle, that were partly compensated by G3D, BMJ and KF schemes in the larger 9-km-domain. Interestingly, the INAMHI stations confirm this shape of the WRF histograms with an exponential decrease and with high probabilities for drizzle. CHIRPS contrasts this for EP3 by showing remarkably low probabilities of gridpoint-based daily precipitation values not only up to 1 mm d−1 (as in EP9), but also up to 3 mm d−1, possibly further indicating a limited use of CHIRPS in this region or at the 0.05° resolution. With the harmonization of the probability distributions among the sub-ensembles for EP3, also the strong overestimation of probabilities for heavy precipitation above 20 mm d−1 within the KFENS in EP9 vanished. For EP3, KFENS even represented best the probability distribution of INAMHI station data.
For the two 9-km-domains EP9 and NB9, the strong similarity of probability distributions of TiedtkeENS and ERA5-Land is striking. ERA5-Land gets its atmospheric forcing from ERA5 whose cumulus parameterization is based on Tiedtke (1989) (Hersbach et al., 2020). Precipitation here is only spatially disaggregated from 31 to 9 km and a “lapse rate correction” for altitude is performed in ERA5-Land (ECMWF, 2019). Also bias/deviation patterns for TiedtkeENS and ERA5-Land highly resemble each other, e.g., with a drier Amazon basin and drier Peruvian Andes in EP9 (Figure 3), that seem to be associated with the same underlying cumulus physics.
Finally, we discuss several examples of how the choice of a suitable WRF setup could be made based on the provided performance metrics. Firstly, if one is interested in how precipitation probability distributions might change with future regional climate scenarios, the observed current probability distribution needs to be first and foremost met. The shape of CHIRPS’s statistical distribution of precipitation values for EP9 would be best represented by G3DENS among the CU schemes, and by RTTMGENS among the RA schemes. However, these WRF sub-ensembles generally overestimate the wet-day probability as compared to CHIRPS, thus requiring a frequency correction (see e.g., Lorenz et al., 2020). For other physics sub-ensembles, the more their distributions and the one of the reference differ from each other, the more severe corrections would be required and the deeper one intervenes in precipitation processes. This could probably produce inconsistencies in the precipitation fields especially when not using correction methods including neighboring gridpoints. Such large differences in the distributions would be the case, e.g., when choosing physics schemes like Tiedtke for CU or RRTM for RA when using CHIRPS as a reference. A choice of G3D and RRTMG for best-fit probability distributions for EP9, however, is connected with the highest overestimation of precipitation, largest RMSD and lowest correlation of domain-averaged precipitation of the WRF ensemble. On the other hand, TiedtkeENS or BMJENS and RRTMENS have low structural errors of precipitation features as compared to CHIRPS, as well as high correlation, low RMSD and relatively low amplitude errors for domain averages of EP9. Moreover, the spread of evaluation measures for individual ensemble members within TiedtkeENS or BMJENS is smaller than for other sub-ensembles for EP9, indicating a high robustness of the performance of runs when combining Tiedtke or BMJ with different MP, PBL and RA physics schemes in this domain. So secondly, the schemes of Tiedtke and BMJ would be best suited if the WRF simulations are used for distributed impact models that require spatially and temporally differentiated precipitation input. In particular, these spatial criteria, i.e., where we can expect how much precipitation, that means the location and volume of precipitation patterns, are of interest and have major impact on the model results of, e.g., simulated local streamflow or ecosystem functionality. For NB9, similar choices would be made 1) with G3D for precipitation distributional studies, and 2) with Tiedtke or BMJ when precipitation amplitude and structure, as well as RMSD and correlation of domain-averages should be best comparable to CHIRPS. In the case of NB9, the disadvantages of G3D with respect to precipitation overestimation and too large or too flat structured precipitation patterns is even more pronounced than in EP9, suggesting an even more limited suitability. We further faced the difficulty to have suitable reference data to select a model configuration for the 3-km-resolution EP3 domain, as CHIRPS seemed to fail to provide reasonable precipitation for the mountainous regions. All these examples show the challenges when attempting to identify an overall best suited WRF setup. Similarly to previous studies (e.g., Klein et al., 2015; Yang et al., 2021), also in our two South American example regions, we can not clearly conclude on a single “best” setup for all cases and all evaluation metrics. Synthesizing all applied performance measures in one metric (like in, e.g., Yang et al., 2021; Gbode et al., 2019) looses the contained information on individual performance criteria that are critical for one application but not for another. Whatever choice is finally met, not for all areas and not for all performance metrics this choice is optimal. It continues to depend on the specific requirements and on the application of the WRF output, as well as on the observational reference. Nonetheless, with our applied ensemble-tailored analysis methods for distributional, temporal and spatial patterns, it is possible to narrow down the number of suited parameterizations significantly, allowing this choice according to application needs and reference data.
The use of explicitly resolved convection for the highest-resolved 3-km-domain (while still using CU schemes in the parent domains) revealed that even in this domain without CU schemes still large differences were present between runs whose parent domains used different CU schemes. This effect was even larger than the effect of differently applied MP or PBL physics. This has far-reaching implications: tuning a WRF setup with one input data for initial and boundary conditions, e.g. with the latest ERA5 reanalysis that uses a modified Tiedtke CU scheme (Hersbach et al., 2020), does not allow a direct transfer of the setup to other input data sets that may have different underlying physics parameterizations. Sensitivity tests therefore always should be performed with the final input data set.
Concluding, this study clearly demonstrated the necessity of having a very detailed look at the effects of different physics parameterization schemes on simulated precipitation. In our case, up to four times as high monthly precipitation can be generated compared to three different reference data. This shows that a tremendous gain in model performance can be achieved when the computationally expensive effort of conducting a 32-member parameterization ensemble over two consecutive years is undertaken. Especially for distributed impact modeling, it is further essential that such sensitivity studies are not only based on region-averages, but also comprise spatial pattern analysis tools as used in this study. But only the detailed look at all distributional, temporal and spatial patterns allows a comprehensive overview on how different parameterization schemes effect the simulated precipitation. The presented ensemble-tailored strategy allowed to generalize the impacts of and uncertainties introduced by the chosen parameterization schemes. Though failing in identifying an overall best suited setup for each study region in South America, still a final choice of WRF setup according to the application and reference data is possible that can satisfy the need for the required reliable regional information on precipitation to be employed, e.g., for regional climate adaptation and risk mitigation.
Data Availability Statement
The raw data supporting the conclusions of this article will be made available by the authors, without undue reservation. Reference products of CHIRPS, MSWEP and ERA5-Land used in this study are available at the Climate Hazards Center https://data.chc.ucsb.edu/products/CHIRPS-2.0/, at http://www.gloh2o.org/, and at the Copernicus Climate Data Store https://doi.org/10.24381/cds.e2161bac, respectively.
Author Contributions
TP, PL, CL, and HK developed the research concept. TP performed the model simulations and conceived the analysis. CL managed and provided the used global reference data. NH and MI managed and provided the used station reference data. TP and AJ conducted the analysis. TP summarized the results and wrote the first version of the manuscript. All authors discussed and reviewed the manuscript.
Funding
This work was supported by the funding from the German Federal Ministry of Education and Research (BMBF) for the SaWaM project (Seasonal Water Resources Management: Regionalized Global Data and Transfer to Practice) under the financial assistance agreement No 02WGR1421.
Conflict of Interest
The authors declare that the research was conducted in the absence of any commercial or financial relationships that could be construed as a potential conflict of interest.
Acknowledgments
The authors gratefully acknowledge the Gauss Center for Supercomputing e.V. (www.gauss-centre.eu) for funding this project by providing computing time on the GCS Supercomputer SUPERMUC-NG at Leibniz Supercomputing Center (www.lrz.de) under the project ID pr27ko.
Supplementary Material
The Supplementary Material for this article can be found online at: https://www.frontiersin.org/articles/10.3389/feart.2021.669427/full#supplementary-material
References
Bai, L., Shi, C., Li, L., Yang, Y., and Wu, J. (2018). Accuracy of CHIRPS Satellite-Rainfall Products over Mainland China. Remote Sensing 10, 362. doi:10.3390/rs10030362
Barbosa, H. A., and Lakshmi Kumar, T. V. (2016). Influence of Rainfall Variability on the Vegetation Dynamics over Northeastern Brazil. J. Arid Environ. 124, 377–387. doi:10.1016/j.jaridenv.2015.08.015
Beck, H. E., van Dijk, A. I. J. M., Levizzani, V., Schellekens, J., Miralles, D. G., Martens, B., et al. (2017). MSWEP: 3-hourly 0.25 Global Gridded Precipitation (1979–2015) by Merging Gauge, Satellite, and Reanalysis Data. Hydrol. Earth. Syst. Sc. 21, 589–615. doi:10.5194/hess-21-589-2017
Beck, H. E., Wood, E. F., Pan, M., Fisher, C. K., Miralles, D. G., van Dijk, A. I. J. M., et al. (2019). MSWEP V2 Global 3-Hourly 0.1 Precipitation: Methodology and Quantitative Assessment. Bull. Amer. Meteorol. Soc. 100, 473–500. doi:10.1175/BAMS-D-17-0138.1
Becker, A., Finger, P., Meyer-Christoffer, A., Rudolf, B., Schamm, K., Schneider, U., et al. (2013). A Description of the Global Land-Surface Precipitation Data Products of the Global Precipitation Climatology Centre with Sample Applications Including Centennial (Trend) Analysis from 1901–present. Earth Syst. Sci. Data 5, 71–99. doi:10.5194/essd-5-71-2013
Celleri, R., Willems, P., Buytaert, W., and Feyen, J. (2007). Space–time Rainfall Variability in the Paute Basin, Ecuadorian Andes. Hydrol. Process. 21, 3316–3327. doi:10.1002/hyp.6575
Chen, F., and Dudhia, J. (2001). Coupling an Advanced Land Surface-Hydrology Model with the Penn State-NCAR MM5 Modeling System. Part I: Model Implementation and Sensitivity. Mon. Wea. Rev. 129, 569. doi:10.1175/1520-0493(2001)129<0569:caalsh>2.0.co;2
Comin, A. N., Justino, F., Pezzi, L., de Sousa Gurjão, C. D., Shumacher, V., Fernández, A., et al. (2020). Extreme Rainfall Event in the Northeast Coast of Brazil: a Numerical Sensitivity Study. Meteorol. Atmos. Phys. 112, 39. doi:10.1007/s00703-020-00747-0
Crétat, J., Pohl, B., Richard, Y., and Drobinski, P. (2012). Uncertainties in Simulating Regional Climate of Southern Africa: Sensitivity to Physical Parameterizations Using WRF. Clim. Dyn. 38, 613–634. doi:10.1007/s00382-011-1055-8
Decharme, B., and Douville, H. (2006). Uncertainties in the GSWP-2 Precipitation Forcing and Their Impacts on Regional and Global Hydrological Simulations. Clim. Dyn. 27, 695–713. doi:10.1007/s00382-006-0160-6
Dee, D. P., Uppala, S. M., Simmons, A. J., Berrisford, P., Poli, P., Kobayashi, S., et al. (2011). The ERA-Interim Reanalysis: Configuration and Performance of the Data Assimilation System. Quart. J. Roy. Meteorol. Soc. 137, 553–597. doi:10.1002/qj.828
Dinku, T., Funk, C., Peterson, P., Maidment, R., Tadesse, T., Gadain, H., et al. (2018). Validation of the CHIRPS Satellite Rainfall Estimates over Eastern Africa. Quart. J. Roy. Meteorol. Soc. 144, 292–312. doi:10.1002/qj.3244
Domínguez-Castro, F., García-Herrera, R., and Vicente-Serrano, S. M. (2018). Wet and Dry Extremes in Quito (Ecuador) since the 17th Century. Int. J. Climatol. 38, 2006–2014. doi:10.1002/joc.5312
Dudhia, J. (1989). Numerical Study of Convection Observed during the Winter Monsoon Experiment Using a Mesoscale Two-Dimension Model. J. Atmos. Sci. 46, 3077–3107. doi:10.1175/1520-0469(1989)046<3077:nsocod>2.0.co;2
ECMWF (2019). ERA5-Land Hourly Data from 1981 to Present. Tech. Rep. 11, 29. doi:10.24381/cds.e2161bac
Efstathiou, G. A., Zoumakis, N. M., Melas, D., Lolis, C. J., and Kassomenos, P. (2013). Sensitivity of WRF to Boundary Layer Parameterizations in Simulating a Heavy Rainfall Event Using Different Microphysical Schemes. Effect on Large-Scale Processes. Atmos. Res. 132-133, 125–143. doi:10.1016/j.atmosres.2013.05.004
Fersch, B., and Kunstmann, H. (2014). Atmospheric and Terrestrial Water Budgets: Sensitivity and Performance of Configurations and Global Driving Data for Long Term Continental Scale WRF Simulations. Clim. Dyn. 42, 2367–2396. doi:10.1007/s00382-013-1915-5
Flaounas, E., Bastin, S., and Janicot, S. (2011). Regional Climate Modelling of the 2006 West African Monsoon: Sensitivity to Convection and Planetary Boundary Layer Parameterisation Using WRF. Clim. Dynam. 36, 1083–1105. doi:10.1007/s00382-010-0785-3
Food and Agriculture Organization of the United Nations (2015). http://www.fao.org/3/a-i4560e.pdf
Funk, C., Peterson, P., Landsfeld, M., Pedreros, D., Verdin, J., Shukla, S., et al. (2015). The Climate Hazards Infrared Precipitation with Stations–A New Environmental Record for Monitoring Extremes. Sci. Data 2, 150066. doi:10.1038/sdata.2015.66
Gan, M. A., Kousky, V. E., and Ropelewski, C. F. (2004). The South America Monsoon Circulation and its Relationship to Rainfall over West-Central Brazil. J. Clim. 17, 47–66. doi:10.1175/1520-0442(2004)017<0047:TSAMCA>2.0.CO;2
Gbode, I. E., Dudhia, J., Ogunjobi, K. O., and Ajayi, V. O. (2019). Sensitivity of Different Physics Schemes in the WRF Model during a West African Monsoon Regime. Theor. Appl. Climatol. 136, 121. doi:10.1007/s00704-018-2538-x
Grell, G. A., and Dévényi, D. (2002). A Generalized Approach to Parameterizing Convection Combining Ensemble and Data Assimilation Techniques. Geophys. Res. Lett. 29, 1–38. doi:10.1029/2002GL015311
Grell, G. A., and Freitas, S. R. (2014). A Scale and Aerosol Aware Stochastic Convective Parameterization for Weather and Air Quality Modeling. Atmos. Chem. Phys. 14, 5233–5250. doi:10.5194/acp-14-5233-2014
Grimm, A. M. (2003). The El Niño Impact on the Summer Monsoon in Brazil: Regional Processes versus Remote Influences. J. Clim. 16, 263–280. doi:10.1175/1520-0442(2003)016<0263:TENIOT>2.0.CO;2
Harris, I., Jones, P., Osborn, T., and Lister, D. (2014). Updated High-Resolution Grids of Monthly Climatic Observations - the CRU TS3.10 Dataset. Int. J. Climatol. 34, 623–642. doi:10.1002/joc.3711
Hersbach, H., Bell, B., Berrisford, P., Hirahara, S., Horányi, A., Muñoz–Sabater, J., et al. (2020). The ERA5 Global Reanalysis. Q. J. R. Meteorol. Soc. 13, 133. doi:10.1002/qj.3803
Hersbach, H. (2000). Decomposition of the Continuous Ranked Probability Score for Ensemble Prediction Systems. Weather Forecast. 15, 559–570. doi:10.1175/1520-0434(2000)015<0559:DOTCRP>2.0.CO;2
Hong, S.-Y., Dudhia, J., and Chen, S.-H. (2004). A Revised Approach to Ice Microphysical Processes for the Bulk Parameterization of Clouds and Precipitation. Mon. Wea. Rev. 132, 103. doi:10.1175/1520-0493(2004)132<0103:aratim>2.0.co;2
Hong, S.-Y., Noh, Y., and Dudhia, J. (2006). A New Vertical Diffusion Package with an Explicit Treatment of Entrainment Processes. Mon. Wea. Rev. 134, 2318. doi:10.1175/mwr3199.1
Hong, S. Y., and Lim, J. O. J. (2006). The WRF Single-Moment 6-Class Microphysics Scheme (WSM6). J. Korean Meteorol. Soc. 42, 129–151. doi:10.1109/candar.2017.58
Hsiao, L.-F., Yang, M.-J., Lee, C.-S., Kuo, H.-C., Shih, D.-S., Tsai, C.-C., et al. (2013). Ensemble Forecasting of Typhoon Rainfall and Floods over a Mountainous Watershed in Taiwan. J. Hydrol. 506, 55–68. doi:10.1016/j.jhydrol.2013.08.046
Iacono, M. J., Delamere, J. S., Mlawer, E. J., Shephard, M. W., Clough, S. A., and Collins, W. D. (2008). Radiative Forcing by Long-Lived Greenhouse Gases: Calculations with the AER Radiative Transfer Models. J. Geophys. Res. 113, 29. doi:10.1029/2008JD009944
Janjic, Z. I. (2000). Development and Evaluation of a Convection Scheme for Use in Climate Models. J. Atmos. Sci. 57, 573. doi:10.1175/1520-0469(2000)057<3686:codaeo>2.0.co;2
Janjic, Z. I. (1994). The Step-Mountain Eta Coordinate Model: Further Developments of the Convection, Viscous Sublayer and Turbulence Closure Schemes. Mon. Wea. Rev. 122, 927.
Jerez, S., López–Romero, J. M., Turco, M., Lorente–Plazas, R., Gómez–Navarro, J. J., Jiménez–Guerrero, P., et al. (2020). On the Spin–Up Period in WRF Simulations over Europe: Trade–Offs between Length and Seasonality. J. Adv. Model. Earth Sy. 12. doi:10.1029/2019MS001945
Jeworrek, J., West, G., and Stull, R. (2019). Evaluation of Cumulus and Microphysics Parameterizations in WRF across the Convective Gray Zone. Wea. Forecast. 34, 1097–1115. doi:10.1175/WAF-D-18-0178.1
Kain, J. S., and Fritsch, J. M. (1990). A One-Dimensional Entraining/Detraining Plume Model and its Application in Convective Parameterization. J. Atmos. Sci. 47, 2784–2802. doi:10.1175/1520-0469(1990)047<2784:AODEPM>2.0.CO;2
Kain, J. S. (2004). The Kain-Fritsch Convective Parameterization: An Update. J. Appl. Meteorol. 43, 170–181. doi:10.1175/1520-0450(2004)043<0170:TKCPAU>2.0.CO;2
Klein, C., Heinzeller, D., Bliefernicht, J., and Kunstmann, H. (2015). Variability of West African Monsoon Patterns Generated by a WRF Multi-Physics Ensemble. Clim. Dyn. 45, 2733–2755. doi:10.1007/s00382-015-2505-5
Liu, C., Ikeda, K., Thompson, G., Rasmussen, R., and Dudhia, J. (2011). High-Resolution Simulations of Wintertime Precipitation in the Colorado Headwaters Region: Sensitivity to Physics Parameterizations. Mon. Wea. Rev. 139, 3533–3553. doi:10.1175/MWR-D-11-00009.1
Lorenz, C., Kunstmann, H., Devaraju, B., Tourian, M. J., Sneeuw, N., and Riegger, J. (2014). Large-Scale Runoff from Landmasses: A Global Assessment of the Closure of the Hydrological and Atmospheric Water Balances. J. Hydrometeorol. 15, 2111–2139. doi:10.1175/JHM-D-13-0157.1
Lorenz, C., Portele, T. C., Laux, P., and Kunstmann, H. (2020). Bias-corrected and Spatially Disaggregated Seasonal Forecasts: a Long-Term Reference Forecast Product for the Water Sector in Semi-arid Regions. Earth Syst. Sci. Data 17, 131. doi:10.5194/essd-2020-177
Marengo, J. A., Alves, L. M., Alvala, R. C., Cunha, A. P., Brito, S., and Moraes, O. L. (2018). Climatic Characteristics of the 2010-2016 Drought in the Semiarid Northeast Brazil Region. Anais da Academia Brasileira de Ciências 90, 1973–1985. doi:10.1590/0001-3765201720170206
Martins, E. S. P. R., Coelho, C. A. S., Haarsma, R., Otto, F. E. L., King, A. D., Jan van Oldenborgh, G., et al. (2018). A Multimethod Attribution Analysis of the Prolonged Northeast Brazil Hydrometeorological Drought (2012–16). Bull. Amer. Meteorol. Soc. 99, S65–S69. doi:10.1175/BAMS-D-17-0102.1
Mlawer, E. J., Taubman, S. J., Brown, P. D., Iacono, M. J., and Clough, S. A. (1997). Radiative Transfer for Inhomogeneous Atmospheres: RRTM, a Validated Correlated K Model for the Longwave. J. Geophys. Res. 102, 16663–16682. doi:10.1029/97JD00237
Moya-Álvarez, A. S., Martínez-Castro, D., Flores, J. L., and Silva, Y. (2018). Sensitivity Study on the Influence of Parameterization Schemes in WRF-ARW Model on Short- and Medium-Range Precipitation Forecasts in the Central Andes of Peru. Adv. Meteorol. 2018, 1–16. doi:10.1155/2018/1381092
Müller, O. V., Lovino, M. A., and Berbery, E. H. (2016). Evaluation of WRF Model Forecasts and Their Use for Hydroclimate Monitoring over Southern South America. Wea. Forecast. 31, 1001–1017. doi:10.1175/WAF-D-15-0130.1
Ochoa, A., Campozano, L., Sánchez, E., Gualán, R., and Samaniego, E. (2016). Evaluation of Downscaled Estimates of Monthly Temperature and Precipitation for a Southern Ecuador Case Study. Int. J. Climatol. 36, 1244–1255. doi:10.1002/joc.4418
Parkes, B., Higginbottom, T. P., Hufkens, K., Ceballos, F., Kramer, B., and Foster, T. (2019). Weather Dataset Choice Introduces Uncertainty to Estimates of Crop Yield Responses to Climate Variability and Change. Environ. Res. Lett. 14, 124089. doi:10.1088/1748-9326/ab5ebb
Pleim, J. E. (2007). A Combined Local and Nonlocal Closure Model for the Atmospheric Boundary Layer. Part I: Model Description and Testing. J. Appl. Meteorol. Climatol. 46, 1383–1395. doi:10.1175/JAM2539.1
Pohl, B., Crétat, J., and Camberlin, P. (2011). Testing WRF Capability in Simulating the Atmospheric Water Cycle over Equatorial East Africa. Clim. Dyn. 37, 1357–1379. doi:10.1007/s00382-011-1024-2
Que, L.-J., Que, W.-L., and Feng, J.-M. (2016). Intercomparison of Different Physics Schemes in the WRF Model over the Asian Summer Monsoon Region. Atmos. Oceanic Sci. Lett. 9, 169–177. doi:10.1080/16742834.2016.1158618
Radanovics, S., Vidal, J.-P., and Sauquet, E. (2018). Spatial Verification of Ensemble Precipitation: An Ensemble Version of SAL. Wea. Forecast. 33, 1001–1020. doi:10.1175/WAF-D-17-0162.1
Ruiz, J. J., Saulo, C., and Nogués-Paegle, J. (2010). WRF Model Sensitivity to Choice of Parameterization over South America: Validation against Surface Variables. Mon. Wea. Rev. 138, 3342–3355. doi:10.1175/2010MWR3358.1
Sikder, S., and Hossain, F. (2016). Assessment of the Weather Research and Forecasting Model Generalized Parameterization Schemes for Advancement of Precipitation Forecasting in Monsoon Driven River Basins. J. Adv. Model. Earth Sy. 8, 1210–1228. doi:10.1002/2016MS000678
Simmons, A. J., Poli, P., Dee, D. P., Berrisford, P., Hersbach, H., Kobayashi, S., et al. (2014). Estimating Low-Frequency Variability and Trends in Atmospheric Temperature Using ERA-Interim. Quart. J. Roy. Meteorol. Soc. 140, 329–353. doi:10.1002/qj.2317
Skamarock, W. C., Klemp, J. B., Dudhia, J., Gill, D. O., Barker, M., Duda, M. G., et al. (2008). A Description of the Advanced Research WRF Version 3. Tech. Note NCAR 113. doi:10.5065/D68S4MVH
Soares, P. M. M., Cardoso, R. M., Miranda, P. M. A., de Medeiros, J., Belo-Pereira, M., and Espirito-Santo, F. (2012). WRF High Resolution Dynamical Downscaling of ERA-Interim for Portugal. Clim. Dyn. 39, 2497–2522. doi:10.1007/s00382-012-1315-2
Tariku, T. B., and Gan, T. Y. (2017). Sensitivity of the Weather Research and Forecasting Model to Parameterization Schemes for Regional Climate of Nile River Basin. Clim. Dyn. 50, 4231–4247. doi:10.1007/s00382-017-3870-z
Taylor, K. E. (2001). Summarizing Multiple Aspects of Model Performance in a Single Diagram. J. Geophys. Res. Atmos. 106, 7183–7192. doi:10.1029/2000JD900719
Tiedtke, M. (1989). A Comprehensive Mass Flux Scheme for Cumulus Parameterization in Large-Scale Models. Monthly Weather Rev. 117, 1779. doi:10.1175/1520-0493(1989)117<1779:acmfsf>2.0.co;2
Ulate, M., Dudhia, J., and Zhang, C. (2014). Sensitivity of the Water Cycle over the Indian Ocean and Maritime Continent to Parameterized Physics in a Regional Model. J. Adv. Model. Earth Sy. 6, 1095–1120. doi:10.1002/2014MS000313
von Sperling, E. (2012). Hydropower in Brazil: Overview of Positive and Negative Environmental Aspects. Energ. Proced. 18, 110–118. doi:10.1016/j.egypro.2012.05.023
Wernli, H., Hofmann, C., and Zimmer, M. (2009). Spatial Forecast Verification Methods Intercomparison Project: Application of the SAL Technique. Wea. Forecast. 24, 1472–1484. doi:10.1175/2009WAF2222271.1
Wernli, H., Paulat, M., Hagen, M., and Frei, C. (2008). SAL - A Novel Quality Measure for the Verification of Quantitative Precipitation Forecasts. Mon. Wea. Rev. 136, 4470–4487. doi:10.1175/2008MWR2415.1
Yang, B., Qian, Y., Lin, G., Leung, R., and Zhang, Y. (2012). Some Issues in Uncertainty Quantification and Parameter Tuning: A Case Study of Convective Parameterization Scheme in the WRF Regional Climate Model. Atmos. Chem. Phys. 12, 2409–2427. doi:10.5194/acp-12-2409-2012
Yang, Q., Yu, Z., Wei, J., Yang, C., Gu, H., Xiao, M., et al. (2021). Performance of the WRF Model in Simulating Intense Precipitation Events over the Hanjiang River Basin, China – A Multi-Physics Ensemble Approach. Atmos. Res. 248, 105206. doi:10.1016/j.atmosres.2020.105206
Zhang, C., Wang, Y., Lauer, A., and Hamilton, K. (2012). Configuration and Evaluation of the WRF Model for the Study of Hawaiian Regional Climate. Mon. Wea. Rev. 140, 3259–3277. doi:10.1175/MWR-D-11-00260.1
Zhang, C., and Wang, Y. (2017). Projected Future Changes of Tropical Cyclone Activity over the Western North and South Pacific in a 20-Km-Mesh Regional Climate Model. J. Clim. 30, 5923–5941. doi:10.1175/JCLI-D-16-0597.1
Keywords: weather research and forecasting (WRF) model, sensitivity, CHIRPS 2.0, northeast Brazil, Ecuador, Peru, eSAL, parameterizations
Citation: Portele TC, Laux P, Lorenz C, Janner A, Horna N, Fersch B, Iza M and Kunstmann H (2021) Ensemble-Tailored Pattern Analysis of High-Resolution Dynamically Downscaled Precipitation Fields: Example for Climate Sensitive Regions of South America. Front. Earth Sci. 9:669427. doi: 10.3389/feart.2021.669427
Received: 18 February 2021; Accepted: 29 April 2021;
Published: 13 May 2021.
Edited by:
Tomas Halenka, Charles University, CzechiaReviewed by:
Changhai Liu, National Center for Atmospheric Research (UCAR), United StatesXander Wang, University of Prince Edward Island, Canada
Copyright © 2021 Portele, Laux, Lorenz, Janner, Horna, Fersch, Iza and Kunstmann. This is an open-access article distributed under the terms of the Creative Commons Attribution License (CC BY). The use, distribution or reproduction in other forums is permitted, provided the original author(s) and the copyright owner(s) are credited and that the original publication in this journal is cited, in accordance with accepted academic practice. No use, distribution or reproduction is permitted which does not comply with these terms.
*Correspondence: Tanja C. Portele, dGFuamEucG9ydGVsZUBraXQuZWR1