 Toshiya Fujiwara1,2*
- 1Research Institute for Marine Geodynamics, Japan Agency for Marine-Earth Science and Technology (JAMSTEC), Yokosuka, Japan
- 2Graduate School of Integrated Arts and Sciences, Kochi University, Kochi, Japan
Repeated multibeam bathymetric surveys played an important role for understanding the distribution of coseismic seafloor displacement caused by the March 11, 2011 Mw 9.0 Tohoku-oki earthquake. After the earthquake, we collected bathymetric data along the same tracks obtained before the earthquake. The selected tracks were crossing the trench and extending from the landward to seaward trench slopes. We examined the seafloor displacement on the landward relative to the seaward by means of the difference in bathymetry before and after the earthquake. The multibeam bathymetric survey has the advantage of areal coverage. The repeated surveys clarified the areal distribution of the coseismic seafloor displacement. In the main rupture area, very large seafloor displacement was observed. Sharp bathymetric change at the trench axis provided solid evidence that the fault slip on the shallowest part of the megathrust reached the trench axis and peaked at the trench axis. The very large displacement is limited to the particular area. Smaller seafloor displacements were observed in the area tens of kilometers away from the main rupture area. We present methods and results of the repeated multibeam bathymetric surveys and an application to the seafloor displacement caused by the 2011 Tohoku-oki earthquake in the northern Japan Trench. Less than several meters in seafloor vertical displacements and less than 20 m in seafloor horizontal displacement were estimated in the northern Japan Trench. The estimated smaller displacements are comparable in magnitude to error of the seafloor displacement observation from our bathymetric survey. Nevertheless, three adjacent survey tracks showed coherent relative differences in seafloor elevation, which suggests the relative difference enables us to discuss the along-track variation in seafloor displacement in the area. However, our survey was affected by uncertainties of roll and pitch biases and sound velocity errors. Well-prepared repeated multibeam bathymetric survey for the purpose of seafloor geodesy could lead to a higher resolution and more accurate result. Repeated acquisition of high resolution and accuracy bathymetric data using state-of-the-art technology will be important to quantitative discussion of the seafloor displacements caused by even smaller magnitude earthquakes and tsunamis.
Introduction
Repeated multibeam bathymetric surveys played an important role for understanding the areal distribution of coseismic displacement caused by the March 11, 2011 Mw 9.0 Tohoku-oki earthquake. Comparison of bathymetry collected after the earthquake with data acquired before the earthquake revealed and quantified the seafloor displacement on the landward trench slope across the Japan Trench. The seafloor on the outermost landward slope moved ∼50 m toward the trench and up to 10 m upward (Fujiwara et al., 2011). The result provided solid evidence that the very large fault slip on the shallowest part of the megathrust reached the trench axis and peaked at the trench axis (Fujiwara et al., 2011; Kodaira et al., 2012; Sun et al., 2017).
In other instances, Maksymowicz et al. (2017) observed coseismic horizontal displacements of ∼8 m and uplift of ∼3 m caused by the February 27, 2010 Mw 8.8 Chile Maule earthquake by using repeated multibeam bathymetric data. And they estimated the up-dip limit of fault rupture during the giant earthquake. The rupture of the shallowest part of the megathrust and the following seafloor deformation has an important implication for tsunami generation.
However, deep-sea multibeam bathymetric surveys are generally supposed to map hundreds meter-scale seafloor morphological features for the purposes of marine geology and geophysics, therefore, very high accuracy measurements have rarely been required yet. The magnitudes of seafloor displacements become smaller in areas far away from the 2011 Tohoku-oki earthquake epicentral area (Fujiwara et al., 2017; Kodaira et al., 2020; Nakamura et al., 2020). In the case of the surveys to detect small seafloor displacements, the uncertainties in the bathymetric surveys are not negligible.
We present methods and results of the repeated multibeam bathymetric survey and an application to the seafloor displacement caused by the 2011 Tohoku-oki earthquake in the northern Japan Trench (Figure 1). In order to explain the tsunami caused by the 2011 Tohoku-oki earthquake, some papers have introduced an additional tsunami source in this area (e.g., Satake et al., 2013; Tappin et al., 2014; Romano et al., 2014; Hossen et al., 2015; Dettmer et al., 2016; Yamazaki et al., 2018). Fujiwara et al. (2017) described the smaller magnitudes of seafloor displacement in this area where the tsunami source was assumed. In this paper, two survey tracks were newly added to evaluate the methods and to refine the results (Figure 1). One is a repeated survey conducted before and after the earthquake. In the other survey, both of the cruises were carried out after the earthquake. Because the post seismic displacements are quite small (Watanabe et al., 2014; Tomita et al., 2017) as compared with the coseismic displacements shown by seafloor geodetic measurements (Kido et al., 2011; Sato et al., 2011), a noticeable change in the bathymetry is presumed to be absent for the survey that both two cruises conducted after the earthquake and a short time interval. Therefore, this post-earthquake survey enables us to evaluate repeatability of our survey. Then, we will present refinement of the results of Fujiwara et al. (2017), and also point out uncertainties about our surveys. Finally, we note strategies of the repeated multibeam bathymetric survey for seafloor geodesy.

FIGURE 1. Location map of the repeated bathymetric surveys. The white box marks the location in Figure 2. Survey tracks of comparison of bathymetry before and after the March 11, 2011 Tohoku-oki earthquake are indicated by yellow lines. The white line traces the survey track of comparison of bathymetry both after and after the earthquake. The black cross shows the epicenter of the earthquake. The background bathymetry is from compilation of pre-earthquake multibeam bathymetry (Hydrographic and Oceanographic Department, Japan Coast Guard and JAMSTEC, 2011).
Method
Bathymetric Data Collection
The Japan Agency for Marine-Earth Science and Technology (JAMSTEC) had carried out multibeam bathymetric surveys in June 2007 and in November 2010 aboard the R/V Kairei (KR07-08 and KR10-12 cruises), and in February 2008 aboard the R/V Mirai (MR07-07 Leg 3 cruise). These bathymetric data were collected using SeaBeam 2112 echo sounders. The operating frequency was 12 kHz and a beam width was 2° × 2°. In the R/V Kairei cruises, the ship was traveling at speeds of 16 knots in both surveys, which yielded the along-track sampling interval of ∼170 m in the deepest trench axial area. In the R/V Mirai cruise, the ship was traveling at speeds of 12 knots, which yielded the along-track sampling interval of ∼120 m in the deepest trench axial area.
After the earthquake, the German R/V Sonne performed surveys along the same tracks (SO219A and SO251A cruises) (Figure 2). The 2012 and 2016 surveys were repeats of the 2010 and 2007 surveys, respectively. The bathymetric data in the March 2012 survey were collected using an EM120 with a frequency of 12 kHz and a beam width of 2° × 2°. The along-track sampling interval was rather short, ∼70 m, in the deepest trench axial area at a slower speeds of 6 knots. In the October 2016 survey, the bathymetric data were collected with R/V ‘New’ Sonne equipped with a 12 kHz frequency EM122 which has a beam width of 0.5° along and 1° across the ship. The survey ship speed was 5 knots and the along-track sampling interval of ∼35 m was achieved even in the deepest trench axial area. The R/V Sonne went the opposite directions of the previous surveys. The R/V Mirai cruised along the previous R/V Mirai’s survey track in March 2017 (MR16-09 Leg 4 cruise). At the time of this cruise, the R/V Mirai's echo sounder had been replaced by a new SeaBeam 3012 with a 12 kHz frequency and a beam width of 1.6° along and 2° across the ship. The survey ship speed was 5 knots. The ship went the same direction of the previous survey (Figure 2). These survey tracks ran over each side of the Japan Trench and crossed the trench at 39.2°N, 39.3°N and 39.5°N. The SO251A survey track intersects with the SO219A track around 143°16'E (water depth ∼2200 m), and intersects with the MR1609 track around 143°53′E (∼4600 m).
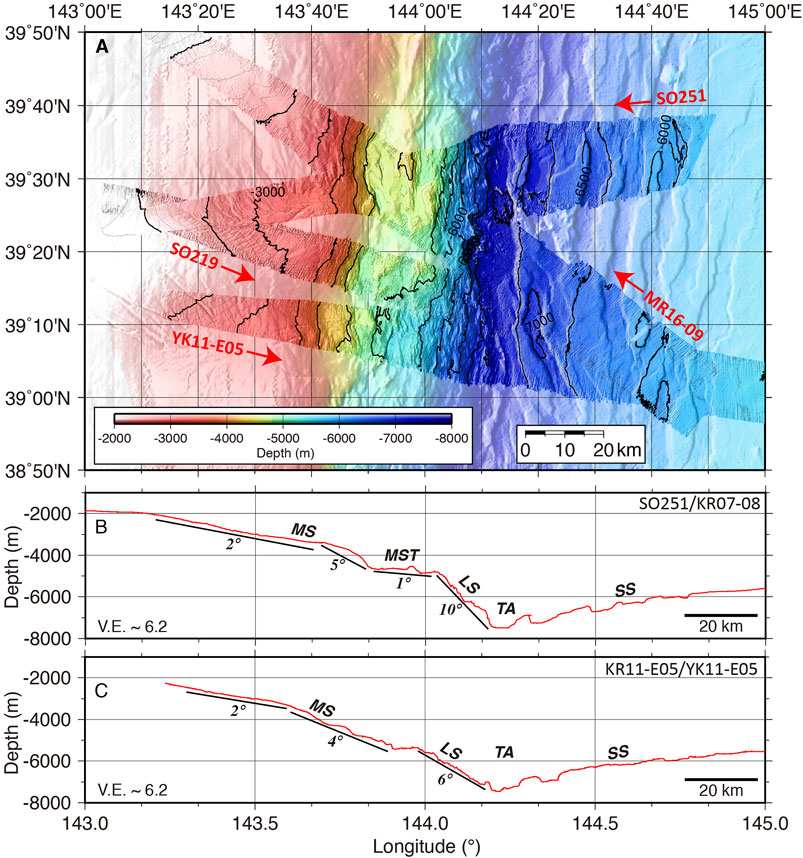
FIGURE 2. (A) Multibeam bathymetry in the northern Japan Trench collected in 2011 (YK11-E05), 2012 (SO219A), 2016 (SO251A), and 2017 (MR16-09 Leg 4). The contour interval is 100 m, and the relief is illuminated from the northwest. Red arrows point survey ship's traveling directions. Along track bathymetric profiles using center-beam depths of (B) SO251A and (C) YK11-E05. SS: Seaward slope, LS: Lower slope, MST: Mid-slope terrace, MS: Mid slope, and TA: Trench axis. The vertical exaggeration is 6.2.
In the south of the study area, one survey was conducted in June 2011, after the March 11, 2011 earthquake, aboard the JAMSTEC R/V Yokosuka (YK11-E05 cruise) (Figure 2). The R/V Yokosuka was also equipped with a SeaBeam 2112 echo sounder. The ship went from landward to seaward at a speed of 5 knots. Two months later, bathymetric data along the same track were collected by the R/V Kairei (KR11-E05 cruise) in August 2011 (Figure 3A). The ship sailed in the opposite direction with a speed of 4 knots. The survey track crossed the Japan Trench at 39.1°N. These acquisition parameters of the repeated multibeam bathymetric surveys are summarized in Table 1.
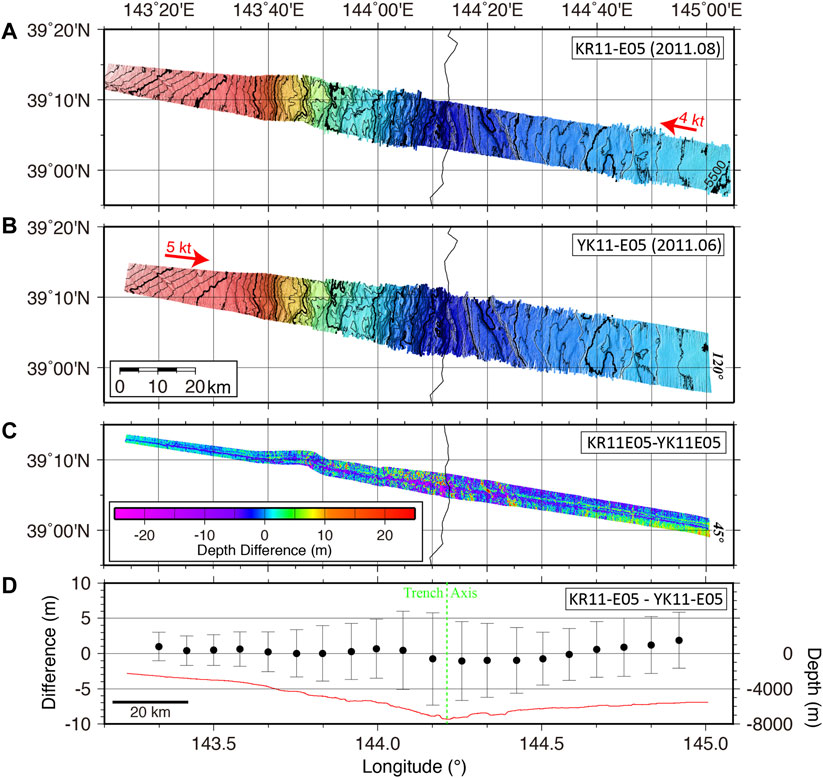
FIGURE 3. Multibeam bathymetry collected both in 2011 (A) KR11-E05 (August 2011) and (B) YK11-E05 (June 2011). Red arrows point survey ship's traveling directions and speeds (C) Depth difference by subtracting the YK11-E05 bathymetric data from the KR11-E05 data (positive is shallower). (D) Along track profile of the depth difference. Black circles correspond to average values of the depth difference within ∼15 km wide area. Locations of the black circles point the center of the area. Vertical bars show standard deviations. A red line shows the along track bathymetric profile using center-beam depths of YK11-E05.
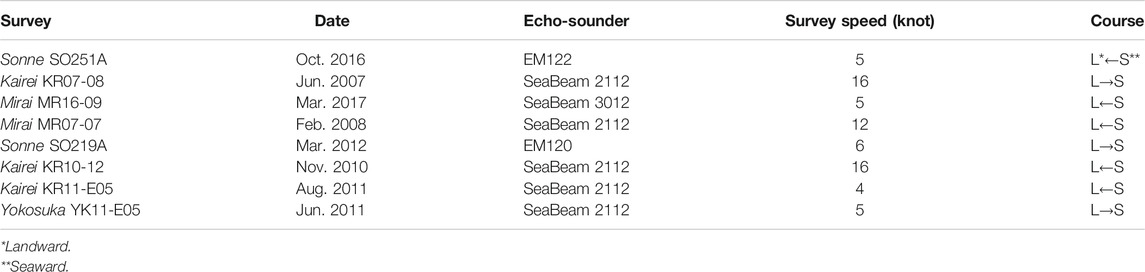
TABLE 1. Acquisition parameters of the repeated multibeam bathymetric surveys.
The sound velocity profiles (SVP) in the water column were calculated using measurements from expandable bathothermographs (XBT) or conductivity temperature depth profilers (CTD) prior to the bathymetric surveys. However, no nearby XBT or CTD profiles were collected during the KR07–08 cruise. The SVP of water depth deeper than ∼2000 m was derived from Levitus database (Levitus, 1982) because variation of the SVP in deep water is small in time and space. Surface sound velocities were measured in real-time. Therefore, the contribution of the surface sound velocity error is expected to be small enough.
Bathymetric Data Editing
MB-System seafloor mapping software (Caress et al., 2021) was used to remove erroneous bathymetric data. Firstly, the erroneous data were automatically flagged using a ‘mbclean’ tool. Then the data were manually edited. Sounding data near the nadir were rather noisy, however the erroneous data were difficult to be discriminated and completely removed.
All bathymetric data were ocean tide corrected using the NAO.99jb regional model around Japan (Matsumoto et al., 2000). The estimated sea surface height variation due to ocean tide was less than ±0.8 m.
To compare the different surveys with random sounding locations, post-earthquake bathymetric data were gridded by using the Generic Mapping Tools (GMT) software (Wessel and Smith, 1991). Because the post-earthquake data are densely distributed and have lower noise levels since the data have been collected with lower ship speeds. And also, some data were collected using modern echo sounders. In the case of the surveys both post-earthquake bathymetric data between KR11-E05 (August 2011) and YK11-E05 (June 2011), the YK11-E05 data were gridded because the YK11-E05 data have a lower noise level (Figures 3A,B). The gridding algorithm ‘surface’ with a tension factor of 0.35 was operated after ‘blockmedian’ pre-processor filtering. The grid spacing was 0.025 arc-minutes. This is rather fine relative to the average spacing of the raw soundings, so that short-wavelength features of the bathymetry are retained. The short-wavelength features are useful to check the coherency between two bathymetric datasets.
Seafloor Morphology
The water depth ranges from 2000 m at the most landward side of the survey area to 7500 m at the trench axis (Figure 2). The seaward slope is characterized by horst and graben structure associated with oceanic plate bending in the strike of N-S to NNE-SSW. In the landward slope, the lower slope, ∼20 km in width, inclines with a steep angle at an average of 6° or up to 10°. The mid-slope terrace between the steep middle slope and the lower slope is distinctive in the northern study area (Figure 2B). The mid-slope terrace at the depth of 4600–5000 m is ∼20 km in width with a gentle angle of 0–1°.
Correction for Roll and Pitch Biases
The gridded (post-earthquake) data were sampled and depth differences were calculated at sounding locations of the other (pre-earthquake) data for the comparison, so that the gridding and interpolation errors can be reduced. A ‘grdtrack’ tool was used to sample the grid data at given sounding locations. Characteristic and artificial errors were more or less found in all bathymetric difference data. The depth difference in the across-track direction was positive on one side and negative on the other side, and the errors are greater in the outer beams, indicating a systematic tilt of one survey relative to the other, suggesting that there may be a roll bias error in one or both echo sounder systems.
The depth difference in the along-track direction was positive or negative over slopes, indicating systematic horizontal offset of sounding locations of one survey relative to the other, suggesting that there may be a pitch bias error in one or both echo sounder systems. Roll and pitch biases are due to a misalignment of the vertical reference supplied to the system. The measurement errors depend on water depth and increase with the water depth.
As these roll and pitch calibration values were not available, we needed to examine the roll and pitch bias effects. Although the repeated survey data are not a pair of datasets collecting while moving in opposite directions by the same ship and system and thus true calibration values of each ship are not determined, effective calibration values of the roll and pitch biases were searched in each survey tracks.
MB-System was used to manipulate the roll and pitch biases. The roll and pitch bias values were input using a ‘mbset’ tool, and the bathymetric data were reprocessed using a ‘mbprocess’ tool. We searched for a set of roll bias calibration values that suppress the systematic tilt of depth differences between ship’s starboard and port sides. The set of roll bias calibration values are in a trade-off relationship, and thus an equal roll bias value was allocated to each cruise data in each survey tracks. The pitch bias value was examined to minimize the standard deviations of the areal depth differences. The horst and graben structure on the seaward slope was able to utilized. There are local east-facing and west-facing slopes and scarps regularly (Figure 2). The local seafloor slope variation can lead to coherent short-wavelength features of bathymetry.
Estimation of Seafloor Displacement
Only the bathymetric data collected within beam angle of 45° (+/−22.5°) among 120° swath were used for analysis because these inner beam soundings have higher measurement accuracy (Figure 3C in comparison with 3B). To avoid the apparent offsets of locations from different surveys, a set of the bathymetric data was horizontally shifted relative to the others in order to minimize the standard deviation of depth differences (maximize the cross-correlation of the bathymetry). Offsets were examined separately for the seaward and landward slopes, because the seaward slope is thought to have suffered little change from the 2011 earthquake. The offsets of locations and depths estimated on the seaward slope are considered to be systematic errors for the entire area. Consequently, after subtraction of these systematic errors, the average value of the depth difference on the seaward slope becomes zero (Figures 3C,D, 4A). The average values of the depth differences on the landward slope should represent the average uplifts caused by the coseismic vertical displacement of the 2011 earthquake. The horizontal displacements on the landward slopes were estimated by dislocations of the amounts of horizontal shifts relative to those on the seaward slope (Figure 4B).
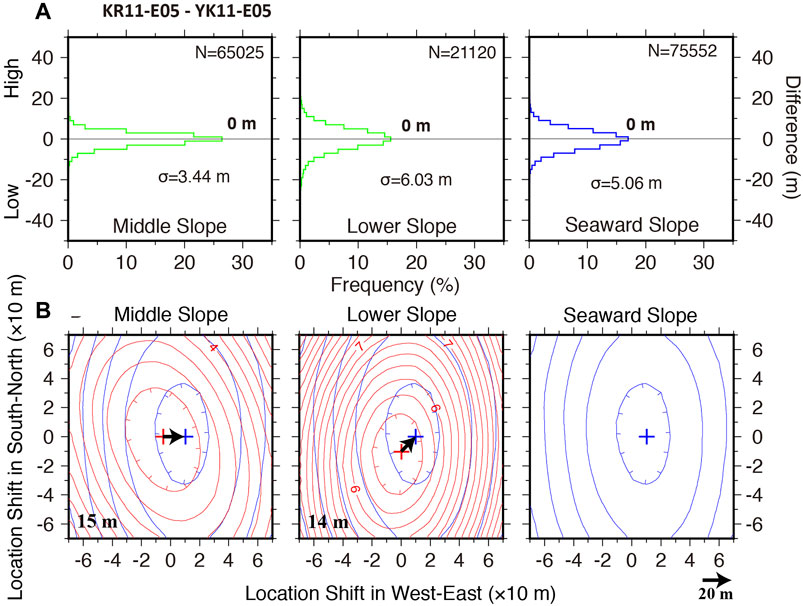
FIGURE 4. (A) Histograms of depth differences after the optical offset adjustments between KR11-E05 and YK11-E05 data in the morphological areas. Values in the histograms indicate the averages and standard deviations (B) Contour maps showing standard deviations of the depth differences between KR11-E05 and YK11-E05 for given shifted locations. Crosses indicate the minimum peaks of the standard deviations. Arrows show vectors of horizontal shifts from landward to seaward. Values in the maps indicate lengths of the arrows.
Results
Comparison of Bathymetry After and After the Earthquake
Depth difference between the KR11-E05 (August 2011) data and the YK11-E05 (June 2011) data is shown in three different Figures 3C,D, 4A. Because both data were collected after the March 11, 2011 earthquake, our method is verified and evaluated from the result.
In the map view, there is no apparent change in seafloor elevation for the entire area, although spiky noisy data associated with abrupt changes in bathymetry, for instance, steep scarps are conspicuous (Figure 3C). Also, the spiky noisy data along near the center of the track became visible in the map. The artificial differences between ship's port and starboard sides are still visible in some locations even after the roll bias correction. Because the applied constant of roll bias correction through the survey track did not match in some locations and the best fit roll bias values were slightly varied by location. In the cross sectional view, the profile of average values of the depth difference within 15 km wide area along the track show variation in amplitude of ±1 m, although the displacement is presumed to be quite small (Figure 3D).
For the areas divided by the morphological features, i.e., the seaward slope, the landward lower slope, and the middle slope, the ∼20–50 km long-range averages converge to zero (Figure 4A). The standard deviations fall within the criterion of multibeam measurement (the depth accuracy (inner beams) 0.2% of water depth (∼4–15 m in 2000–7600 m depth)). Note that there is less than 15 m dislocation between the two datasets, although displacement is presumed to be quite small (Figure 4B). The offset may suggest uncertainty in the estimation of the amount of shift. This result corroborated the uncertainty estimation previously described (Fujiwara et al., 2011; Fujiwara et al., 2015).
Comparison of Bathymetry Before and After the Earthquake
The calculation from KR10–12 (2010) to SO219A (2012), from MR07-07 (2008) to MR16-09 (2016), and also from KR07-08 (2007) to SO251A (2016) followed the same procedure. Comparisons of the bathymetry before and after the 2011 earthquake are shown in Figures 5–8. Relative change in the depth difference on the landward slope suggests seafloor vertical displacement due to the earthquake.
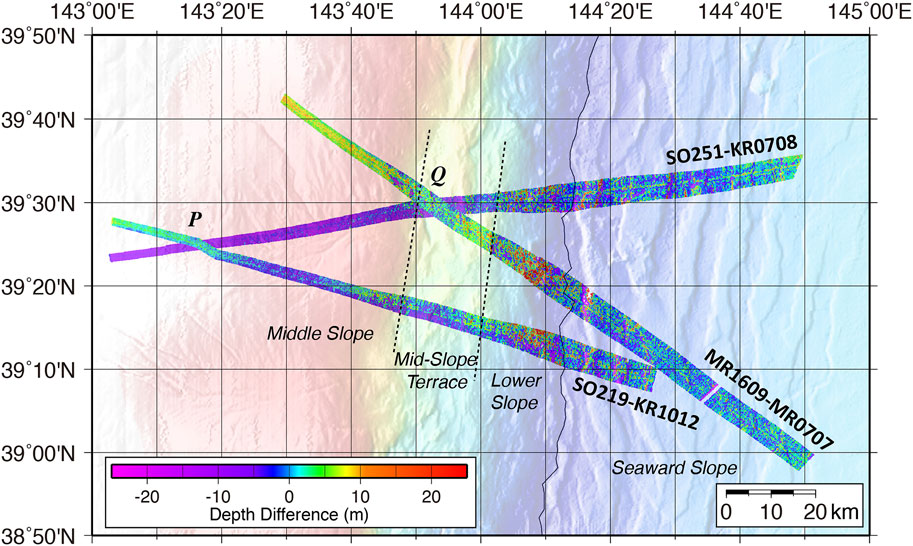
FIGURE 5. Change in seafloor elevation by subtracting the KR07-08 (2007) bathymetric data from the SO251A (2016) data (positive is shallower), by subtracting the KR10-12 (2010) data from the SO219A (2012) data, and by MR07-07 Leg 3 (2008) data from the MR16-09 Leg 4 (2017) data, respectively.
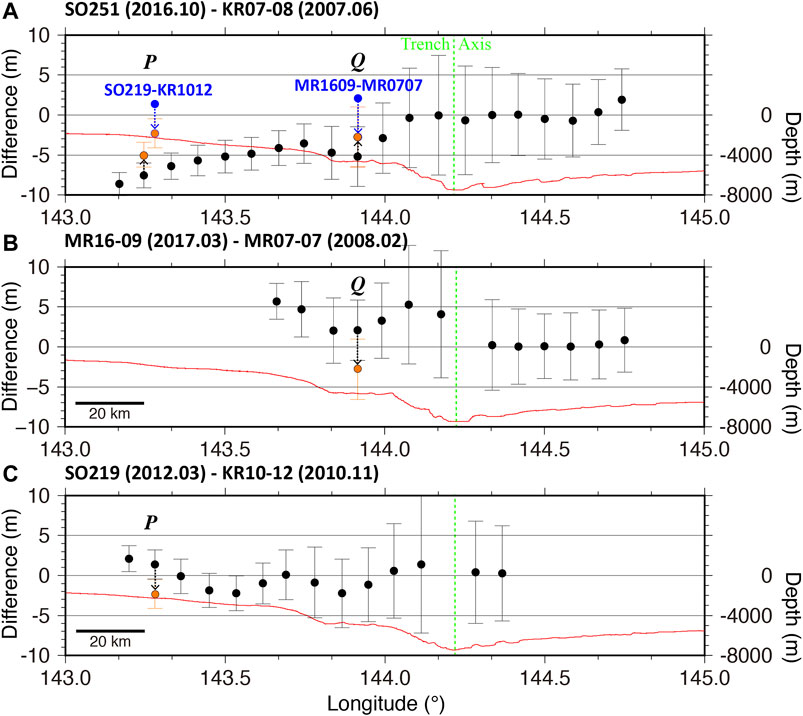
FIGURE 6. Along track profiles of the depth differences. Black circles correspond to average values of the depth difference within ∼15 km wide area. Locations of the black circles point the center of the area. Vertical bars show standard deviations. Orange circles show corrected average values after sound velocity corrections. A red line shows the along track bathymetric profile using center-beam depths. (A) Comparison between KR07-08 and SO251A,, (B) Comparison between MR07-07 Leg 3 and MR16-09 Leg 4, and (C) Comparison between KR10-12 and SO219A.
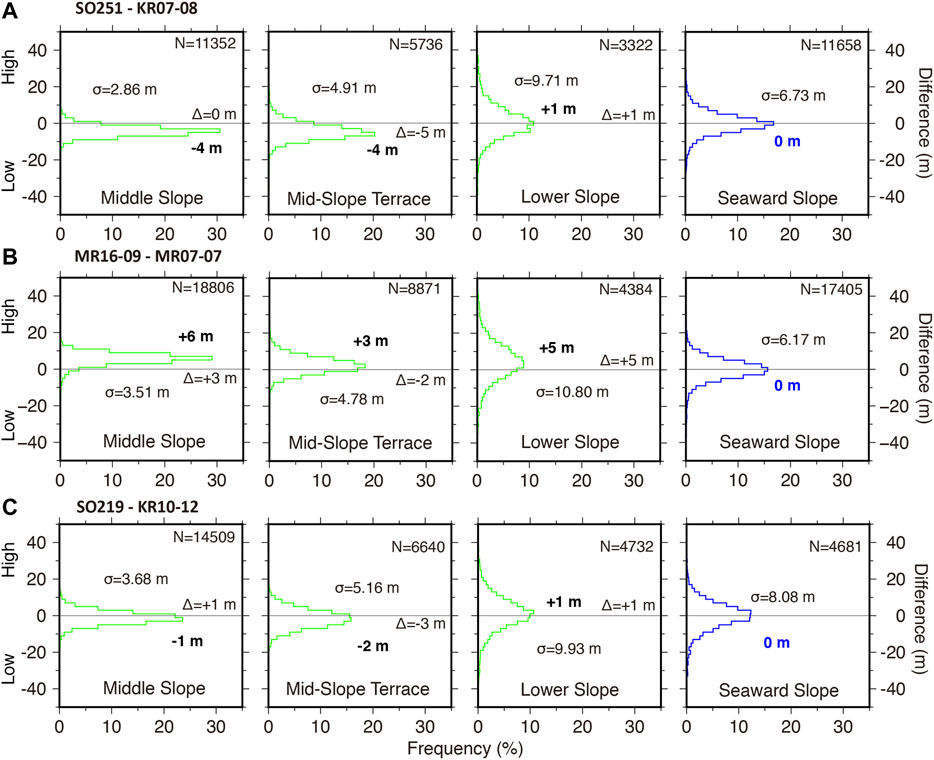
FIGURE 7. Histograms of depth differences after the optical offset adjustments between different surveys in the morphological areas. (A) Comparison between KR07-08 and SO251A (B) Comparison between MR07-07 Leg 3 and MR16-09 Leg 4, and (C) Comparison between KR10-12 and SO219A. Values in the histograms indicate the averages, the standard deviations (σ), and relative differences of the averages from the right panel (Δ).
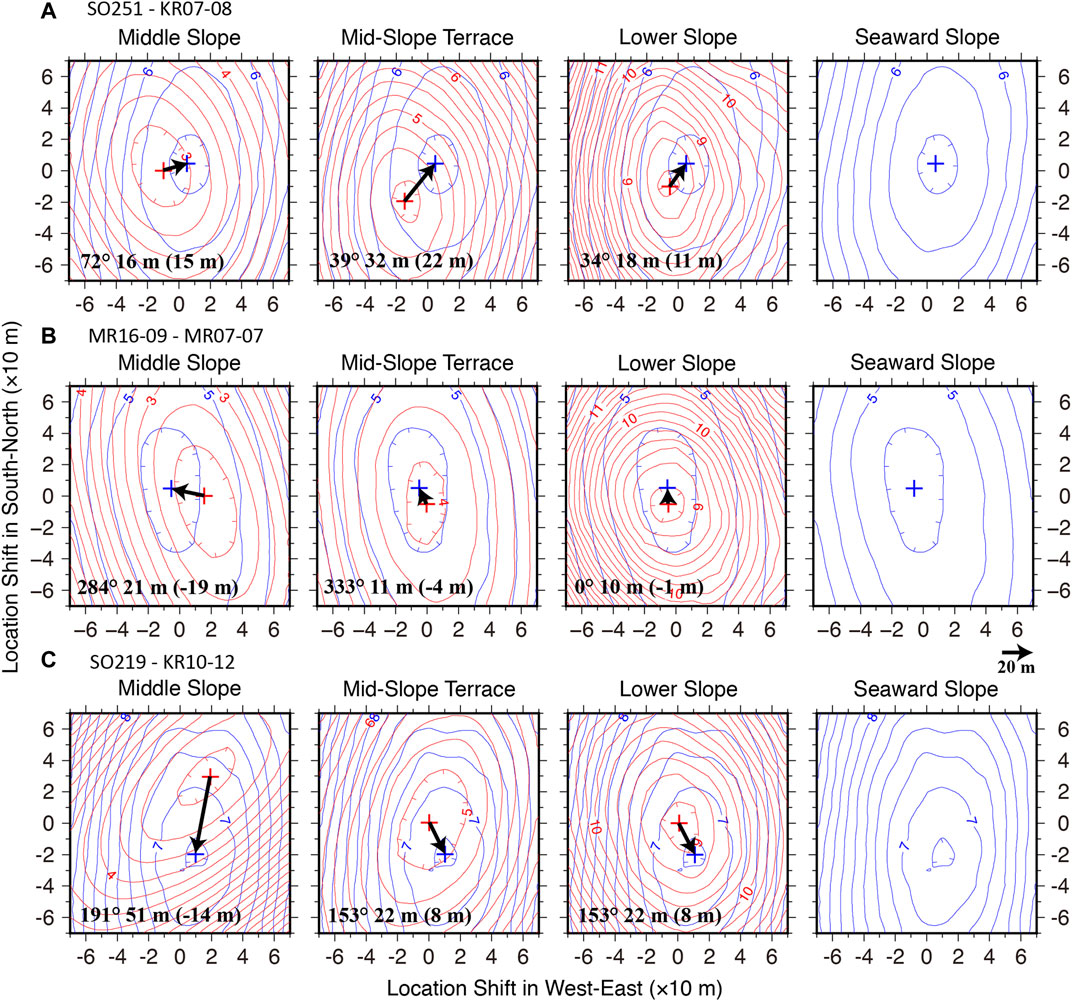
FIGURE 8. Contour maps showing standard deviations of depth differences between different surveys for given shifted locations. (A) Comparison between KR07-08 and SO251A data, (B) comparison between MR07-07 Leg 3 and MR16-09 Leg 4 data, and (C) comparison between KR10-12 and SO219A data, respectively. The crosses indicate the minimum peaks of the standard deviations. The arrows show vectors of horizontal shifts from landward to seaward. Values in the maps indicate directions and lengths of the arrows, and values in parentheses are components in the trench-normal direction.
The depth differences with amplitudes of several meters were found (Figures 5, 6). The amplitudes are larger than the comparison of after and after earthquake data as described in the previous section. About discrepancies in absolute values of the depth differences among the survey tracks will be discussed in the later Repeated Bathymetric Survey Plan for Seafloor Geodesy. The depth difference variation is correlated to areas divided by the morphological features. The lower slope is relatively uplifted, the mid-slope terrace is relatively subsided, and the middle slope is slightly uplifted within the same survey track profile (Figures 6, 7). These profiles of depth difference show the same trend even though the depth change is somewhat different. The relative depth differences between the morphological areas are ∼1–5 m (Figure 7). The standard deviations of depth differences are attributed to measurement accuracy of multibeam bathymetry, and these are also within 0.2% of water depth (Figure 7).
Fujiwara et al. (2017) argued that the observed small amplitude but coherent seafloor elevation change possibly reflect the coseismic seafloor displacement due to inelastic deformation or subsidiary fault movements, even though these values are comparable with potential errors. The result of newly added the MR1609-MR0707 survey track also demonstrates the similar trend of seafloor change, therefore may support the argument. Further consideration will be needed to discuss about the coseismic seafloor displacement in the tsunami source area.
However, as shown in the elongation of contours of Figure 8, the N-S direction is less constrained because the general trend of the bathymetry is subparallel to the N-S direction and the bathymetric variation in the direction is small (Figure 2). In consideration of the primary component of the coseismic displacements of the 2011 earthquake as suggested by seafloor geodetic measurements (Kido et al., 2011; Sato et al., 2011), horizontal displacements in the trench-normal direction seem plausible. Therefore, horizontal displacements in the trench-normal direction were also estimated. The horizontal displacements fall off less than 20 m (values in parentheses in Figure 8). Again, note that the uncertainty of 20 m may be involved in our estimation. Also due to the low spatial resolution of the pre-earthquake multibeam surveys, more than 20 m uncertainty in the distance may arise.
Discussion
Estimation of Effects of Sound Velocity Correction
The SO251-KR0708 survey track intersects with the SO219-KR1012 track around 143°16′E (water depth ∼2200 m), and also intersects with the MR1609-MR0707 track around 143°53′E (∼4600 m) (marked P and Q in Figure 5). There are large discrepancies in depth difference values between two survey tracks at these intersections (Figure 6A). There are gaps of 8.9 m between the SO251-KR0708 data and the SO219-KR1012 data at the P intersection, and 7.3 m the SO251-KR0708 data and the MR1609-MR0707 data at the Q intersection.
Use of erroneous SVP is suggested as the cause of the discrepancy. Once input a SVP based on XBP or CTD measurements into the echo sounder system gradually deviated from the actual SVP and probably became inaccurate because of the spatiotemporal change of the sound velocity structure. Figure 9A shows across track plots of depth differences of the post-earthquake SO251A sounding data from the post-earthquake SO219A depth grid of inner beams nadir parts at the P intersection. Water depths at inner beams are deeper, and the water depths at outer beams are shallower. Curvature of the measured profile is clearly visible. This phenomenon is nicknamed a 'smile' curve.
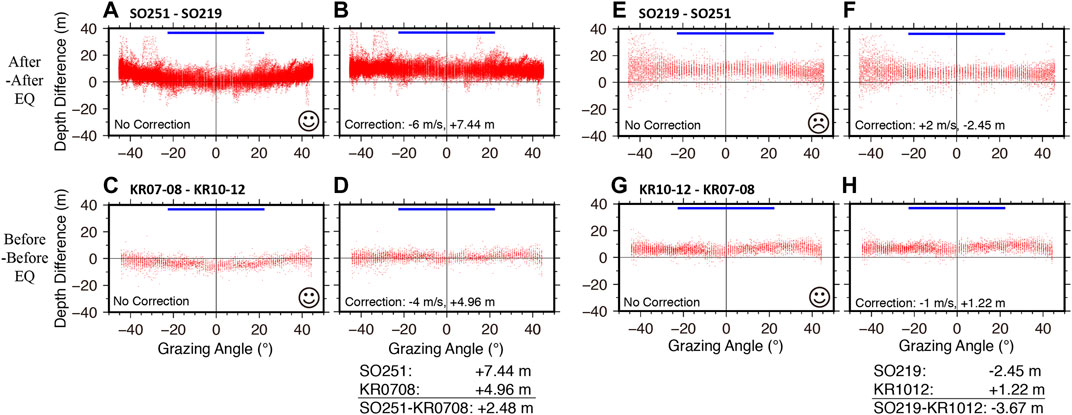
FIGURE 9. Across track plots of depth differences at the P intersection. Red dots mark the depth differences at sounding locations. The location of grazing angle of 0° corresponds to the nadir of ship and the center of the swath. Upper panels show comparisons between data collected after the earthquake, and lower panels show comparisons between data collected before the earthquake. (A) Depth differences of the SO251A data from the SO219A data. (B) Sound velocity correction with decrease the average sound velocity of 0–2000 m by 6 m/s. (C) Depth differences of the KR07–08 data from the KR10–12 data. (D) Correction with decrease the average velocity by 4 m/s. (E) Depth differences of the SO219A data from the SO251A data. (F) Correction with increase the average sound velocity of 0–2000 m by 2 m/s. (G) Depth differences of the KR10-12 data from the KR07-08 data. (H) Correction with decrease the average velocity by 1 m/s. Blue bar scales indicate the swath range used for the seafloor displacement analysis (+/−22.5°).
This is a typical feature that the used SVP is incorrect and the velocity through the water column from sea surface to seafloor is faster than the real one. The miscalculation results in the curvature bathymetry of over-estimate of water depth, which shallows with distance from center of the swath (Figures 9C,G, 10A,C,G). In case the used SVP is slower than the real sound pathway velocity, the across track profile becomes a 'frown' curve ( Figures 9E, 10E). Usage of the correct SVP should make the shape of the depth difference profile flat across the track even though there is a static depth offset.
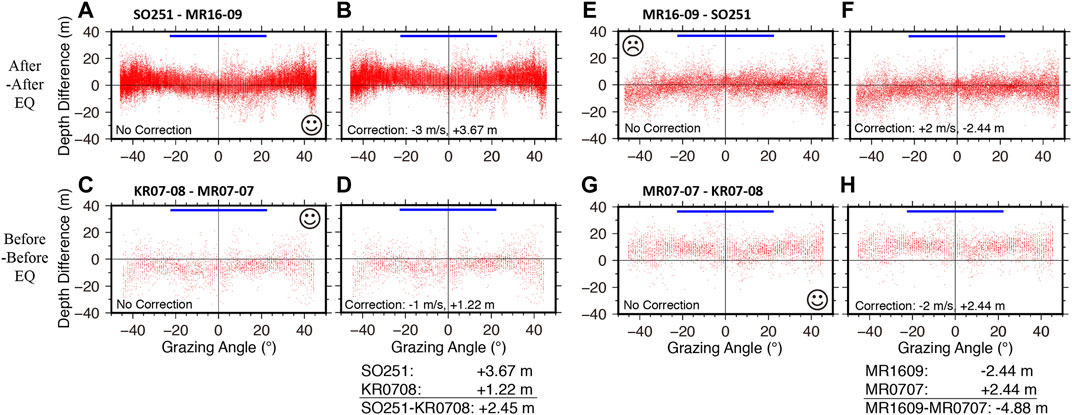
FIGURE 10. Across track plots of depth differences at the Q intersection. Red dots mark the depth differences at sounding locations. The location of grazing angle of 0° corresponds to the nadir of ship and the center of the swath. Upper panels show comparisons between data collected after the earthquake, and lower panels show comparisons between data collected before the earthquake. (A) Depth differences of the SO251A data from the MR16-09 Leg 4 data. (B) Sound velocity correction with decrease the average sound velocity of 0–2000 m by 3 m/s (C) Depth differences of the KR07-08 data from the MR0707 Leg 3 data (D) Correction with decrease the average velocity by 1 m/s (E) Depth differences of the MR16-09 Leg 4 data from the SO251A data. (F) Correction with increase the average sound velocity of 0–2000 m by 2 m/s. (G) Depth differences of the MR07-07 Leg 3 data from the KR07-08 data.. (H) Correction with decrease the average velocity by 2 m/s. Blue bar scales indicate the swath range used for the seafloor displacement analysis (+/−22.5°).
We attempted sound velocity corrections for the multibeam bathymetric data by changing the average sound velocity from the water depth of 0 m down to 2000 m. The sound velocity deeper than 2000 m was not changed. In the situation that there is an error in the sound velocity, according to Snell's law, the following equation is established (Figure 11).
where Vave is average sound velocity from sea surface to seafloor, and ΔVave is error of the average sound velocity. θ is beam angle and the center of the swath is zero. Δθ is error of the beam angle. In the case that Δθ is small, the relation of the error of beam angle and the error of average sound velocity is given as
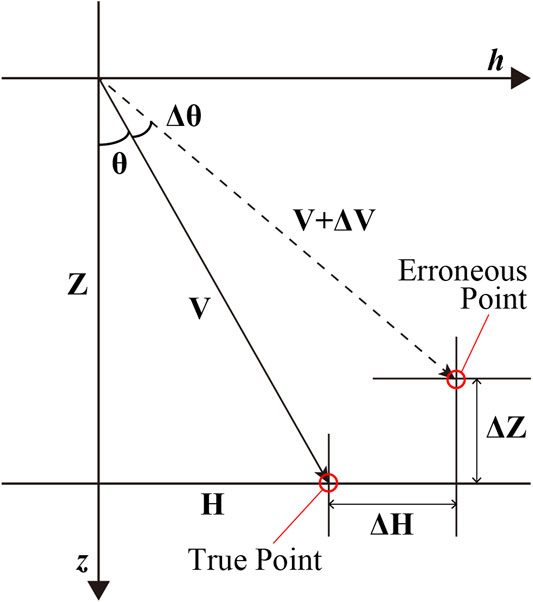
FIGURE 11. Schematic figure of the bathymetric error derived from the sound velocity error.
The geometrical relations between the true sounding point and the erroneous sounding point are described by the following equations (Figure 11).
where Z is water depth, and ΔZ is error of the water depth. H is horizontal distance of sounding location, and ΔH is error of the horizontal distance of sounding location. H is denoted as
Substituting Eq. 2 into Eq. 3 and Eq. 4, the following equations are derived.
The correction for the bathymetric data was performed using the approximation Eqs 6, 7.
We searched the correction value by minimizing the standard deviation of the depth difference (Figure 12). As the result of the searching in the case of the SO251A data, sound velocity correction with decrease the average sound velocity of 0–2000 m by 6 m/s satisfies the condition. The average value of the water depth within the beam angle of 45° moved 7.44 m upward from the uncorrected data (Figure 9B). On the other hand, across track depth of the KR07-08 sounding data were compared with the pre-earthquake KR10-12 depth grid (Figure 9C). This profile also shows a 'smile'. Sound velocity correction with decrease the average sound velocity of 0–2000 m by 4 m/s satisfies the condition. The average value of the water depth within the beam angle of 45° moved 4.96 m upward from the uncorrected data (Figure 9D). Consequently, the depth difference value of the SO251-KR0708 survey is expected to be 2.48 m higher at the P intersection (Orange circles in Figures 6A, 9). Other results of the sound velocity corrections following the same procedure are summarized in Figures 9, 10; Table 2.
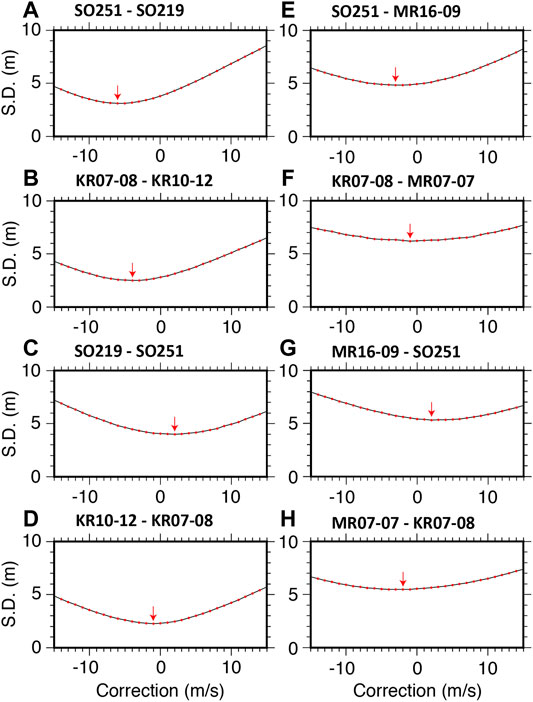
FIGURE 12. Line graphs showing standard deviations of depth differences for given sound velocity corrections. At the P intersection, the standard deviations of depth differences of (A) the SO251A data from the SO219A data (B) the KR07-08 data from the KR10-12 data (C) the SO219A data from the SO251A data, and (D) the KR10-12 data from the KR07-08 data, respectively. At the Q intersection (E) the SO251A data from the MR16-09 Leg 4 data (F) the KR07-08 data from the MR07-07 Leg 3 data (G) the MR16-09 Leg 4 data from the SO251A data. (H) the MR07-07 Leg 3 data from the KR07-08 data, respectively. Red arrows point locations where the standard deviations are minimum, and indicate estimated values of the sound velocity corrections. S.D.: Standard deviation.
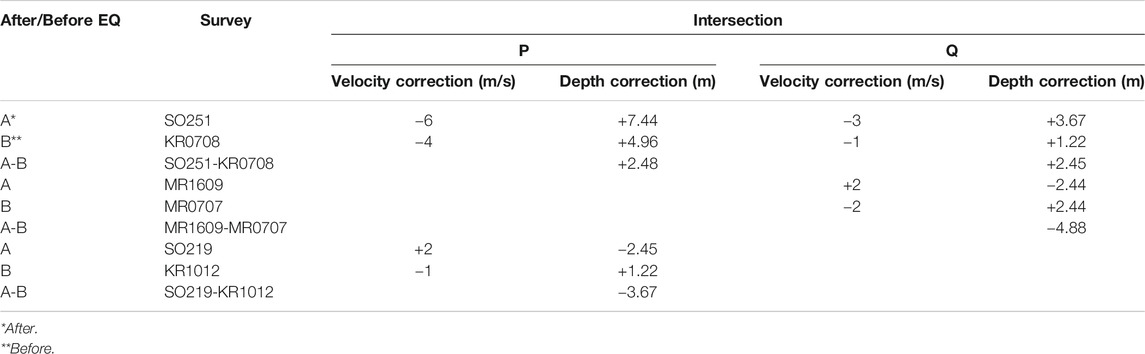
TABLE 2. Sound velocity corrections on the SO251-KR0708 survey track.
After the sound velocity corrections, the discrepancies of the depth differences between the survey tracks can be reduced successfully (Figure 6A). There will be gaps of 2.7 m between the SO251-KR0708 data and the SO219-KR1012 data at the P intersection, and 0 m the SO251-KR0708 data and the MR1609-MR0707 data at the Q intersection. The gap of 2.7 m still remains at the P intersection. The following are possible causes. The bathymetric data may be affected by ship's course changes in the P intersection area as shown in the bends of the SO219-KR1012 survey track (Figure 5). Since the adjustment of static depth differences and offsets of locations was estimated on the seaward slope, the error may be due to the inadequate and short length of the seaward slope area of the SO219-KR1012 survey track. The result of the attempt of sound velocity correction suggests that an appropriate sound velocity correction contributes improvement of estimation of the seafloor vertical displacement, although complete sound velocity corrections are not allowed in our surveys because of the limited number of cross tracks and no cross track on the seaward slope as the reference area.
Repeated Bathymetric Survey Plan for Seafloor Geodesy
During the bathymetric survey, multiple measurements of XBT or CTD along the survey track are necessary to know the spatiotemporal variation of SVPs. Designing of multi-track survey is of benefit to the sound velocity correction afterward. Several crossing tracks can observe a set of across-track curvature of the bathymetric profiles (Figure 13). Or parallel sailed tracks overlapping these multibeam swaths may be able to acquire data for the sound velocity correction continuously. The frequency of XBT or CTD measurements and the number of auxiliary survey tracks probably depend on the oceanographic condition in the survey area. For example, the Japan Trench off Tohoku is a converging area of a warm current (Kuroshio) and a cold current (Oyashio). The oceanographic condition is complex and varies seasonally and spatially. Therefore, we should have conducted frequent SVP measurements and set several cross tracks. To constrain the sound velocity profile the whole length of the survey track, probably at least three control points are needed on the landward slope, at the trench axis, and on the seaward slope. Especially the reference point on the seaward slope is necessary because the adjustment of static depth differences was estimated on the seaward slope. An accomplished method for sound velocity correction in deep water and rough topography areas would be valuable. In the area, depth soundings vary widely and distort the shape of the curvature bathymetry. Gentle curves around the minimums as shown in Figure 12 suggest the uncertainty of estimation and the less constraint condition.
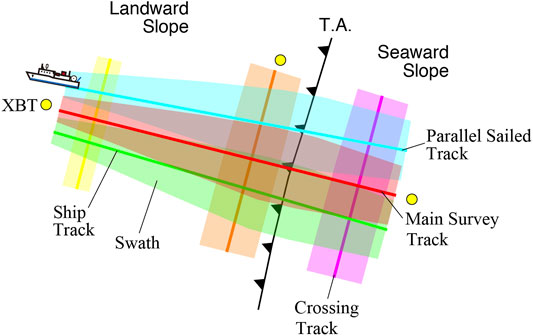
FIGURE 13. Schematic figure of the repeated multibeam bathymetric survey.
The resolution and uncertainty of the results shown in our analyses largely depend on the quality of the pre-earthquake bathymetric data. These surveys were conducted with a speed of 12–16 knots in transit. Such high speed results in low spatial resolution (Fujiwara et al., 2015). An adequate survey speed keeping a good balance between a slow speed and a stable ship's attitude to obtain high spatial resolution and low noise data should be chosen.
In our surveys, precise roll and pitch biases calibration values were not given and thus were calibrated using the survey track data in the study area. However, the seaward slope is not always appropriate place for the roll and pitch bias calibrations. Especially, the pitch bias error seriously affects the estimation of the seafloor displacement. The pitch bias also could cause an error in estimation of depth difference on sloped seafloor areas. Obviously, calibration values of roll and pitch biases should be independently determined by a well-organized bias inspection survey. In the future, we will investigate these strategies and develop a more optimal design for the bathymetric survey.
Conclusion
The repeated bathymetric survey was carried out under the condition of the post-earthquake at an interval of two months using multibeam echo sounders one generation ago with slower speeds of 4-5 knots. XBT measurements to know in-situ sound velocity profiles (SVPs) might not be sufficient in time and space. The survey achieved the repeatability of less than ±1 m in the vertical direction and less than 20 m in the horizontal direction as shown in the results of the KR11E05-YK11E05 survey.
The repeated bathymetric surveys were conducted before and after the March 11, 2011 Tohoku-oki earthquake in the northern Japan Trench. We probably observed less than several meters in seafloor vertical displacements and less than 20 m in seafloor horizontal displacement on the outermost landward slope as shown in the results of the SO251-KR0708, the MR1609-MR0707, and the SO219-KR1012 surveys.
In light of the lessons learned from our surveys, the following strategies should be implemented to reduce uncertainties of measurements and to carry a potential to improve accuracy of the seafloor displacement observation when repeated bathymetric surveys for the purpose of seafloor geodesy are newly planed. The survey ship maintains a slower and stable speed so that high-density sampling and low noise data are obtained. The calibration values of roll and pitch biases independently determined should be given. During the bathymetric survey, multiple measurements of SVPs along the survey track are necessary to know the spatiotemporal variation of SVPs. A multi-track survey having crossing tracks or overlapping tracks may be of benefit to the sound velocity correction afterward.
Technology of multibeam echo sounders is constantly evolving. For the future, repeated acquisition of high resolution and accuracy bathymetric data using state-of-the-art technology is important to quantitative discussion of the seafloor displacement and the seafloor deformation caused by even smaller magnitude earthquakes and following tsunamis.
Data Availability Statement
The original contributions presented in the study are included in the article, further inquiries can be directed to the corresponding author.
Author Contributions
TF designed the research, contributed to the data acquisition, analyzed the data, prepared all figures, and wrote the manuscript.
Funding
The R/Vs Kairei, Yokosuka, and Mirai cruises’ funding were from JAMSTEC, and the R/V Sonne cruises were supported by the Federal Ministry of Education and Research of Germany (BMBF) and German Research Foundation (DFG).
Conflict of Interest
The author declares that the research was conducted in the absence of any commercial or financial relationships that could be construed as a potential conflict of interest.
Acknowledgments
I am grateful to A.K. Bachmann, C. dos Santos Ferreira, G. Fujie, Y. Kaiho, T. Kanamatsu, Y. Kaneda, T. Kasaya, S. Kodaira, A. Murata, T. No, T. Sato, M. Strasser, N. Takahashi, T. Takahashi, T. Sun, and G. Wefer for contribution to acquisitions of bathymetric data after the 2011 Tohoku-oki earthquake and in scientific discussions. I am also indebted to JAMSTEC Data Management Office for providing archived bathymetric data before the 2011 earthquake. I wish to thank two reviewers for their valuable comments in improving the manuscript. Bathymetric data used in this paper are available at JAMSTEC (http://www.godac.jamstec.go.jp/darwin/e) and at German Hydrographic Survey (BSH) databases (http://www.bsh.de/en/Marine_data/Hydrographic_surveys_and_wreck_search/Bathymetry/index.jsp). All the other datasets generated for this study are available on request to the corresponding author.
References
Caress, D. W., Chayes, D. N., and dos Santos Ferreira, C. (2021). MB-System: seafloor mapping software: Processing and display of swath sonar data, CA, United States: Monterey Bay Aquarium Research Institute (MBARI) Available at: https://www.mbari.org/products/research-software/mb-system/
Dettmer, J., Hawkins, R., Cummins, P. R., Hossen, J., Sambridge, M., Hino, R., et al. (2016). Tsunami Source Uncertainty Estimation: The 2011 Japan Tsunami. J. Geophys. Res. Solid Earth. 121 (6), 4483–4505. doi:10.1002/2015JB012764
Fujiwara, T., dos Santos Ferreira, C., Bachmann, A. K., Strasser, M., Wefer, G., Sun, T., et al. (2017). Seafloor Displacement after the 2011 Tohoku-Oki Earthquake in the Northern Japan Trench Examined by Repeated Bathymetric Surveys. Geophys. Res. Lett. 44 (23), 833–911. doi:10.1002/2017GL075839
Fujiwara, T., Kodaira, S., No, T., Kaiho, Y., Takahashi, N., and Kaneda, Y. (2011). The 2011 Tohoku-Oki Earthquake: Displacement Reaching the Trench axis. Science. 334 (6060), 1240. doi:10.1126/science.1211554
Fujiwara, T., Masaki, Y., and Yamamoto, F. (2015). Evaluation of Spatial Resolution and Estimation Error of Seafloor Displacement Observation from Vessel-Based Bathymetric Survey by Use of AUV-Based Bathymetric Data. Mar. Geophys. Res. 36 (1), 45–60. doi:10.1007/s11001-014-9242-8
Hossen, M. J., Cummins, P. R., Dettmer, J., and Baba, T. (2015). Tsunami Waveform Inversion for Sea Surface Displacement Following the 2011 Tohoku Earthquake: Importance of Dispersion and Source Kinematics. J. Geophys. Res. Solid Earth. 120 (9), 6452–6473. doi:10.1002/2015JB011942
Hydrographic and Oceanographic Department, Japan Coast Guard and JAMSTEC (2011). Compilation of Tohoku-Oki Bathymetric Data before the 2011 Tohoku-Oki Earthquake (In Japanese). Seismol Soc. Jpn. News Lett. 23 (2), 35–36.
Kido, M., Osada, Y., Fujimoto, H., Hino, R., and Ito, Y. (2011). Trench-normal Variation in Observed Seafloor Displacements Associated with the 2011 Tohoku-Oki Earthquake. Geophys. Res. Lett. 38 (24), L24303. doi:10.1029/2011GL050057
Kodaira, S., Fujiwara, T., Fujie, G., Nakamura, Y., and Kanamatsu, T. (2020). Large Coseismic Slip to the Trench during the 2011 Tohoku-Oki Earthquake. Annu. Rev. Earth Planet. Sci. 48 (1), 321–343. doi:10.1146/annurev-earth-071719-055216
Kodaira, S., No, T., Nakamura, Y., Fujiwara, T., Kaiho, Y., Miura, S., et al. (2012). Coseismic Fault Rupture at the Trench axis during the 2011 Tohoku-Oki Earthquake. Nat. Geosci. 5 (9), 646–650. doi:10.1038/NGEO1547
Levitus, S. E. (1982). Climatological Atlas of the World Ocean. Washington DC: NOAA Professional Paper 13, US Government Printing Office, 173pp
Maksymowicz, A., Chadwell, C. D., Ruiz, J., Tréhu, A. M., Contreras-Reyes, E., Weinrebe, W., et al. (2017). Coseismic Seafloor Deformation in the Trench Region during the Mw8.8 Maule Megathrust Earthquake. Sci. Rep. 7, 45918. doi:10.1038/srep45918
Matsumoto, K., Takanezawa, T., and Ooe, M. (2000). Ocean Tide Models Developed by Assimilating TOPEX/POSEIDON Altimeter Data into Hydrodynamical Model: A Global Model and a Regional Model Around Japan. J. Oceanography. 56, 567–581. doi:10.1023/A:1011157212596
Nakamura, Y., Fujiwara, T., Kodaira, S., Miura, S., and Obana, K. (2020). Correlation of Frontal Prism Structures and Slope Failures Near the Trench axis with Shallow Megathrust Slip at the Japan Trench. Sci. Rep. 10, 11607. doi:10.1038/s41598-020-68449-6
Romano, F., Trasatti, E., Lorito, S., Piromallo, C., Piatanesi, A., Ito, Y., et al. (2014). Structural Control on the Tohoku Earthquake Rupture Process Investigated by 3D FEM, Tsunami and Geodetic Data. Sci. Rep. 4, 5631. doi:10.1038/srep05631
Satake, K., Fujii, Y., Harada, T., and Namegaya, Y. (2013). Time and Space Distribution of Coseismic Slip of the 2011 Tohoku Earthquake as Inferred from Tsunami Waveform Data. Bull. Seismological Soc. America. 103, 1473–1492. doi:10.1785/0120120122
Sato, M., Ishikawa, T., Ujihara, N., Yoshida, S., Fujita, M., Mochizuki, M., et al. (2011). Displacement above the Hypocenter of the 2011 Tohoku-Oki Earthquake. Science. 332, 1395. doi:10.1126/science.1207401
Sun, T., Wang, K., Fujiwara, T., Kodaira, S., and He, J. (2017). Large Fault Slip Peaking at Trench in the 2011 Tohoku-Oki Earthquake. Nat. Commun. 8, 14044. doi:10.1038/ncomms14044
Tappin, D. R., Grilli, S. T., Harris, J. C., Geller, R. J., Masterlark, T., Kirby, J. T., et al. (2014). Did a Submarine Landslide Contribute to the 2011 Tohoku Tsunami? Mar. Geology. 357, 344–361. doi:10.1016/j.margeo.2014.09.043
Tomita, F., Kido, M., Ohta, Y., Iinuma, T., and Hino, R. (2017). Along-trench Variation in Seafloor Displacements after the 2011 Tohoku Earthquake. Sci. Adv. 3, e1700113, doi:10.1126/sciadv.1700113
Watanabe, S.-i., Sato, M., Fujita, M., Ishikawa, T., Yokota, Y., Ujihara, N., et al. (2014). Evidence of Viscoelastic Deformation Following the 2011 Tohoku-Oki Earthquake Revealed from Seafloor Geodetic Observation. Geophys. Res. Lett. 41, 5789–5796. doi:10.1002/2014GL061134
Wessel, P., and Smith, W. H. F. (1991). Free Software Helps Map and Display Data. EOS Trans. AGU. 72, 441. doi:10.1029/90eo00319
Keywords: repeated bathymetric survey, multibeam bathymetry, Japan trench, 2011 tohoku-oki earthquake tsunami, seafloor displacement
Citation: Fujiwara T (2021) Seafloor Geodesy From Repeated Multibeam Bathymetric Surveys: Application to Seafloor Displacement Caused by the 2011 Tohoku-Oki Earthquake. Front. Earth Sci. 9:667666. doi: 10.3389/feart.2021.667666
Received: 14 February 2021; Accepted: 29 April 2021;
Published: 13 May 2021.
Edited by:
Laura Wallace, University of Texas at Austin, United StatesReviewed by:
John DeSanto, University of Washington, United StatesDan Bassett, GNS Science, New Zealand
Copyright © 2021 Fujiwara. This is an open-access article distributed under the terms of the Creative Commons Attribution License (CC BY). The use, distribution or reproduction in other forums is permitted, provided the original author(s) and the copyright owner(s) are credited and that the original publication in this journal is cited, in accordance with accepted academic practice. No use, distribution or reproduction is permitted which does not comply with these terms.
*Correspondence: Toshiya Fujiwara, toshi@jamstec.go.jp