 Jessica Z. Buser-Young1
 Laura L. Lapham2
 Andrew R. Thurber1,3
 Kenneth H. Williams4,5
 Frederick S. Colwell3*
- 1Department of Microbiology, College of Science, Oregon State University, Corvallis, OR, United States
- 2Chesapeake Biological Laboratory, University of Maryland Center for Environmental Science, Solomons, MD, United States
- 3College of Earth, Ocean, and Atmospheric Sciences, Oregon State University, Corvallis, OR, United States
- 4Lawrence Berkeley National Laboratory, Berkeley, CA, United States
- 5Rocky Mountain Biological Laboratory, Gothic, CO, United States
Biogeochemical processes capable of altering global carbon systems occur frequently in Earth’s Critical Zone–the area spanning from vegetation canopy to saturated bedrock–yet many of these phenomena are difficult to detect. Observation of these processes is limited by the seasonal inaccessibility of remote ecosystems, such as those in mountainous, snow- and ice-dominated areas. This isolation leads to a distinct gap in biogeochemical knowledge that ultimately affects the accuracy and confidence with which these ecosystems can be computationally modeled for the purpose of projecting change under different climate scenarios. To examine a high-altitude, headwater ecosystem’s role in methanogenesis, sulfate reduction, and groundwater-surface water exchange, water samples were continuously collected from the river and hyporheic zones (HZ) during winter isolation in the East River (ER), CO watershed. Measurements of continuously collected ER surface water revealed up to 50 μM levels of dissolved methane in July through September, while samples from 12 cm deep in the hyporheic zone at the same location showed a spring to early summer peak in methane with a strong biogenic signature (<65 μM, δ13C-CH4, −60.76‰) before declining. Continuously collected δ18O-H2O and δ2H-H2O isotopes from the water column exhibited similar patterns to discrete measurements, while samples 12 cm deep in the hyporheic zone experienced distinct fluctuations in δ18O-H2O, alluding to significant groundwater interactions. Continuously collected microbial communities in the river in the late fall and early winter revealed diverse populations that reflect the taxonomic composition of ecologically similar river systems, including taxa indicative of methane cycling in this system. These measurements captured several biogeochemical components of the high-altitude watershed in response to seasonality, strengthening our understanding of these systems during the winter months.
Introduction
Headwater streams, the primary entity in the hierarchy of watersheds (Lowe and Likens, 2005), are estimated to account for nearly three quarters of stream channel length in U.S. watersheds (Leopold et al., 1992). Implicit to the concept of headwater streams is a tight terrestrial-aquatic coupling and accordingly, an outsized sensitivity to natural and human disturbances (Lowe and Likens, 2005). Many headwater streams occur at high elevation and these locations may be vulnerable to factors such as warming which can impact hydrologic and carbon cycles (Pepin et al., 2015). Presently, our ability to project changes to the biogeochemistry of these systems is limited (Hubbard et al., 2018), despite their known importance as players in carbon cycling (Saunois et al., 2016, 2020). Understanding the biogeochemistry of watersheds subject to change will be critical for stewardship of water supplies and ecosystems as microbial communities respond to factors associated with dynamic ecosystems (c.f., Cavicchioli et al., 2019).
Spatial and temporal variability in microbially-mediated ecosystem function are, in part, driven by the physical and chemical properties of the landscape and watershed with direct implications for carbon cycling (Küsel et al., 2016; Stegen et al., 2016; Hubbard et al., 2018; Jankowski and Schindler, 2019). Studies including hydrology, geomorphology, and biogeochemistry of watersheds have demonstrated carbon and methane emissions originated as terrestrial organic carbon input which is processed along the aquatic continuum (Vannote et al., 1980; Crawford et al., 2013). High altitude streams represent only 5% of the global surface area of rivers yet contribute up to 30% of the total carbon flux as CO2 (Horgby et al., 2019). Additionally, headwater basins have significant methane fluxes and unexpected dynamics (Schade et al., 2016; Flury and Ulseth, 2019). These include degassing events in peatland (Billett and Harvey, 2013) and Arctic (Street et al., 2016) headwater streams, lending much uncertainty to predictive modeling efforts (Saunois et al., 2020) and underestimations of methane release in extant models (Wallin et al., 2014). While these studies have identified the interplay between headwater stream dynamics and methane emission, these dynamics remain largely unknown where temporal variability coincides with remote and inaccessible locations.
Our understanding of biogeochemical processes including surface-subsurface flux between the hyporheic zone and overlying water column is reduced where sample acquisition is difficult or impossible. Potentially deterministic changes to ecosystem function occur during such intervals, such as the onset of a seasonal change, over an extended quiescent period, or when extreme events (e.g., storms or rapid thaws) punctuate a temporal record. High-altitude locations, such as where headwater streams are often located, are archetypical in this regard as they may be difficult to reach under the best conditions and are nearly impossible to reach when events that are linked to seasonal inclemency restrict access or defy our ability to time data collection with episodic events. In these cases, our understanding of ecosystem function can come through approaches that employ continuous measurements.
Despite the challenges in acquiring information on ecosystems in remote locations or during periods of inaccessibility, startling and pertinent discoveries have been made in many environmental settings that present extreme conditions. Examples include the detection of wintertime subsurface biogeochemical production of methane in Arctic permafrost (Xu et al., 2016; Zona et al., 2016), arctic lakes that freeze over (Marcek et al., 2021), methane emissions from anoxic bottom waters liberated by storms (Gelesh et al., 2016), biogeochemical dynamics occurring in karst aquifers linked to the ocean (Brankovits et al., 2018), and the discovery of a vast subsurface ecosystem in seafloor basalts (Cowen et al., 2003). In the case of the subseafloor basalts, recognition of this ecosystem provoked a series of new questions related to the significance of these deep-sea aquifers (Edwards et al., 2005). These studies support the importance of gathering data during periods of isolation, or in places that are practically inaccessible in order to complete our view of biogeochemical processes, notably carbon cycling.
Here we quantify seasonal variability of geochemical fluxes and microbiome structure in a high-altitude watershed during winter, as defined by snow and ice cover, and ascertain whether prominent biological and chemical features changed during this period. We aimed to address how do key elemental cycles and microbial communities vary in temporally inaccessible high-altitude watersheds? To answer this question and advance our understanding of watershed dynamics, we measured continuous seasonal riverine biogeochemistry including solute exchange and transformation between the hyporheic zone and water column inclusive of geochemistry and biological responses. Through analyzing novel geochemical datasets, we advance our knowledge on biogeochemical processes across a spatial aspect of a headwater basin, including identification of unexpected carbon cycling that result in methane release in the well-characterized high mountain watershed known as East River (ER).
Materials and Methods
Study Area and Sampling Approach
In this study we aim to understand solute exchange between groundwater and surface water processes at the U.S. Department of Energy’s Biological and Environmental Research (DOE BER) station located at East River (ER) in Crested Butte, CO, United States (Figure 1A). As a focus area for the DOE, ER serves to explore a system-of-systems perspective on watershed dynamics over seasonal and decadal timescales (Hubbard et al., 2018). Here, we deployed continuous water samplers called OsmoSamplers within ER at 38.922°N 106.951°W, elevation 2760.4 m, near to the DOE’s Teledyne ISCO automatic sampler (Model 3700; Teledyne ISCO, NE, United States; Varadharajan et al., 2020; Figure 1B). The OsmoSampler samples were interrogated for continuous dissolved methane, sulfate, and chloride concentrations, while the ISCO samples used in this study measured dissolved sulfate and chloride concentrations. River discharge data was obtained from Rosemary and Williams (2019), collected using instantaneous stream discharge measurements with a SonTek Flow Tracker® acoustic Doppler velocimeter. Corrections of flow were made using USGS’s stream gauge East River at Almont (ID 09112500). Precipitation data was accessed from the United States Department of Agriculture Natural Resource Conservation Service (USDA NRCS) snow telemetry (SNOTEL) Site 380.
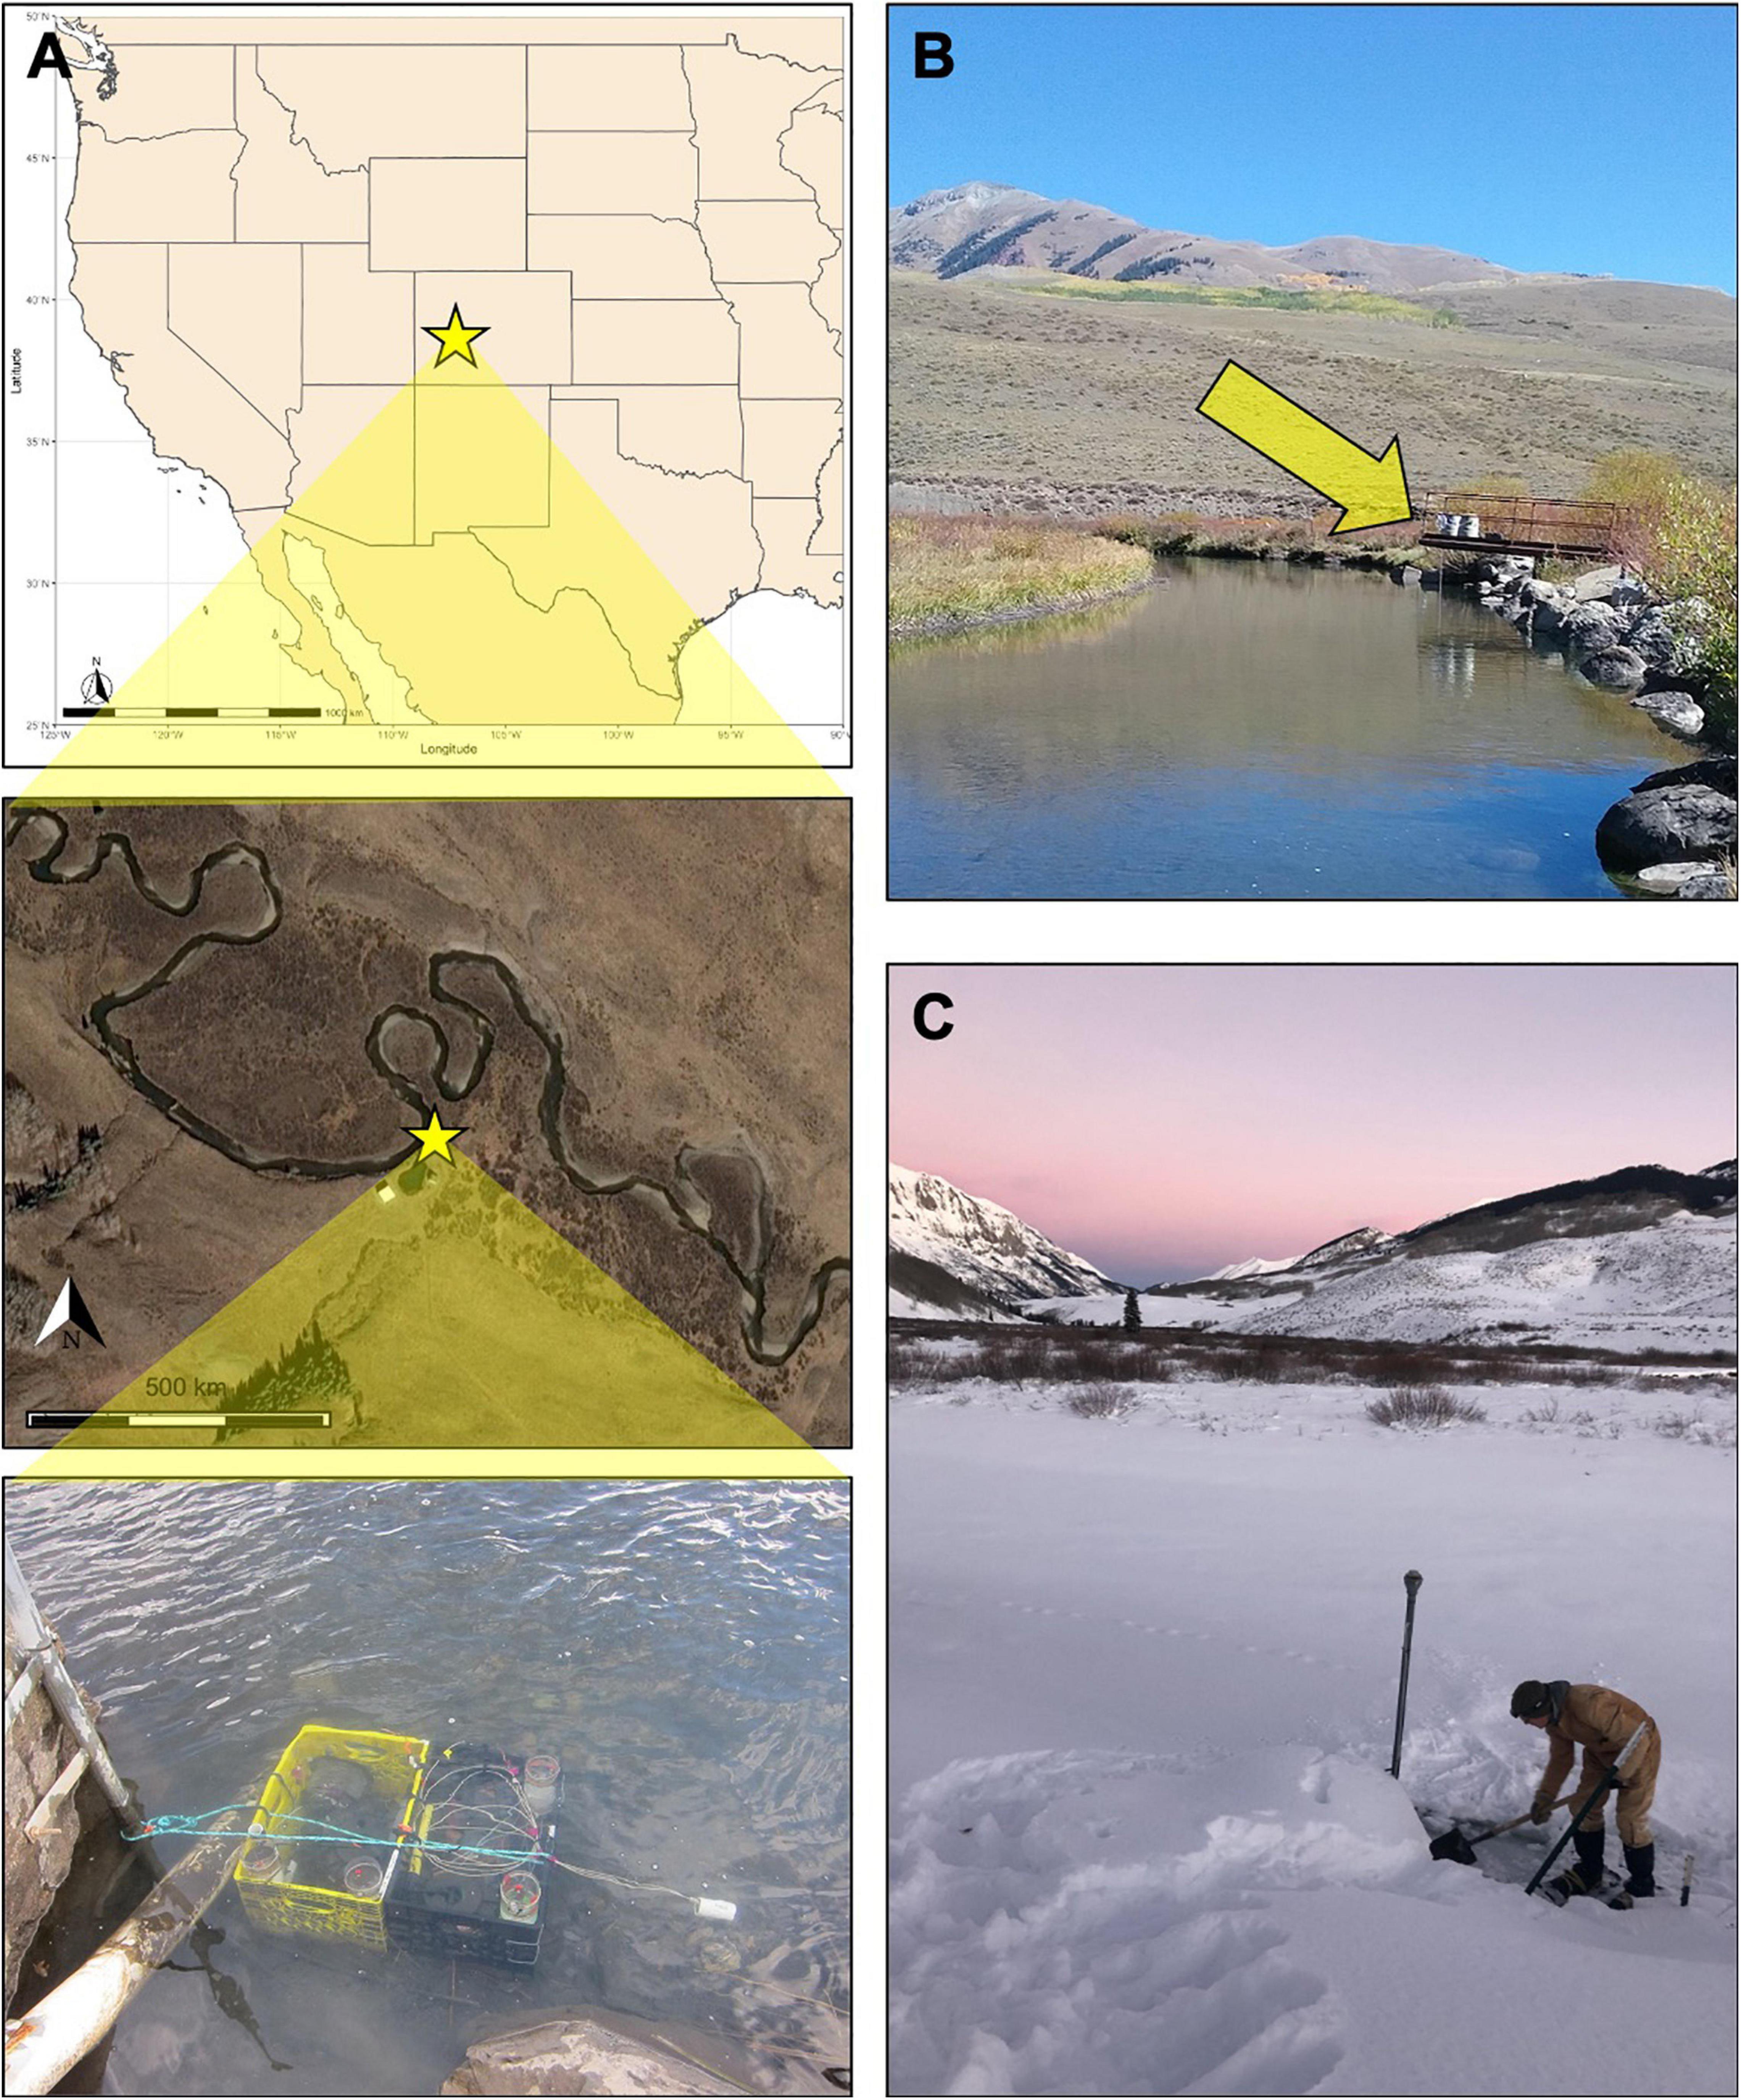
Figure 1. (A) Map of ER depicting the OsmoSampler deployment location and ISCO sampler (yellow star). Photo of OsmoSamplers anchored to the streambed using plastic crates taken during retrieval (September 2018). (B) View of the ISCO sampler (yellow arrow) from the location of the OsmoSampler package, approximately 30 m downstream. (C) Photo of ER during the wintertime retrieval of the BOSS sampler (December 2018). The post protruding from the snow cover marks the location of the OsmoSampler package.
OsmoSamplers continuously collect water using an OsmoPump that works by diffusion across a semipermeable membrane separating a saturated salt reservoir from a freshwater reservoir (Jannasch et al., 2004). Pumping rates are relatively slow, typically around 0.5 mL d–1. The OsmoPumps are then attached to long coils of small-bore tubing (outer diameter = 1.59 mm; inner diameter = 0.82 mm) which collects water at the tubing intake and stores the collected water (Figure 2A). Water collected and preserved along the tubing retains its authentic chemistry because diffusion is minimal in the small inner diameter tubing and filters at the inlet restrict microbial alteration (Jannasch et al., 2004). The whole apparatus (OsmoPump and tubing coil) is referred to as an OsmoSampler and can remain in aquatic environments for up to a year, depending on tubing length and pumping rates. Upon recovery, the tubing is cut into increments and liquid contents collected to give a time-integrated sample. The time stamp can then be determined because the pumping rate, tubing diameter, external temperature, and strength of osmotic gradient are known (Jannasch et al., 2004). Because the pumping rates are dependent upon temperature (higher rates associated with warmer temperatures) and the temperature in the river system varies, a temperature correction is applied as done in Gelesh et al. (2016).
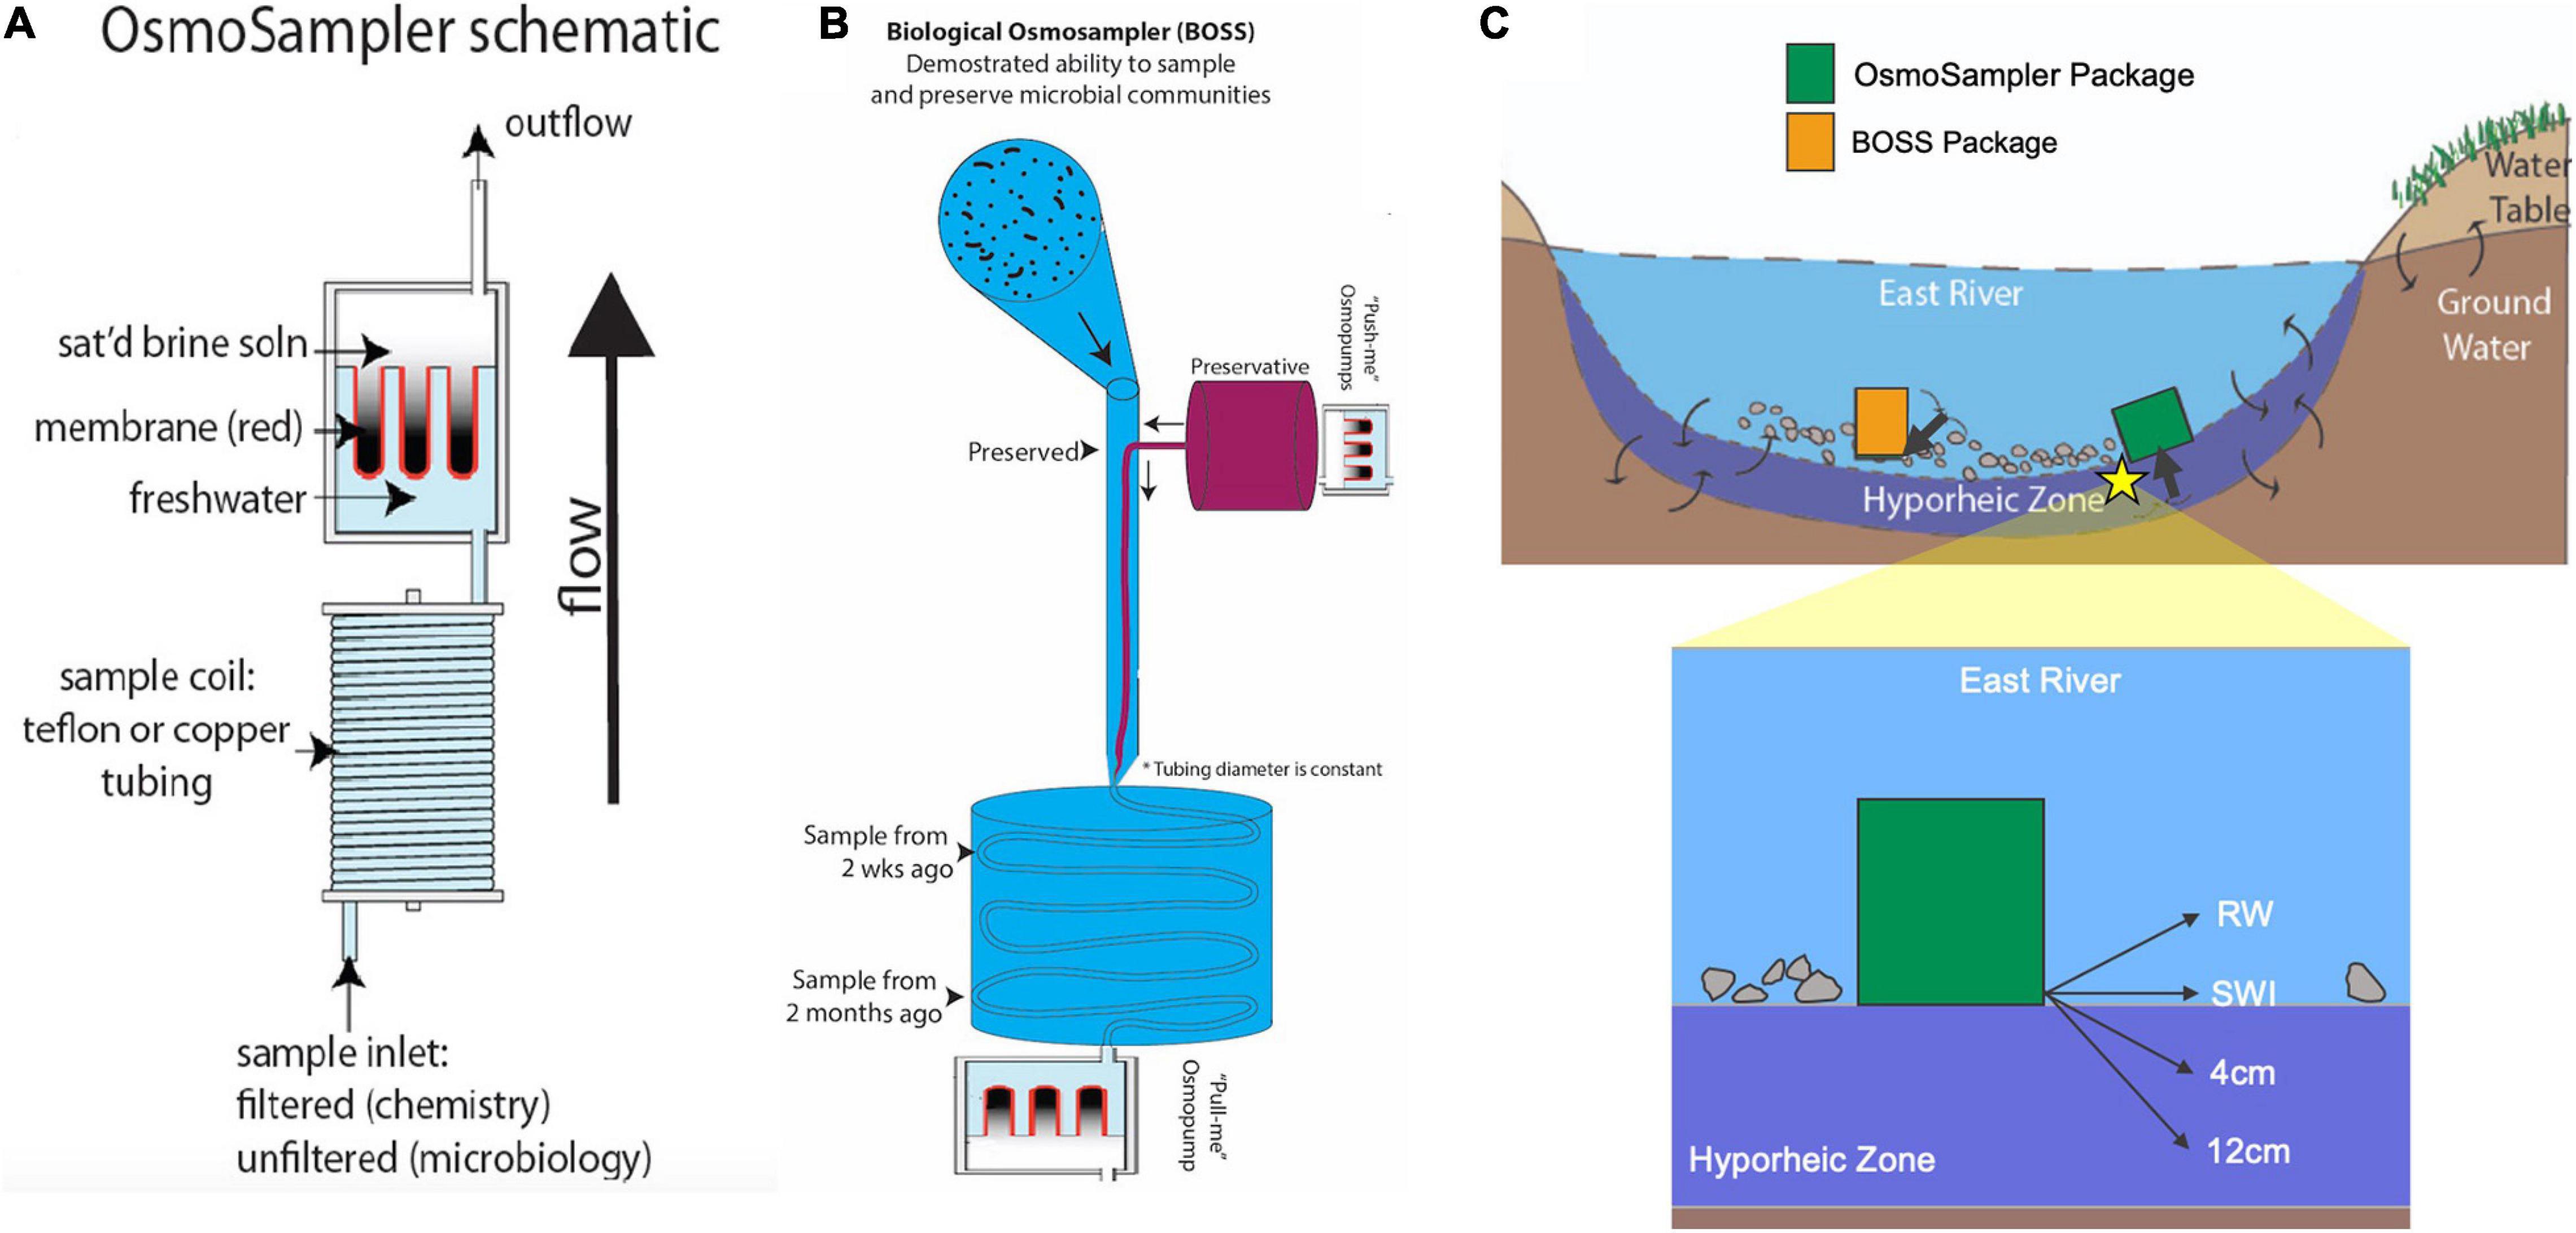
Figure 2. (A) OsmoSampler schematic showing pump, sample coil, and sample inlet. (B) Illustration of Biological OsmoSampler function. (C) River cross-section showing sampling schematic depicting OsmoSampler and BOSS packages and inlet ports (highlighted arrows). Star indicates location of close-up schematic of inlet port locations within the hyporheic zone and water column. Schematics are not to scale.
For the river sampling, four OsmoSamplers were placed in the river, with tubing inlets sampling the river water (RW) column, sediment water interface (SWI), 4 cm into the hyporheic zone, and 12 cm into the hyporheic zone (Figures 2B,C). All OsmoSamplers contained copper small-bore tubing excluding the OsmoSampler inlet placed in the water column which contained Teflon tubing. The hyporheic sampling ports were supported along a PVC tube (sensu Wilson et al., 2015). It was difficult to insert the tube into the riverbed substrate, so the inlet was inserted as far as possible into the sediment and then further buried with river sand and gravel until flush with the sediment surface. The sample inlets were fitted with 0.2 μm rhizon filters to exclude detritus or microbes that may alter the chemistry during long-term storage within the sample tubing. The spatial distribution of these samplers aimed to gather a cohesive picture of surface water and hyporheic water dynamics over a year-long deployment. The entire sampler array was placed in crates (33 cm × 33 cm × 27 cm), hereby identified as the OsmoSampler package, and deployed from November 2017 to September 2018. Upon collection of the geochemical OsmoSamplers, bubbles flowed out of the sediment. These bubbles (∼8 mL gas volume) were collected into a glass vial (13.5 mL volume) to bring back to the lab for analysis of methane concentrations and stable carbon isotopes. Continuous water temperature was measured using a HOBO Data Logger (Oneset, Bourne, MA) anchored to the OsmoSampler package.
Sample collection by DOE’s Teledyne ISCO automatic sampler used automated sampler bottles containing mineral oil to mitigate evaporation during sampling. All samples were filtered through a 0.45 μm filter following sample retrieval into sealed vials and refrigerated until analysis. ISCO surface water samples are part of a long-term study; however, the research described herein used only samples acquired during dates that overlap with the OsmoSampler deployment. Stable water isotope data was collected according to the described methods and sampling in Williams et al. (2020a). Cation samples were collected as reported by Williams et al. (2020b).
Along with the samplers collecting water for geochemical measurements, another OsmoSampler deployment from September 2018 to December 2018 was configured for microbial sampling (sensu Robidart et al., 2013). The Biological OsmoSampler System (BOSS) used two OsmoSamplers, connected in series, with one sampler collecting a sample and the second adding a preservative to the sample in situ immediately to preserve microbes present in the water for microbial community characterization. One OsmoSampler was used to collect the water sample in the same manner as described above, while a slower (0.25 mL day–1) OsmoSampler introduced 2x concentrated preservative (RNA/DNA Shield, Zymo Research, Irvine, CA, United States) into the sample stream at the inlet. The BOSS was deployed at the same DOE BER station location at ER in the manner described above for RW sampling, where the inlet port sampled microbes from the water column (Figure 2B). In addition to the BOSS samples, we collected microbiological samples from the water column (referred to as “discrete samples”) during BOSS deployment and retrieval. During BOSS deployment in late September 2018, four discrete samples were collected by filtering 120 mL RW onto a 0.22 μm Sterivex filter unit (Millipore Sigma, Darmstadt, Germany). Upon BOSS retrieval in December 2018, two discrete samples were collected by filtering 120 and 60 mL RW onto a Sterivex Filter Unit. These samples are hereby referred to as the “discrete” samples. Smaller volumes (60 mL) and fewer replicates were collected because the sample water repeatedly froze during filtration with the Sterivex filter unit. This sample complication highlights the difficulties of, and challenges associated with, wintertime sampling in high altitude environments (Figure 1C). All discrete samples were placed on ice, filters were removed from the filter holder and placed in a DNA/RNA shield within a few hours of collection prior to being shipped to Oregon State University, where they were stored at −80°C upon arrival until DNA extraction.
Geochemical Measurements
Samples collected by the OsmoSamplers were measured for dissolved methane, sulfate, chloride concentrations, and stable isotope ratios including δ2H-H2O, δ18O-H2O, and δ13C-CH4. The tubing from the OsmoSampler systems collected in September 2018 from the respective RW, SWI, and HZ samples was sectioned into 4.5 and 1.5 m lengths to obtain ∼5 day resolution as calculated from the rate of sampling (c.f. Jannasch et al., 2004). The contents were expelled using a jewelry roller (c.f., Gelesh et al., 2016), and the fluid from the short section (∼1.5 mL) was stored in 2 mL microcentrifuge tubes, with aliquots taken to measure for sulfate and chloride concentrations via ion chromatography using AS40 analytical column and a conductivity detector (Dionex ICS1000) with 2% precision. Sulfate measurements from the RW samples were below detection limit. All samples from the RW time-series were analyzed, but only every other SWI and HZ sample was analyzed. Fluids from the large section (∼2 mL) were injected into a zero-air flushed, pre-combusted 10 mL glass serum vial, using caution not to contaminate the sample with air (Gelesh et al., 2016). Using a headspace equilibration technique, the sample was injected with ∼8 mL of brine solution, and an aliquot of the remaining headspace was extracted and injected into a gas chromatograph with a flame ionization detector (SRI 8610C Multi Gas, 4 mL loop injection, MolSieve 13X column). Final dissolved methane concentrations were calculated by correcting for dilutions and using Henry’s Law, as detailed in Magen et al. (2014). Precision was 2%. Methane dissolved in river water samples was below detection limit (<100 ppm). Every-other sample from SWI, 12 cm HZ, and 4 cm HZ were analyzed in this manner. For samples with ample CH4 concentrations (>100 ppm in headspace), a headspace aliquot was then injected into a cavity ring down spectrometer (Picarro 2201i) for stable carbon isotope ratio of methane determination (Marcek et al., 2021). Two certified gas standards were used (Isometrics, 2,500 ppm, −66.5 and −38.3‰), and precision was 0.5‰. Additionally, stable carbon isotope ratios were also measured on a bubble sample collected in December 2020. The sample was diluted 20x with zero-air and injected into the cavity ring down spectrometer. The sample was stored in the fridge and analyzed in December 2020. Water isotopes (δ18O-H2O and δ2H-H2O) were also analyzed for every other OsmoSampler sample from SWI, 4 cm, and 12 cm using a GasBench® peripheral interfaced to an isotope ratio mass spectrometer (Thermo Delta V, precision of 0.1 and 1‰ for δ18O-H2O and δ2H-H2O, respectively) at University of Maryland Center for Environmental Science (Cooper et al., 2016).
The samples collected by DOE’s Teledyne ISCO automatic sampler were measured for fluoride, phosphate, nitrate, sulfate, and chloride, yet in this study we only assessed sulfate and chloride concentrations. Anions from the ISCO sampler were measured using a Dionex AS-40 autosampler and Dionex ICS-2100 anion chromatograph containing AS11 analytical and AG11 guard columns (Williams et al., 2020b). Stable water isotopes from the ISCO sampler were measured using either a Picarro L2130-i or Los Gatos Research Liquid Water Isotope Analyzer, both using laser absorbance spectroscopy using a cavity ringdown detector (precision of 0.025 and 0.1‰ for δ18O and δ2H, respectively, Williams et al., 2020a).
Microbiological Measurements
The BOSS Teflon collection tubing was partitioned into two sections, both approximately 7 m in length, to obtain approximately 1-month resolution of the microbial communities (c.f. Jannasch et al., 2004). The sample liquid of both tubing sections was extracted from the Teflon by using a syringe to force the liquid into autoclaved and acid washed Falcon tubes (Thermo Fisher Scientific, Waltham, MA, United States), yielding 12 mL of sample for the first length, and 7 mL of sample for the second length, roughly representing October 2018 (BOSS1) and November 2018 (BOSS2) sampling periods, respectively. The extracted samples were filtered onto a 0.2 μm polyethersulfone (PES) filter (Sterlitech, Kent, WA, United States) using a vacuum filter tower, and the PES filter was subsequently dissolved using phenol chloroform. Additionally, the discrete Sterivex filter samples were removed from the filter unit as described by Doherty et al. (2017), and immediately dissolved using phenol chloroform.
All biological samples were extracted using Zymo Research DNA Extraction kit (Zymo Research, Irvine, CA, United States). All tools and glassware were sterilized using UV wavelength, 10% HCl bath, and autoclaved before and after each sample. Forceps were additionally ethanol and flame sterilized between each sample. After BOSS extraction and subsequent tool sterilization, an autoclaved Millipore water sample was flushed through a PES filter using the vacuum filter tower and carried through subsequent extractions as a negative control.
Microbial community structure was characterized by DNA amplification in triplicate of the V4 region of the 16S rRNA gene using universal 515 forward and 806 reverse primers (Apprill et al., 2015). PCR protocols followed those used by the Earth Microbiome Project (Caporaso et al., 2011), without modifications. Due to low DNA yield, as quantified by Qubit (Thermo Fisher Scientific, Waltham, MA, United States) using the dsDNA High Sensitivity Assay Kit, a second round of amplification was carried out using the PCR product as template. Gel electrophoresis was used to identify potential amplification problems. Acceptably low concentrations (<9.94 ng/μL) of nucleic acid in all negative controls were obtained. Triplicate samples were purified with QIAquick PCR purification kit (Qiagen, Hilden, Germany) and pooled in equimolar amounts. Sample and negative control amplicons were sequenced at OSU’s Center for Genome Research and Biocomputing using Illumina MiSeq paired end 250 bp sequencing.
Amplicon sequence variants (ASVs) were used to compare the samples from both within this study and with other high mountain streams. The sequenced samples (forward reads only) were trimmed using Qiime2 (version 2019.4) DADA2 plug-in at 200-sequence base to capture a quality score ranging between 30 and 35; the quality of the reverse reads was low enough that we omitted them from this study (Callahan et al., 2016; Bolyen et al., 2019). DADA2 ASV tables were annotated using version 132 of the SILVA database (Quast et al., 2013). Additional sequences used for this research were accessed from the National Center for Biotechnology Information’s Sequence Read Archive (NCBI SRA). The sequences originated from two individual datasets that describe microbial taxa collected in the summer of 2015 from: (1) snowmelt-fed alpine streams located within the Rocky Mountains in Glacier National Park and Grand Teton National Park (GenBank NCBI SRA BioProject PRJNA480048; Hotaling et al., 2019); and (2) sediment-water-interface communities from Meander A within East River, CO, located approximately 91.5 m downstream from our BOSS deployment (GenBank NCBI SRA PRJNA515362; Saup et al., 2019). Sequences were downloaded from NCBI database November 30, 2019 (Supplementary Table 1).
Statistical analyses were conducted using R vegan version 2.5-6 to obtain alpha Shannon and Simpson’s diversity metrics. To explore beta diversity, R v3.6.0 “metaMDS” function was used to create non-metric multidimensional scaling plots based on Bray-Curtis dissimilarity. Significant differences between samples were determined using permutational analysis of variance (PERMANOVA), analysis of similarities (ANOSIM), and similarity percentage (SIMPER) analysis was used to detect potential drivers of variance on the community structure based on ASVs (adonis, anosim, simper; vegan package v2.5-6). Entropy analyses and initial oligotyping of select sequences were conducted as described by Eren et al. (2013). Finally, we used PICRUSt, an algorithm that uses microbial taxonomic identification to predict microbial metabolic function, to identify functional differences between samples (Langille et al., 2013). These analyses are based on using Kyoto Encyclopedia of Genes and Genomes (KEGG) annotations (Kanehisa and Goto, 2000), and were visualized using STAMP (Parks et al., 2014) and R v3.6.0.
Results
Seasonal Solute Exchange Between the Hyporheic Zone and Water Column
ER discharge and HOBO temperature values, corroborated with station observations, reported peak spring melt flow during the month of May and continued through mid-June, with initial thaw occurring the first week of April (Figure 3A). The riverine OsmoSamplers deployed to sample the HZ and SWI captured an unexpected methane exchange between the subsurface and surface after peak spring melt (Figure 3B). At the SWI, there was a peak concentration of 52.4 μM methane during late September after being relatively low (<2 μM) during the previous months. Methane concentrations 4 cm within the HZ remained relatively constant around 2.8 μM, with a slight increase to 10.2 μM during April with an δ13C-CH4 value ranging from −56.4 to −60.9 ± 0.2‰. Conversely, 12 cm within the HZ experienced a large increase in methane concentrations beginning in December continuing to August, with a maximum concentration of 63.5 μM with an δ13C-CH4 value of −60.8 ± 0.2‰ in mid-June. All 12 cm samples measured for δ13C-CH4 values ranged from −55.1 to −60.8 ± 0.2‰. The bubble sample contained ∼8% methane with an δ13C-CH4 value of −54.2 ± 0.2‰.
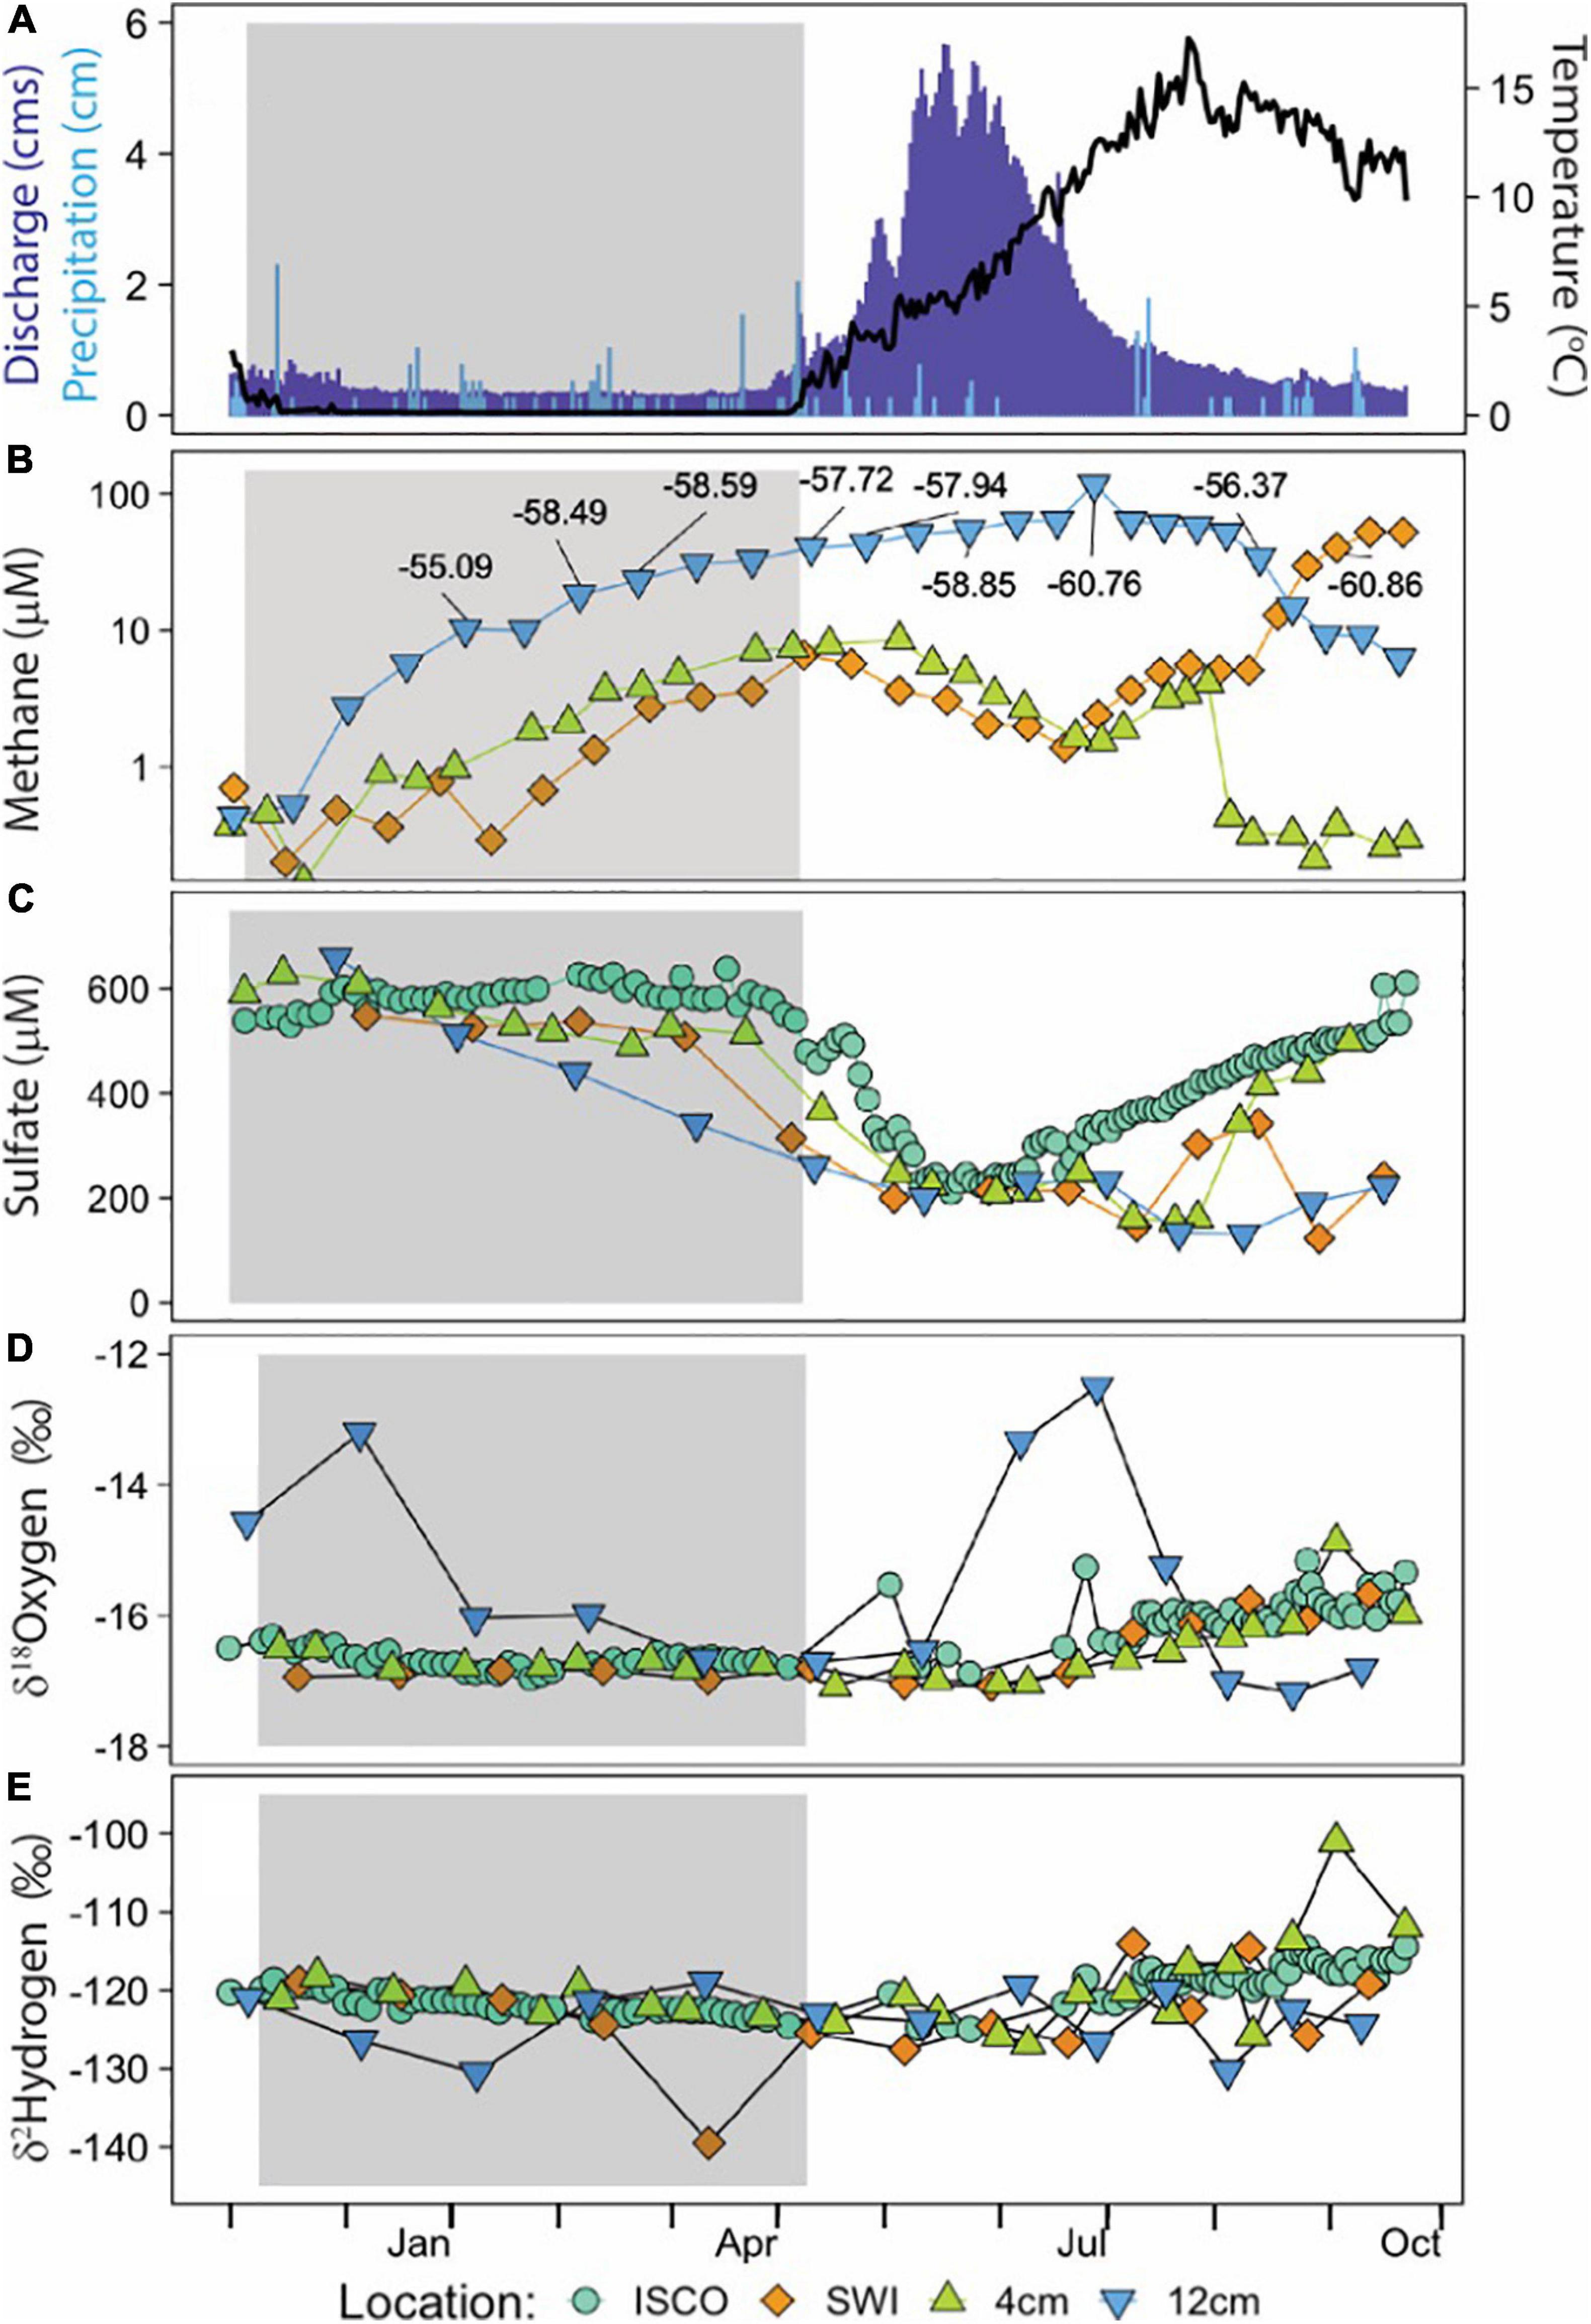
Figure 3. Time-series data from ER OsmoSamplers and ISCO sampler. Gray shaded areas represent the time of year ER experienced ice cover. (A) Rosemary and Williams (2019) reported discharge in cubic meters per second (cms) in dark blue bars for ER, near Crested Butte, CO. Precipitation increments shown in light blue bars, from NRCS SNOTEL site 380. Water temperature data from HOBO anchored next to OsmoSamplers indicated by black data line. (B) Continuous, integrated methane concentration measured by the OsmoSamplers. Label boxes indicate δ13C-CH4 values for individual CH4 measurements 12 cm into the HZ and at the SWI. (C) Sulfate discrete (ISCO sampler) and continuous (OsmoSampler) solute concentration. δ18O-H2O (D) and δ2H-H2O (E) isotopes. Data from the ISCO sampler are from the water column (blue circle). OsmoSampler samples from 12 cm (blue triangle) and 4 cm (green triangle) are from within the hyporheic zone; samples from the sediment water interface are represented by orange diamond. Please note the difference in scales on the y-axes.
Sulfate concentrations within the hyporheic zone and water column ranged from 30.5 to 658.8 μM, showing a collective sharp decrease in May and subsequent build up from June to the end of our sampling effort (Figure 3C). This trend is annually well-defined with the ISCO data and was similarly captured by the OsmoSamplers at the SWI into the HZ.
Stable water isotopes from the ISCO sampler and OsmoSampler SWI and 4 cm remained steady around δ18O-H2O values of ranging from −15.3 to −17.2‰, trending toward lighter isotopes beginning July 2018 (Figure 3D). OsmoSampler samples from 12 cm within the HZ showed two major peaks of δ18O-H2O values in December 2017 (−13.2‰) and July 2018 (−12.5‰), while otherwise remaining steady around −16‰. δ2H-H2O values for ISCO and all OsmoSampler samples remained steady around −121.1‰, with only minor deviations toward an increase in isotopic weight beginning July 2018 (Figure 3E).
Autumnal and Winter Microbial Communities in the Water Column
The BOSS captured a microbial community present in the wintertime water column that resembles communities identified by previous summertime studies in the same or similar watershed systems. The microbial community composition identified using the BOSS, discrete water collected in ER, another ER study (Saup et al., 2019), and other similar high-altitude sites (Hotaling et al., 2019) reveals the most frequently occurring taxa are Gammaproteobacteria, Bacteroidia, Oxyphotobacteria, Alphaproteobacteria, and Deltaproteobacteria (Figure 4A). The most abundant taxa present in the BOSS samples being Methanomicrobia and Gammaproteobacteria which made up approximately 68 and 7.7% percent of the community, respectively. The top ASVs from class Gammaproteobacteria matched most closely to Rhizobacter, Pseudomonas, Burkholderiaceae, Polaromonas, and Rhodoferax, while top ASVs from class Methanomicrobia matched the Archaeon Methanolobus (Figure 4B). The majority of these Gammaproteobacteria ASVs were identified in the summertime samples (Hotaling et al., 2019; Saup et al., 2019), while wintertime samples (BOSS, this study) hosted a higher percentage of the ASVs identified as Methanomicrobia. Two summertime samples from Saup et al. (2019) had trace relative abundance (<0.02%) of the same ASVs of Methanomicrobia. Additionally, ASVs identified as Escherichia/Shigella were removed from all analyses given their high relative abundance in negative controls. However, it should be noted that the same ASV was identified in trace abundances in three samples from Saup et al. (2019), and therefore may represent a native taxa.
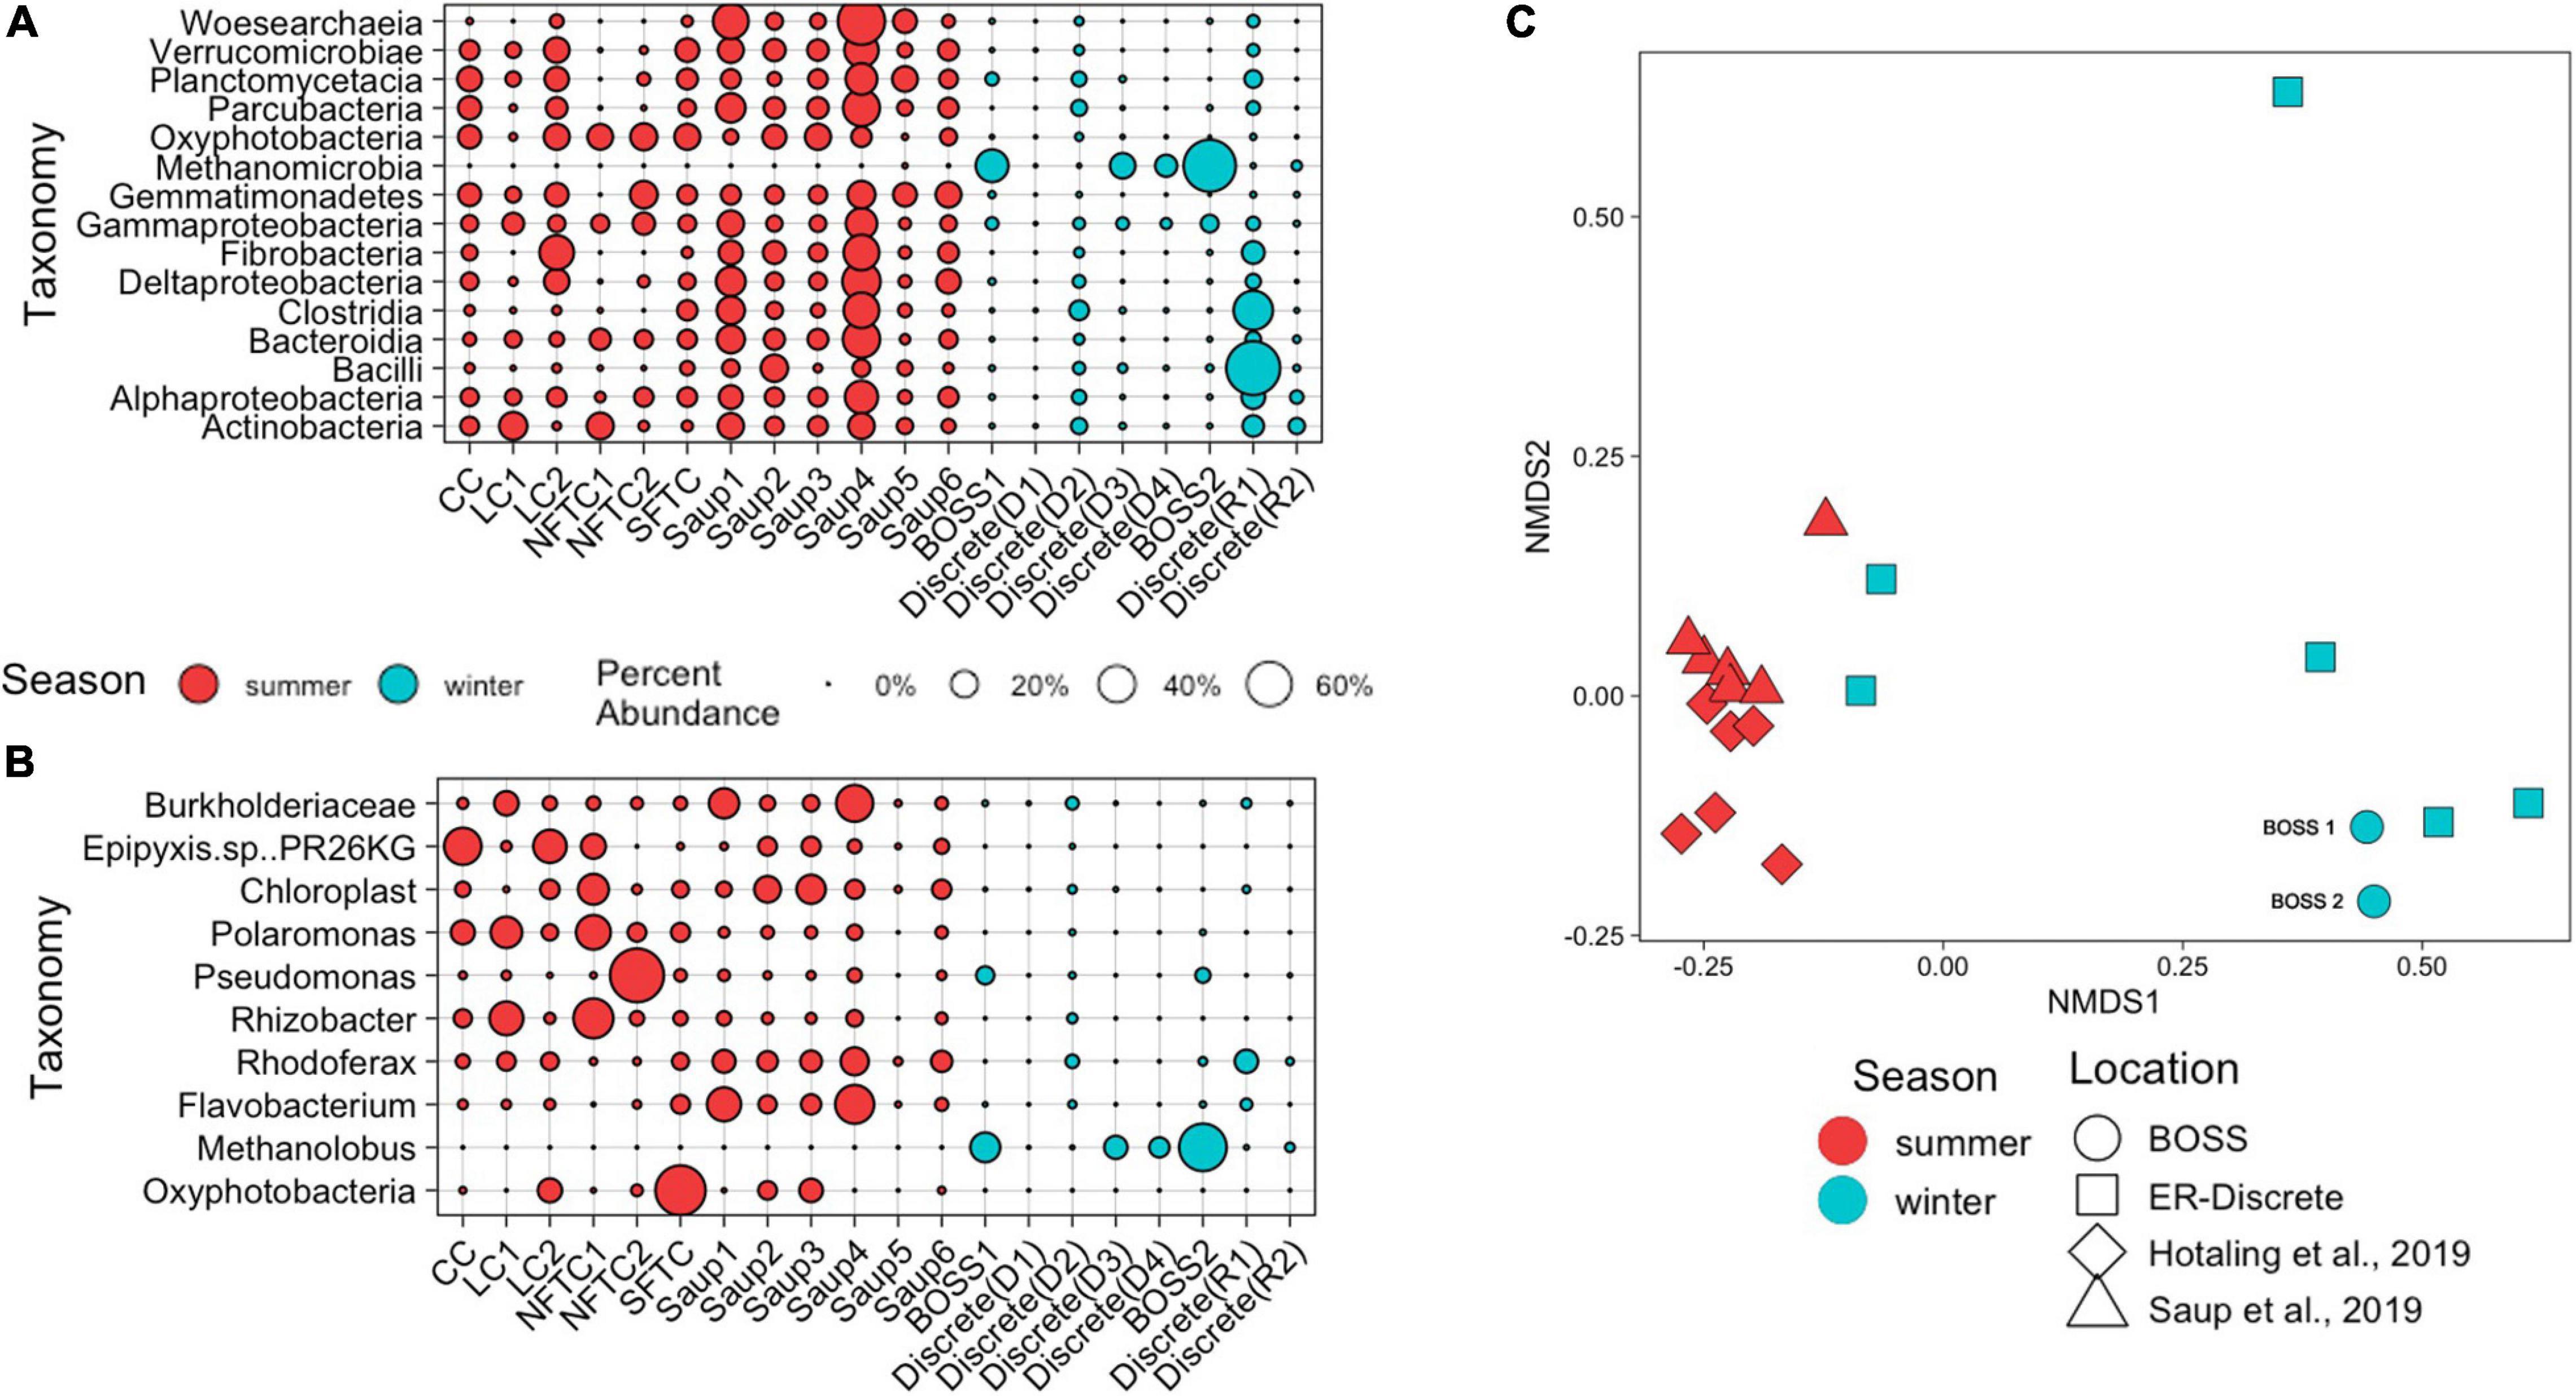
Figure 4. Relative abundance of 15 most abundant Bacterial and Archaeal Classes (A) and top ASV from each class (B) from BOSS deployed in the ER along with other samples for comparison. Size of the circle represents relative abundance. Clements Creek (CC) and Lunch Creek (LC) are located in Glacier National Park (Hotaling et al., 2019), South Fork Teton Creek (SFTC) and North Fork Teton Creek (NFTC) are located in Grand Teton National Park (Hotaling et al., 2019). Saup1 and Saup2 are located at the sediment water interface (SWI) of Meander-A in ER, Saup3, and Saup4 are from the SWI of Meander-B in ER, and Saup5 and Saup6 are from the SWI of Meander-C in ER (Saup et al., 2019). Discrete sample replicates from this study taken during deployment (D) and retrieval (R) of the BOSS. (C) Non-metric multidimensional scaling (NMDS; NMDS stress = 0.081) based on Bray-Curtis dissimilarities between 16S rRNA gene sequences from BOSS (Hotaling et al., 2019; Saup et al., 2019).
Season was a key factor in differentiating the microbial community present in the ER and while comparable samples presented similar microbial community structures, dominant taxa were still divergent between different data sets. Within the ER data sets generated by this project (BOSS and discrete samples), mid-summer samples were different from those samples collected in winter (PERMANOVA, p = 0.006) (Figure 4C). The main drivers of these differences were Methanolobus, Chloroplast, Burkholderiaceae, Flavobacterium, and Oxyphotobacteria identified as Synedra hyperborea (SIMPER average dissimilarity = 0.88). Overall taxa that were abundant in the summer (Hotaling et al., 2019; Saup et al., 2019 samples) were less common in the winter (BOSS and discrete samples), however, the overall ASV level community composition was not different between all studies included.
Differences arise in regard to the relatively low diversity and richness of the BOSS samples compared to the high diversity and richness of the comparative systems. The BOSS-collected and discretely sampled microbial community had lower diversity than previously published samples from similar rivers (ANOVA, p = 0.002, F-value = 12.5); Shannon diversity of the BOSS was 1.57 (BOSS1) and 0.86 (BOSS2) compared to mean values of 3.97 in Hotaling et al. (2019) and 5.26 in Saup et al. (2019), a pattern likely driven by low richness within the community sampled here (Supplementary Figure 1). This pattern was mirrored in community evenness, with Simpson’s evenness metrics within both BOSS samples (BOSS1 = 0.59, BOSS2 = 0.46) and discrete samples (average = 0.80) significantly lower than mean evenness within Hotaling et al. (2019) and Saup et al. (2019), which were 0.92 and 0.97, respectively (ANOVA, p = 0.005, F-value = 10.4; Supplementary Figure 2).
To gain further insight into captured community diversity, we assessed the predicted functionality of the riverine wintertime microbial communities compared to the summertime. After comparing the predicted Kegg Orthologies (KO) using SIMPER to identify key differences, we found the dominant microbial functions between our BOSS and discrete samples to be similar (SIMPER average dissimilarity = 0.54). The most abundant predicted biological functions are largely related to cell replication and DNA repair and RNA transcription mechanisms, most of which were constant across seasons (Table 1). Differences between seasons arise in KOs related to denitrification, anaerobic biosynthesis of unsaturated fatty acids, glucosamine biosynthesis, assimilatory nitrate reduction, and chlorophyll synthesis, all of which are increased in the summertime samples except for glucosamine biosynthesis (Supplementary Figure 4). We found several predicted KOs significantly increased in the wintertime samples including methanogenesis, acetoclastic methanogenesis, and degradation of amines, nucleosides, and carbohydrates (Supplementary Figure 3). Thiamine metabolism, DNA repair, and unsaturated fatty acids biosynthesis in addition to a diversity of other metabolic processes are constant among all samples.
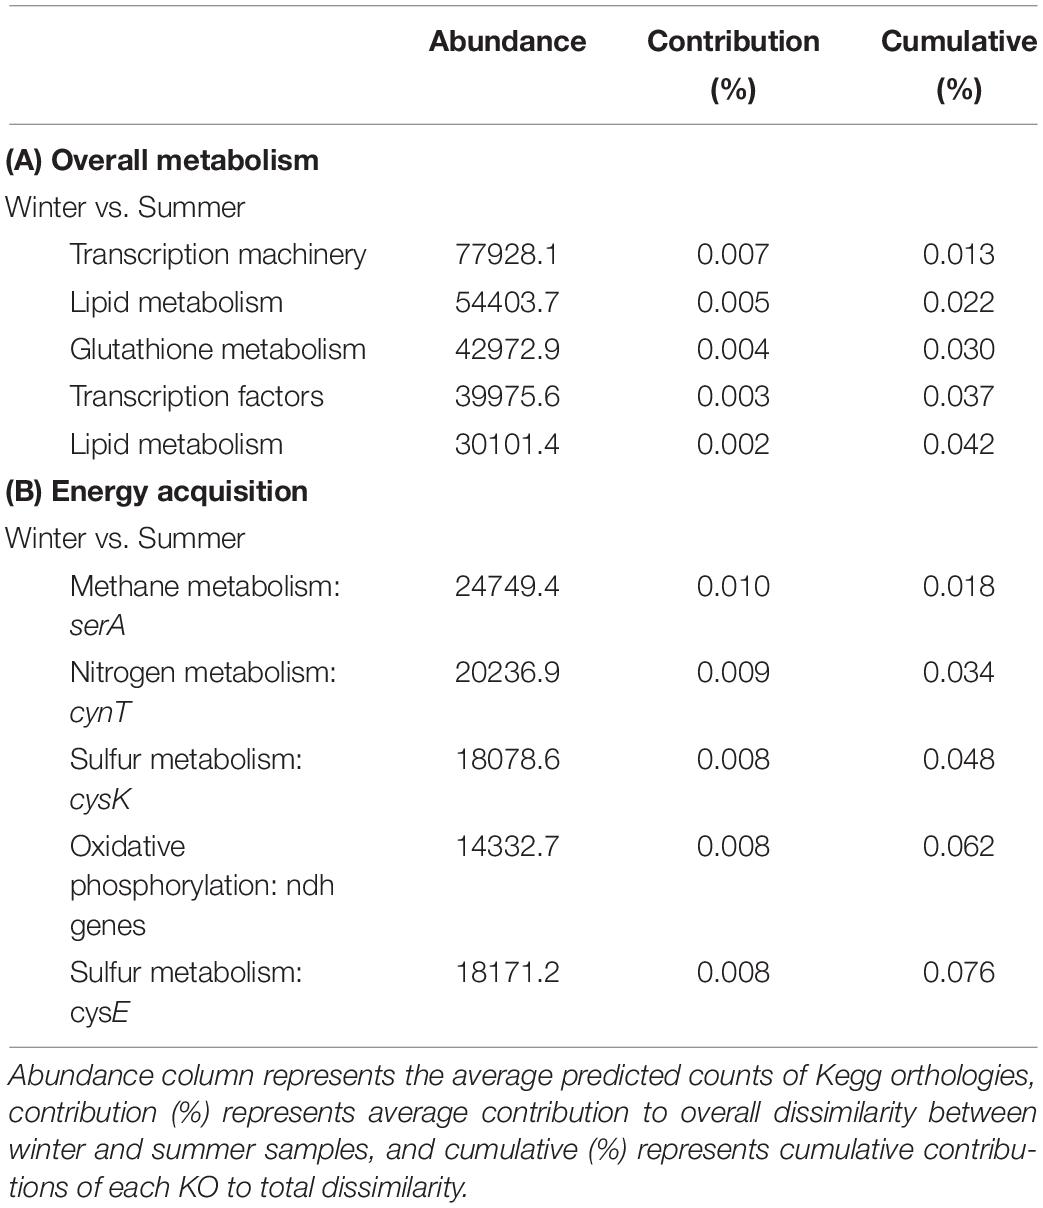
Table 1. (A) PICRUSt SIMPER analysis of cellular processes. (B) PICRUSt SIMPER analysis of overall metabolism and associated genes or gene clusters.
The predicted dominant functional processes related to energy acquisition between BOSS and discrete wintertime samples compared to summertime samples yielded derivations of predicted gene counts (PERMANOVA, p = 0.082). These differences in functionality were driven by predicted nitrogen metabolic pathways and oxidative phosphorylation pathways in summertime, while wintertime samples were dominated by methane metabolism, followed closely by nitrogen metabolism (Table 1).
Discussion
Surface and Subsurface Geochemical Transactions
The goal of our research was to understand the seasonal variability and biogeochemistry of a high-altitude, snow-dominated headwater basin during the wintertime to directly address gaps in pre-existing datasets. We sought to determine the degree to which wintertime elemental cycles vary and identify seasonal deviations to inform our understanding of overall ecosystem function. More specifically, we aimed to identify the seasonal variability of methane biogeochemistry and sulfate and chloride prevalence in inaccessible high-altitude watersheds, and how microbial community and geochemical deviations from spring to summer to fall conditions may alter our understanding of these systems. Our hypothesis was that microbial community structure and local biogeochemical processes will fluctuate from the values pre- and post-wintertime months, while still reflecting the geochemistry and microbiology of previously reported community structures in other high-altitude systems.
The hyporheic zone (HZ) serves as a transitional environment for vertical and horizontal solute transfer, representing the ecotone of groundwater and surface water chemistry (Hou et al., 2017). The East River (ER) watershed experiences distinct seasonal shifts in biogeochemistry of the surface water, which may be propagated by solute exchange between groundwater and surface water processes (Danczak et al., 2016; Hubbard et al., 2018; Saup et al., 2019). We captured a seasonal anomaly of methane concentrations within ER, observed as two separate peaks in mid-spring 12 cm within the HZ, and again at the SWI in late summer. The continued increase in methane concentration observed in mid-spring within the HZ correlates with peak flow of spring runoff. Additionally, δ13C-CH4 values for the HZ were all strongly biogenic in source. We hypothesize seasonal mid-spring runoff and subsequent increase in discharge leads to mixing within the HZ as the net fluid flow shifts to surface water inundation of the HZ, vertically expanding hyporheic mixing and impacting biogeochemical processes (Saup et al., 2019). In spite of seasonal mixing, the continual buildup of methane during spring melt through peak flow may represent shallow (<10 cm) subsurface permeation from downwelling during high and snowmelt-dominated discharge, and the retention of oxygen-poor, organic matter-rich sediments. As peak discharge subsides, there is most likely a greater influence of upwelling and the vertical area of hyporheic mixing declines, causing a flush of HZ solutes into the surface water, as described by Danczak et al. (2016), and observed in this study as the shift of biogenic methane concentrations from the HZ to the SWI during late-August.
These mechanistic and bidirectional mixing events host dynamic biogeochemistry and increased rates of solute exchange, compared to wintertime groundwater to surface water flow, and are evidenced in methane accumulation or production (Boano et al., 2014). Given the presence of methanogens identified using the BOSS samplers in the water column, and the δ13C-CH4 values for the HZ for the prior year, it is likely that at least part of the methane detected was from production at or near the site. Substantial HZ methane production began prior to peak discharge, possibly stimulated by solute flushing (Winnick et al., 2017), yet quickly diminished, presumably as peak spring melt inundated and oxygenated the HZ. We hypothesize that a correlating increase in methane at the SWI occurs as peak discharge subsides, and groundwater begins to flush through the HZ displacing oxygenated surface water leading to methane accumulation or creation of a niche capable of sustaining methane production (Figure 5).
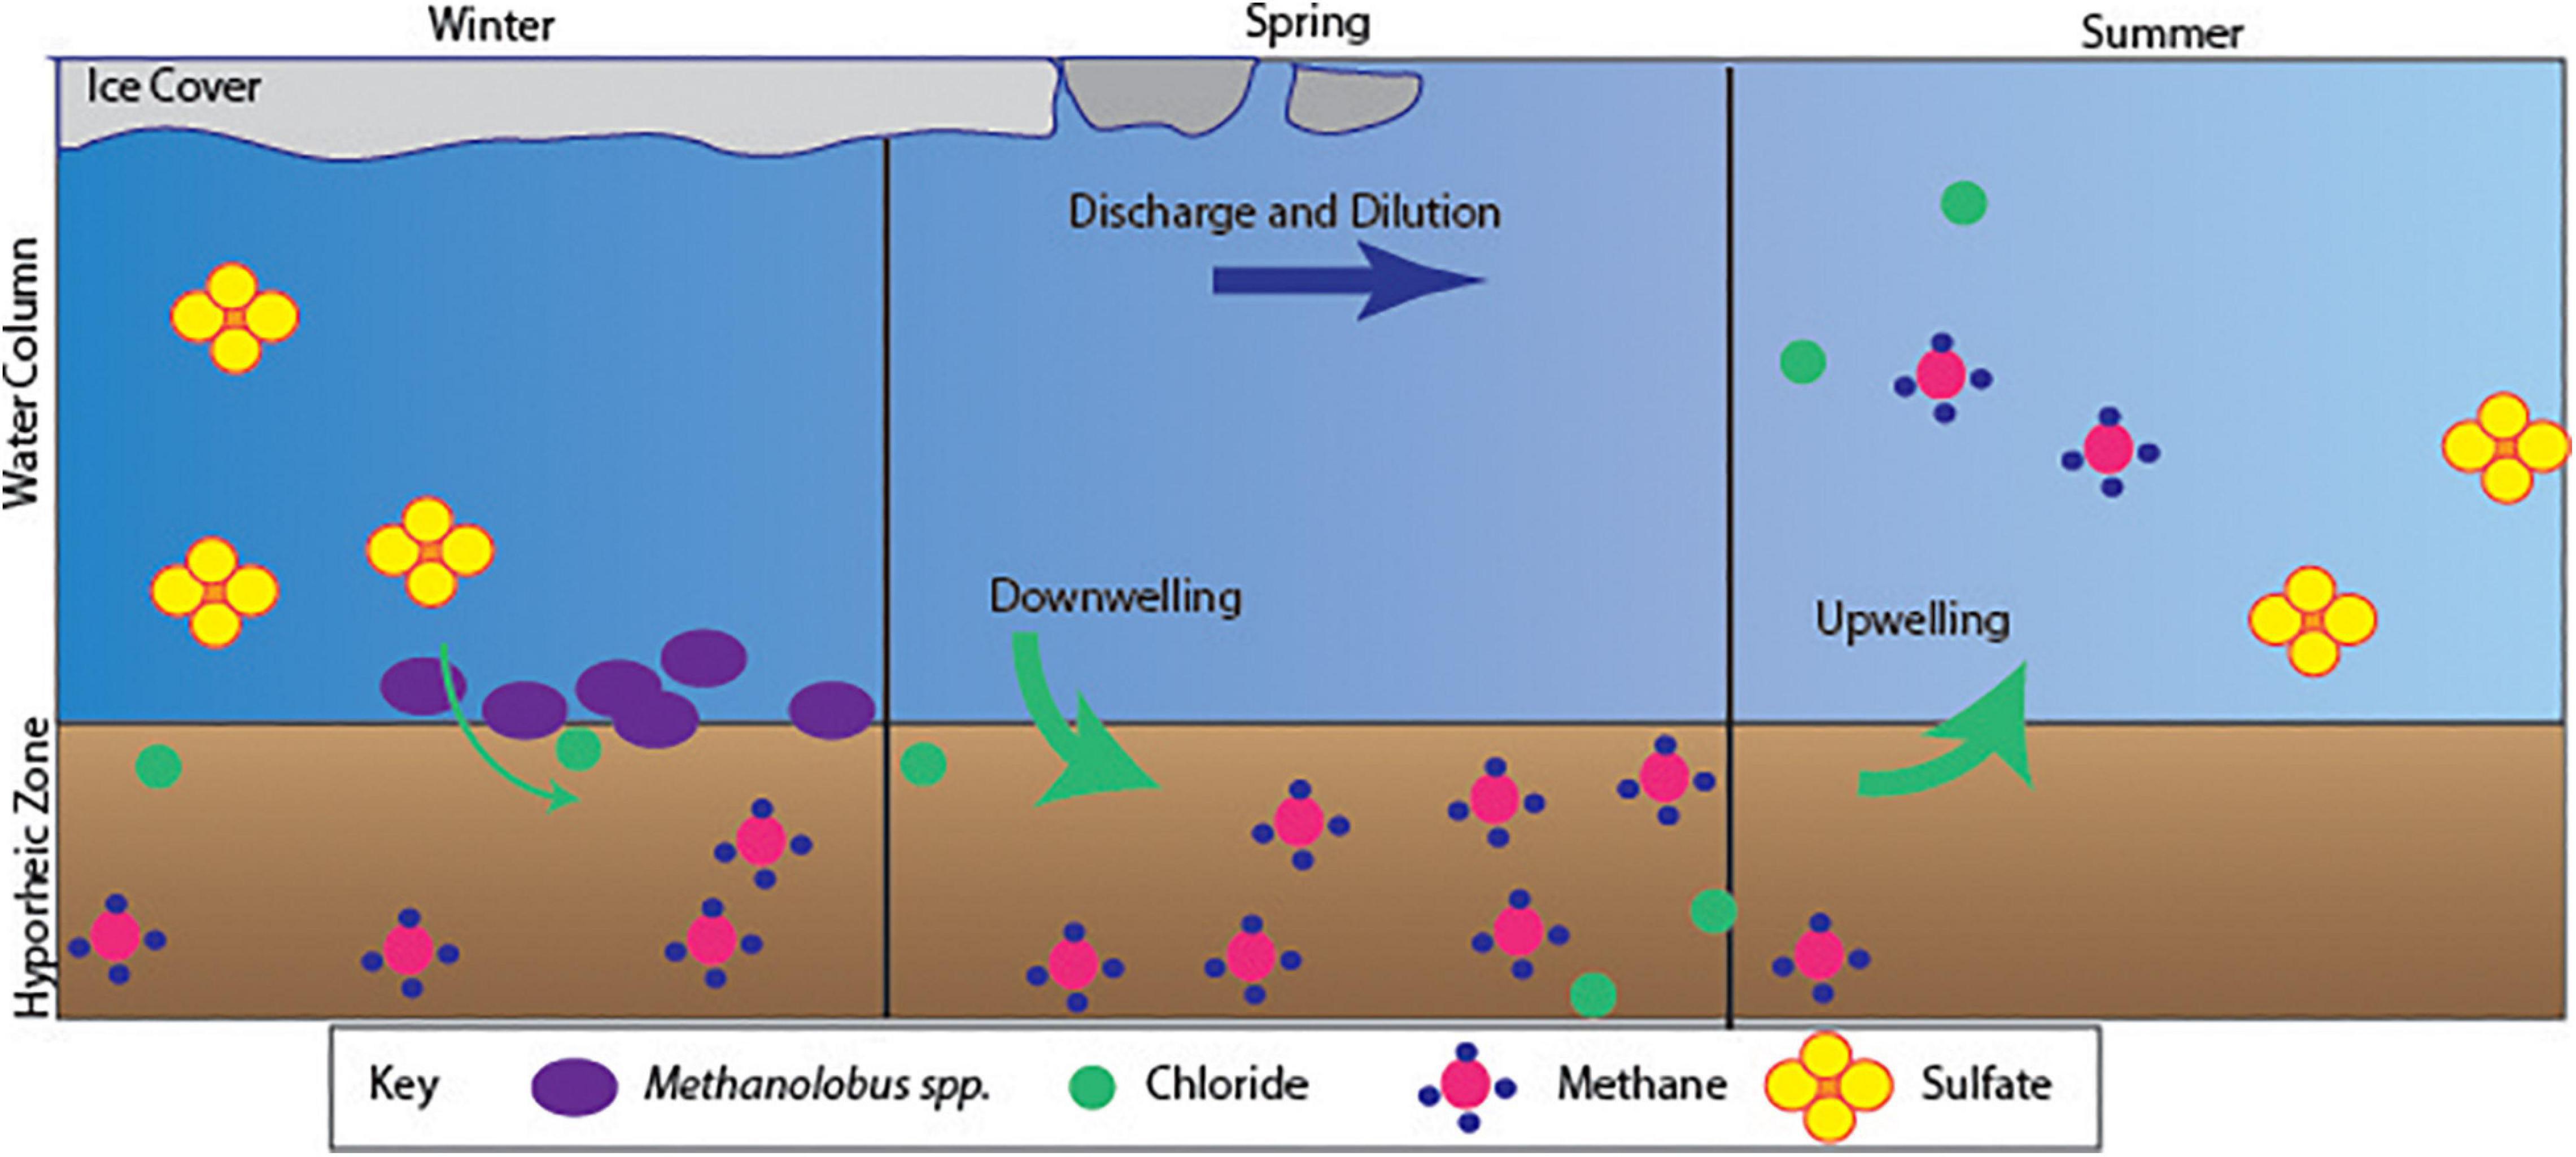
Figure 5. Conceptual model of biogeochemical processes within the ER study site.
Here, we identified a previous unresolved subsurface-surface transport phenomenon occurring during wintertime months, providing valuable insight into fluvial processes. Methane concentrations within the HZ exceeded 60 μM, which was much greater than surface water within other mountainous systems (e.g., temperate coniferous forested watersheds generally average 0.1 μM CH4; Stanley et al., 2016). During the increase in methane concentration, there was a co-occurring depletion of sulfate. The sudden decrease in sulfate concentrations are most likely due to spring melt dilution, given the coinciding peak of chloride concentrations. Pulses in chloride concentrations in late April captured by the ISCO sampler may be indicative of groundwater flow to the surface occurring during solute flushing in the shallow subsurface just before peak river discharge due to fluxes in concentration-discharge (C-Q) relationships (Winnick et al., 2017). However, the pronounced peaks may be indicative of an artifact as OsmoSamplers discharge sodium chloride into the environment to generate the osmotic pull (Supplementary Figure 4). Chloride specifically most likely originates from chemical weathering reactions as snowmelt moves through the shallow subsurface (Zhi et al., 2019) and shale bedrock having elevated chloride concentrations in groundwater (Williams et al., 2020b). While the decrease in sulfate may have been due to dilution during increased spring flow, some fraction of its removal may be tied to a more complex interaction of the microbes present using sulfate as a terminal electron acceptor tied to oxidation of organic carbon and/or anaerobic oxidation of methane ANME-1, one of the groups capable of the anaerobic oxidation of methane, were present within the BOSS samples at low relative abundances (0.05%) (Takeuchi et al., 2011). Additionally, we identified ASVs including Desulfogaleba (0.51%) and Desulfosporosinus (0.069%) within two discrete samples, both of which may contribute to the reduction of sulfate (Pester et al., 2012). However, if fluid flow through the HZ leads to the release of methane it may also flush a subset of the microbial community from the sediment into the water column. A more holistic analysis, including simultaneous deployment of BOSS and geochemical OsmoSamplers during spring thaw-out and peak melt, within the deep HZ as well as sediment may further resolve how the HZ community matches to local geochemistry. Nevertheless, we clearly showed an active heretofore previously unappreciated methane cycle, from biogeochemistry to microbial community composition, within this well characterized watershed.
Stable water isotope analysis conducted previously by Williams et al. (2020a) has developed a long-term record for the ER watershed, from which extensive knowledge of seasonal variation and source water contribution to stream flow has been identified. Our addition of OsmoSampler stable water isotopes to this record corroborates viability and usefulness of autonomous sampling techniques, while providing novel insight into HZ systems. Continuous sampling from the water column by the OsmoSamplers yielded similar seasonal patterns previously observed by Williams et al. (2020a). It is possible the fluctuations of δ 18O observed in November and June represent groundwater recharge events in response to precipitation events or springtime snowmelt. However, the differences between surface water and HZ reservoirs indicate a need for further research into the spatial and temporal aspects of the exchange of these classic conservative tracers.
Production of methane in fluvial systems is driven by prolonged anoxic conditions, which may be scarce in fast-flowing headwater streams. Approximately one third of all global methane emissions are natural, yet emissions from natural systems are increasing as the climate is warming (Nisbet et al., 2014; Hamdan and Wickland, 2016; Rosentreter et al., 2021). Unconstrained sources of methane are responsible for >5 ppb yr–1 increases in the atmosphere, so the need to identify natural and anthropogenic factors contributing to this rise in emissions is urgent (Nisbet et al., 2019). Specifically in natural systems, seasonal variations—particularly during the wintertime—may contribute greatly to these methane emissions (Treat et al., 2018). Studying methane in watersheds provides unique insight into the local biogeochemistry, as methanogenesis is the “energetic endpoint” of organic carbon degradation. A major source of uncertainty in studying natural methane emissions originates from wetland and inland water contributions (Saunois et al., 2020). Methane production in these environments may indicate an absence of other respiratory pathways or available alternative electron acceptors. Fluvially-produced methane is a significant contributor to atmospheric concentrations (DelSontro et al., 2016) and our study suggests that a more complete annual sampling, to include periods when samples are hard to collect, will lend insight and better accountability for global methane budgets.
Microbial Community Within East River During Wintertime Isolation
By using the BOSS, we sampled the aquatic microbial community residing at the SWI of ER over approximately two months during late fall-early winter, 2017, and were able to show the BOSS sampled microbial communities were similar to other previously described high-altitude riverine communities, despite the heterogeneity of these systems. While richness and evenness were both low within the late fall-early winter BOSS samples when compared to mid-summer samples, they were similar to discrete samples taken during deployment and recovery. In addition, the patterns in diversity of free-flowing microorganisms in the water column samples were highly similar among two of our discrete samples and the samples from Hotaling et al. (2019). What was also clear is that while visually (Figure 4C) there was good agreement among some of the discrete samples and the BOSS samples, one was quite different and two clumped with summer samples, indicating heterogeneity in the microbial community that was integrated by the BOSS sampler. Samples from Saup et al. (2019) showed more evenness and higher richness within communities, likely because of increased summertime vertical mixing capable of stimulating a wide range of aerobic microbial respiration. Discrete sampling efforts mirrored the BOSS samples while also exhibiting a clumped distribution in the water column, leading to variation in the relative abundance of total taxa present in each sample between replicates. Applications of BOSS (sensu Robidart et al., 2013) are few and yet can provide novel insight into seasonality, for example methanogenesis in their particular study region.
Key differences in taxa and associated predicted functionality hinges mainly around the ASVs Methanolobus, Chloroplast, Burkholderiaceae, Flavobacterium, and Oxyphotobacteria identified as Synedra hyperborea as identified by using SIMPER. These ASVs most likely drive variations in predicted functionality in the BOSS samples toward anaerobic metabolisms including methanogenesis, indicated by the presence of Methanolobus, during wintertime ice cover. Many taxa show shifted in relative abundance between seasons; Flavobacteria, Chloroplast, and Rhizobacteria ASVs all decreased in wintertime compared to summertime samples, most likely due to their relationships with actively growing macrophytes in the summer months (Kolton et al., 2013; Srivastava et al., 2017). While Chloroplasts are frequently removed from 16S rRNA gene analysis, their decrease in winter mirrors a transition from photosynthetic to heterotrophic metabolisms during winter when ice and snow preclude photosynthesis. This observation is supported by the major increase in the Oxyphotobacteria identified as Synedra hyperborea within the summer time samples, citing a possible shift to autotrophy from wintertime heterotrophy (Cornet et al., 2018) Methanolobus is the only Archaeon with high relative abundance and was apparent in the wintertime samples. Methanolobus spp. are methanogens capable of participating in Fe (III) and humic acid reduction and may actively contribute to a seasonal spike in methane concentrations (Bond and Lovley, 2002; Laskar et al., 2018). The BOSS continuous samples captured a large relative increase in the Methanolobus ASV, while the deployment and retrieval discrete samples showcase a more clumped and variable distribution in water column taxa. It is important to note that Methanolobus was present in both our discrete and BOSS sampling approaches. The seasonal relationship to taxa abundance may be representative of geochemical changes within the water column, where we would expect low alpha diversity in the wintertime due to decreased concentrations of organic matter and more prevalent anoxic conditions (Böckelmann et al., 2000).
Conversely, we identified that certain taxa remained in the community across summertime and wintertime. Two of these, Pseudomonas and Polaromonas, are globally distributed and found primarily in polar or high-elevation freshwater ecosystems (Darcy et al., 2011; Silby et al., 2011; Michaud et al., 2012). Rhodoferax represents a metabolically diverse group of organisms most well-known for iron reduction, specifically within high altitude systems experiencing ice cover (Hullar et al., 2006; Risso et al., 2009; Cruaud et al., 2020). These taxa were ubiquitous in the samples from this watershed.
Riverine and HZ microbial communities play a key role in biogeochemical cycling as they are capable of altering organic carbon and solutes as they travel through the watershed, linking terrestrial carbon inputs and aquatic biogeochemistry (Vannote et al., 1980; Naegeli and Uehlinger, 1997; Graham et al., 2017). Seasonality of high-altitude systems alters exchange between the surface and subsurface, subsequently driving the structure of collective metabolism of the microbial community in the water column and the hyporheic zone (Ågren et al., 2007). Through analysis of the functional capabilities of the microbial community, a more complete understanding of the geochemical and biological dynamics was possible during winter (Langille et al., 2013; Sun et al., 2020). Decreased rates of river discharge and increased ice cover, both of which result in variations in electron acceptor availability would contribute to the biogenic production of methane, leading to the buildup observed in the HZ. Predicted KOs revealed season-related shifts in relative abundance, similar to the shifts observed in the taxa prevalence. Most notably, the wintertime samples had KOs indicating decreased prevalence of carbohydrate substrates and increased competition between microorganisms. KOs representing methanogenesis and corresponding predicted gene counts were identified across the wintertime samples, most prevalent in the BOSS samples. This correlated with the significant increase in abundance of Methanolobus, and in the previous year, the buildup of methane captured by the OsmoSamplers. Alternatively, the summertime samples had KOs that were less abundant than in the wintertime; thiamine biosynthesis and DNA repair were present across both seasons yet were heightened in the summer months. This supports that while cell growth and division and essential vitamin production persist year-round, activity may increase in the summer. Our findings work to strengthen our knowledge of wintertime biogeochemical relationships and can lead to a more complete description of cryptic processes that ultimately will inform and improve the reactive transport models that simulate these systems.
Future Wintertime Applications and Modeling Potential
The unexpected transient release of methane in the East River system that we detected by collecting samples through an entire year adds key information related to seasonally dynamic carbon cycling in this high-altitude location. Consistent with such observations obtained in other inhospitable locations, our work provides evidence of biogeochemical processes that are ongoing during periods when access is highly constrained (Martens et al., 2016; Lapham et al., 2017). Multi-component reaction transport modeling (RTM) of watershed systems are one approach that expands our knowledge of complex systems, and if such efforts are parameterized by sampling approaches such as employed here, it will be increasingly possible to understand how local, regional, and global carbon cycles will change over time (Li et al., 2017). Critical to this is including both water chemistry and microbiological measurements during the time periods that represent knowledge gaps so we can begin to identify regular patterns in watershed biogeochemistry.
Conclusion
Hyporheic zones may serve as a biogeochemical “reservoir” in times of low flow or nutrient unavailability during dry seasons and potentially wintertime conditions (Harjung et al., 2019). Solutes transported between the surface and subsurface along groundwater flow paths undergo numerous transformations that add to the complexity of the watershed system (Küsel et al., 2016). Understanding the dynamics of the hyporheic zone microbial communities and responses to seasonality sheds light on the surface dynamics, as the hyporheic chemistry has the capacity to control metabolic rates in the water column (Stern et al., 2017).
We hypothesized that OsmoSamplers will provide a way to address how key elemental cycles and microbial communities vary in temporally inaccessible high-altitude watersheds. We addressed biogeochemical variations during periods of system inaccessibility in the wintertime, by identifying fluctuations in methane production between the SWI and HZ. Additionally, we obtained insight into how previous discrete measurements of sulfate and chloride within the HZ relate to what we captured through continuous sampling. Finally, we captured a realistic microbial community within the water column during the wintertime using the Biological OsmoSampler System. Despite being independent datasets, this research has begun to define how to address key data gaps in our understanding of watershed biogeochemistry during periods of inaccessibility. Future implementation of geochemical and biological OsmoSamplers within riverine and groundwater systems over prolonged periods of time provide the opportunity to gain insight on hidden transfer processes between surface and subsurface systems.
Data Availability Statement
The datasets presented in this study can be found in online repositories. The names of the repository/repositories and accession number(s) can be found below: https://www.ncbi.nlm.nih.gov/, PRJNA701286; doi: 10.15485/1766092.
Author Contributions
FC, LL, AT, and KW designed the study and collected the samples. JB conducted the lab work, analyzed the data, interpreted the results, and wrote the manuscript. LL and JB provided geochemical data and analysis. JB provided the biological data. JB, FC, and AT provided additional biological interpretations. LL and KW provided additional geochemical interpretations. All authors edited the manuscript.
Funding
This material was partially based upon work supported through the Lawrence Berkeley National Laboratory’s Watershed Function Scientific Focus Area. The U.S. Department of Energy (DOE), Office of Science, Office of Biological, and Environmental Research funded the work under contract DEAC02-05CH11231 (Lawrence Berkeley National Laboratory; operated by the University of California) and under contract DE-SC0018328 (Oregon State University). Additional support was provided to AR Thurber by the National Science Foundation (Grant 1933165) and to F Colwell by the Department of Energy (award number DE-FE0023919).
Disclaimer
This report was prepared as an account of work sponsored by an agency of the United States Government. Neither the United States Government nor any agency thereof, nor any of their employees, makes any warranty, express or implied, or assumes any legal liability or responsibility for the accuracy, completeness, or usefulness of any information, apparatus, product, or process disclosed, or represents that its use would not infringe on privately owned rights. Reference herein to any specific commercial product, process, or service by trade name, trademark, manufacturer, or otherwise does not necessarily constitute or imply its endorsement, recommendation, or favoring by the United States Government or any agency thereof. The views and opinions of authors expressed herein to not necessarily state or reflect those of the United States Government or any agency thereof.
Conflict of Interest
The authors declare that the research was conducted in the absence of any commercial or financial relationships that could be construed as a potential conflict of interest.
Acknowledgments
We thank Cédric Magen, Maureen Strauss, and Hadley McIntosh Marcek for help with geochemical measurements from the OsmoSamplers. We are grateful to Matthew Peterson and Mark Dasenko for completing amplicon sequencing at the Oregon State University CGRB. This is UMCES contribution 6008.
Supplementary Material
The Supplementary Material for this article can be found online at: https://www.frontiersin.org/articles/10.3389/feart.2021.666819/full#supplementary-material
References
Ågren, A., Buffam, I., Jansson, M., and Laudon, H. (2007). Importance of seasonality and small streams for the landscape regulation of dissolved organic carbon export. J. Geophys. Res. Biogeosci. 112:G03003. doi: 10.1029/2006JG000381
Apprill, A., McNally, S., Parsons, R., and Weber, L. (2015). Minor revision to V4 region SSU rRNA 806R gene primer greatly increases detection of SAR11 bacterioplankton. Aquat. Microb. Ecol. 75, 129–137. doi: 10.3354/ame01753
Billett, M. F., and Harvey, F. H. (2013). Measurements of CO2 and CH4 evasion from UK peatland headwater streams. Biogeochemistry 114, 165–181. doi: 10.1007/s10533-012-9798-9
Boano, F., Harvey, J. W., Marion, A., Packman, A. I., Revelli, R., Ridolfi, L., et al. (2014). Hyporheic flow and transport processes: mechanisms, models, and biogeochemical implications. Rev. Geophys. 52, 603–679. doi: 10.1002/2012RG000417
Böckelmann, U., Manz, W., Neu, T. R., and Szewzyk, U. (2000). Characterization of the microbial community of lotic organic aggregates (‘river snow’) in the Elbe River of Germany by cultivation and molecular methods. FEMS Microbiol. Ecol. 33, 157–170. doi: 10.1016/S0168-6496(00)00056-8
Bolyen, E., Rideout, J. R., Dillon, M. R., Bokulich, N. A., Abnet, C. C., Al-Ghalith, G. A., et al. (2019). Reproducible, interactive, scalable and extensible microbiome data science using QIIME 2. Nat. Biotechnol. 37, 852–857. doi: 10.1038/s41587-019-0209-9
Bond, D. R., and Lovley, D. R. (2002). Reduction of Fe(III) oxide by methanogens in the presence and absence of extracellular quinones. Environ. Microbiol. 4, 115–124. doi: 10.1046/j.1462-2920.2002.00279.x
Brankovits, D., Pohlman, J. W., Ganju, N. K., Iliffe, T. M., Lowell, N., Roth, E., et al. (2018). Hydrologic Controls of methane dynamics in karst subterranean estuaries. Glob. Biogeochem. Cycles 32, 1759–1775. doi: 10.1029/2018GB006026
Callahan, B. J., McMurdie, P. J., Rosen, M. J., Han, A. W., Johnson, A. J. A., and Holmes, S. P. (2016). DADA2: High-resolution sample inference from Illumina amplicon data. Nat. Methods 13, 581–583. doi: 10.1038/nmeth.3869
Caporaso, G. J., Lauber, C. L., Costello, E. K., Berg-Lyons, D., Gonzalez, A., Stombaugh, J., et al. (2011). Moving pictures of the human microbiome. Genome Biol. 12:R50.
Cavicchioli, R., Ripple, W. J., Timmis, K. N., Azam, F., Bakken, L. R., Baylis, M., et al. (2019). Scientists’ warning to humanity: microorganisms and climate change. Nat. Rev. Microbiol. 17, 569–586. doi: 10.1038/s41579-019-0222-5
Cooper, L. W., Frey, K. E., Christie, L., Biasatti, D. M., and Grebmeier, J. M. (2016). Variations in the proportions of melted sea ice and runoff in surface waters of the Chukchi Sea: a retrospective analysis, 1990–2012, and analysis of the implications of melted sea ice in an under-ice bloom. Deep Sea Res. Part II Top. Stud. Oceanogr. 130, 6–13. doi: 10.1016/j.dsr2.2016.04.014
Cornet, L., Wilmotte, A., Javaux, E. J., and Baurain, D. (2018). A constrained SSU-rRNA phylogeny reveals the unsequenced diversity of photosynthetic Cyanobacteria (Oxyphotobacteria). BMC Res. Notes 11:435. doi: 10.1186/s13104-018-3543-y
Cowen, J. P., Giovannoni, S. J., Kenig, F., Johnson, H. P., Butterfield, D., Rappé, M. S., et al. (2003). Fluids from aging ocean crust that support microbial life. Science 299, 120–123. doi: 10.1126/science.1075653
Crawford, J. T., Striegl, R. G., Wickland, K. P., Dornblaser, M. M., and Stanley, E. H. (2013). Emissions of carbon dioxide and methane from a headwater stream network of interior Alaska. J. Geophys. Res. Biogeosci. 118, 482–494. doi: 10.1002/jgrg.20034
Cruaud, P., Vigneron, A., Fradette, M.-S., Dorea, C. C., Culley, A. I., Rodriguez, M. J., et al. (2020). Annual bacterial community cycle in a seasonally ice-covered river reflects environmental and climatic conditions. Limnol. Oceanogr. 65, S21–S37. doi: 10.1002/lno.11130
Danczak, R. E., Sawyer, A. H., Williams, K. H., Stegen, J. C., Hobson, C., and Wilkins, M. J. (2016). Seasonal hyporheic dynamics control coupled microbiology and geochemistry in Colorado River sediments. J. Geophys. Res. Biogeosci. 121, 2976–2987. doi: 10.1002/2016JG003527
Darcy, J. L., Lynch, R. C., King, A. J., Robeson, M. S., and Schmidt, S. K. (2011). Global distribution of polaromonas phylotypes – evidence for a highly successful dispersal capacity. PLoS One 6:e23742. doi: 10.1371/journal.pone.0023742
DelSontro, T., Boutet, L., St-Pierre, A., del Giorgio, P. A., and Prairie, Y. T. (2016). Methane ebullition and diffusion from northern ponds and lakes regulated by the interaction between temperature and system productivity. Limnol. Oceanogr. 61, S62–S77. doi: 10.1002/lno.10335
Doherty, M., Yager, P. L., Moran, M. A., Coles, V. J., Fortunato, C. S., Krusche, A. V., et al. (2017). Bacterial biogeography across the amazon river-ocean continuum. Front. Microbiol. 8:882. doi: 10.3389/fmicb.2017.00882
Edwards, K. J., Bach, W., and McCollom, T. M. (2005). Geomicrobiology in oceanography: microbe-mineral interactions at and below the seafloor. Trends Microbiol. 13, 449–456. doi: 10.1016/j.tim.2005.07.005
Eren, A. M., Maignien, L., Sul, W. J., Murphy, L. G., Grim, S. L., Morrison, H. G., et al. (2013). Oligotyping: differentiating between closely related microbial taxa using 16S rRNA gene data. Methods Ecol. Evol. 4, 12114. doi: 10.1111/2041-210X.12114
Flury, S., and Ulseth, A. J. (2019). Exploring the sources of unexpected high methane concentrations and fluxes from alpine headwater streams. Geophys. Res. Lett. 46, 6614–6625. doi: 10.1029/2019GL082428
Gelesh, L., Marshall, K., Boicourt, W., and Lapham, L. (2016). Methane concentrations increase in bottom waters during summertime anoxia in the highly eutrophic estuary, Chesapeake Bay, U.S.A. Limnol. Oceanogr. 61, S253–S266. doi: 10.1002/lno.10272
Graham, E. B., Tfaily, M. M., Crump, A. R., Goldman, A. E., Bramer, L. M., Arntzen, E., et al. (2017). Carbon inputs from riparian vegetation limit oxidation of physically bound organic carbon via biochemical and thermodynamic processes. J. Geophys. Res. Biogeosci. 122, 3188–3205. doi: 10.1002/2017JG003967
Hamdan, L. J., and Wickland, K. P. (2016). Methane emissions from oceans, coasts, and freshwater habitats: new perspectives and feedbacks on climate. Limnol. Oceanogr. 61, S3–S12. doi: 10.1002/lno.10449
Harjung, A., Perujo, N., Butturini, A., Romaní, A. M., and Sabater, F. (2019). Responses of microbial activity in hyporheic pore water to biogeochemical changes in a drying headwater stream. Freshw. Biol. 64, 735–749. doi: 10.1111/fwb.13258
Horgby, Å, Segatto, P. L., Bertuzzo, E., Lauerwald, R., Lehner, B., Ulseth, A. J., et al. (2019). Unexpected large evasion fluxes of carbon dioxide from turbulent streams draining the world’s mountains. Nat. Commun. 10:4888. doi: 10.1038/s41467-019-12905-z
Hotaling, S., Foley, M. E., Zeglin, L. H., Finn, D. S., Tronstad, L. M., Giersch, J. J., et al. (2019). Microbial assemblages reflect environmental heterogeneity in alpine streams. Glob. Change Biol. 25, 2576–2590. doi: 10.1111/gcb.14683
Hou, Z., Nelson, W. C., Stegen, J. C., Murray, C. J., Arntzen, E., Crump, A. R., et al. (2017). Geochemical and microbial community attributes in relation to hyporheic zone geological facies. Nat. Sci. Rep. 7:12006. doi: 10.1038/s41598-017-12275-w
Hubbard, S. S., Williams, K. H., Agarwal, D., Banfield, J., Beller, H., Bouskill, N., et al. (2018). The East River, Colorado, Watershed: a mountainous community testbed for improving predictive understanding of multiscale hydrological–biogeochemical dynamics. Vadose Zone J. 17:180061. doi: 10.2136/vzj2018.03.0061
Hullar, M. A. J., Kaplan, L. A., and Stahl, D. A. (2006). Recurring seasonal dynamics of microbial communities in stream habitats. AEM 72, 713–722. doi: 10.1128/AEM.72.1.713-722.2006
Jankowski, K. J., and Schindler, D. E. (2019). Watershed geomorphology modifies the sensitivity of aquatic ecosystem metabolism to temperature. Sci. Rep. 9:17619. doi: 10.1038/s41598-019-53703-3
Jannasch, H. W., Wheat, C. G., Plant, J. N., Kastner, M., and Stakes, D. S. (2004). Continuous chemical monitoring with osmotically pumped water samplers: OsmoSampler design and applications. Limnol. Oceanogr. Methods 2, 102–113. doi: 10.4319/lom.2004.2.102
Kanehisa, M., and Goto, S. (2000). KEGG: Kyoto Encyclopedia of Genes and Genomes. Nucleic Acids Res. 28, 27–30.
Kolton, M., Sela, N., Elad, Y., and Cytryn, E. (2013). Comparative genomic analysis indicates that niche adaptation of terrestrial flavobacteria is strongly linked to plant glycan metabolism. PLoS One 8:e76704. doi: 10.1371/journal.pone.0076704
Küsel, K., Totsche, K. U., Trumbore, S. E., Lehmann, R., Steinhäuser, C., and Herrmann, M. (2016). How deep can surface signals be traced in the critical zone? Merging biodiversity with biogeochemistry research in a central german muschelkalk landscape. Front. Earth Sci. 4:32. doi: 10.3389/feart.2016.00032
Langille, M. G. I., Zaneveld, J., Caporaso, J. G., McDonald, D., Knights, D., Reyes, J. A., et al. (2013). Predictive functional profiling of microbial communities using 16S rRNA marker gene sequences. Nat. Biotechnol. 31, 814–821. doi: 10.1038/nbt.2676
Lapham, L., Marshall, K., Magen, C., Lyubchich, V., Cooper, L. W., and Grebmeier, J. M. (2017). Dissolved methane concentrations in the water column and surface sediments of Hanna Shoal and Barrow Canyon, Northern Chukchi Sea. Deep Sea Res. Part II Top. Stud. Oceanogr. 144, 92–103. doi: 10.1016/j.dsr2.2017.01.004
Laskar, F., Purkayastha, S. D., Sen, A., Bahattacharya, M. K., and Misra, B. B. (2018). Diversity of methanogenic archaea in freshwater sediments of lacustrine ecosystems. J. Bas. Microbiol. 58, 101–119. doi: 10.1002/jobm.201700341
Leopold, L. B., Wolman, M. G., and Miller, J. P. (1992). Fluvial Processes in Geomorphology. Mineola, NY: Dover Publications.
Li, L., Maher, K., Navarre-Sitchler, A., Druhan, J., Meile, C., Lawrence, C., et al. (2017). Expanding the role of reactive transport models in critical zone processes. Earth Sci. Rev. 165, 280–301. doi: 10.1016/j.earscirev.2016.09.001
Lowe, W. H., and Likens, G. E. (2005). Moving headwater streams to the head of the class. BioScience 55, 196–197. doi: 10.1641/0006-3568(2005)055[0196:MHSTTH]2.0.CO;2
Magen, C., Lapham, L. L., Pohlman, J. W., Marshall, K., Bosman, S., Casso, M., et al. (2014). A simple headspace equilibration method for measuring dissolved methane. Limnol. Oceanogr. Methods 12, 637–650. doi: 10.4319/lom.2014.12.637
Marcek, H. A. M., Lesack, L. F. W., Orcutt, B. N., Wheat, C. G., Dallimore, S. R., Geeves, K., et al. (2021). Continuous dynamics of dissolved methane over 2 years and its carbon isotopes (δ13C, Δ14C) in a small arctic lake in the mackenzie delta. J. Geophys. Res. Biogeosci. 126:e2020JG006038. doi: 10.1029/2020JG006038
Martens, C. S., Mendlovitz, H. P., Seim, H., Lapham, L., and D’Emidio, M. (2016). Sustained in situ measurements of dissolved oxygen, methane and water transport processes in the benthic boundary layer at MC118, northern Gulf of Mexico. Deep Sea Res. Part II Top. Stud. Oceanogr. 129, 41–52. doi: 10.1016/j.dsr2.2015.11.012
Michaud, L., Caruso, C., Mangano, S., Interdonato, F., Bruni, V., and Lo Giudice, A. (2012). Predominance of Flavobacterium, Pseudomonas, and Polaromonas within the prokaryotic community of freshwater shallow lakes in the northern Victoria Land, East Antarctica. FEMS Microbiol. Ecol. 82, 391–404. doi: 10.1111/j.1574-6941.2012.01394.x
Naegeli, M. W., and Uehlinger, U. (1997). Contribution of the hyporheic zone to ecosystem metabolism in a prealpine gravel-bed-River. J. North Am. Benthol. Soc. 16, 794–804. doi: 10.2307/1468172
Nisbet, E. G., Dlugokencky, E. J., and Bousquet, P. (2014). Methane on the Rise—Again. Science 343, 493–495. doi: 10.1126/science.1247828
Nisbet, E. G., Manning, M. R., Dlugokencky, E. J., Fisher, R. E., Lowry, D., Michel, S. E., et al. (2019). Very strong atmospheric methane growth in the 4 years 2014–2017: implications for the Paris agreement. Glob. Biogeochem. Cycles 33, 318–342. doi: 10.1029/2018GB006009
Parks, D. H., Tyson, G. W., Hugenholtz, P., and Beiko, R. G. (2014). STAMP: statistical analysis of taxonomic and functional profiles. Bioinformatics 30, 3123–3124. doi: 10.1093/bioinformatics/btu494
Pepin, N., Bradley, R. S., Diaz, H. F., Baraer, M., Caceres, E. B., Forsythe, N., et al. (2015). Elevation-dependent warming in mountain regions of the world. Nat. Clim. Change 5, 424–430. doi: 10.1038/nclimate2563
Pester, M., Brambilla, E., Alazard, D., Rattei, T., Weinmaier, T., Han, J., et al. (2012). Complete Genome Sequences of Desulfosporosinus orientis DSM765T, Desulfosporosinus youngiae DSM17734T, Desulfosporosinus meridiei DSM13257T, and Desulfosporosinus acidiphilus DSM22704T. J. Bacteriol. 194, 6300–6301. doi: 10.1128/JB.01392-12
Quast, C., Pruesse, E., Yilmaz, P., Gerken, J., Schweer, T., Yarza, P., et al. (2013). The SILVA ribosomal RNA gene database project: improved data processing and web-based tools. Nucleic Acids Res. 41, D590–D596. doi: 10.1093/nar/gks1219
Risso, C., Sun, J., Zhuang, K., Mahadevan, R., DeBoy, R., Ismail, W., et al. (2009). Genome-scale comparison and constraint-based metabolic reconstruction of the facultative anaerobic Fe(III)-reducer Rhodoferax ferrireducens. BMC Genomics 10:447. doi: 10.1186/1471-2164-10-447
Robidart, J., Callister, S. J., Song, P., Nicora, C. D., Wheat, C. G., and Girguis, P. R. (2013). Characterizing microbial community and geochemical dynamics at hydrothermal vents using osmotically driven continuous fluid samplers. Environ. Sci. Technol. 47, 4399–4407. doi: 10.1021/es3037302
Rosemary, C., and Williams, K. (2019). Discharge data collected within the East River for the Lawrence Berkeley National Laboratory Watershed Function Science Focus Area (water years 2015-2018). Water. Fun. SFA. doi: 10.21952/WTR/1495380
Rosentreter, J. A., Borges, A. V., Deemer, B. R., Holgerson, M. A., Liu, S., Song, C., et al. (2021). Half of global methane emissions come from highly variable aquatic ecosystem sources. Nat. Geosci. 14, 225–230. doi: 10.1038/s41561-021-00715-2
Saunois, M., Bousquet, P., Poulter, B., Peregon, A., Ciais, P., Canadell, J. G., et al. (2016). The global methane budget 2000–2012. Earth Syst. Sci. Data 8, 697–751. doi: 10.5194/essd-8-697-2016
Saunois, M., Stavert, A. R., Poulter, B., Bousquet, P., Canadell, J. G., Jackson, R. B., et al. (2020). The global methane budget 2000–2017. Earth Syst. Sci. Data 12, 1561–1623. doi: 10.5194/essd-12-1561-2020
Saup, C. M., Bryant, S. R., Nelson, A. R., Harris, K. D., Sawyer, A. H., Christensen, J. N., et al. (2019). Hyporheic zone microbiome assembly is linked to dynamic water mixing patterns in snowmelt-dominated headwater catchments. J. Geophys. Res. Biogeosci. 124, 3269–3280. doi: 10.1029/2019JG005189
Schade, J. D., Bailio, J., and McDowell, W. H. (2016). Greenhouse gas flux from headwater streams in New Hampshire, USA: patterns and drivers. Limnol. Oceanogr. 61, S165–S174. doi: 10.1002/lno.10337
Silby, M. W., Winstanley, C., Godfrey, S. A. C., Levy, S. B., and Jackson, R. W. (2011). Pseudomonas genomes: diverse and adaptable. FEMS Microbiol. Rev. 35, 652–680. doi: 10.1111/j.1574-6976.2011.00269.x
Srivastava, J. K., Chandra, H., Kalra, S. J. S., Mishra, P., Khan, H., and Yadav, P. (2017). Plant–microbe interaction in aquatic system and their role in the management of water quality: a review. Appl. Water Sci. 7, 1079–1090. doi: 10.1007/s13201-016-0415-2
Stanley, E. H., Casson, N. J., Christel, S. T., Crawford, J. T., Loken, L. C., and Oliver, S. K. (2016). The ecology of methane in streams and rivers: patterns, controls, and global significance. Ecol. Monogr. 86, 146–171. doi: 10.1890/15-1027
Stegen, J. C., Fredrickson, J. K., Wilkins, M. J., Konopka, A. E., Nelson, W. C., Arntzen, E. V., et al. (2016). Groundwater–surface water mixing shifts ecological assembly processes and stimulates organic carbon turnover. Nat. Commun. 7:11237. doi: 10.1038/ncomms11237
Stern, N., Ginder-Vogel, M., Stegen, J. C., Arntzen, E., Kennedy, D. W., Larget, B. R., et al. (2017). Colonization habitat controls biomass, composition, and metabolic activity of attached microbial communities in the columbia river hyporheic corridor. Appl. Environ. Microbiol. 83:260. doi: 10.1128/AEM.00260-17
Street, L. E., Dean, J. F., Billett, M. F., Baxter, R., Dinsmore, K. J., Lessels, J. S., et al. (2016). Redox dynamics in the active layer of an Arctic headwater catchment; examining the potential for transfer of dissolved methane from soils to stream water. J. Geophys. Res. Biogeosci. 121, 2776–2792. doi: 10.1002/2016JG003387
Sun, S., Jones, R. B., and Fodor, A. A. (2020). Inference-based accuracy of metagenome prediction tools varies across sample types and functional categories. Microbiome 8:46. doi: 10.1186/s40168-020-00815-y
Takeuchi, M., Yoshioka, H., Seo, Y., Tanabe, S., Tamaki, H., Kamagata, Y., et al. (2011). A distinct freshwater-adapted subgroup of ANME-1 dominates active archaeal communities in terrestrial subsurfaces in Japan. Environ. Microbiol. 13, 3206–3218. doi: 10.1111/j.1462-2920.2011.02517.x
Treat, C. C., Bloom, A. A., and Marushchak, M. E. (2018). Nongrowing season methane emissions-a significant component of annual emissions across northern ecosystems. Glob. Change Biol. 24, 3331–3343. doi: 10.1111/gcb.14137
Vannote, R. L., Minshall, G. W., Cummins, K. W., Sedell, J. R., and Cushing, C. E. (1980). The river continuum concept. Can. J. Fish. Aquat. Sci. 37, 130–137. doi: 10.1139/f80-017
Varadharajan, C., Kakalia, Z., Banfield, J., Berkelhammer, M., Brodie, E., Christianson, D., et al. (2020). Location identifiers, metadata, and map for field measurements at the East River Watershed, Colorado, USA. Water. Fun. SFA doi: 10.15485/1660962
Wallin, M. B., Löfgren, S., Erlandsson, M., and Bishop, K. (2014). Representative regional sampling of carbon dioxide and methane concentrations in hemiboreal headwater streams reveal underestimates in less systematic approaches. Glob. Biogeochem. Cycles 28, 465–479. doi: 10.1002/2013GB004715
Williams, K. H., Beutler, C., Bill, W., Brown, W., Newman, A., and Versteeg, R. (2020a). Stable water isotope data for the east River Watershed, Colorado. Water. Fun. SFA doi: 10.15485/1668053
Williams, K. H., Beutler, C., Newman, A., and Versteeg, R. (2020b). Anion data for the East River Watershed, Colorado. Water. Fun. SFA doi: 10.15485/1668054
Wilson, B. J., Mortazavi, B., and Kiene, R. P. (2015). Spatial and temporal variability in carbon dioxide and methane exchange at three coastal marshes along a salinity gradient in a northern Gulf of Mexico estuary. Biogeochemistry 123, 329–347. doi: 10.1007/s10533-015-0085-4
Winnick, M. J., Carroll, R. W. H., Williams, K. H., Maxwell, R. M., Dong, W., and Maher, K. (2017). Snowmelt controls on concentration-discharge relationships and the balance of oxidative and acid-base weathering fluxes in an alpine catchment, East River, Colorado. Water Res. Res. 53, 2507–2523. doi: 10.1002/2016WR019724
Xu, X., Yuan, F., Hanson, P. J., Wullschleger, S. D., Thornton, P. E., Riley, W. J., et al. (2016). Reviews and syntheses: Four decades of modeling methane cycling in terrestrial ecosystems. Biogeosciences 13, 3735–3755. doi: 10.5194/bg-13-3735-2016
Zhi, W., Li, L., Dong, W., Brown, W., Kaye, J., Steefel, C., et al. (2019). Distinct source water chemistry shapes contrasting concentration-discharge patterns. Water Res. Res. 55, 4233–4251. doi: 10.1029/2018WR024257
Keywords: biogeochemistry, autonomous sampler, microbiome, methane, spring-melt, high-altitude watershed, hyporheic zone
Citation: Buser-Young JZ, Lapham LL, Thurber AR, Williams KH and Colwell FS (2021) Hidden Processes During Seasonal Isolation of a High-Altitude Watershed. Front. Earth Sci. 9:666819. doi: 10.3389/feart.2021.666819
Received: 11 February 2021; Accepted: 26 April 2021;
Published: 24 May 2021.
Edited by:
Timothy Ferdelman, Max Planck Institute for Marine Microbiology (MPG), GermanyReviewed by:
Taylor Royalty, The University of Tennessee, Knoxville, United StatesMariana Dobre, University of Idaho, United States
Copyright © 2021 Buser-Young, Lapham, Thurber, Williams and Colwell. This is an open-access article distributed under the terms of the Creative Commons Attribution License (CC BY). The use, distribution or reproduction in other forums is permitted, provided the original author(s) and the copyright owner(s) are credited and that the original publication in this journal is cited, in accordance with accepted academic practice. No use, distribution or reproduction is permitted which does not comply with these terms.
*Correspondence: Frederick S. Colwell, cmljay5jb2x3ZWxsQG9yZWdvbnN0YXRlLmVkdQ==