 Flavio Cannavò
 Andrea Cannata
 Reik V. Donner
 Mikhail Kanevski
- 1Istituto Nazionale Di Geofisica e Vulcanologia, Osservatorio Etneo, Catania, Italy
- 2Dipartimento di Scienze Biologiche, Geologiche e Ambientali, Università Degli Studi Di Catania, Catania, Italy
- 3Department of Water, Environment, Construction & Safety, Magdeburg-Stendal University of Applied Sciences, Magdeburg, Germany
- 4University of Lausanne, Lausanne, Switzerland
Editorial on the Research Topic
Advanced Time Series Analysis in Geosciences
A time series is an ordered sequence of data indexed by time. In other words, it is a sequence of discrete-time data, usually obtained at equally spaced points in time. Time series analysis is the attempt of extracting meaningful characteristics and statistical information from data organized in chronological order.
Nowadays, there are numerous types of data analysis approaches available for time series which are suitable for different purposes: diagnosing past behavior, prediction and forecasting, curve fitting, interpolation and extrapolation, classification and clustering, segmentation and decomposition, frequency characterization, etc.
The theoretical advances in time series analysis started early at the beginning of the last century with new developments in the field of stochastic processes. The first actual application of autoregressive models to time series can be identified in the work of Yule (1927) and Walker (1931). But it is since the pioneering book “Time Series Analysis” by Box and Jenkins in the 1970s (Box and Jenkins, 1970), that many lines of study in time series analysis have been developed.
Today we are witnessing a rapid increase in quantity, quality and importance of time series data in Earth Sciences. Across its vast number of subdisciplines, the massive production of data, e.g., through the growth of continuous monitoring networks and the availability of abundant remote sensing data, is making increasingly important the use of analysis tools capable of synthesizing information contained in large time series.
To deal with the increasing amount of available data in an automated way, the first emerging approaches of machine learning in time series analysis date back to the early 1980s (Nielsen, 2019). At present, although classical methods are still dominant, machine learning is rapidly emerging as a valid alternative approach to time series analysis, finding effectiveness especially in multivariate time series.
It is clear to everyone that, as continuous monitoring and data gathering become even more common in geosciences, the need for powerful time series analysis techniques, either classical/statistical or machine learning based techniques, will further increase. The impact of this need is proven by an exponential growth shown by the occurrence of the keyword “time series analysis” in papers published from 1985 to 2020, as indicated by both WoS (https://webofknowledge.com/) and Scopus (https://www.scopus.com/) databases (Figure 1).
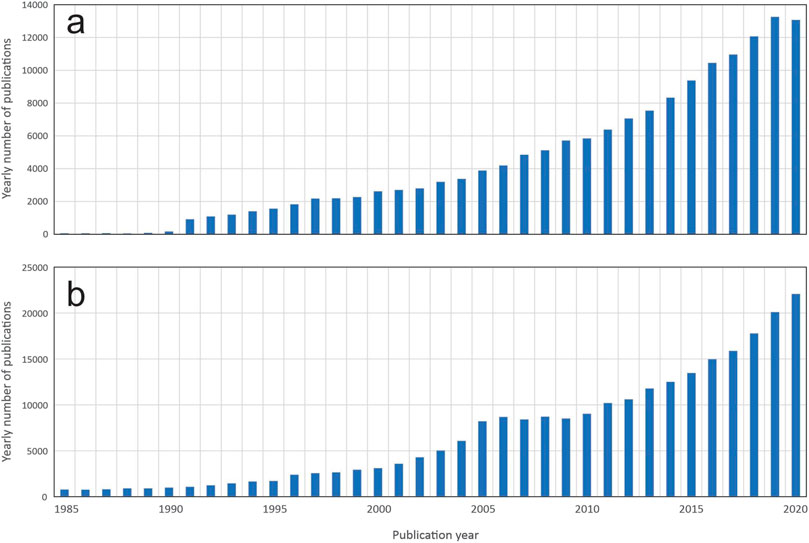
FIGURE 1. Yearly number of publications with the keyword “time series analysis” per year during 1985–2020 from WoS (A) and Scopus (B) database.
In this context, this Research Topic collects some illustrative examples of state of the art research from across the world to delineate the dramatic and diverse nature of time series analysis in geosciences. With the analysis of data over time providing the basis of many modern scientific disciplines, this research covers a variety of applications in the field of geosciences.
Bueno et al. (https://doi.org/10.3389/feart.2019.00335/full) develop an innovative algorithm to detect volcanic explosions in infrasound time series. The algorithm makes extensive use of classical signal processing techniques combined together to characterize continuous volcano-acoustic records and detect explosive events.
With a similar aim, and for a closely related type of observational signals, Sciotto and Montalto (https://doi.org/10.3389/feart.2020.579923/abstract) propose to use a subspace-based trigger algorithm to automatically detect also weak events and outperform the classical STA/LTA (short-time average/long-time average) detection algorithm, commonly used in seismic time series.
Staying on the same kind of acoustic infrasound data in volcanoes, De Angelis et al. (https://doi.org/10.3389/feart.2020.00169/full) propose a way to process the signals recorded through arrays of microphones to detecting and tracking acoustic sources from multiple craters and active vents associated with different types of volcanic activities. The proposed algorithm is based on least-squares beamforming, and allows to evaluate the direction and speed of propagation of acoustic waves between source and array, and includes a quantitative assessment of the uncertainty on array measurements based on error propagation theory.
In active volcanic areas, seismo-acoustic events represent a great source of information on volcano status. Giudicepietro et al. (https://doi.org/10.3389/feart.2020.581742/full) introduce a modern unsupervised neural network approach for clustering experimental seismo-acoustic events. The technique belongs to the growing field of machine learning applications, and the authors show its appropriateness for clustering natural events such as the seismo-acoustic transients accompanying Strombolian explosions. They also state that their parameterization strategy may be suitable to extract significant features of the seismo-acoustic signals linked to the physical conditions of the volcanic system.
Still focusing on a volcano-related topic, another interesting paper has been published by Rodríguez-Molina et al. (https://doi.org/10.3389/feart.2020.577588/full), where heterogeneous volcano deformation time series are analyzed to reconstruct the evolution of volcanic source volumes and understand the time scale of inter-eruptive processes. The adopted techniques draw inspiration from the classical regularized linear regression and Bayesian inversion.
In the context of oil extraction, Mancinelli (https://doi.org/10.3389/feart.2020.00285/full) show how a 3D forward density model can be used to compute the differential gravity signature through time, e.g., before and after a production period, thus helping to locate the causative source due to fluid production.
Moschella et al. (https://doi.org/10.3389/feart.2020.00114/full) analyze and put in a relation time series of microseism recorded by seismic coastal stations with time series of significant sea wave height measured offshore. They adopt some state-of-the-art machine learning algorithms to create a regression model able to link the two different kinds of signals.
As for the climate change topic, Diodato et al. (https://doi.org/10.3389/feart.2020.561148/full) use statistical techniques to build a model able to reconstruct the world longest time series of annual number of days of snow on the ground (1,681–2018).
Within the same field, Li et al. (https://doi.org/10.3389/feart.2020.00059/full) analyze the time series of net primary production of China, and two indices linked with droughts. They employ statistical approaches to analyze the data both in spatial and time domains.
Guignard et al. (https://doi.org/10.3389/feart.2020.00255/full) present a more theoretical paper with broad possible applications. They propose the Fisher-Shannon information method as an effective data exploration tool able to give diverse insights into complex non-stationary time series. They also provide a Python toolbox for the Fisher-Shannon method.
Smaï and Wawrzyniak (https://doi.org/10.3389/feart.2020.00296/full) produced an open source Python library, called Razorback, implemented to handle, manipulate, and combine time series of synchronous data produced in magnetotelluric studies.
Finally, Loose et al. (https://doi.org/10.3389/feart.2020.537028/full) propose two machine learning-based methods (a generalized additive model and a long short-term memory neural network model) for bias correction of in situ sensor data. In particular, such methods are applied to data from submersible and shipboard mass spectrometers.
Of the great variety of techniques and applications in time series analysis, in this collection we have seen how the human ability to analyze data is still irreplaceable, despite the glimpse of the great potential in artificial intelligence approaches for scientific time series studies.
Author Contributions
All authors listed have made a substantial, direct and intellectual contribution to the work, and approved it for publication.
Conflict of Interest
The authors declare that the research was conducted in the absence of any commercial or financial relationships that could be construed as a potential conflict of interest.
Acknowledgments
We thank all authors, reviewers, and editors that have contributed to this Research Topic.
References
Box, G. E. P., and Jenkins, G. M. (1970). Time series analysis: forecasting and control. Hoboken New Jersey: Holden Day.
Nielsen, A. (2019). Practical time series analysis: prediction with statistics and machine learning. Sebastopol California: O’Reilly Media, Inc.
Walker, G. T. (1931). On periodicity in series of related terms. Proc. R. Soc. Lond. Ser. A Containing Pap. Math. phys. Character. 131 (818), 518–532. doi:10.1098/rspa.1931.0069
Keywords: time series, machine learning, data analytics, methods development, data mining
Citation: Cannavò F, Cannata A, Donner RV and Kanevski M (2021) Editorial: Advanced Time Series Analysis in Geosciences. Front. Earth Sci. 9:666148. doi: 10.3389/feart.2021.666148
Received: 09 February 2021; Accepted: 18 February 2021;
Published: 22 March 2021.
Edited and reviewed by:
Peng Liu, Institute of Remote Sensing and Digital Earth (CAS), ChinaCopyright © 2021 Cannavò, Cannata, Donner and Kanevski. This is an open-access article distributed under the terms of the Creative Commons Attribution License (CC BY). The use, distribution or reproduction in other forums is permitted, provided the original author(s) and the copyright owner(s) are credited and that the original publication in this journal is cited, in accordance with accepted academic practice. No use, distribution or reproduction is permitted which does not comply with these terms.
*Correspondence: Flavio Cannavò, ZmxhdmlvLmNhbm5hdm9AaW5ndi5pdA==