- 1Department of Hydraulic Engineering, Tsinghua University, Beijing, China
- 2Information Center (Hydrology Monitor and Forecast Center), Ministry of Water Resources, Beijing, China
- 3School of Water Conservancy and Civil Engineering, Northeast Agricultural University, Harbin, China
- 4China Institute of Water Resources and Hydropower Research, Beijing, China
Inter-basin water transfer projects play an important role in allocating water resources that vary both in temporal and spatial scale while supporting regional development. In the practical operation of inter-basin water transfer projects, high water level and less inflow runoff would result in water supply destruction, while low water level and more inflow runoff would cause abandoned water. How to play the compensation roles of hydrological characteristics and storage capacities of multi-reservoirs to maximize the utilization efficiency of water resources, the key is to select the basis for the decision-making of starting water transfer process. In this paper, we selected the “Datong-Huangshui” water transfer project as the research subject, analyzed the composition of the inter-basin water transfer system, and constructed a dispatching rule extraction model including water transfer rules, water diversion rules, and water supply rules. Then the NSGA-II was used to solve the multi-objective optimization model to obtain the Pareto frontier solution set of the dispatching rules. Finally, the optimal operation scheme was determined and discussed according to the scheduling scheme decision model. The model itself was based on the gray target model and prospect theory. We found that: (1) The optimal target frontier obtained by the two-dimensional scheduling diagram and the hedging rules for water supply was closer to the theoretical optimal frontier of the multi-objective problem. This result indicated that the two-dimensional scheduling diagram and the hedging rules for water supply could better guide the water diversion operation of inter-basin water transfer projects. (2) Based on the multi-objective optimal operation schemes set, the OPT scheme obtained by the scheduling scheme decision model using gray target model and prospect theory could generate 359 million Kwh. At the same time, it could guarantee 90% of municipal and industrial water supply and 85% of agricultural water supply.
Introduction
Inter-basin water transfer projects are critical to minimize the conflicts between competing water resource demands and supplies (Bonacci and Andric, 2010; Sadegh et al., 2010; Yu et al., 2020). The inter-basin water transfer rules, particularly the scheduling process, are subject to numerous studies because it is challenging to balance between local water demand, the environmental consequences and the economy and effectiveness of water diversion to avoid water loss (Li et al., 2015). The process requires a formulation of optimal scheduling decisions and reasonable arrangements for diversion time, as well as the amount of water diversion and supply (Jafarzadegan et al., 2014).
The joint dispatching rules for multi-reservoirs of the inter-basin water transfer project usually focus on two aspects: the determination of water transfer rules and the determination of water supply rules. Water transfer rules included consideration from upper-level decision makers regarding: (1) when and how much water should be transferred from the source reservoir (group) to the receiving reservoir (group), (2) water allocation in the receiving area. Water supply rules included consideration from the lower-level decision makers about how the reservoir (group) can provide water users with timely and appropriate amounts of water when the water transfer behavior is initiated. So far, the most commonly used dispatching rules for joint operation of multi-reservoirs are scheduling diagrams and functions. Chang et al. (Chang and Chang, 2009) added a joint water supply dispatching line to a reservoir scheduling diagram, and determined which reservoir should supply water to the public water supply area according to the positional relationship between the storage capacity of the reservoir and the joint dispatching line. Guo et al. (2011) used aggregate reservoir scheduling diagrams and two-dimensional reservoir scheduling diagrams to determine the total water supply volume of multi-reservoirs, and then calculated the adjustment of each reservoir according to the water allocation rules. Zhou (Zhou et al., 2012) used the implicit stochastic optimization method to determine the optimal operation process of the multi-reservoirs, and then determined the scheduling function for each scheduling period within a year through the regression analysis, and finally used the simulation method to verify and modify the determined scheduling function.
Simulation, optimization, simulation and optimization are the common methods for rule extractions. Simulation methods are divided into general simulation systems and specific basin simulation systems according to their versatility (Yeh, 1985; Wurbs, 1993; Rani and Moreira, 2010). Optimization methods are mainly divided into mathematical programming methods and artificial intelligence optimization methods (Hall et al., 1969; Heidari et al., 1971; Lund and Ferreira, 1996; Hsu and Cheng, 2002; Tung et al., 2003; Reis et al., 2006). Currently, the most widely used method is the simulation and optimization method, which uses the parameters of dispatching rules as the decision variables to directly optimize the dispatching rules. Neelakantan and Pundarikathan (Neelakantan and Pundarikanthan, 2000) embedded the feed-back neural network method into the nonlinear programming model, and established a relatively special simulation and optimization model. Chang et al. (2003, 2010), Tung et al. (2003); Suiadee and Tingsanchali (2007), Hormwichian et al. (2009) used different forms of genetic algorithms to determine the joint operation rules of reservoir groups based on the simulation and optimization method. Sulis (2009) established a simulation optimization model for multi-reservoirs based on GRID optimization method. Kangrang et al. (2009) used a combination method of heuristic algorithm and simulation model to determine the scheduling diagram of Ubolratana Reservoir in Thailand.
In the past, the starting standards for transferring water were based on the current storage volume of the reservoir. However, it did not consider the inflow runoff of the source and receiving reservoir during the water transfer period. As a result, “high water level and less inflow runoff” would result in water supply destruction while “low water level and more inflow runoff” would cause abandoned water. In this paper, we tried to solve the above problem using the dispatching rules extracted from the two-dimensional scheduling diagram. Accordingly, the objective of this paper is: (1) to analyze the composition of the inter-basin water transfer system, and to construct a dispatching rule extraction model including water transfer rules, water diversion rules, and water supply rules; (2) to use the Pareto frontier solution set of the dispatching rules obtained from the NSGA-II (Liu et al., 2020) to solve the multi-objective optimization model; and (3) to determine the optimal operation scheme according to the scheduling scheme decision model based on gray target model (Luo et al., 2001) and prospect theory (Tversky and Kahneman, 1992). The results should provide a basis for decision-making process in the “Datong-Huangshui” area.
Study Area
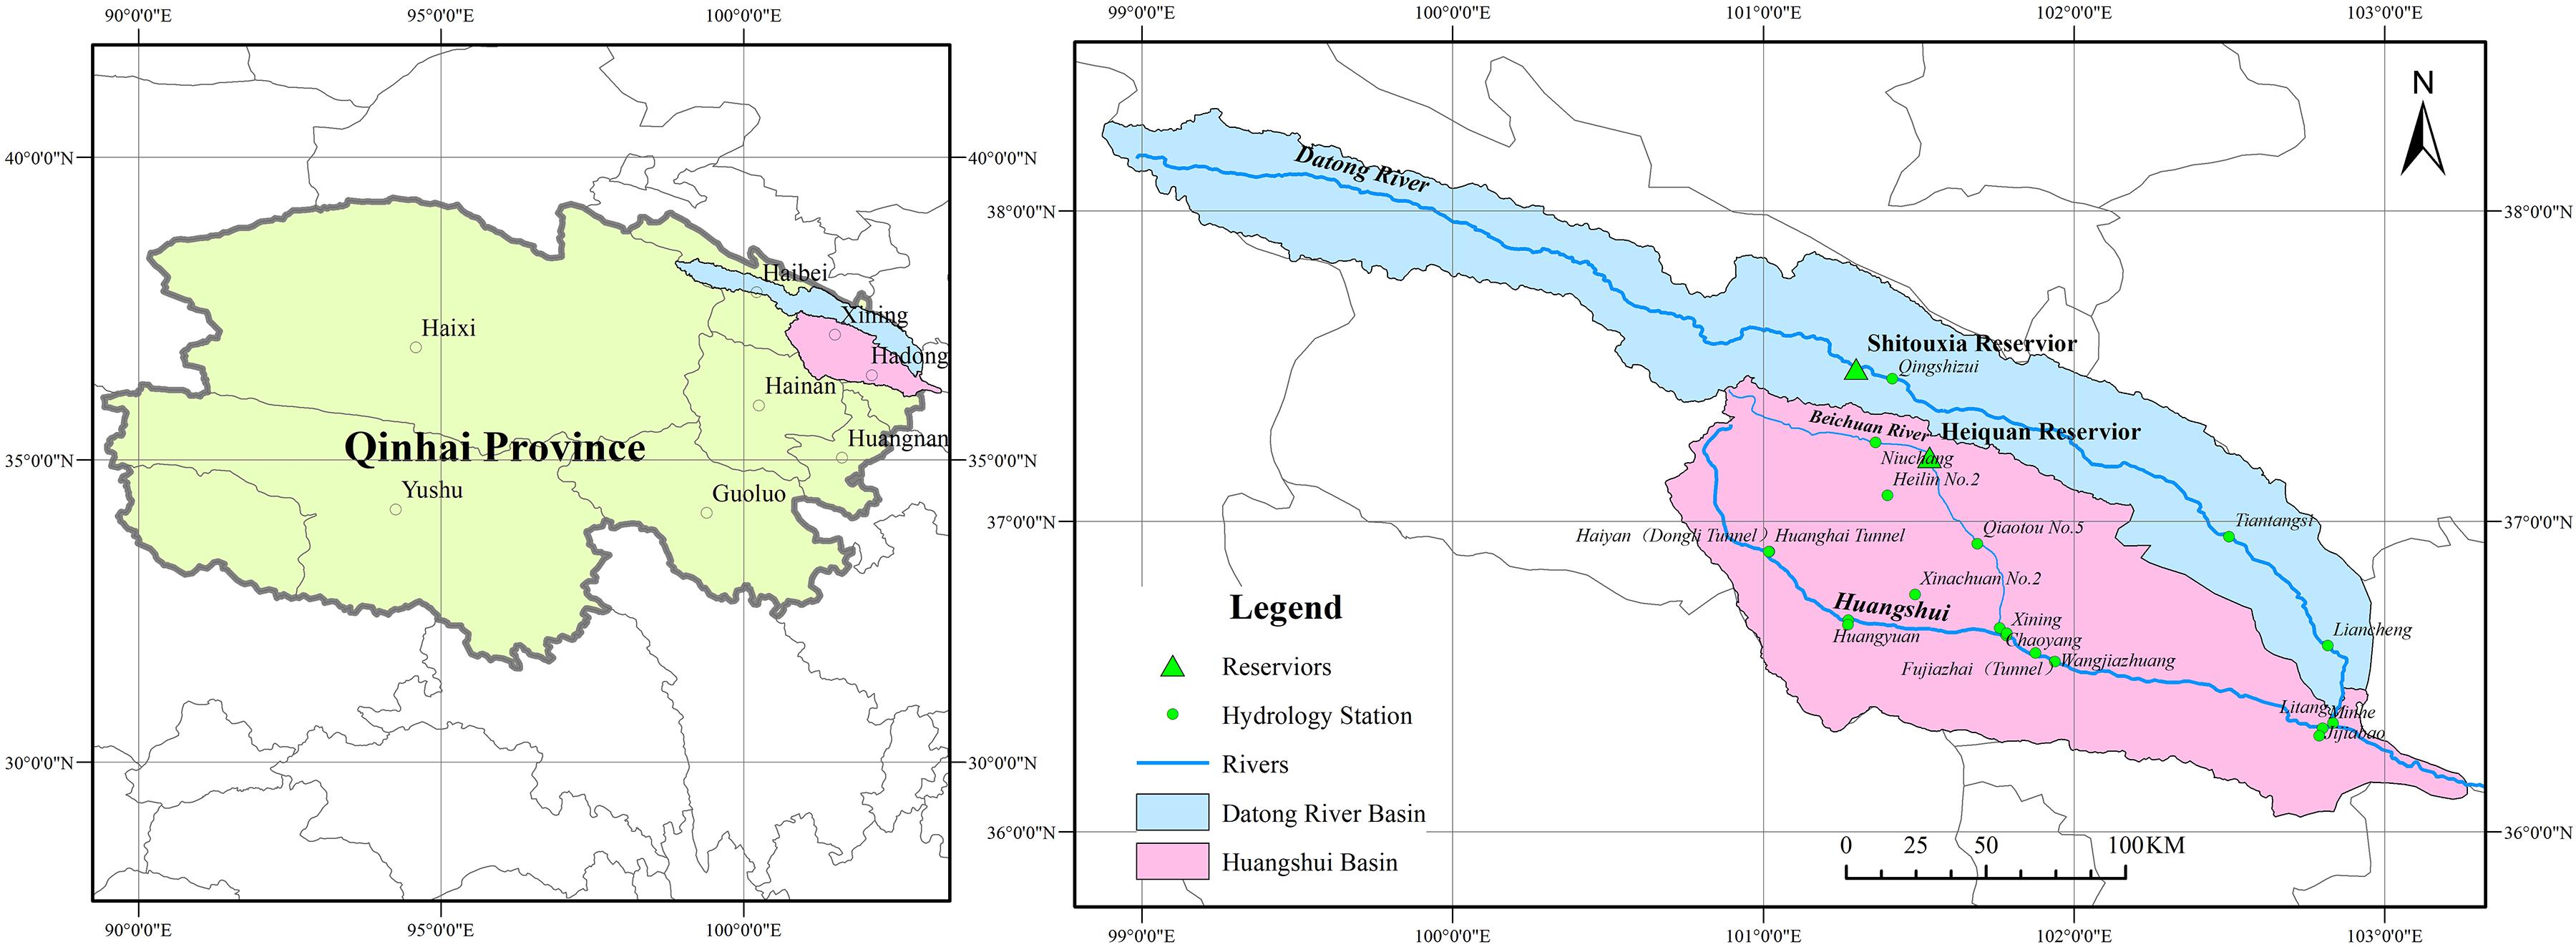
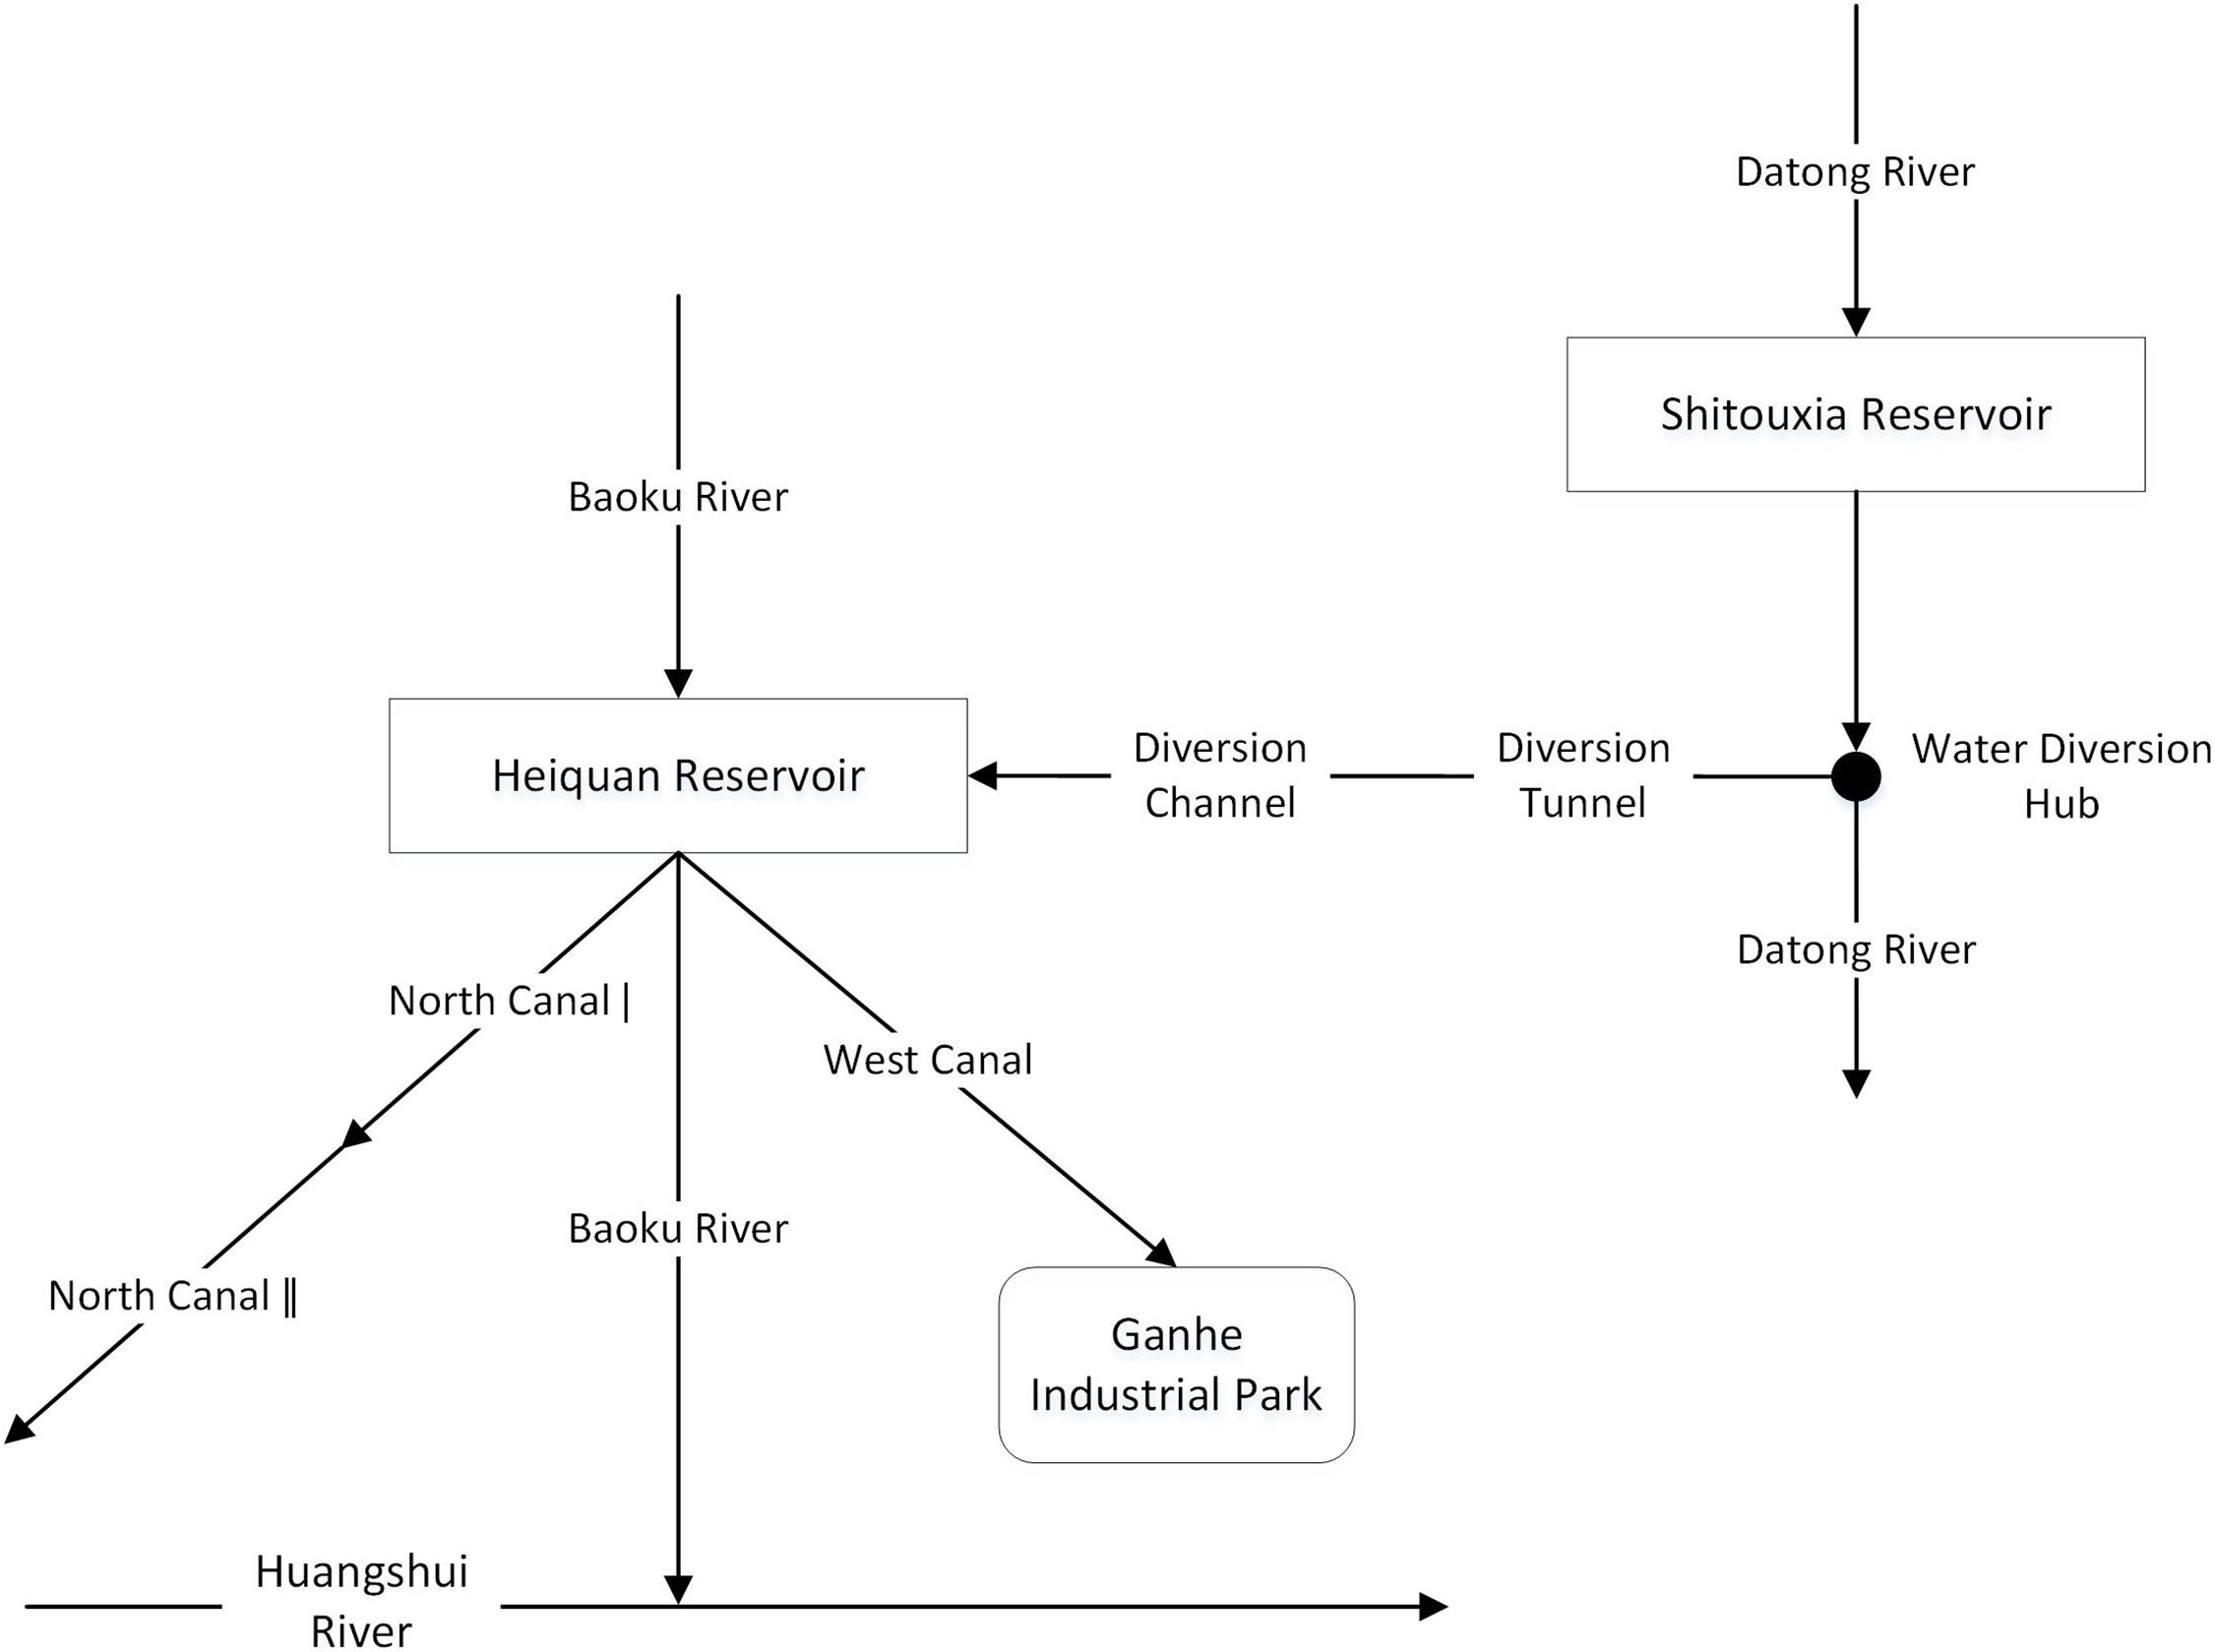
The Huangshui Basin, that drains from the Huangshui River (latitude N 36°02′∼37°28′, longitude E 100°42′∼103°01′) and the Datong River (latitude N 36°30′∼38°25′, longitude E 98°30′∼103°15′), is a first-level tributary of the upper reaches of the Yellow River. As shown in Figure 1, the Huangshui River flows from northwest to southeast, originating in Haiyan County, Qinghai Province, flowing eastward to Minhe County, and entering the Yellow River in Yongjing County, Gansu Province. Of the 374 km long and the 17,733 km2 area of the Huangshui River, 336 km and 16,120 km2 are located in Qinghai Province. This paper examined the “Datong-Huangshui” water transfer project as an example to study the optimal joint operation of inter-basin multi-reservoirs. The hydraulic connection of the inter-basin water transfer project is shown in Figure 2. In this project, the Shitouxia Reservoir (STX for short), as a water source reservoir, has no hydraulic connection with the receiving reservoir (Heiquan Reservoir, HQ for short), but they are connected to each other through the main water transfer canal. The two reservoirs have different dispatching targets in the inter-basin water transfer system. The STX Reservoir transfers water and generates power, and the electric dispatching is subject to water dispatching. The HQ Reservoir supplies water by using natural reservoir inflow and transferring water through its own function of regulation and storage.
Methods
Compared with the normal water supply system of multi-reservoirs, the dispatching rules of the inter-basin water transfer system should consider reasonable water supply, water transfer and diversion. Therefore, the dispatching rules generally include: water transfer rule, water diversion rule and water supply rule, which jointly guide the operation of reservoirs and optimize the benefits of water transfer system. Water transfer rule and water diversion rule are used to guide the operation of the source and the receiving reservoir, respectively. The optimization of the two rules is to realize the optimal benefit of water transfer projects on the basis of weighing water using efficiency of the source reservoir and water diversion target of the receiving reservoir. Water supply rule is to maximize the water use benefit of the receiving reservoir under consideration of water diversion. Consequently, the joint dispatching rule model proposed in this paper mainly involved three modules: power generation module, water transfer and diversion module, water supply module. For each module, its dispatching rules were constructed based on power generation scheduling diagram, two-dimensional water diversion scheduling diagram and hedging rules for water supply, respectively.
Water Diversion Operation Model Based on the Two-Dimensional Water Diversion Scheduling Diagram
Water Diversion Dispatching Rule
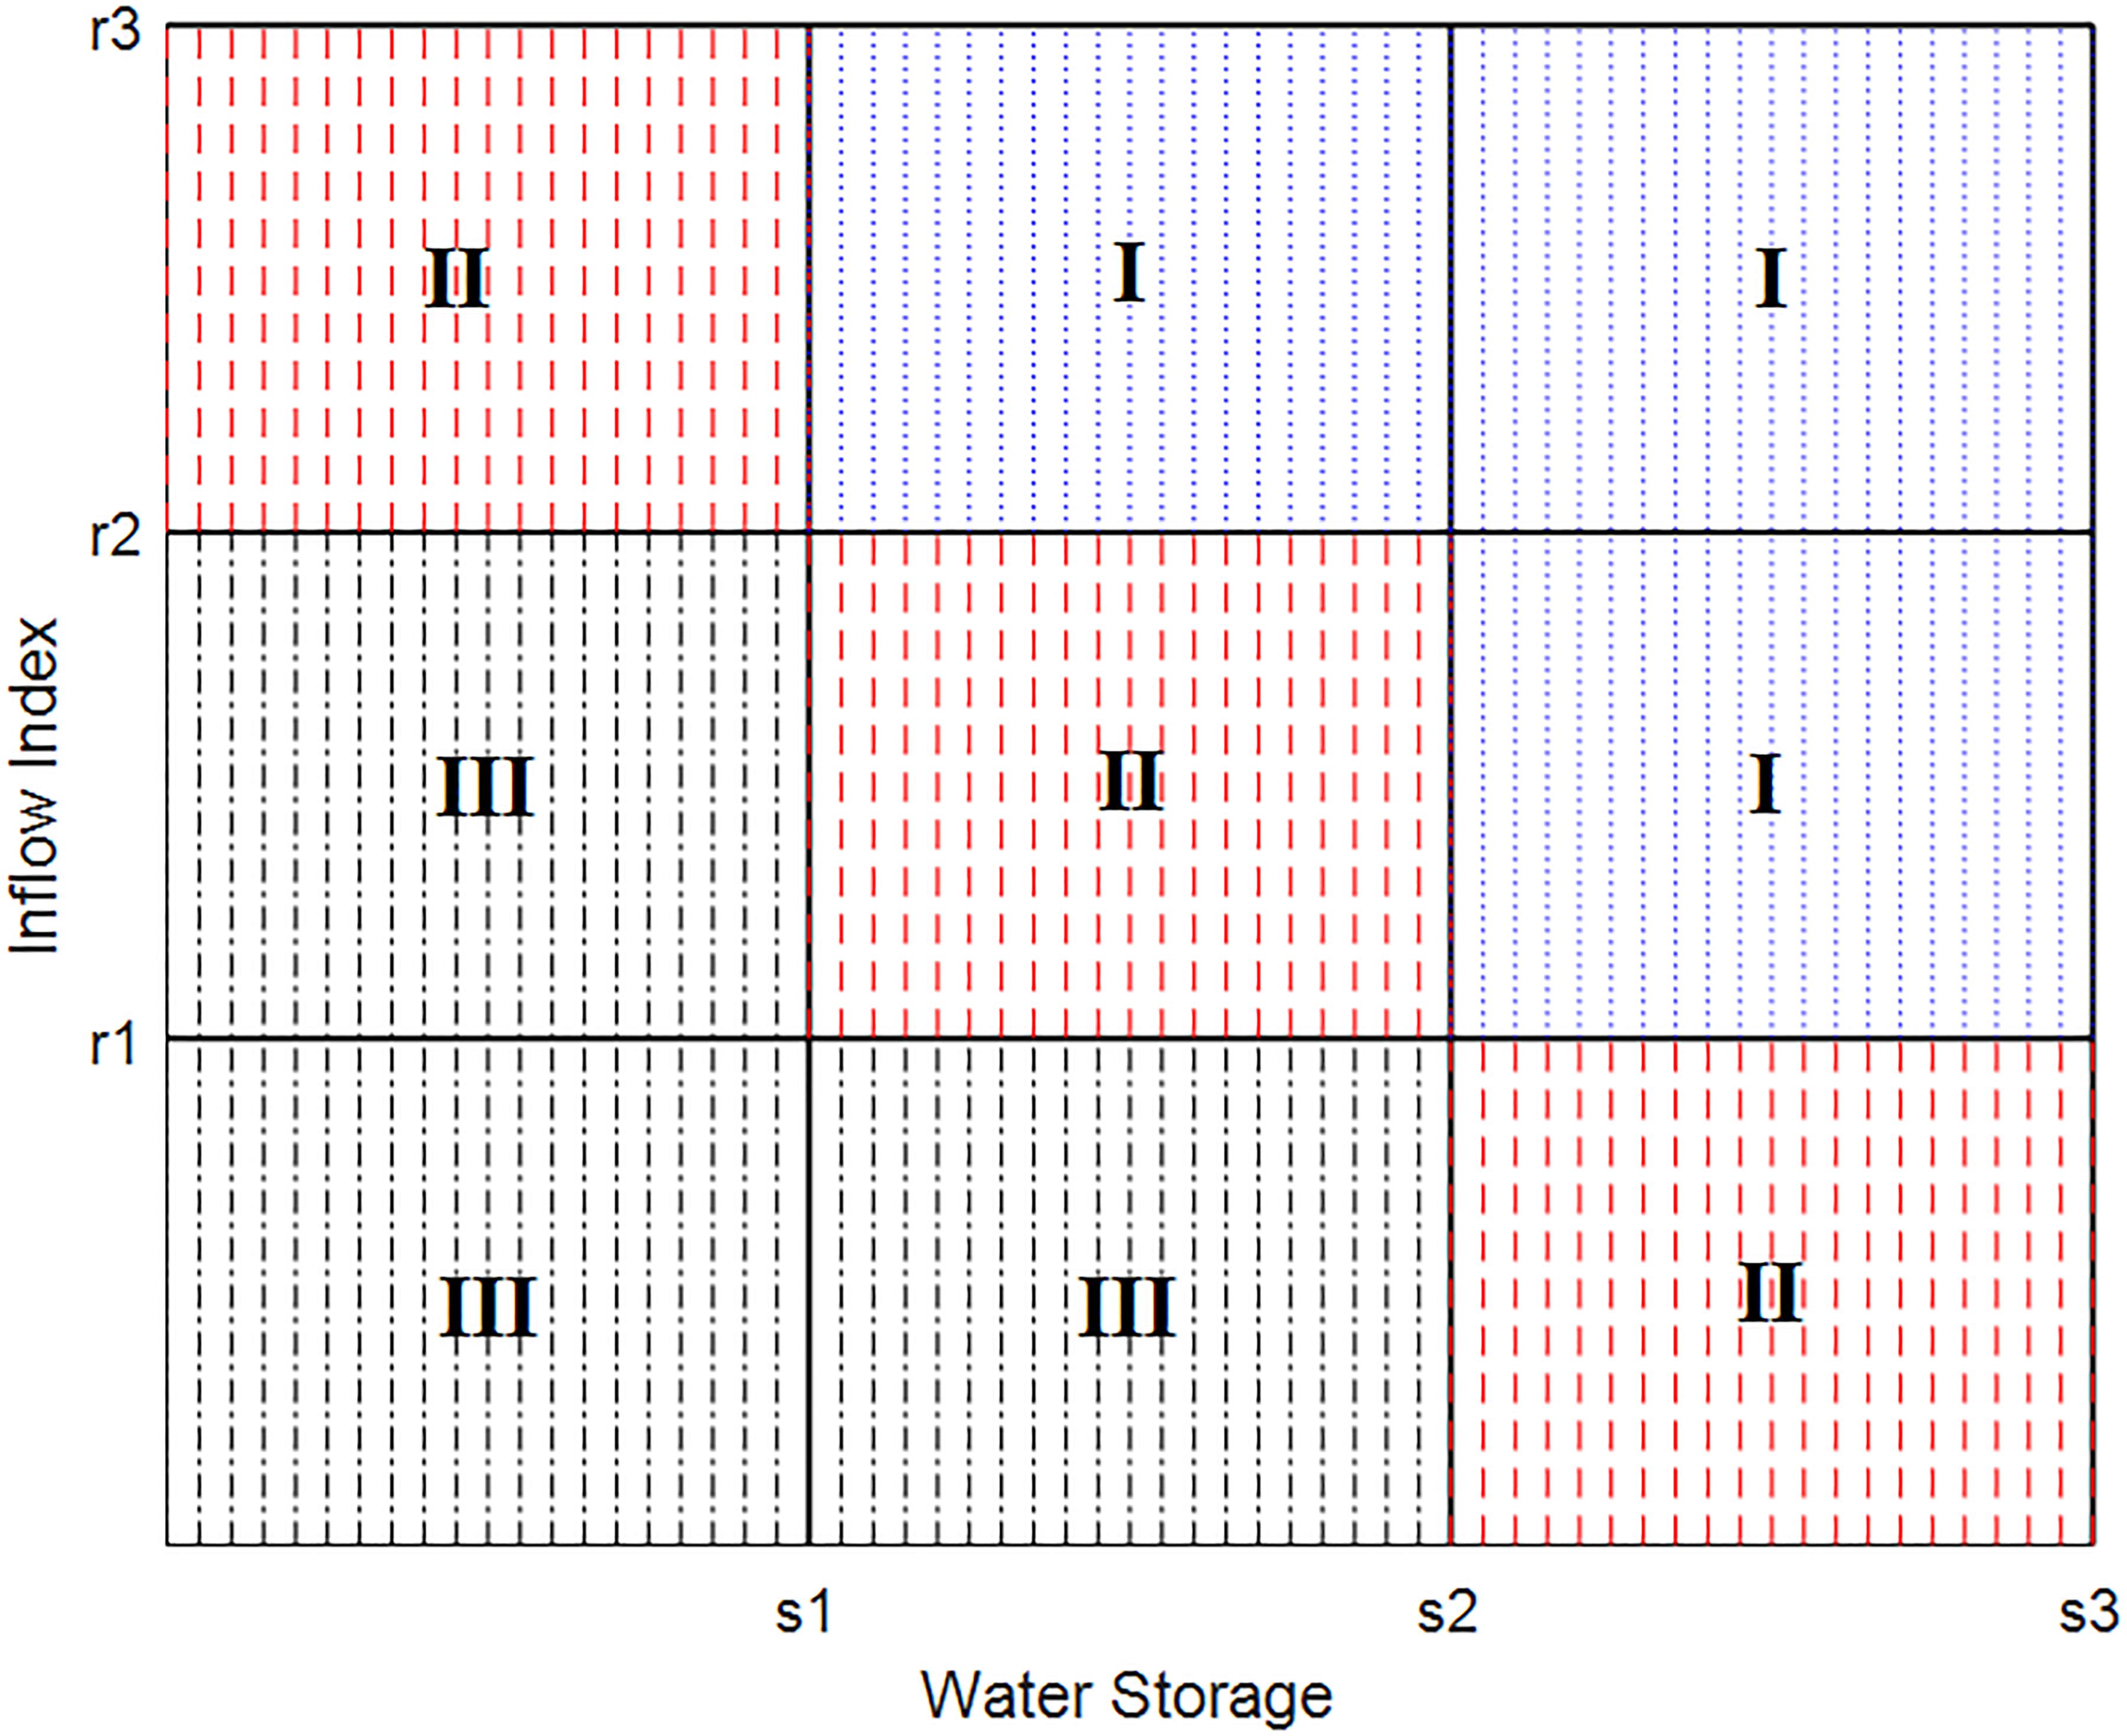
The two-dimensional water diversion scheduling diagram selected the state variables at the beginning of the scheduling period and the state variables during the scheduling period as the coordinate axes, respectively. The water storage capacity of the receiving reservoir was used as the state variable at the beginning of the scheduling period, and the inflow index calculated based on the reservoir inflow and the water supply target were taken as the state variables during the scheduling period. Because monthly water demand varied greatly with the increase in the proportion of agricultural water in the study area, there were different satisfaction degrees of water demand under the same inflow runoff. Therefore, this paper chose to use the ratio of the reservoir inflow and the difference between water demand and the minimum diversion amount as the inflow index. From the perspective of mapping, the water diversion dispatching rule was a multivariate function of the scheduling period and the two state variables. The mapping relationship between the function and the independent variable was expressed as the water diversion dispatching rule based on two-dimensional reservoir scheduling diagram.
In order to explain the specific water diversion rules shown in the two-dimensional water diversion scheduling diagram, we projected the section perpendicular to the time axis of the scheduling diagram in a certain scheduling period to the coordinate plane determined by two state variables. This method resulted in a plane figure of the two-dimensional water diversion scheduling diagram during a scheduling period (Figure 3). Water diversion rules of the inter-basin water transfer project are determined by the two state variables: water storage and inflow index. The decisions of water diversion can be divided into three situations: minimum water diversion, restricted water diversion and full water diversion. The combination of the two state variables constituted three types of water diversion modes under nine situations in the two-dimensional scheduling diagram. The specific rules are shown in Table 1.
Objective of Water Diversion
Water diversion aims to meet the water demand of the water receiving area. Therefore, the minimum difference between the annual actual diversion amount and the target diversion amount can be used as the objective of the water transfer and diversion module.
Where, D and Bi,j represent the target diversion amount and the actual water diversion amount, respectively. The target water diversion amount is determined according to the inflow runoff and water demand of the receiving reservoir. i and j represent the serial number of year and month, respectively. m and n represent the amount of years and months during the calculated period, respectively.
Water Supply Operation Model Based on Hedging Rules for Water Supply
Water Supply Dispatching Rule
There are three types of water use units for HQ Reservoir. However, when hedging rules (Ji et al., 2016) for water supply are applied, only the optimal total water supply amount during the dispatching period can be obtained. Therefore, the total water supply calculated by the hedging rules need to be allocated to each water use unit. For the three water use units of HQ Reservoir, the priority of water use from high to low is for municipal, industrial and agricultural use. Assuming that the water supply volume of the three water use units during the period t were R1(t), R2(t) and R3(t), respectively, we established water supply rules for orderly allocation based on the elastic coefficients of different water use units. The specific rules are as follows:
The amount of water supply for municipal water:
The amount of water supply for industrial water:
The amount of water supply for agricultural water:
Where, R∗(t) represents available water supply, which is calculated according to initial water storage and water diversion amount. D1(t),D2(t) and D3(t) represent municipal water demand, industrial water demand and agricultural water demand, respectively. α represents restricting coefficient for water supply.
Objective of Water Supply
The purpose of water supply scheduling is to minimize the loss of water during the reservoir operation. In addition to the linear function relationship within the elasticity of demand, the amount of water losses and water shortage generally show a convex function relationship. In other words, the minimum cumulative water shortage amount does not necessarily guarantee the minimum economic water loss. Therefore, this paper chose water shortage index as the objective of water supply. The calculation formula of the water shortage index is as follows:
Where, SIi,t represents the water shortage index of water use unit i during time period t. Di,trepresents water demand amount of water use unit i during time period t. Ri,t represents water supply amount of water use unit i during time period t. m is the benefit index, and the value is generally 2.
Constrained Conditions
(1) Constraint of water balance:
Where, Vt+1, Vt are the reservoir storage volume at time t and t+1, respectively; It is the inflow runoff at time t; St is the water amount for power generation at time t; qt is the abandoned water at time t; lt is the water loss at time t, including evaporation and leakage.
(2) Constraint of reservoir storage capacity:
Where, Vd, Vc are the dead storage capacity and normal storage capacity of the reservoir, respectively.
(3) Constraint of output during the period:
Where, Nmin, Nmax are the minimum output and the installed output of the reservoir, respectively.
(4) Constraint of discharged water:
Where, qmin is the minimum discharged water, in this paper it refers to the ecological water demand in the downstream. qmax is the maximum discharged water that will not cause damage to the downstream.
(5) Constraint of power generation guarantee rate:
Where, ppg is the power generation guarantee rate, ppg,d is the designed value for the power generation guarantee rate.
(6) Constraint of water transfer guarantee rate:
Where, ptg is the water transfer guarantee rate; ptg,d is the designed value for the water transfer guarantee rate.
Implementation of the Joint Operation Models
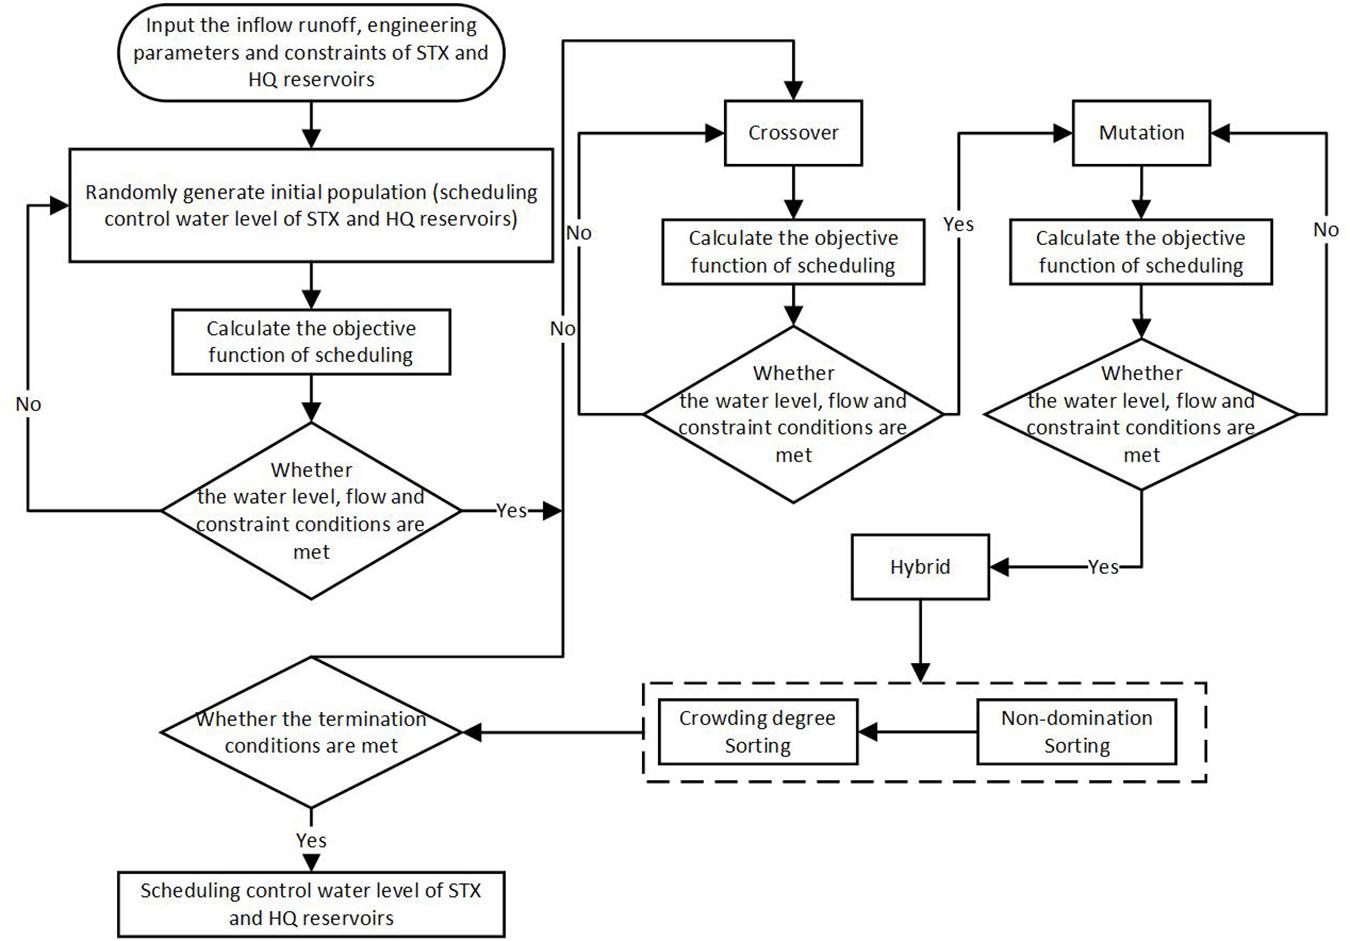
A FORTRAN program was coded to implement the joint operation model and NSGA-II algorithm. The joint operation model includes water transfer rules, water diversion rules, and water supply rules. Among which, the water diversion rules and water supply rules were designed based on the two-dimensional scheduling diagram and the hedging rules for water supply, respectively. In addition, the population size, the maximum number of iterations, the crossover probability and the mutation probability of NSGA-II were set to 100, 1000, 0.75 and 0.01, respectively. Then 200 groups of Pareto optimal solutions were obtained after calculation. The implementation processes are shown in Figure 4.
Results
Solution and Result Analysis of the Joint Operation Model
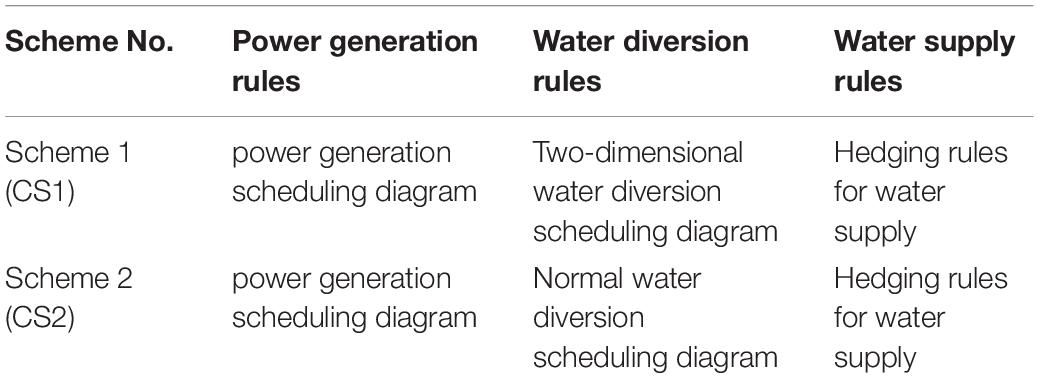
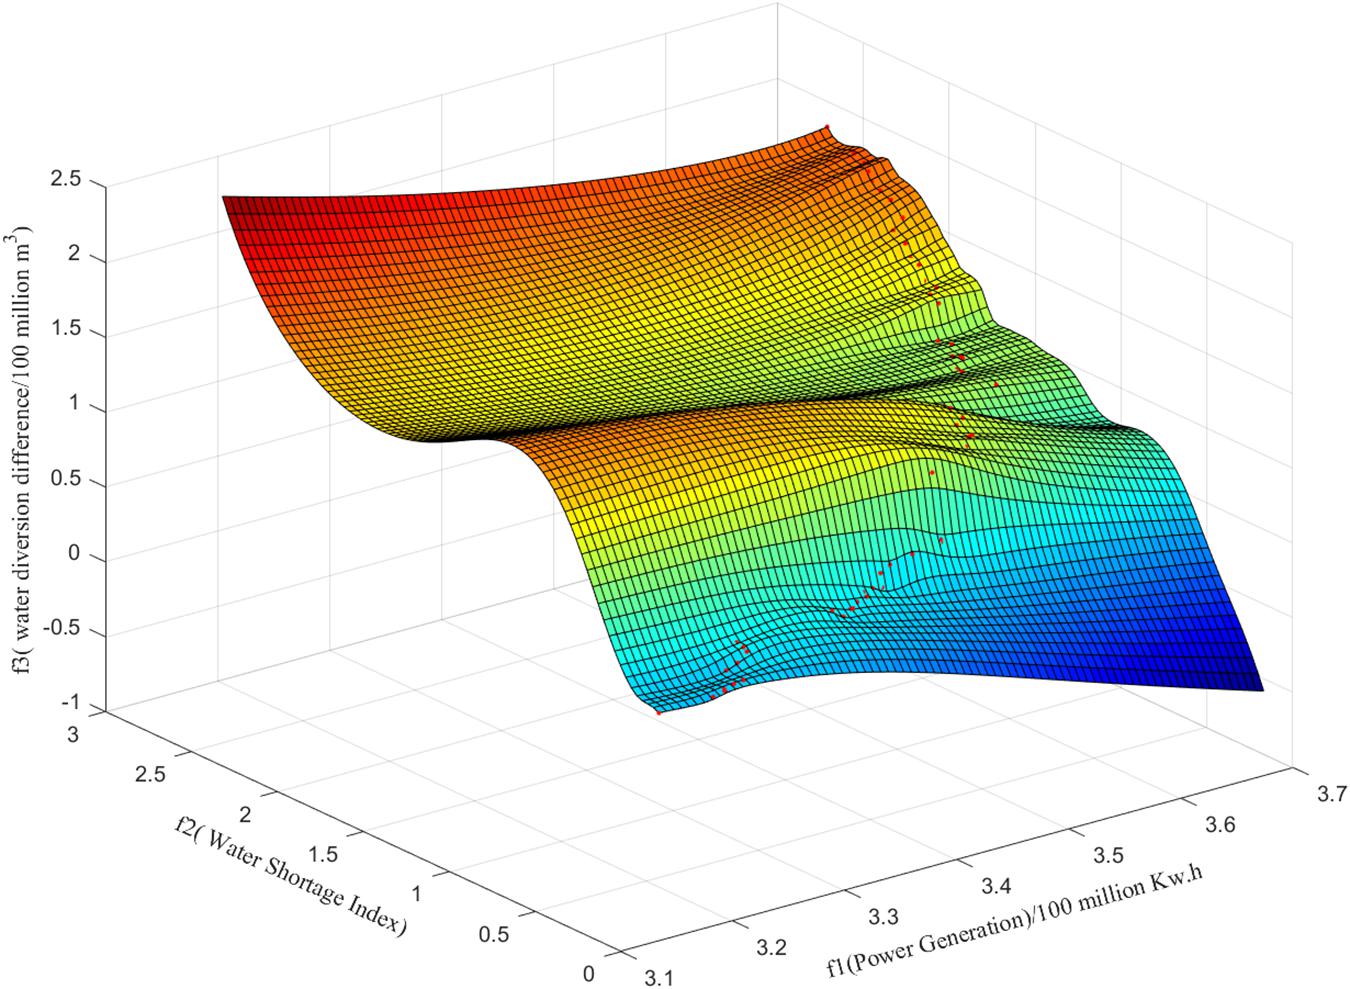
In order to analyze the rationale and effectiveness of the dispatching rules designed in this paper, a set of comparison schemes (CS1 and CS2) were set (Table 2). The NSGA-II algorithm was used for optimization, and the optimized operation results of the two sets of comparison schemes were compared. The Pareto frontier solution set obtained by CS 1 is shown in Figure 5.
The main purpose of the joint operation of inter-basin water transfer projects is to solve the contradiction between the operation targets of the source and the receiving reservoir. There are three targets for the joint operation model constructed in this paper: power generation, water diversion, and water supply. Power generation is only for the source reservoir that has power generation target. Water diversion and water supply are for the receiving reservoir. Therefore, the amount of power generation and water supply, and the amount of power generation and water diversion can be compared in pairs. This paper projected the three-dimensional distribution map of the Pareto solution set to obtain the spatial distribution maps of the two sets of non-inferior scheduling schemes for the average annual power generation and the average annual water shortage index, and the average annual power generation and the average annual water diversion difference, respectively (Figure 6).
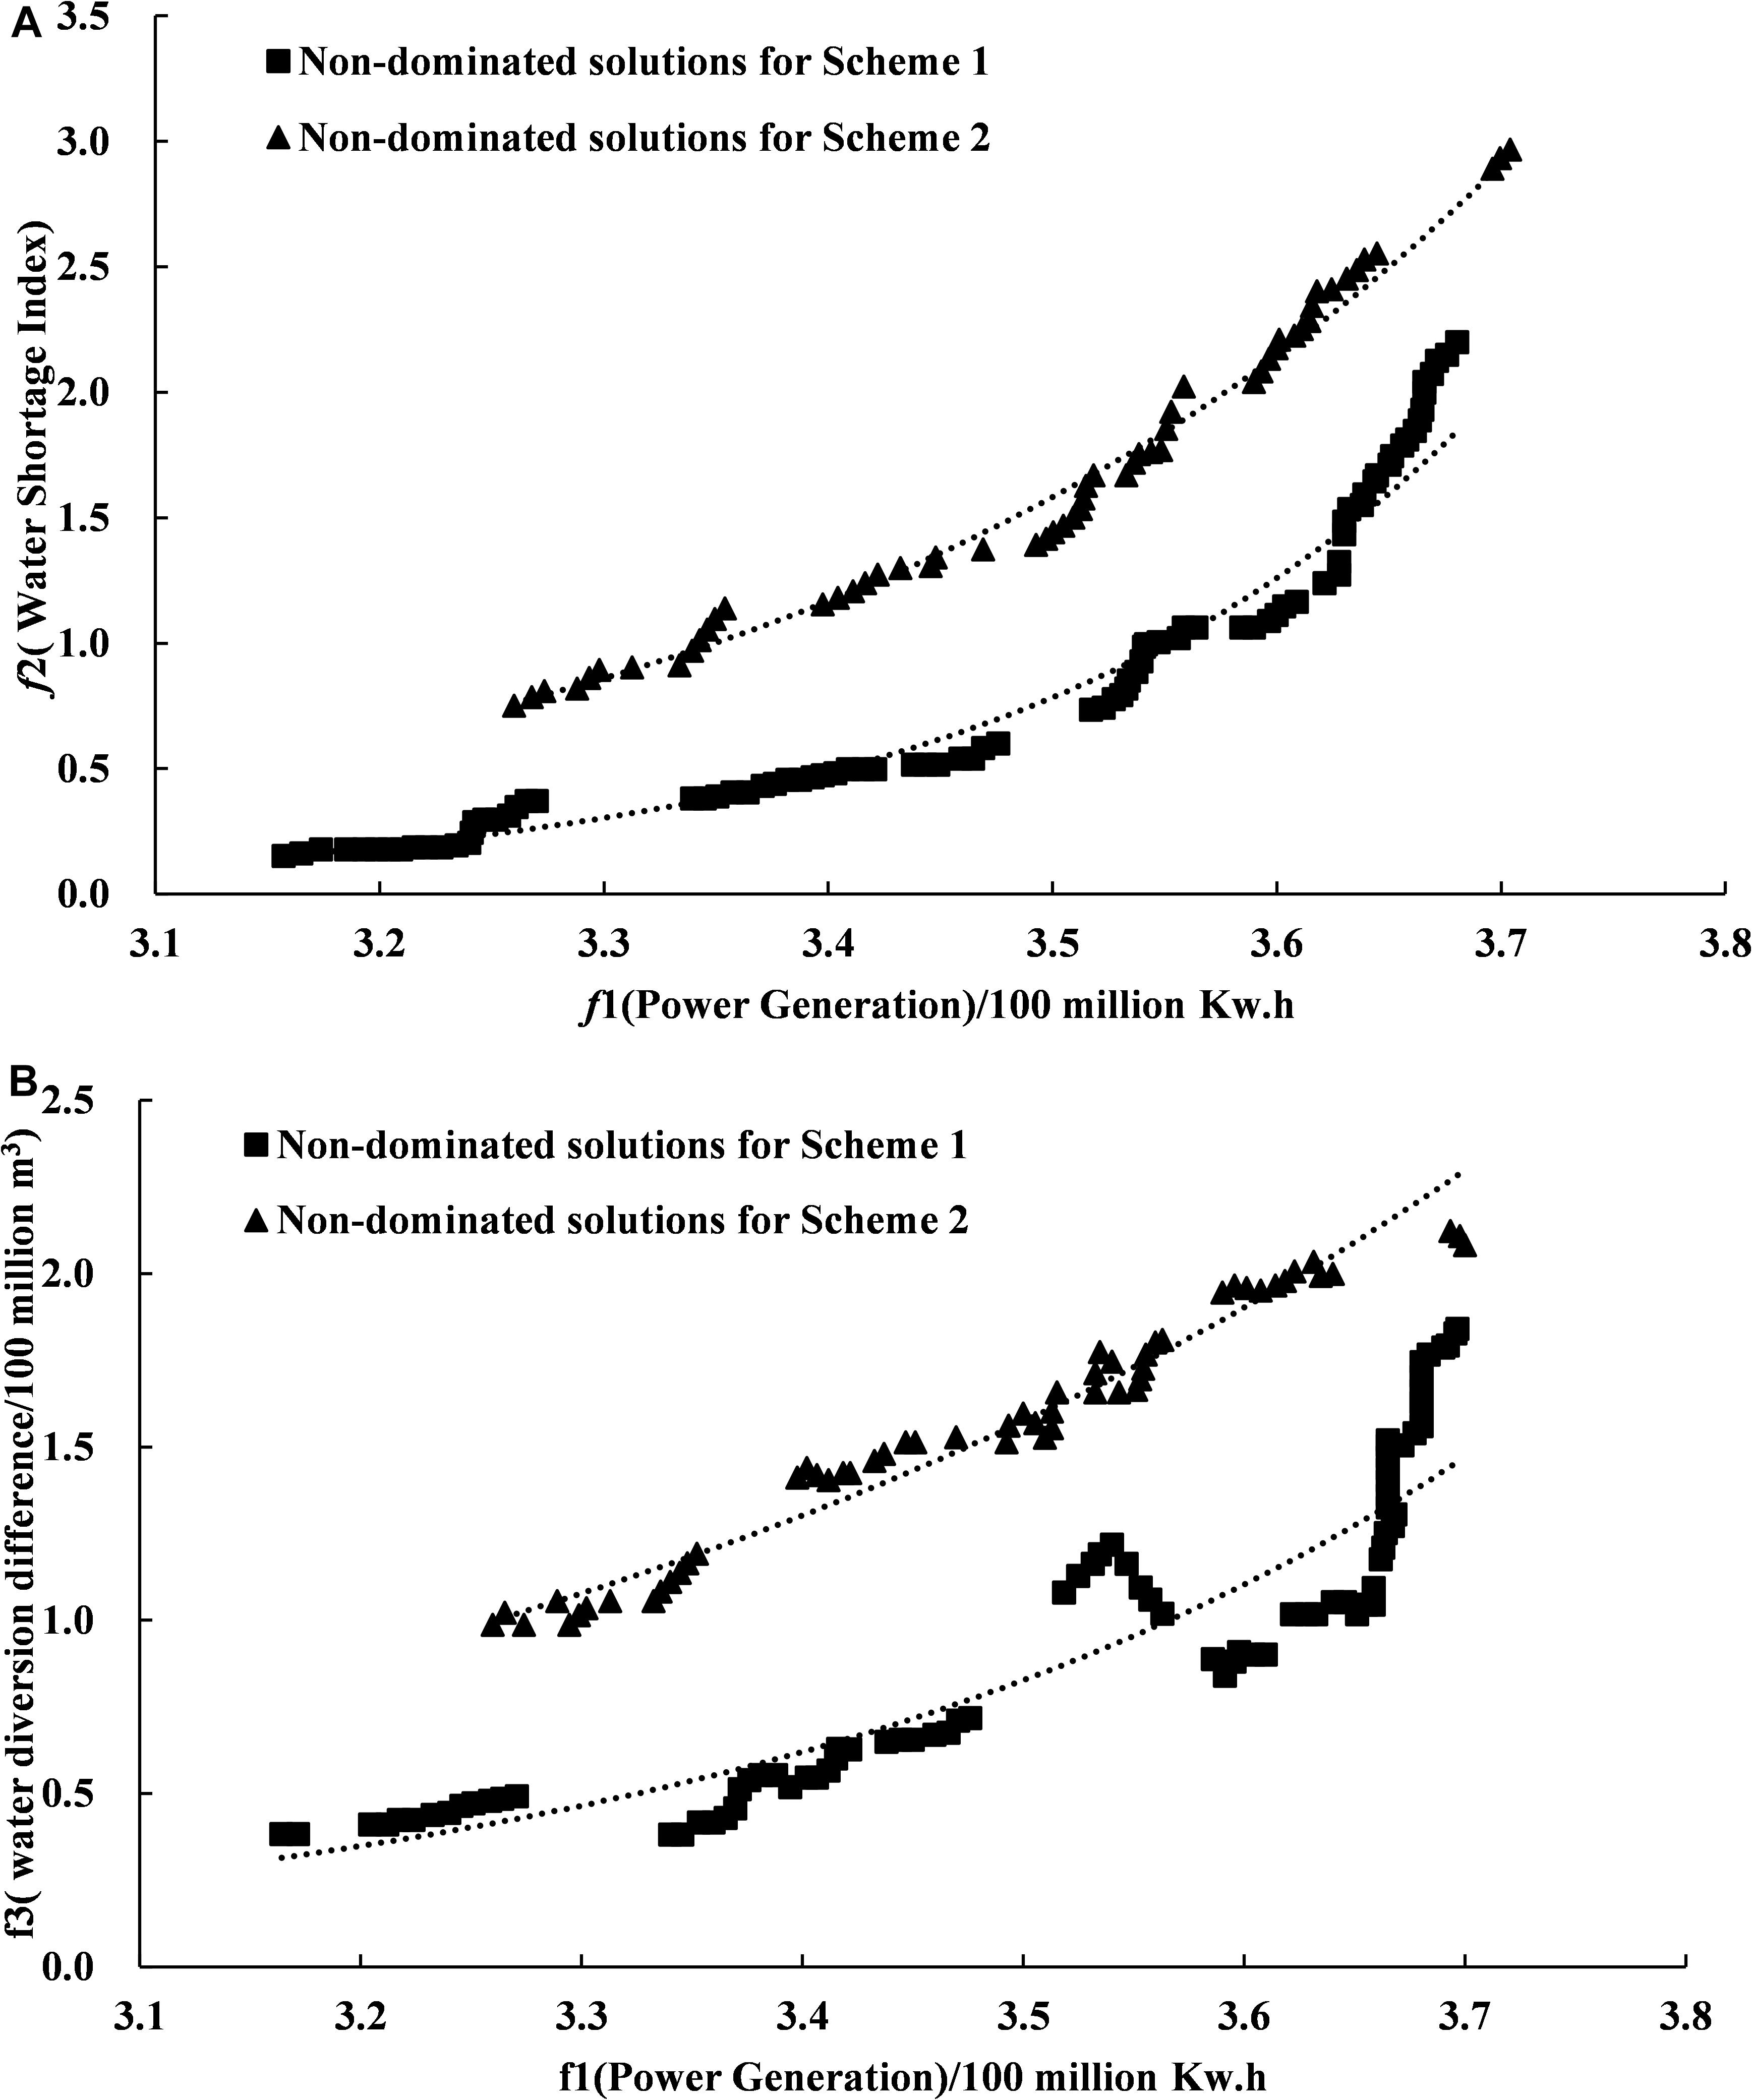
Figure 6. The frontier projection of Pareto solution set. (A) Pareto frontier projection of power generation target and water supply target. (B) Pareto frontier projection of power generation target and water diversion target.
Our results showed that: (1) the numerical trends of the average annual water shortage index and the average annual water diversion difference were the same despite changes in the average annual power generation (Figure 6). As the average annual power generation increased, the average annual water shortage index and the average annual water diversion difference of the two schemes both increased, and vice versa. Since the average annual power generation is a profit-based indicator; it is better when the value is larger. In contrast, the average annual water shortage index and the water diversion difference are both cost-based indicators; they are better when the values are smaller. Based on these similar changing trends, there was a restriction and competition relationship between power generation target, water supply target, and water diversion target. In other words, there was a contradiction between the source and the receiving reservoir in the scheduling process. The water supply and diversion targets of the receiving reservoir need to be improved at the expense of the power generation benefit of the source reservoir. (2) The non-inferior frontiers of CS1 based on the two-dimensional water diversion scheduling diagram were below the non-inferior frontiers obtained from CS2. Under the same power generation conditions, water shortage index and water diversion difference of CS1 were smaller than the target values of CS2. This result indicated that the optimal target frontier obtained from CS1 was closer to the theoretical optimal frontier of the multi-objective problems. The inter-basin dispatching rules constructed based on the two-dimensional water diversion scheduling diagram can better guide the operation of inter-basin water diversion projects and provide more accurate scheduling information for decision-makers. (3) As the average annual power generation increased, the water shortage index and water diversion difference of CS1 rose rapidly (Figure 6A). When the power generation reached about 370 million Kwh, the water shortage index and water diversion difference of the two schemes were similar. With the increase of power generation, the method of water discharge from STX Reservoir became more unfavorable for the diversion of the main water transfer canal and the water supply of HQ Reservoir. When the power generation target reached the maximum value, the water shortage index and water diversion difference of CS1 and CS2 were the same.
Scheduling Scheme Decision Model Based on Gray Target Model and Prospect Theory
Based on the complexity and uncertainty of reservoir operation, four evaluation indicators for joint operation were selected to construct an evaluation index system for the inter-basin scheduling schemes, namely, power generation difference (f1), water shortage index (f2), water diversion target difference (f3), and abandoned water (f4). The joint operation optimization model was used to calculate the eigenvalues of the four evaluation indicators in the comparison schemes (Pareto non-inferior solution set). The gray target model was then used to calculate the positive and negative value functions in the scenario theory. By establishing an optimization model based on weights and using Lingo to solve the model, the optimal weight vector of f1∼f4 can be obtained as:
Based on the analysis of the optimal weight vector, we found that: 1) The evaluation index with the largest weight ratio was the power generation difference (f1), and the weight ratio of abandoned water (f4) was the smallest. However, the sum of the weights of the water shortage index (f2) and the water diversion target difference (f3) exceeded 50% of the total weight, which was greater than the weight ratio of f1. It can be concluded that the water transfer and water supply targets had the greatest impact on scheduling scheme decisions, which was consistent with the principle that the power regulation subject to water regulation of “Datong-Huangshui” water transfer project.
By substituting the optimal weight vector q∗ into the comprehensive prospect value function of the alternative schemes, the optimal comprehensive prospect value of the schemes was obtained. Then by comparing the comprehensive prospect value of each scheme, the alternative schemes were ranked. The results showed that the alternative scheme numbered 62 (namely, the OPT Scheme in Figure 7) ranked first and was called the optimal (OPT for short) scheduling scheme.
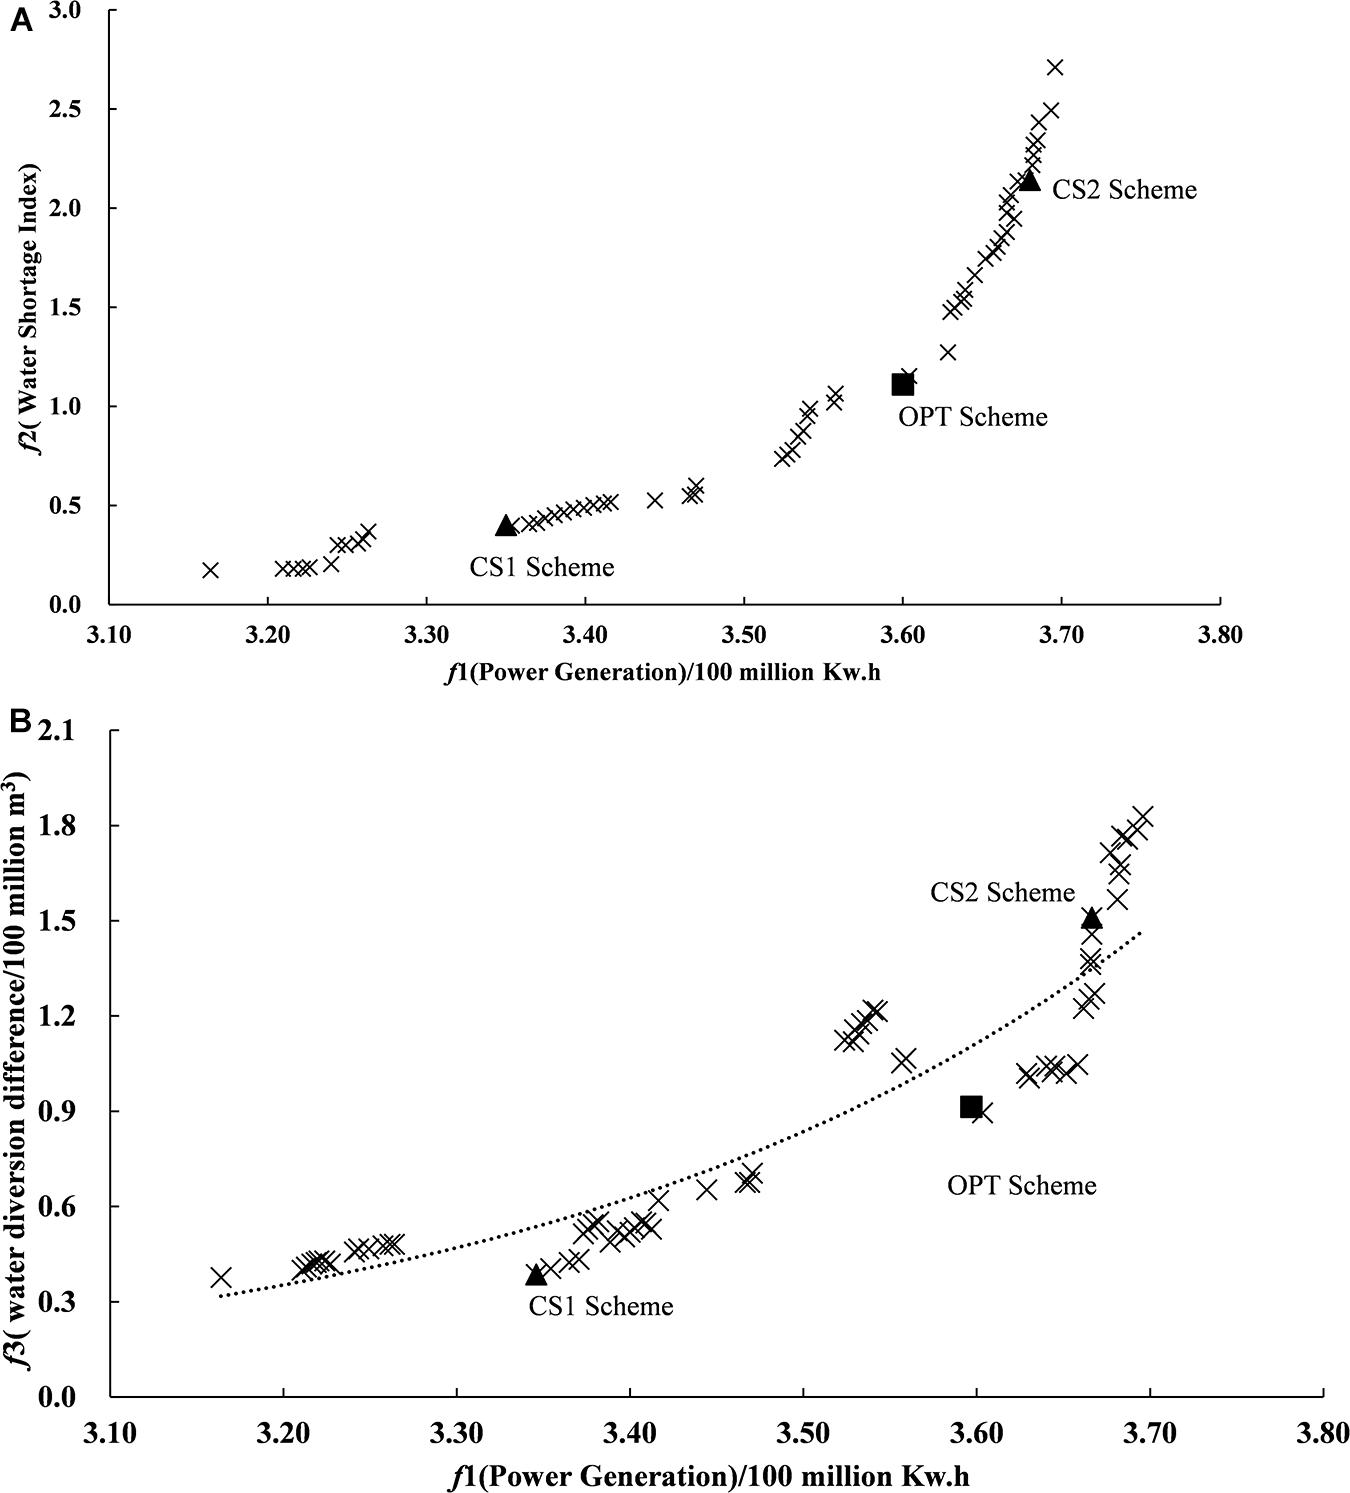
Figure 7. Location of the optimal schemes in the Pareto scheme set. Triangle represents the comparison schemes (CS1 and CS2) and square represents the optimal scheme (OPT). (A) Pareto frontier projection of power generation target and water supply target. (B) Pareto frontier projection of power generation target and water diversion target.
Discussion
Rationale Analysis of Power Generation
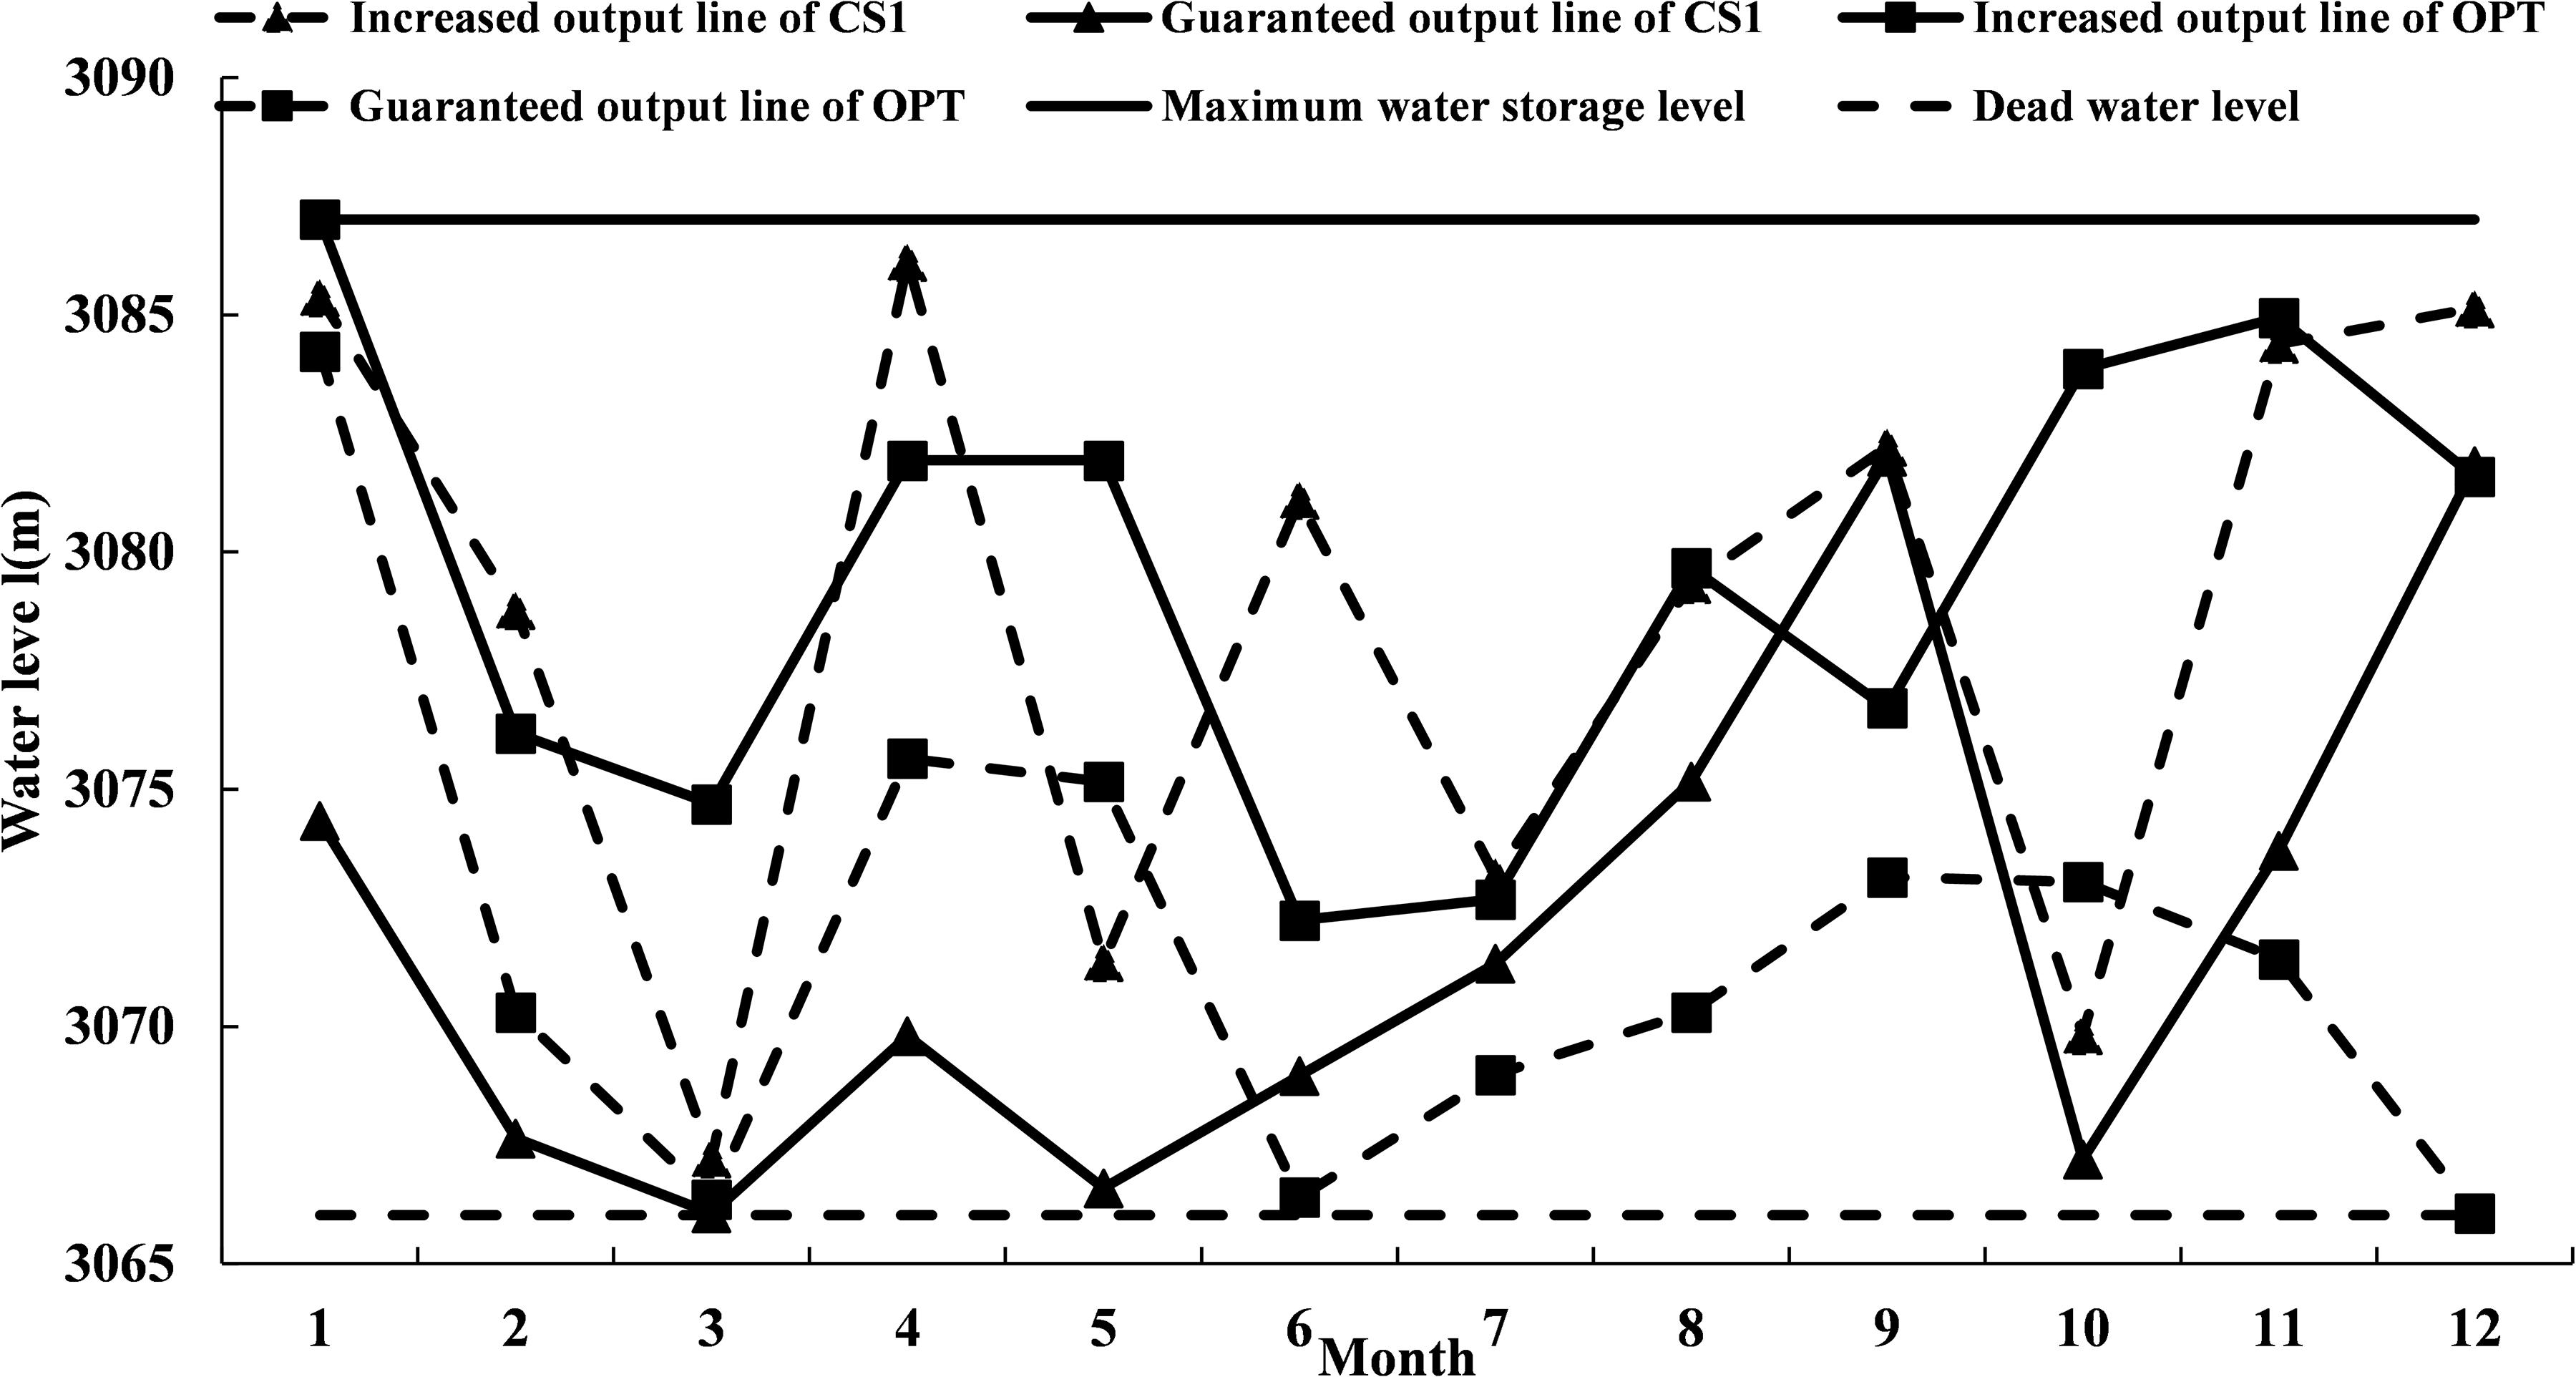
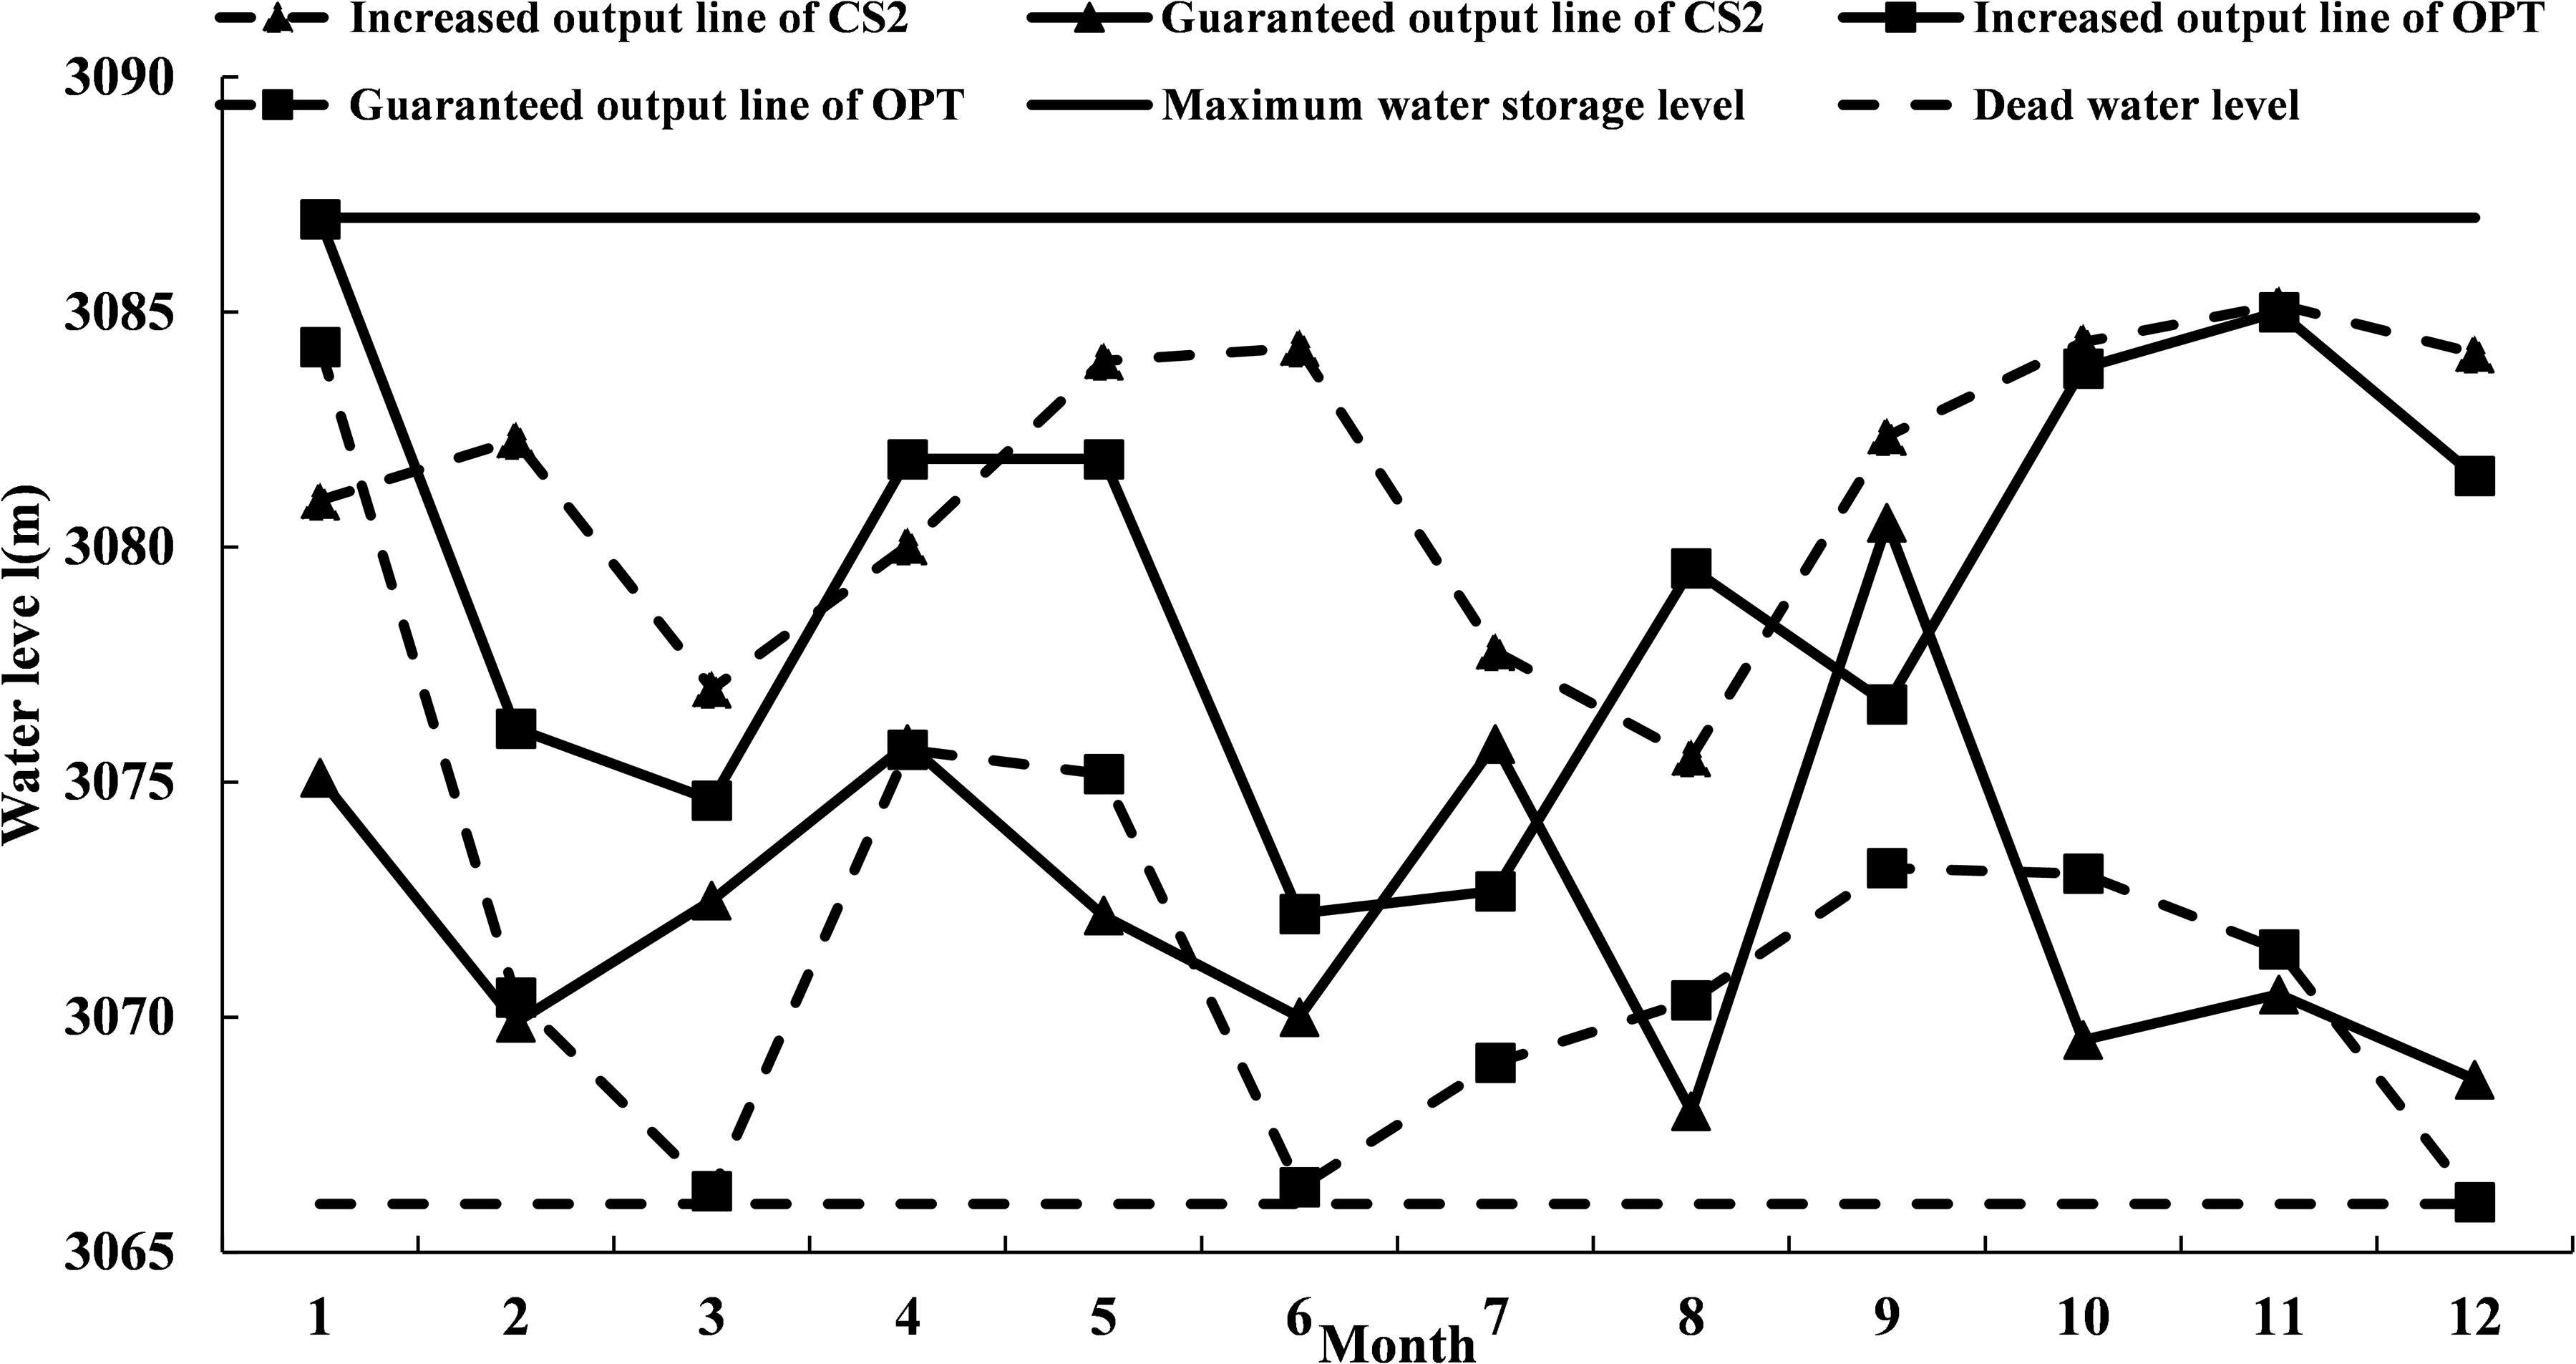
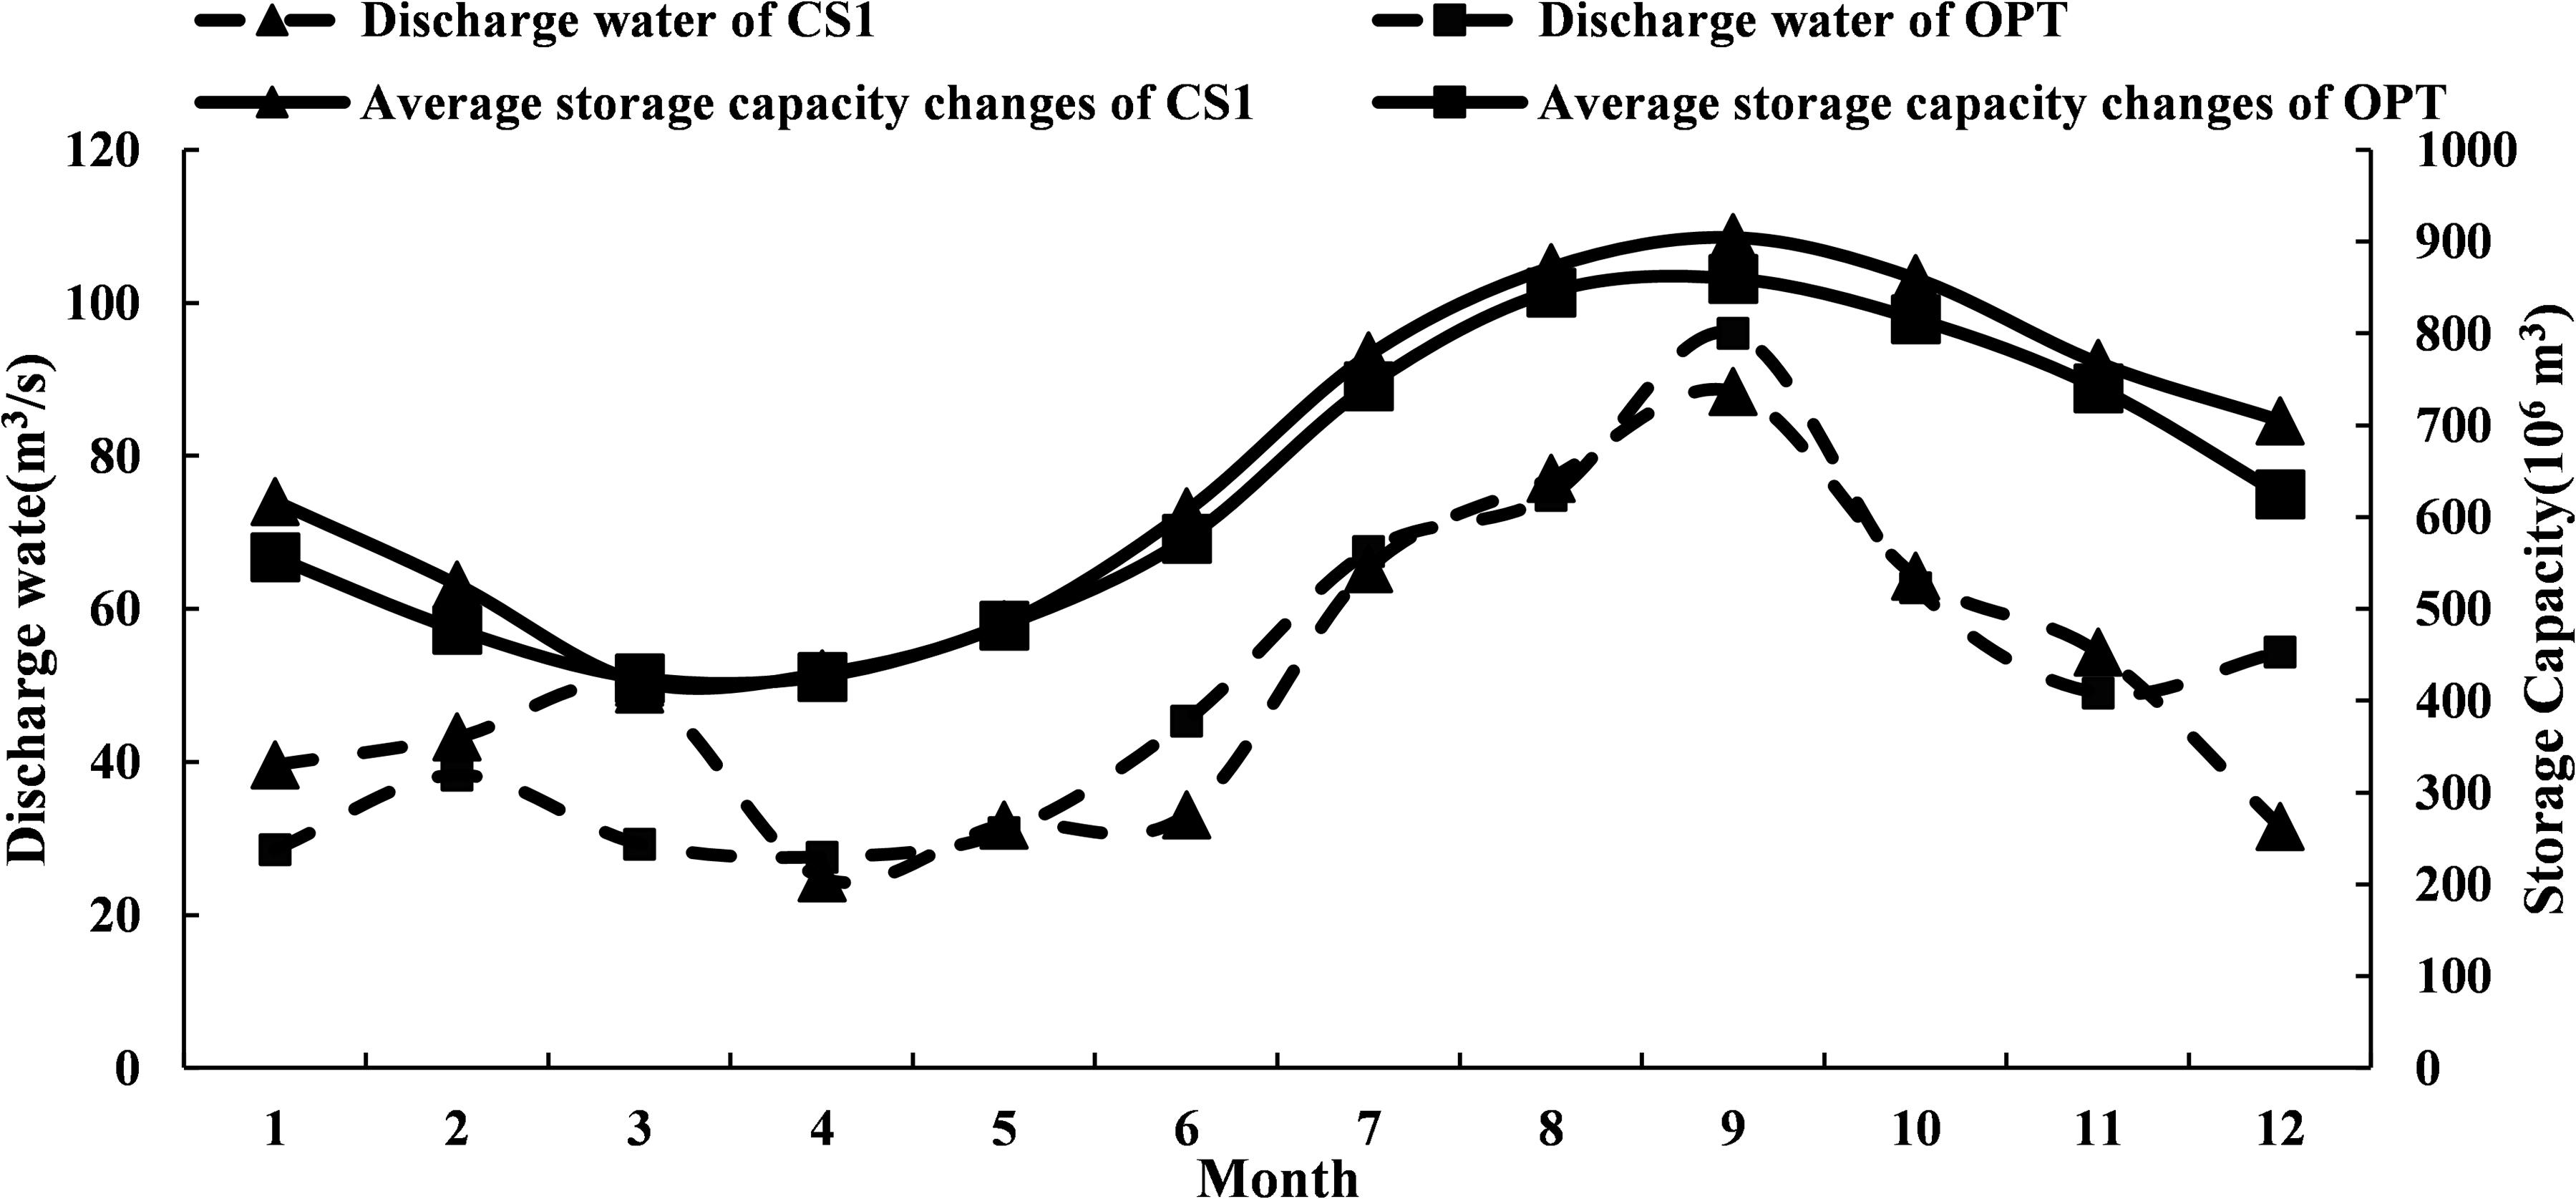
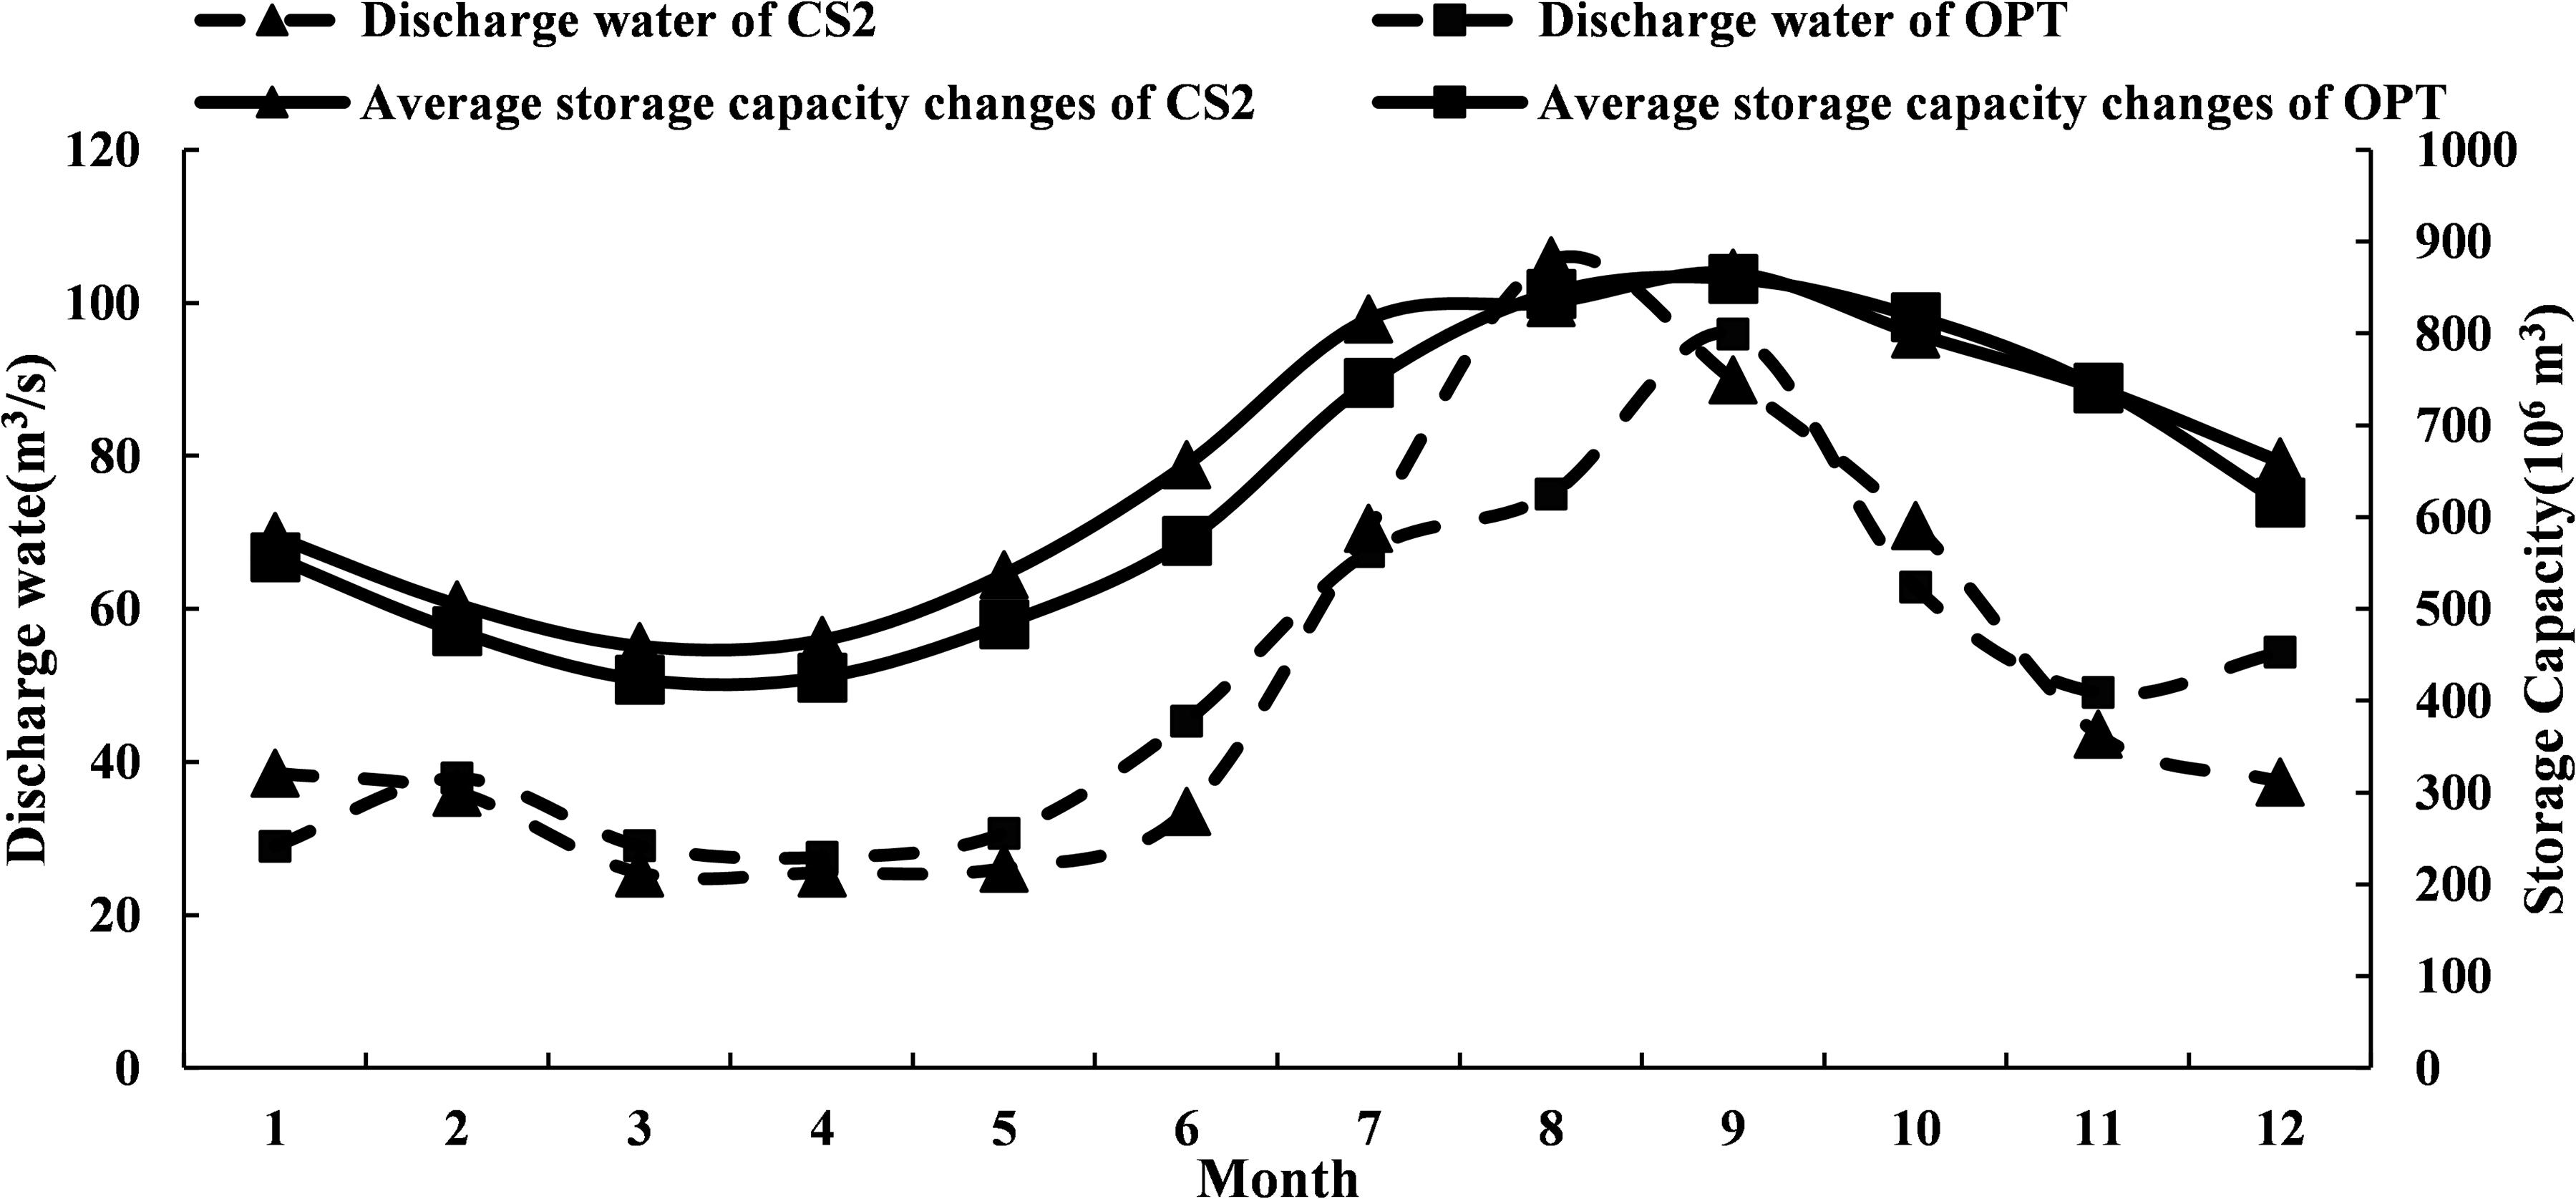
The power generation dispatching rule of the OPT scheme was compared with the two typical feasible solutions (CS1 and CS2) in the Pareto solution set. Figures 8,9 showed that the guaranteed output area of CS2 and its power generation were the largest. On the contrary, the guaranteed output area of CS1 and its power generation were the smallest. These results implied that the size of the guaranteed output area was directly related to power generation. Among the three comparison schemes, the OPT scheme had the most even distribution of guaranteed output areas.
By comparing the CS1 scheme and the OPT scheme, we found that the dispatching rules of CS1were to increase the amount of discharged water to meet the water transfer requirements. The restricted output area from January to May was small. Especially between March and May, the increased output line was greatly reduced to meet the requirements of water transfer (Figure 8). We found that except for April, the amount of discharged water of CS1 was higher than that of the OPT scheme from January to May, resulting in the lowest value of the storage capacity in March (Figure 10). From June to September, due to the increase in reservoir runoff during the flood season and the decrease in water transfer pressure, the restricted output area of CS1 increased. Consequently, there was an increase in the storage capacity, but a decrease in water discharge volume. Due to the large amount of water discharged from January to March, the potential energy during this period was low, making the output of CS1 far less than the OPT scheme.
Based on the comparison between CS2 scheme and OPT scheme, we found that from January to June, the guaranteed output line of CS2 was smaller than the OPT scheme in the increased output area, but greater than the OPT scheme in the restricted output area (Figure 9). As a result, the amount of discharged water of CS2 scheme during this period was continuously smaller than that of the OPT scheme (Figure 11), which was very unfavorable for the diversion of main canal in the downstream.
Rationale Analysis of Water Diversion
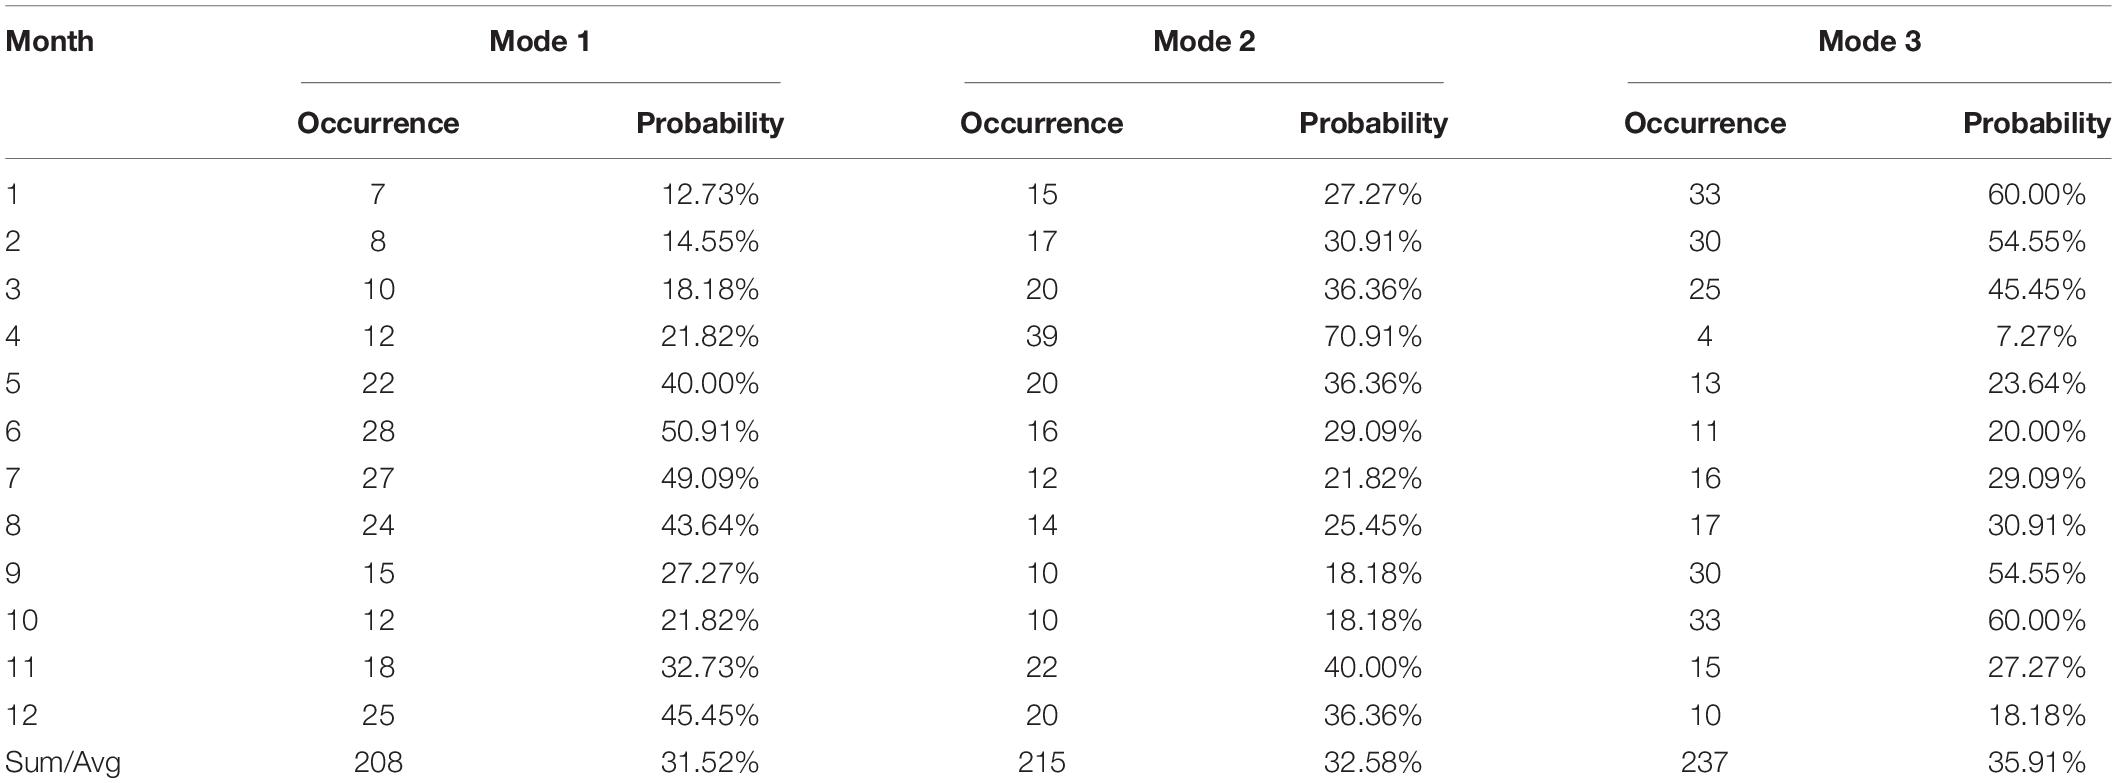
Scheduling schemes could be generated through optimizing dispatching rules to simulate long-time series (1956–2010) of water transfers. Since the inflow runoff was small during the dry season, from November to March of the following year, it had little impact on the decision-making of water supply operation of HQ Reservoir after the increase in water supply targets. As a result, the use of the two-dimensional scheduling diagram to guide the water diversion operation of the reservoir was not required during these months. Instead, we adopted the normal water diversion scheduling diagram method. According to the OPT scheme to simulate water diversion, we counted the number of diversion modes used in different periods (Figure 12), and introduced the probability distribution of water diversion state to illustrate how improved rules could increase diversion efficiency (Table 3). The probability of water diversion state is defined as the ratio of the number of diversion modes to the total number of years.
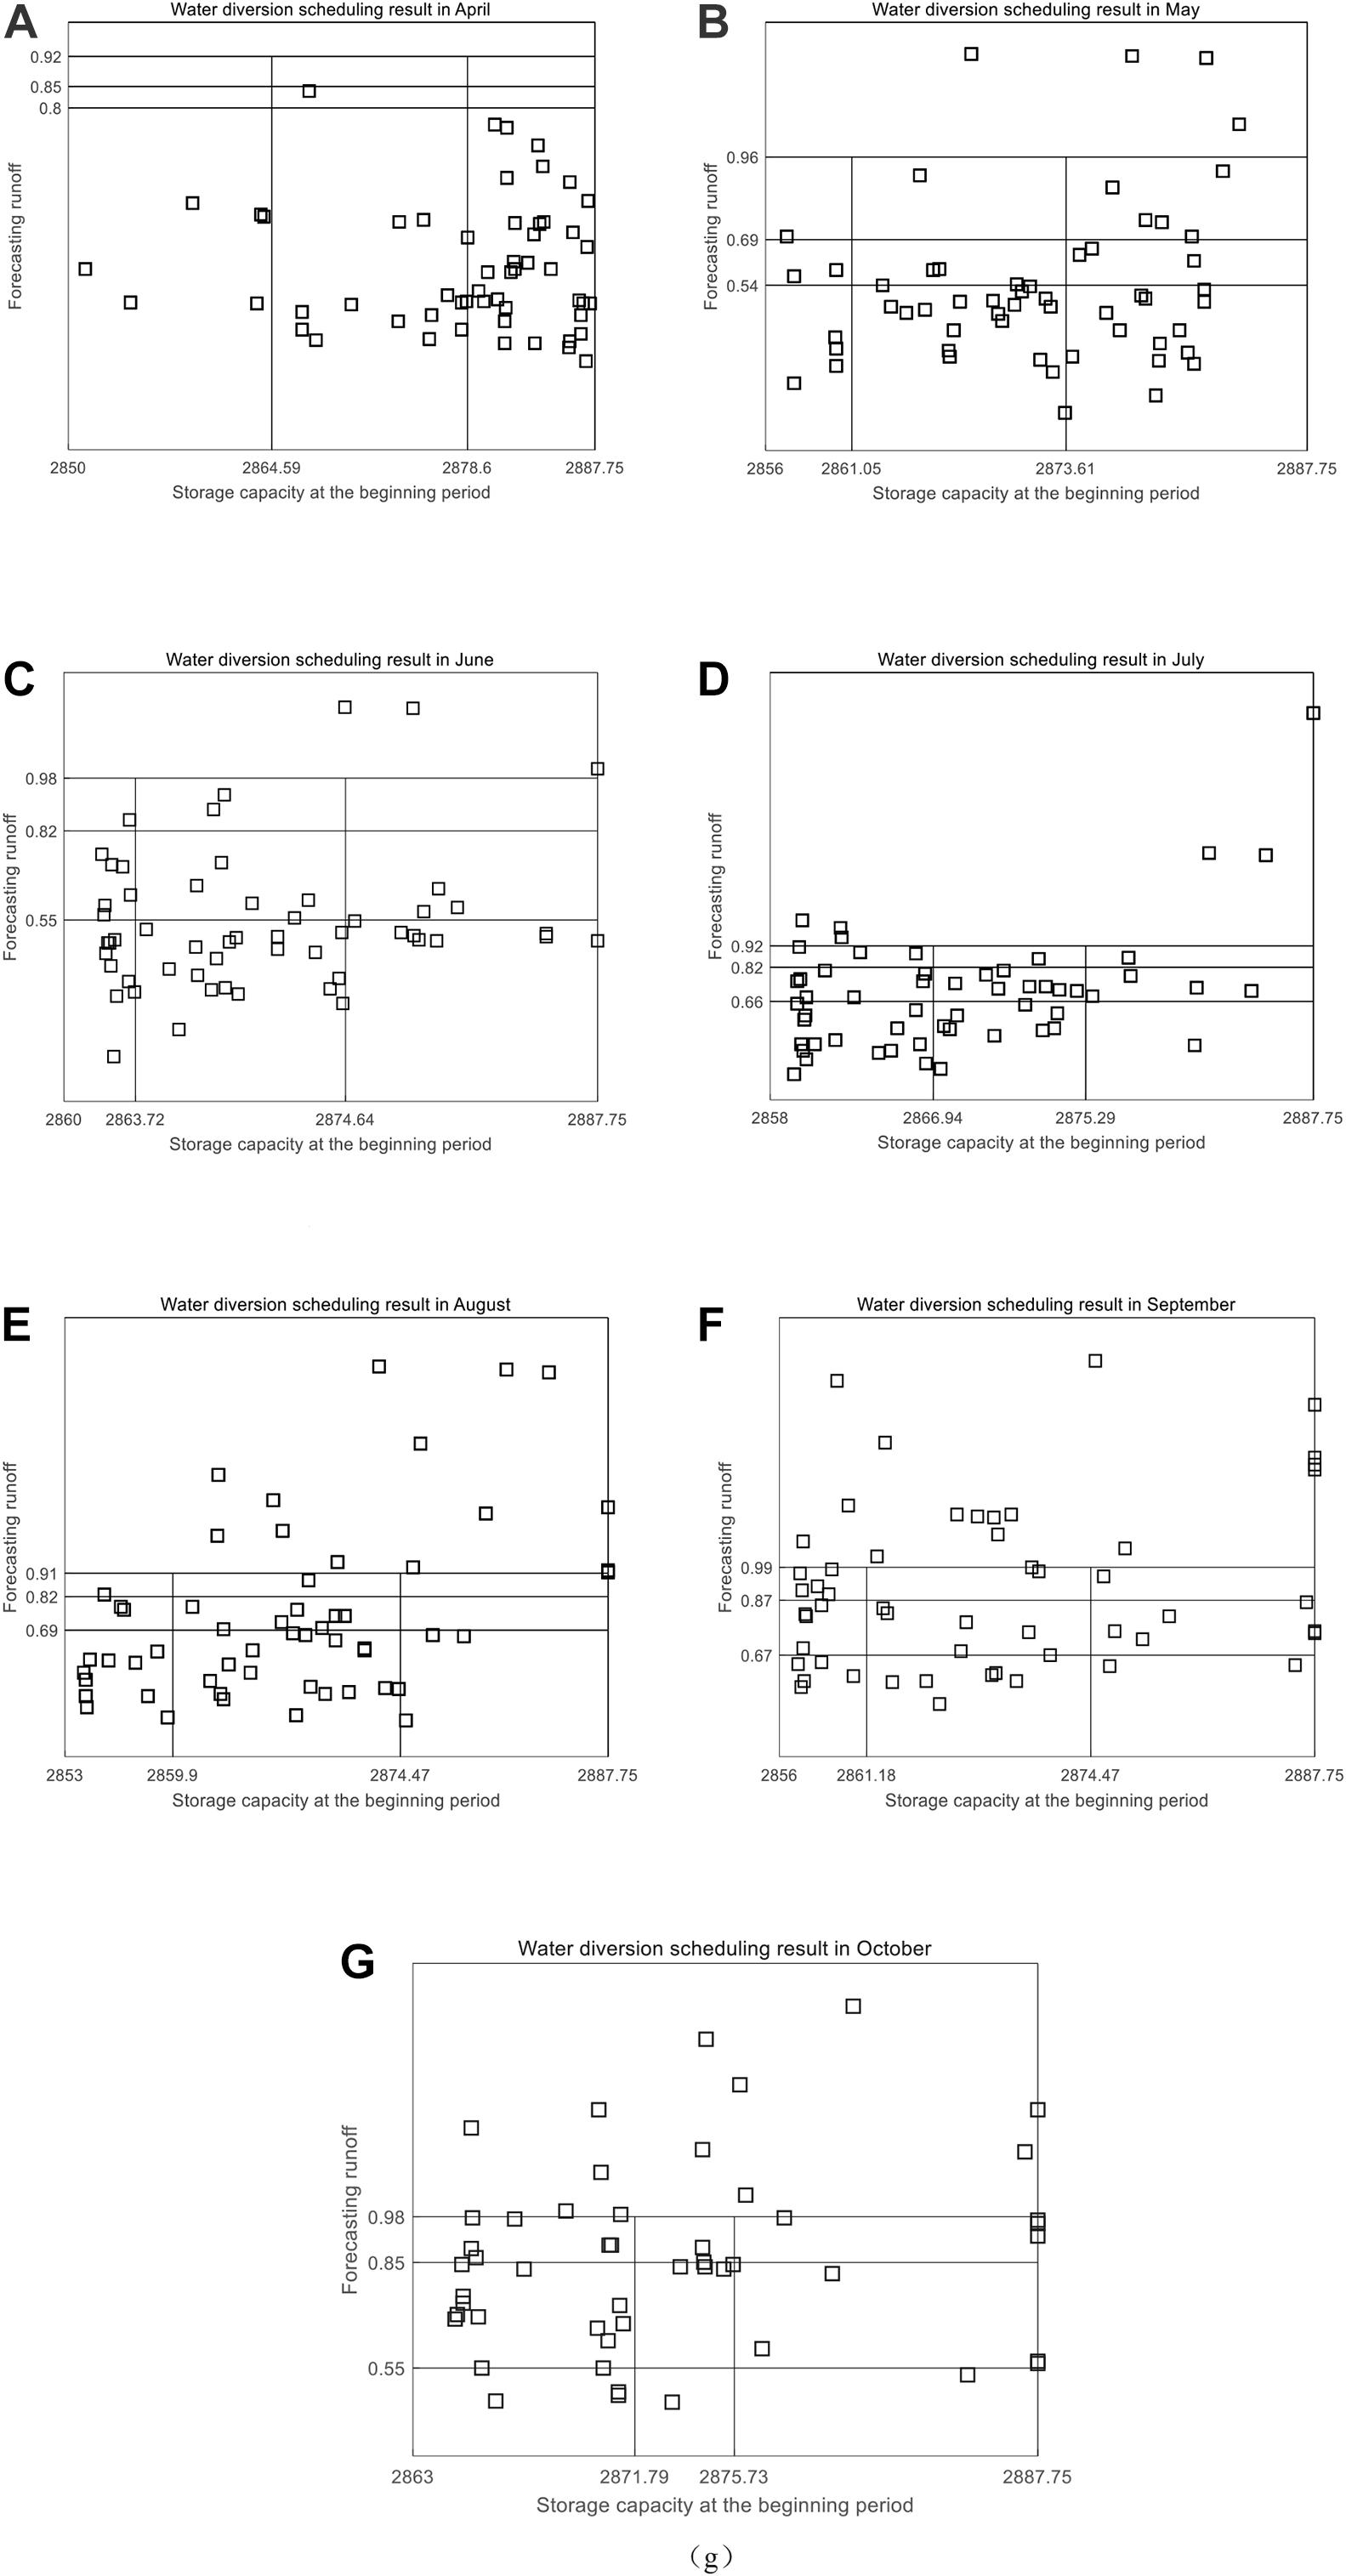
Figure 12. Water diversion scheduling results between April and October. Each square point represents the scheduling status at the beginning of the scheduling period, so that the corresponding mode can be selected. (A–G) Water diversion scheduling results in April, May, June, July, August, September, and October, which have been displayed in the upper part of each sub-figure.
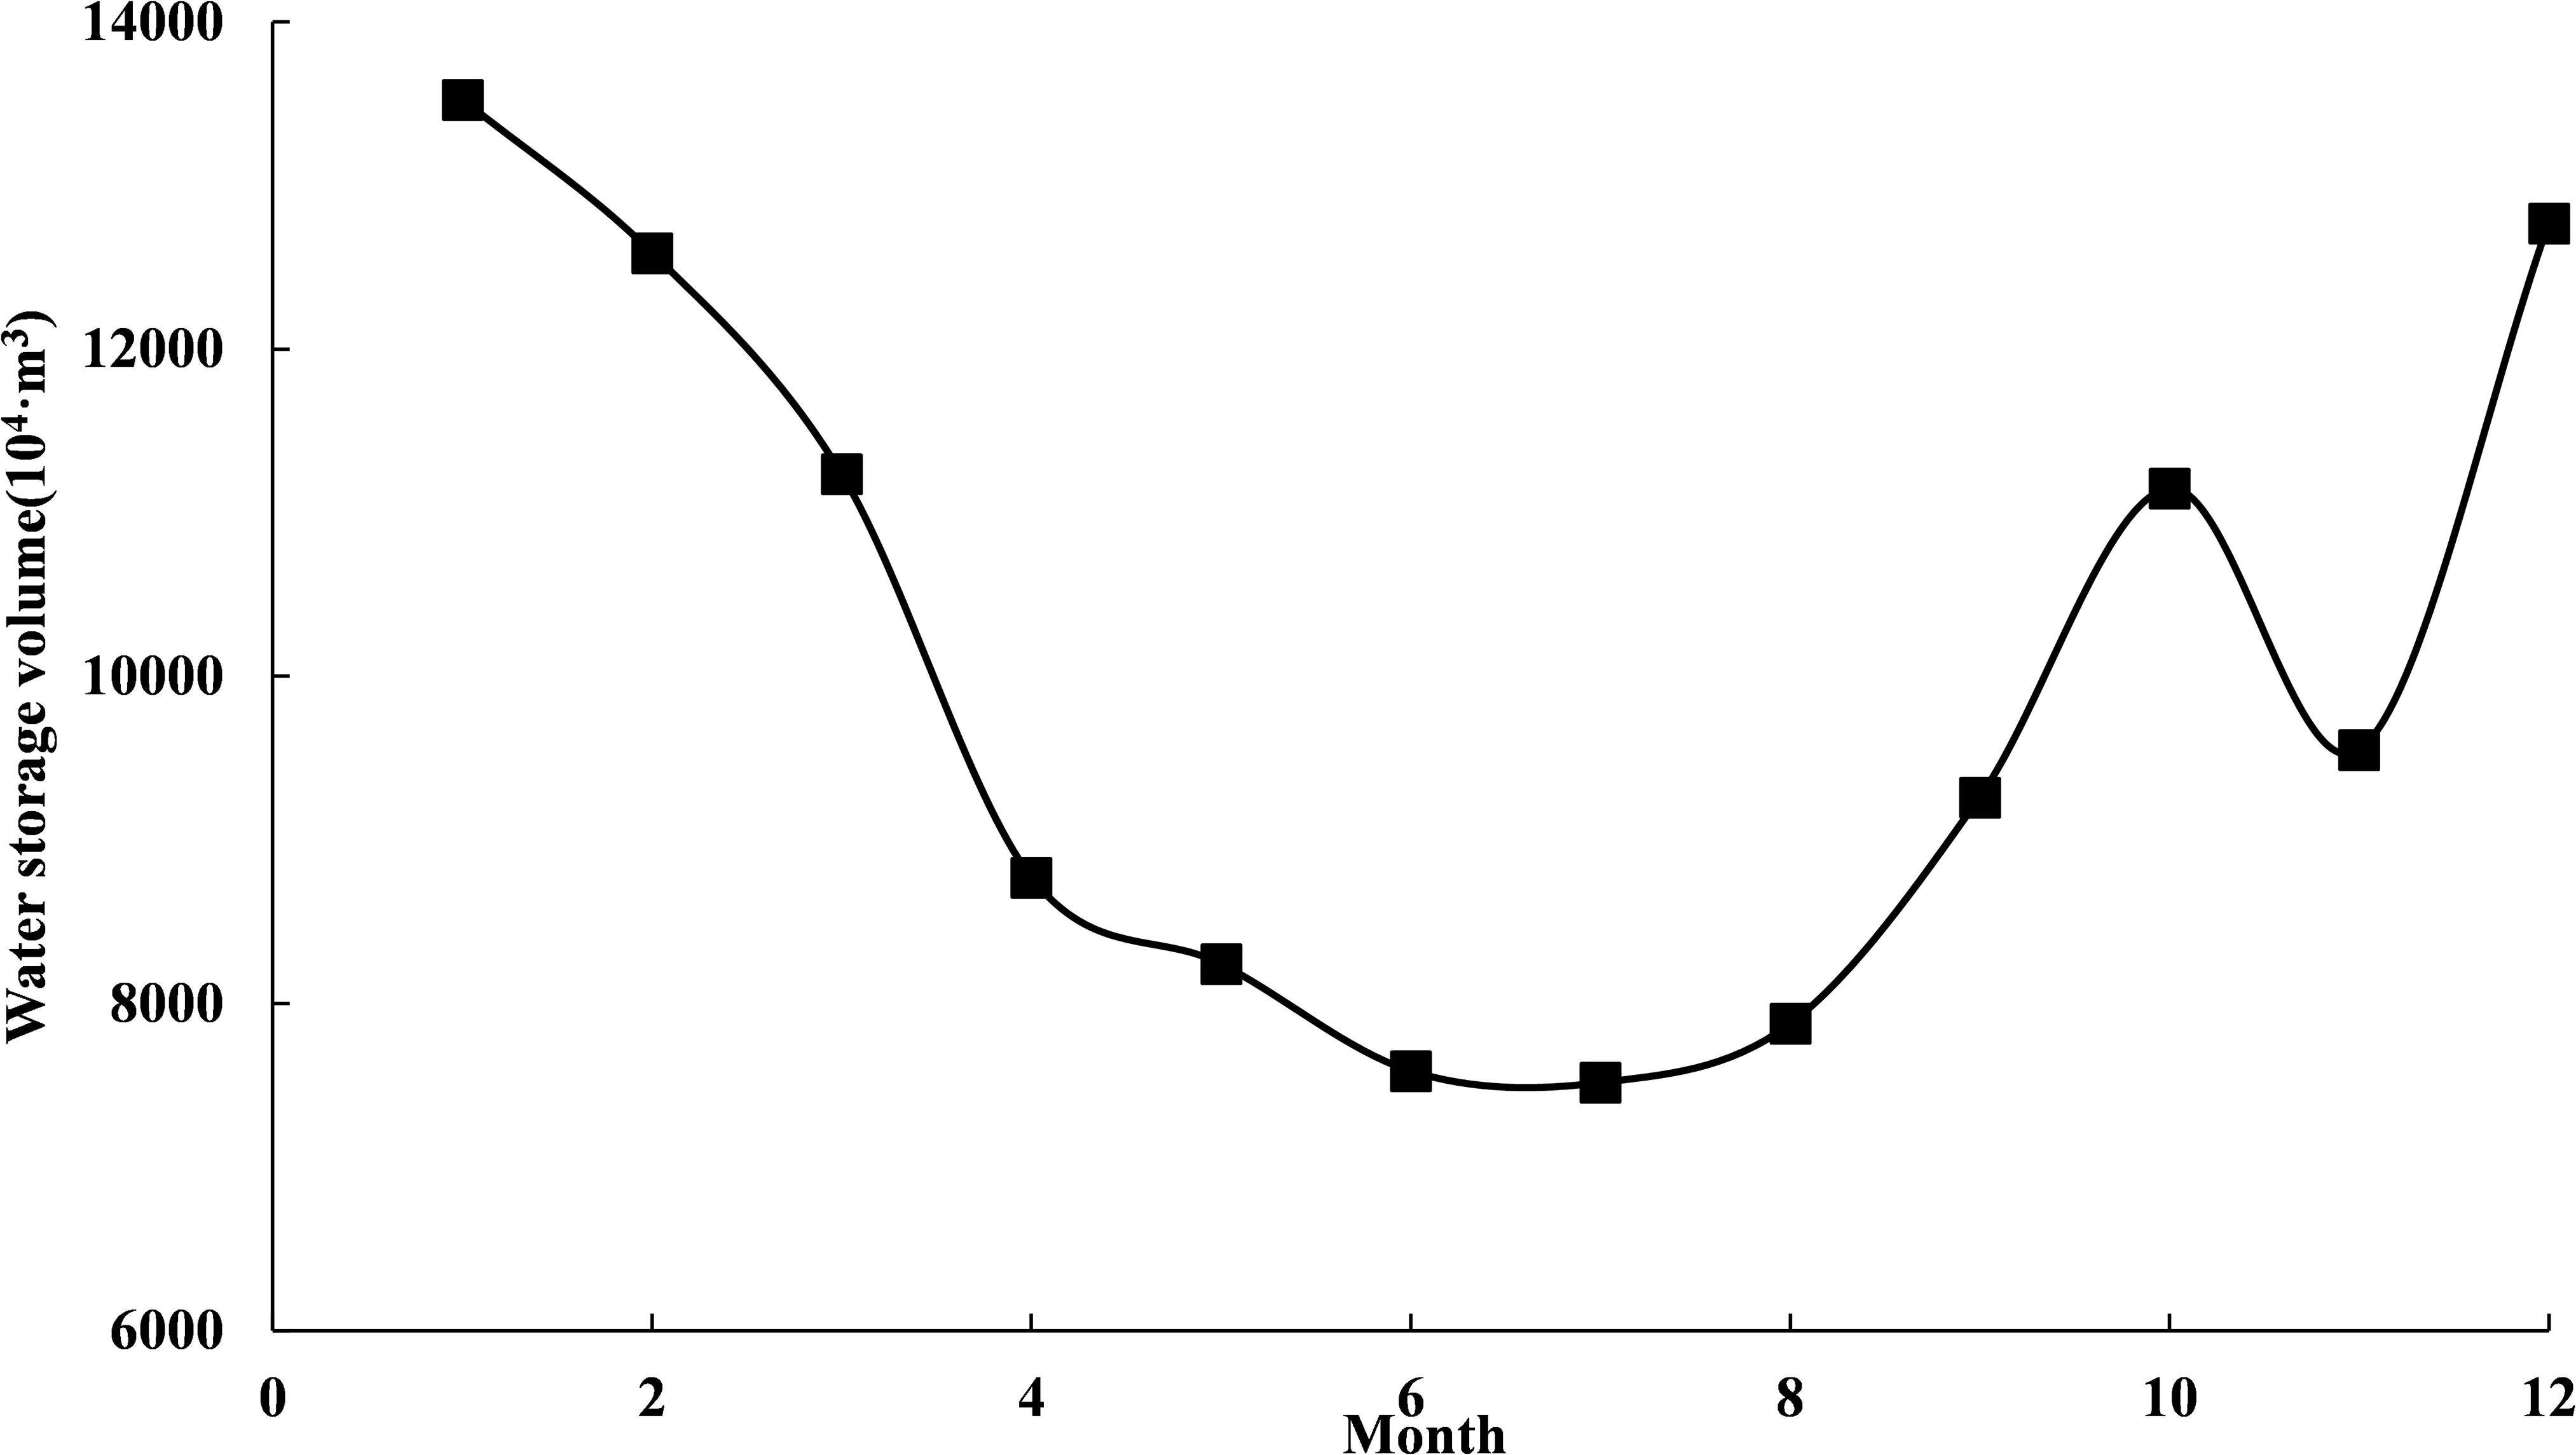
By combining the results of different water diversion scheduling modes with the changes of the monthly average storage volume of HQ Reservoir (Figure 13), we found that:
(1) From January to March, mode 1 showed that each month, the number of time periods for water diversion was less than 30%. Mode 2 showed an increasing trend while mode 3 had a decreasing trend. Because the storage capacity of the reservoir was large while the water demand was small at the beginning of January, the amount of water diversion was reduced to avoid abandoned water. Since the amount of water diversion was less than water supply, the storage capacity continued to decrease during this period. To avoid future reduction in water supply, the proportion of mode 2 gradually increased.
(2) During the flood season from April to September, the inflow runoff gradually increased, but the demand also increased. Because the inflow of the HQ Reservoir was much smaller than water demand, it could not meet the water supply target. Therefore, except for September at the end of the flood season, the proportion of water diversion in other months using mode 3 was within 30%. Especially in the middle of the flood season (June to August), due to the continuous increase in water supply, the storage capacity was continuously reduced. In order to meet the water supply target, the probability of water diversion of mode 1 should be maintained at more than 50% during this period.
(3) Due to the decrease of water demand from October to December, the probability of water diversion of mode 1 was lower than that of the flood season. However, the sum of the water diversion probability of mode 1 and model 2 was still relatively large to meet the demand at the end of the dry season (January to March). Especially in December, in order to supplement water loss caused by winter irrigation, the sum of the water diversion probability of mode 1 and mode 2 reached 91.01%.
Rationale Analysis of Water Supply
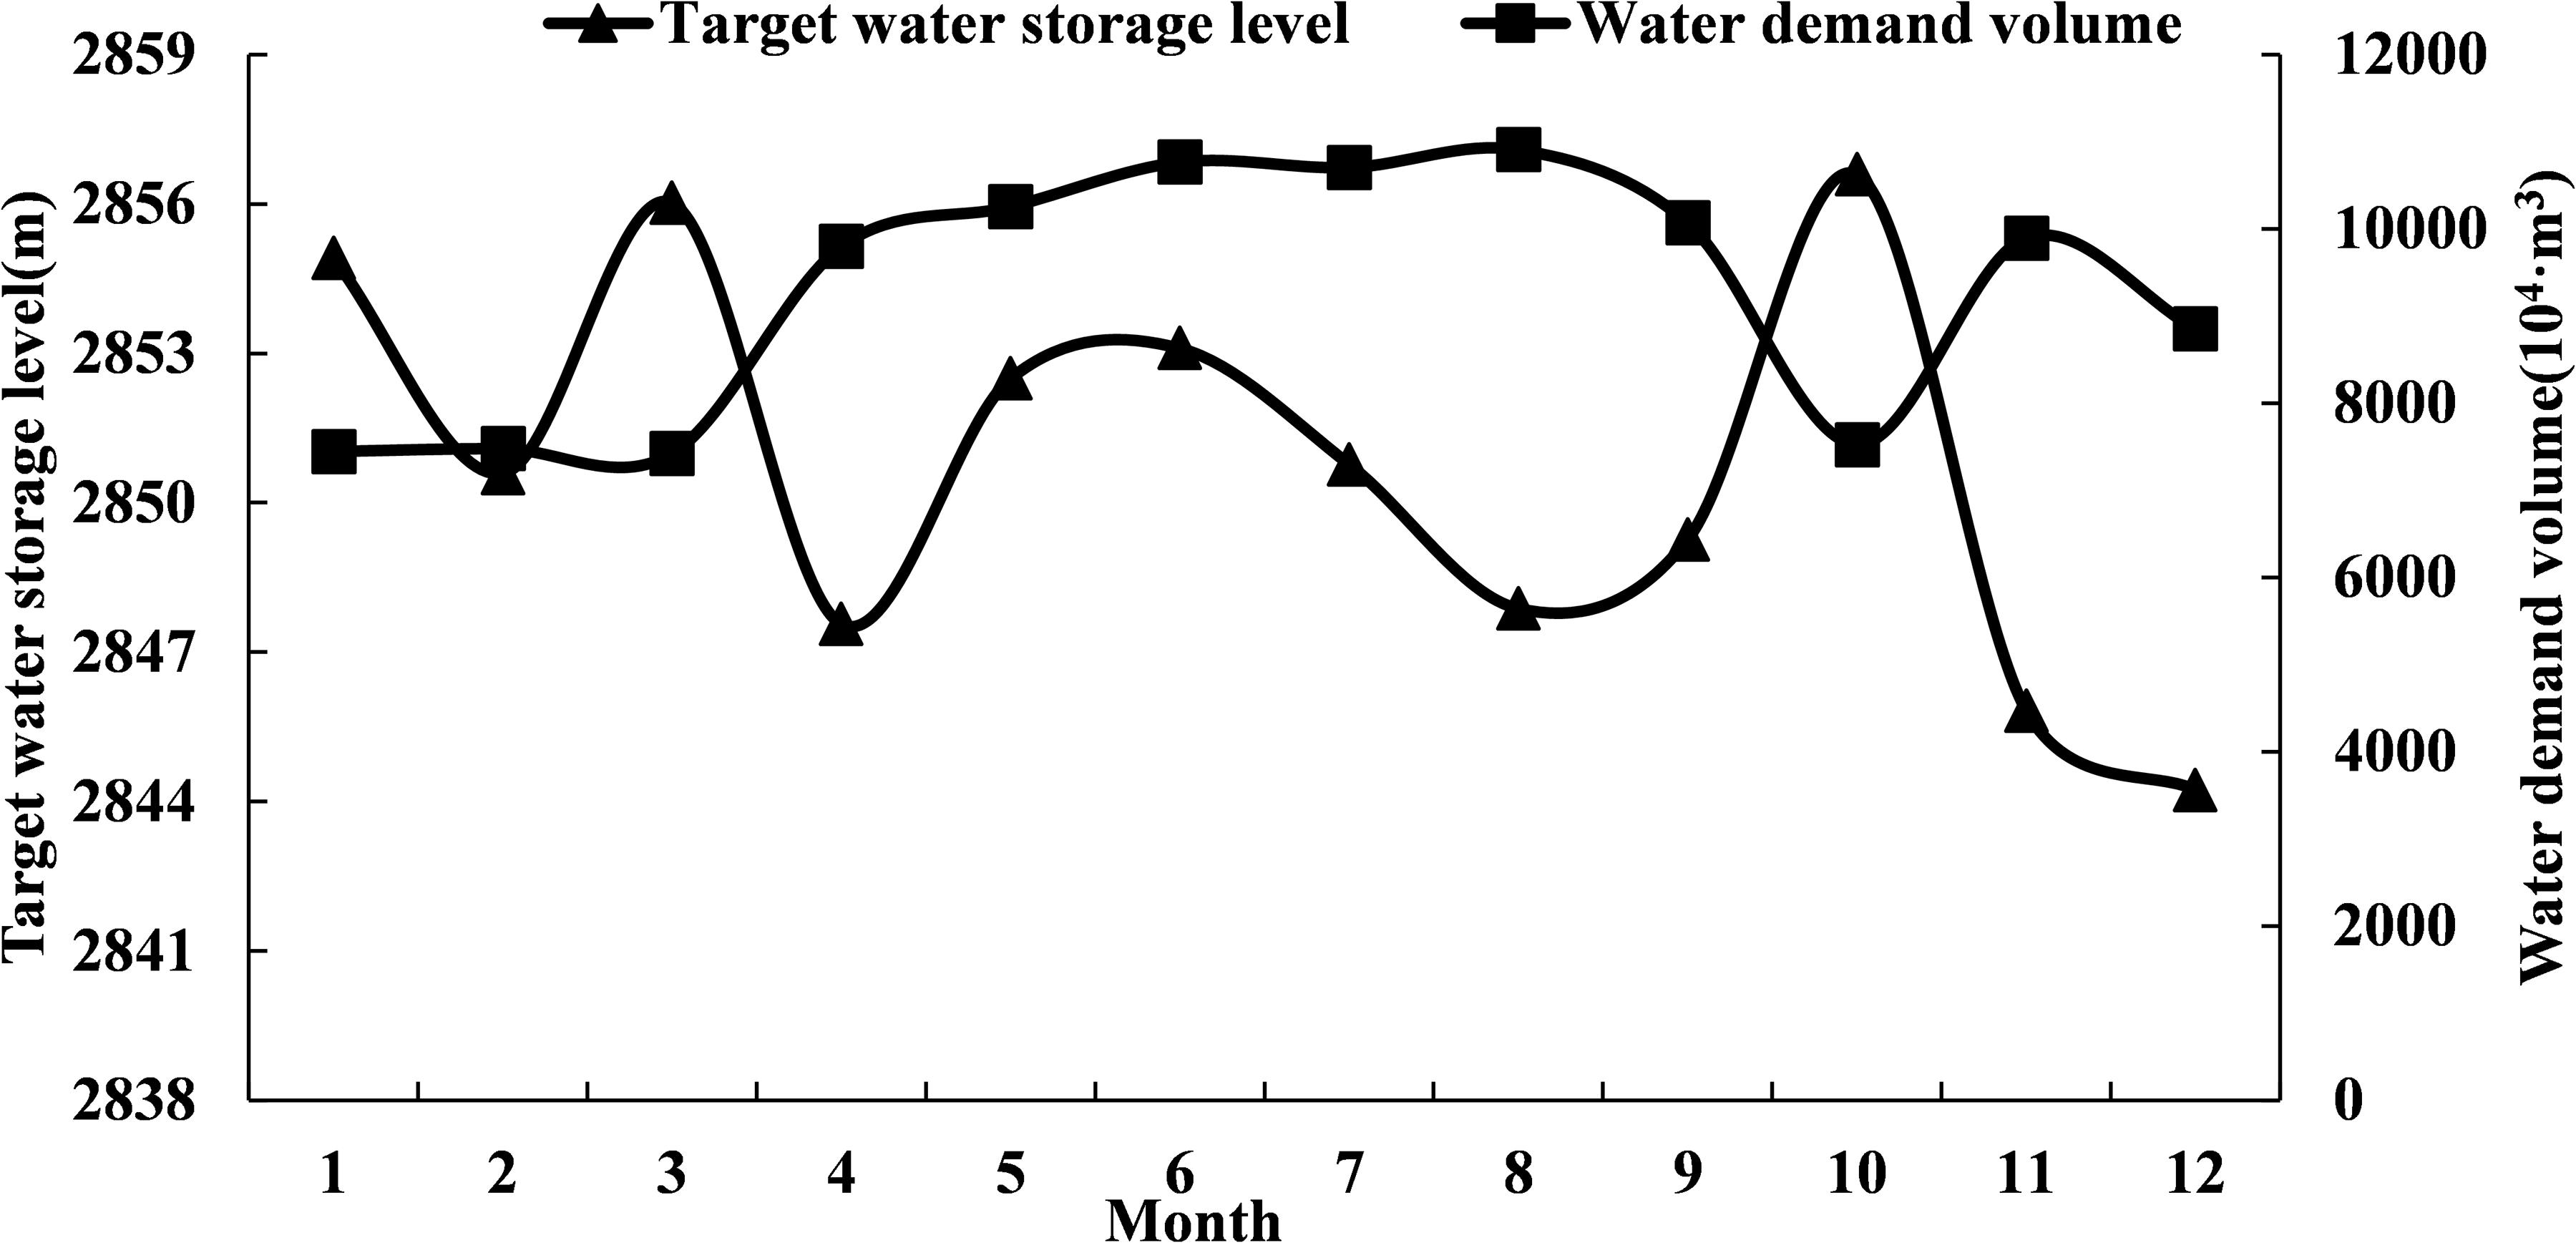
The water supply rules used the hedging rules for water supply constructed in Chapter “Water Supply Operation Model Based on Hedging Rules for Water Supply.”. The target storage level and water supply weight coefficient were used as decision-making variables to determine the hedging rules for water supply of HQ Reservoir. Figure 14 shows that the target storage level in the hedging rules for water supply had the following two characteristics:
(1) The water demand of Heiquan Reservoir was relatively large, accounted for 45.6%∼80.0% of the active storage capacity in each month. The total annual water transfer was much larger than the reservoir storage capacity. Therefore, the water storage benefit of HQ Reservoir was small and it had a relatively low storage level target in the joint dispatching rules. This can trigger the stop condition of hedging rules for water supply as early as possible, and narrow the restricted water supply area, which is beneficial for water supply.
(2) The trend of the target water storage level was opposite to that of the water demand volume. During the months when water demand was large, the target storage level was low, and vice versa. The requirements for water supply and water storage in different months can be satisfied when the restricted water supply area was narrowed through reducing the target water storage level as much as possible during the water supply process.
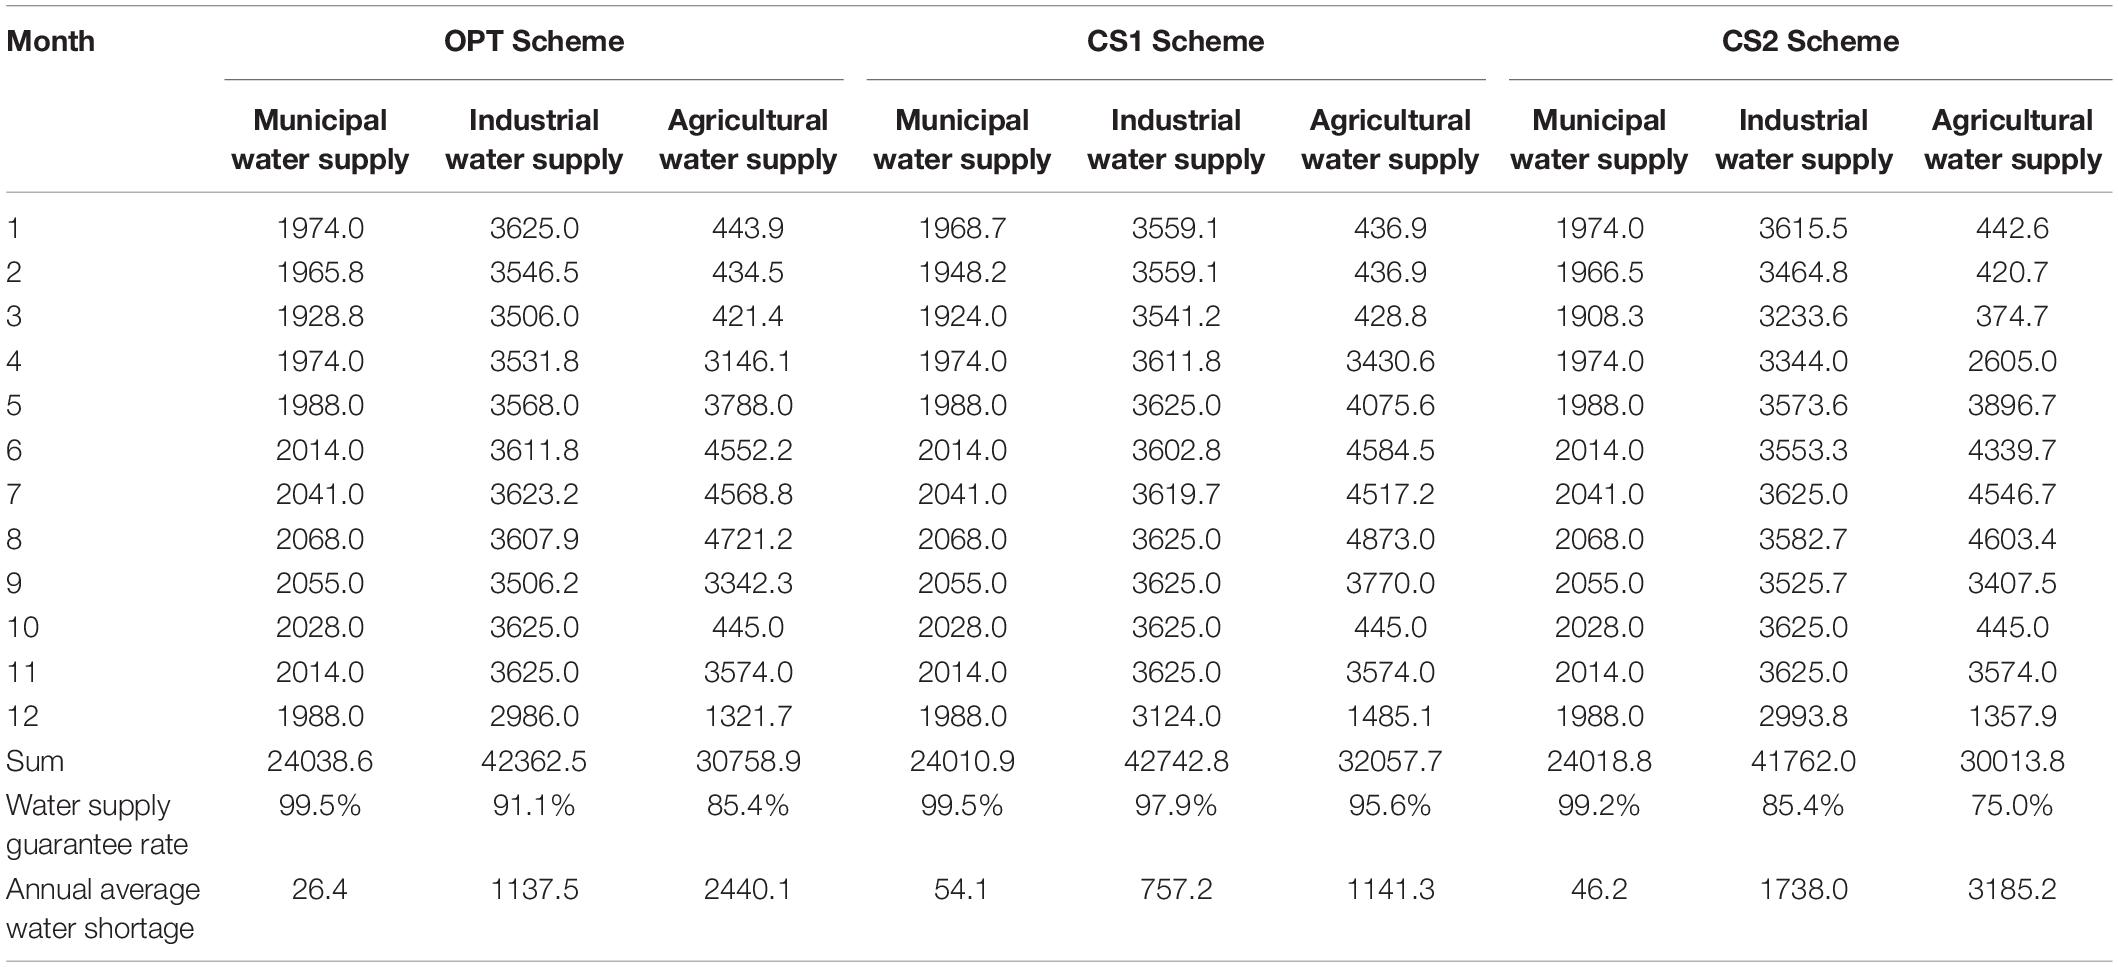
According to the dispatching rules of the selected OPT scheme and the two comparison schemes (CS1 and CS2), the simulated water supply results showed that for both OPT and CS1 scheme, water supply guarantee rates were: 1) more than 90% for municipal and industrial water and 2) more than 85% for agriculture. In contrast, the agricultural water supply guarantee rate of CS2 was only 75% (Table 4). In the OPT scheme, the annual available water supplies for industry and agriculture accounted for 97.4% and 92.7% of the annual water demand, respectively, while in the CS1 scheme, they were 98.2% and 96.6%, respectively. The difference between the two schemes were only 0.8% and 3.9%.
Conclusion
In the previous study, only the current storage volume of the receiving reservoir was used as the basis for decision-making of starting water transfer process. Due to the lack of inflow runoff information, the receiving reservoir is prone to water supply destruction at high water levels and abandoned water at low water levels. Through extracting dispatching rules based on the two-dimensional scheduling diagram, this paper used the current storage state and inflow runoff of the receiving reservoir as the basis for decision-making during the scheduling period, which effectively solved the problems existing in the starting rules of regular water transfer. Aimed at the multi-objective joint optimization scheduling problem of “Datong-Huangshui” water transfer project, we concluded that:
(1) The non-inferior frontiers of the two scheduling targets obtained by the OPT scheme were below the non-inferior frontiers obtained from the CS1 and CS2 schemes. The optimal target frontier obtained by the optimized scheme was closer to the theoretical optimal frontier of the multi-objective problem. Therefore, the two-dimensional scheduling diagram can better guide the water diversion operation of inter-basin water transfer projects.
(2) Based on the multi-objective optimal operation schemes set, the OPT scheme obtained by the scheduling scheme decision model using gray target model and prospect theory could generate power by as much as 359 million Kwh. It was also able to guarantee 90% of municipal and industrial water supply, as well as 85% of agricultural water supply. This model could better meet the real scheduling requirements.
Data Availability Statement
The original contributions presented in the study are included in the article/supplementary material, further inquiries can be directed to the corresponding author/s.
Author Contributions
SC and LS did the conceptualization. SC and QL did the methodology. SC Wrote-original draft preparation. SC and YJ Wrote-review and edited. HW Guided. All authors read and approved the final manuscript.
Funding
This work was funded by the National Key Research and Development Program of China (2018YFE0196000) and the National Key Research and Development Program of China (2018YFC0407701).
Conflict of Interest
The authors declare that the research was conducted in the absence of any commercial or financial relationships that could be construed as a potential conflict of interest.
Acknowledgments
We are very grateful to the editors and reviewers for their critical comments and thoughtful suggestions.
References
Bonacci, O., and Andric, I. (2010). Impact of an inter-basin water transfer and reservoir operation on a karst open streamflow hydrological regime an example from the Dinaric karst (Croatia). Water Resourc. Manag. 24, 3852–3863. doi: 10.1002/hyp.7817
Chang, F. J., Lai, J. S., and Kao, L. S. (2003). Optimization of operation rule curves and flushing schedule in a reservoir. Hydrol. Process. 17, 1623–1640. doi: 10.1002/hyp.1204
Chang, L. C., and Chang, F. J. (2009). Multi-objective evolutionary algorithm for operating parallel reservoir system. J. Hydrol. 377, 12–20. doi: 10.1016/j.jhydrol.2009.07.061
Chang, L. C., Chang, F. J., Wang, K. W., and Dai, S. Y. (2010). Constrained genetic algorithms for optimizing multi-use reservoir operation. J. Hydrol. 390, 66–74. doi: 10.1016/j.jhydrol.2010.06.031
Guo, X., Hu, T., Huang, B., and Han, Y. (2011). Joint operation rules for multi-reservoir water supply system based on the model of simulation and optimization. J. Hydraulic Eng. 42, 705–712.
Hall, W. A., Tauxe, G. W., and Yeh, W. W.-G. (1969). An alternative procedure for the optimization of operations for planning with multiple river, multiple purpose systems. Water Resourc. Res. 5, 1367–1372. doi: 10.1029/wr005i006p01367
Heidari, M., Chow, V. T., Kokotovic, P. V., and Meredith, D. D. (1971). Discrete differential dynamic programming approach to water resources system optimization. Water Resourc. Res. 7, 273–283. doi: 10.1029/wr007i002p00273
Hormwichian, R., Kangrang, A., and Lamom, A. (2009). A conditional genetic algorithm model for searching optimal reservoir rule curves. J. Appl. Sci. 9, 3575–3580. doi: 10.3923/jas.2009.3575.3580
Hsu, N. S., and Cheng, K. W. (2002). Network flow optimization model for basin-scale water supply planning. J. Water Resourc. Plan. Manag. 128, 102–112. doi: 10.1061/(asce)0733-9496(2002)128:2(102)
Jafarzadegan, K., Abedelmdoust, A., and Kerachian, R. (2014). A stochastic model for optimal operation of inter-basin water allocation systems: a case study. Stochast. Environ. Res. Risk Assess. 28, 1343–1358. doi: 10.1007/s00477-013-0841-8
Ji, Y., Lei, X., Cai, S., and Wang, X. (2016). Hedging rules for water supply reservoir based on the model of simulation and optimization. Water 8:249. doi: 10.3390/w8060249
Kangrang, A., Compliew, S., and Chaiyapoom, W. (2009). Heuristic Algorithm with simulation model for searching optimal reservoir rule curves. Am. J. Appl. Sci. 6, 263–267. doi: 10.3844/ajassp.2009.263.267
Li, Y., Zhang, C., Chu, J., Cai, X., and Zhou, H. (2015). Reservoir operation with combined natural inflow and controlled inflow through interbasin transfer: biliu Reservoir. J. Water Resourc. Plan. Manag. 142:5015009.
Liu, D., Huang, Q., Yang, Y., Liu, D., and Wei, X. (2020). Bi-objective algorithm based on NSGA-II framework to optimize reservoirs operation. J. Hydrol. 585:124830. doi: 10.1016/j.jhydrol.2020.124830
Lund, J., and Ferreira, I. (1996). Operating rule optimization for missouri river reservoir system. J. Water Resourc. Plan. Manag. 122, 287–295. doi: 10.1061/(asce)0733-9496(1996)122:4(287)
Luo, Y., Deng, J., Zhen, J., and Fan, H. (2001). Grey target method on the pipe corrosion analysis. J. Chin. Soc. Corros. Protect. 53, 56–60.
Neelakantan, T. R., and Pundarikanthan, N. V. (2000). Neural network based simulation-optimization model for reservoir operation. J. Water Resourc. Plan. Manag. 126, 57–64. doi: 10.1061/(asce)0733-9496(2000)126:2(57)
Rani, D., and Moreira, M. M. (2010). Simulation optimization modeling: a survey and potential application in reservoir systems operation. Water Resourc. Manag. 24, 1107–1138. doi: 10.1007/s11269-009-9488-0
Reis, L. F. R., Bessler, F. T., Walters, G. A., and Savic, D. (2006). Water supply reservoir operation by combined genetic algorithm – linear programming (GA-LP) approach. Water Resourc. Manag. 20, 227–255. doi: 10.1007/s11269-006-8049-z
Sadegh, M., Mahjouri, N., and Kerachian, R. (2010). Optimal inter-basin water allocation using crisp and fuzzy shapley games. Water Resourc. Manag. 24, 2291–2310. doi: 10.1007/s11269-009-9552-9
Suiadee, W., and Tingsanchali, T. (2007). A combined simulation genetic algorithm optimization model for optimal rule curves of a reservoir a case study of the Nam Oon Irrigation Project, Thailand. Hydrol. Process. 21, 3211–3225. doi: 10.1002/hyp.6528
Sulis, A. (2009). GRID computing approach for multi reservoir operating rules with uncertainty. Environ. Model. Softw. 24, 859–864. doi: 10.1016/j.envsoft.2008.11.003
Tung, C. P., Hsu, S. Y., Liu, C. M., and Li, J. S. (2003). Application of the genetic algorithm for optimizing operation rules of the Liyutan Reservoir in Taiwan. J. Am. Water Resourc. Assoc. 39, 649–657. doi: 10.1111/j.1752-1688.2003.tb03682.x
Tversky, A., and Kahneman, D. (1992). Advances in prospect theory: cumulative representation of uncertainty. J. Risk Uncertain. 5, 297–323. doi: 10.1007/bf00122574
Wurbs, R. A. (1993). Reservoir-system simulation and optimization models. J. Water Resourc. Plan. Manag. 119, 455–472. doi: 10.1061/(asce)0733-9496(1993)119:4(455)
Yeh, W. W.-G. (1985). Reservoir management and operations models: a state-of-the-art review. Water Resoure. Res. 21, 1797–1818. doi: 10.1029/wr021i012p01797
Yu, Y., Zhao, W., Martinez-Murillo, J., and Pereira, P. (2020). Loess Plateau: from degradation to restoration. Sci. Total Environ. 738:140206. doi: 10.1016/j.scitotenv.2020.140206
Keywords: inter-basin water transfer, two-dimensional scheduling diagram, hedging rules for water supply, NSGA- II, scheme optimization
Citation: Cai S, Sun L, Liu Q, Ji Y and Wang H (2021) Research on the Dispatching Rules of Inter-Basin Water Transfer Projects Based on the Two-Dimensional Scheduling Diagram. Front. Earth Sci. 9:664201. doi: 10.3389/feart.2021.664201
Received: 04 February 2021; Accepted: 07 April 2021;
Published: 10 May 2021.
Edited by:
Yang Yu, Beijing Forestry University, ChinaReviewed by:
Haibo Ma, China Three Gorges University, ChinaJun Niu, China Agricultural University, China
Peng Shi, Xi’an University of Technology, China
Copyright © 2021 Cai, Sun, Liu, Ji and Wang. This is an open-access article distributed under the terms of the Creative Commons Attribution License (CC BY). The use, distribution or reproduction in other forums is permitted, provided the original author(s) and the copyright owner(s) are credited and that the original publication in this journal is cited, in accordance with accepted academic practice. No use, distribution or reproduction is permitted which does not comply with these terms.
*Correspondence: Qingtao Liu, bGl1cXRtd3JAMTYzLmNvbQ==
 Siyu Cai
 Long Sun2