 Lianhua Hou
 Xia Luo1
95% of researchers rate our articles as excellent or good
Learn more about the work of our research integrity team to safeguard the quality of each article we publish.
Find out more
ORIGINAL RESEARCH article
Front. Earth Sci. , 16 April 2021
Sec. Economic Geology
Volume 9 - 2021 | https://doi.org/10.3389/feart.2021.662586
This article is part of the Research Topic Advances in Geology of Unconventional Hydrocarbon Resources View all 17 articles
This study proposes a method to calculate the retained oil content (WO) in cores collected by a sealed tool from organic-rich shale with thermal maturity around%Ro = 0.8 in the Ordos Basin, China. Approaches such as soaking cores at low temperature, multiple extractions, multiple pyrolysis, and multiple chromatographic analyses were conducted and then the relationships between total retained oil content and mineral compositions were analyzed. The total retained oil content measured by the method proposed in this paper is 60–260% higher than that measured by a conventional pyrolysis method and 34–69% higher than the sum (WO) of two extractions with dichloromethane (WO3) and chloroform (WO4). After extractions with dichloromethane and chloroform (WO5), the oil retained in the organic-rich shale was 4.7–11.6%, which has not been extracted. Positive correlations exist between WO (i.e., WO3 + WO4) and total organic carbon (TOC) and S1 (absorbed hydrocarbon by rock pyrolysis), and WO has the highest correlation coefficient with the former. The method can provide important guidance for the objective analysis of retained oil in organic-rich shale, and it is reliable for the evaluation of shale oil reserves.
Since the groundbreaking progress made by the United States on shale oil in Bakken reserves in the 1950s, technology related to shale oil in the US has been developing rapidly and achieved its profitability in 2018 (Soeder, 2018; Hackley et al., 2020; Solarin et al., 2020; Ulrich-Schad et al., 2020). Drawing lessons from the experience of the USA’s shale oil development, China began to explore the technology and practice on shale oil exploration and development and made a step forward on fields including geological theory, exploration and development technology, and experimental techniques (Hou et al., 2020; Hou et al., 2021a; Kang et al., 2020; Ma et al., 2020a; Ma et al., 2020b; Zhao et al., 2020a; Zhu et al., 2021). However, more researches are needed to tackle problems related to the quantitative evaluation of the total retained oil content, the occurrence mechanism of shale oil, and pores and fluid flowing mechanism in shale formation. Among these topics, objective quantitative evaluation on the retained oil content of organic-rich shale has always been the focus of ongoing researches (Jarvie, 2012; Chen and Jiang, 2016; Abrams et al., 2017; Jiang et al., 2017; Li M. W. et al., 2019).
There are two methods commonly used to measure the total retained oil in organic-rich shale: one is conventional chloroform bitumen “A” and the other is rock pyrolysis (Stroup, 1987; Johannes et al., 2007; Han et al., 2015; Nady and Hammad, 2015; Li J. B. et al., 2019). Because light hydrocarbon is easily lost, part of the hydrocarbons in S1 is regarded as residual hydrocarbon. Besides, conventional chloroform bitumen “A” can hardly reveal whether the shale oil is free or absorbed. The other method is modified pyrolysis (Zink et al., 2016; Chen et al., 2017; Li et al., 2018; Li M. W. et al., 2019; Ma et al., 2019; Hou et al., 2021b). In conventional source rock pyrolysis, S1 represents the residual hydrocarbon in rock, which is the oil that has already existed, and S2 represents the hydrocarbon potential in kerogen. In shale oil evaluation, since S1 has compositions similar to shale oil, they can be easily extracted by dichloromethane with weak polarity. Therefore, they are treated as free shale oil. However, S1 does not represent all free shale oil and S2 does not completely show the hydrocarbon potential in kerogen (Chen et al., 2018; Li et al., 2018; Li M. W. et al., 2019; Ma et al., 2019; Hou et al., 2020). S2 contains small amounts of free oil and absorbed oil, so the pyrolysis method cannot estimate the content of absorbed shale oil.
The modified method requires instantly freezing cores by liquid nitrogen in the field (at −50°C) and then crushing them in a closed system (190°C). Pyrolysis analysis immediately follows. A light hydrocarbon restoring coefficient is estimated by forward modeling, and correction to the historical data of the shale with medium–high maturity is conducted. Absorbed oil can be separated from the already generated hydrocarbon oil by changing the heating rate. But this method still shows limitations in the following aspects: firstly, online analysis cannot be achieved as crushed samples enter the pyrolysis apparatus, resulting in a partial loss of light hydrocarbon. Secondly, the assumption that kerogen generates hydrocarbon at above 300°C lacks a reliable scientific proof. Besides, since there are only a few samples (in total 100 mg), a big error may exist. For shale with abundant organic matter [total organic carbon (TOC) as high as 20–30% and hydrocarbon potential up to 100 mg/g rock], the error is noticeably high (the maximum S2 of a standard sample in China is 16.98 mg/g rock).
Eleven samples from Well L85 drilled in the Chang 7 member in the Ordos Basin were collected (see basic geochemical information listed in Table 1). After taken into a sealed tool, the cores were wiped with cotton to remove the sealing fluid on their surface within 1.5 h so that they will not be eroded by the sealing fluid. Then, the cores are weighed and put into containers filled with dichloromethane solution. The cores should be completely submerged into the solution by at least 2 cm below. Finally, the containers (i.e., sealed bottles) containing the dichloromethane solution and cores were put into a freezer where the temperature remained below 20°C to prevent the dichloromethane solution from evaporating (the boiling point of dichloromethane is 39.5°C). After all these were done, the samples were moved from the field to the laboratory.
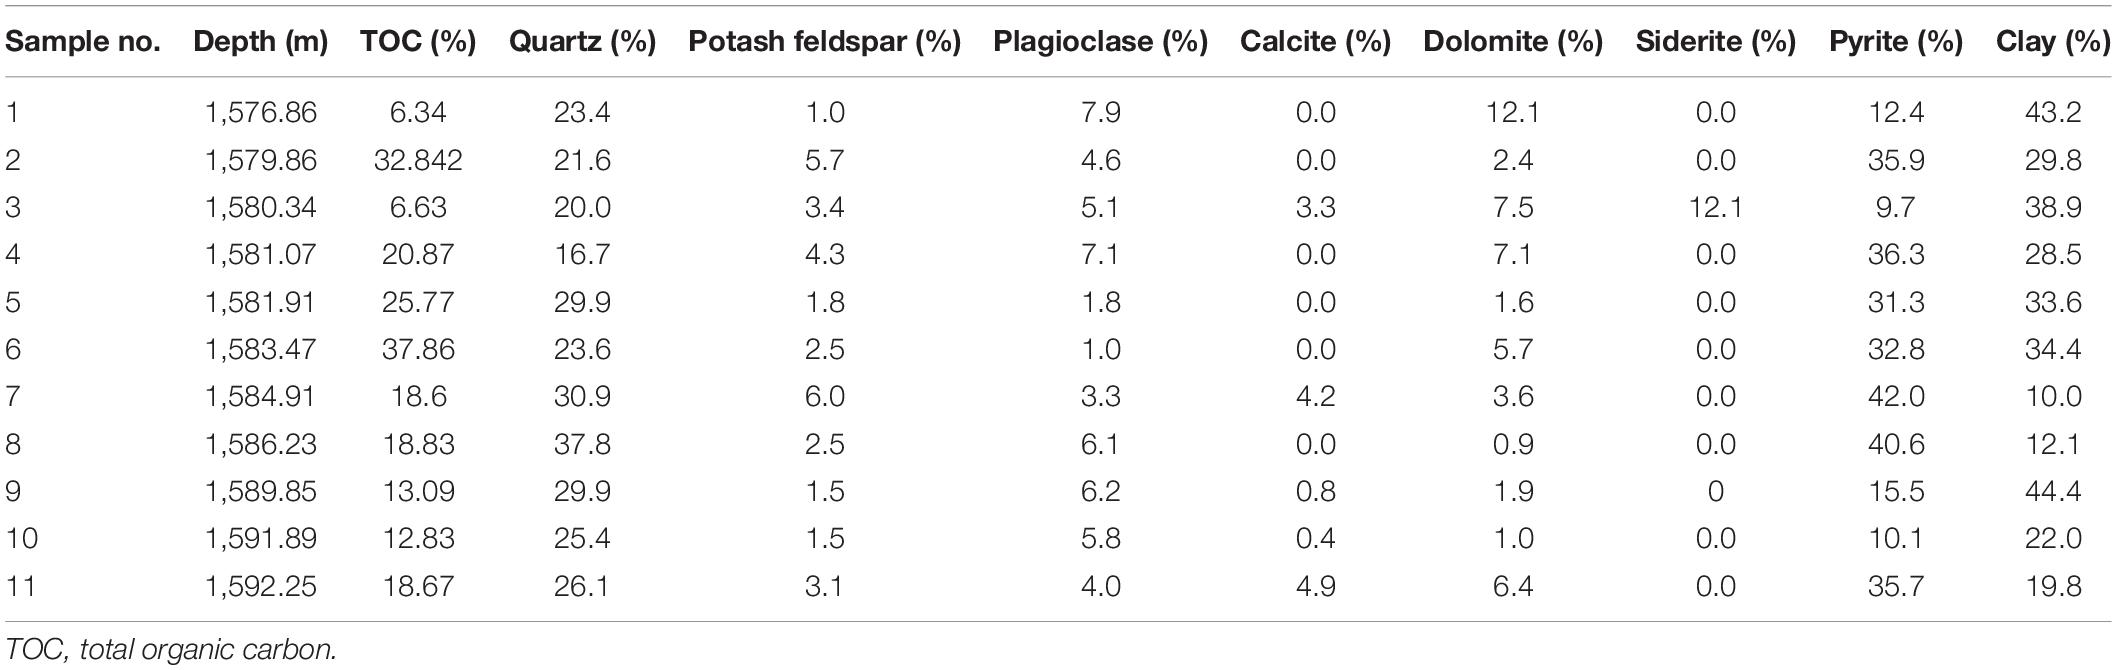
Table 1. Basic geochemical data of the experiment samples.
After immersing the cores for 10–30 days, 5 ml of methylbenzene was added to the bottle as the standard sample. The solution was placed into a crusher and then the crusher put into liquid nitrogen. The core sample was crushed into particles of 0.18 mm. The crushed sample and the dichloromethane were moved into a bottle and sealed with a cap, and then chromatographic analysis was immediately started (the above procedure is denoted as step 1). After being immersed for 10–30 days, the core sample was separated from the solution. The solution was measured and then 1 ml solution was taken and put into two flasks (labeled A and B) marked with internal rulers. Quantitative analysis of total hydrocarbon gas chromatography in a flask (A#) was conducted (the above procedure is denoted as step 2). Into another flask (B#), after full evaporation, solvent was add to 1 ml and then chromatographic analysis was conducted (the above procedure is denoted as step 3). The rest of solution was weighed after full evaporation. The rest of the crushed sample was placed into the dichloromethane solution after weighing and extraction. Of the solution, 1 ml was taken after the isochoric process and put into two flasks (labeled C and D) with internal rulers. Quantitative analysis of total hydrocarbon gas chromatography in a flask (C#) was conducted (the above procedure is denoted as step 4). Another flask (D#), after full evaporation, is added with solvent to 1 ml and then chromatographic analysis was started (the above procedure is denoted as step 5). The remaining solution was weighed after full evaporation. A certain amount of the sample powder was take after drying, weighed, and the pyrolysis analysis conducted (the above procedure is denoted as REP 1; the results are listed in Table 2). The remaining sample powder was placed into a chloroform solution after weighing and extraction. The solution was completely evaporated and weighed. Again, a certain amount of dried sample was weighed and rock pyrolysis was conducted (the above procedure is denoted as REP 2). The experiments above were conducted at the National Key Laboratory of Enhanced Oil Recovery, Research Institute of Petroleum Exploration & Development, PetroChina.
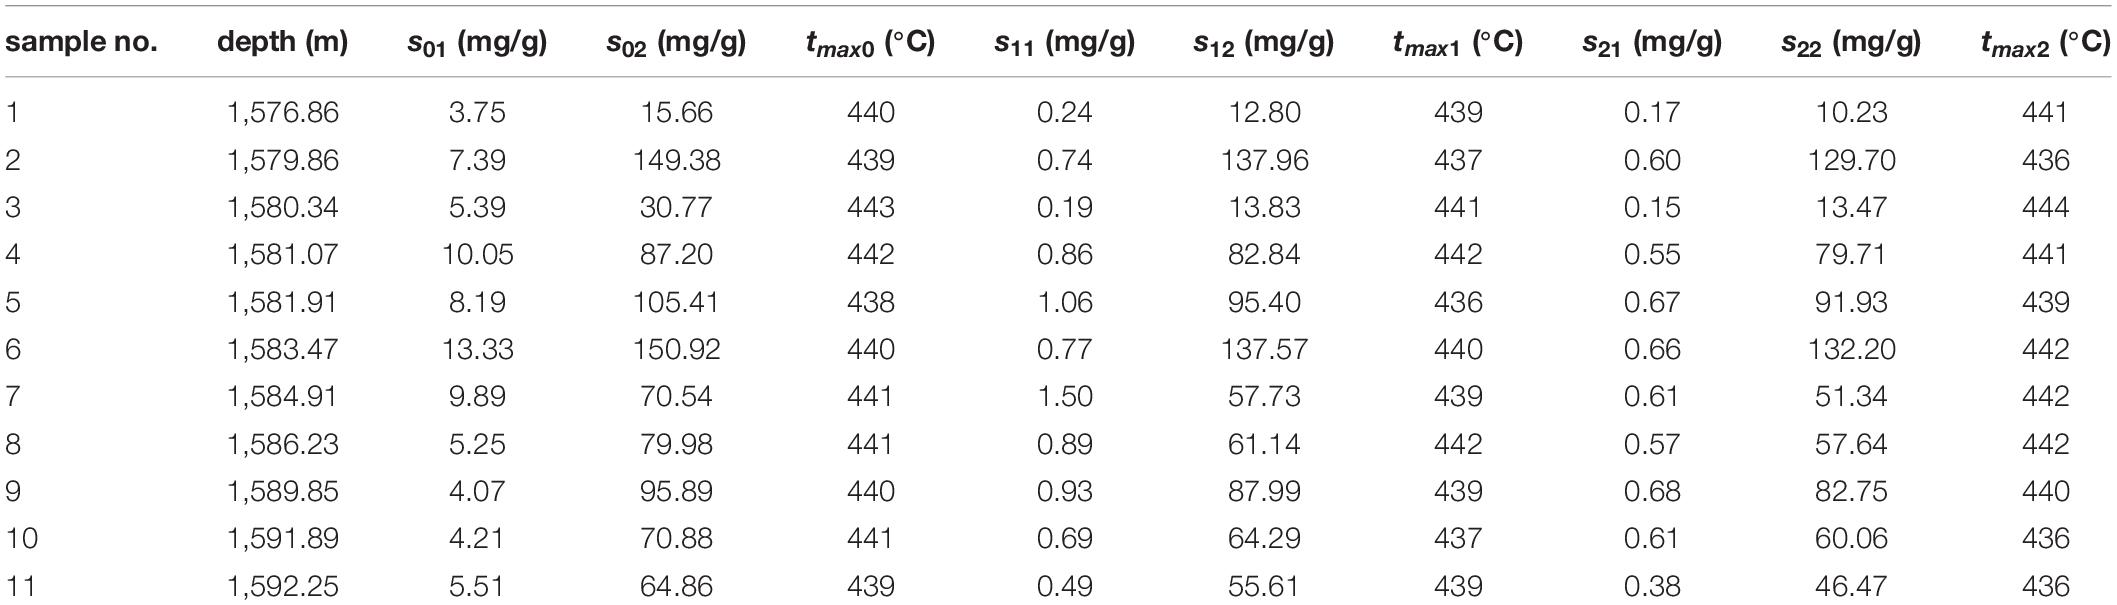
Table 2. Pyrolysis results of samples after various treatments.
Figures 1–5 show the chromatographic analysis of the core samples that went through the above steps 1–5. Taking sample 6 as an example, the calculation process is given in Appendix Table A1. The samples have been completely immersed in dichloromethane solution for 10–30 days before being crushed in liquid nitrogen, and then followed by immediate gas chromatography analysis (Figure 1). The light components remain intact, and a complete series of light hydrocarbons, namely, nC5, nC6, nC7, nC8, and nC9, can be detected. The peak area of nC7 is the largest, and nC9 is the main peak. The powder was separated from the solution after the sample was crushed and immersed for 10–30 days. After the isochoric process, 1 ml of the solution was added into flasks A and B with internal rulers. Quantitative analysis of total hydrocarbon gas chromatography was directly conducted for flask A (see the result in Figure 2). Light hydrocarbons are lost as the immersion time increases (Figure 2). Among them, all of C5 is lost, and the losses of nC6 and nC7 are 52.58 and 26.64%, respectively. C8 and later hydrocarbons gradually increase, and WO1 is calculated to be 0.032 kg/t rock. In Figure 2, toluene and D-C24 standard samples are used for compound calibration. The results show that the error of the two types of standard samples for normal alkanes is 13.55%, and the calibration value of D-C24 is slightly higher, indicating that these two standard samples can be used. Solvent was added into flask B to 1 ml after fully evaporating and then chromatographic analysis proceeded (see the result in Figure 3). After the rock soaking solution volatilized completely at room temperature, the hydrocarbons before nC13 are almost lost. The results show that the losses of nC13, nC14, and nC15 are 46.76, 14.57, and 0.43%, respectively. The two calculation results of nC16–nC25 are within + 10%. Light hydrocarbons before C14 were quantitatively analyzed by chromatography. The pre-C14 hydrocarbons precipitated by sample soaking are 1.91 kg/t rock, accounting for 32.51% of the total hydrocarbons.
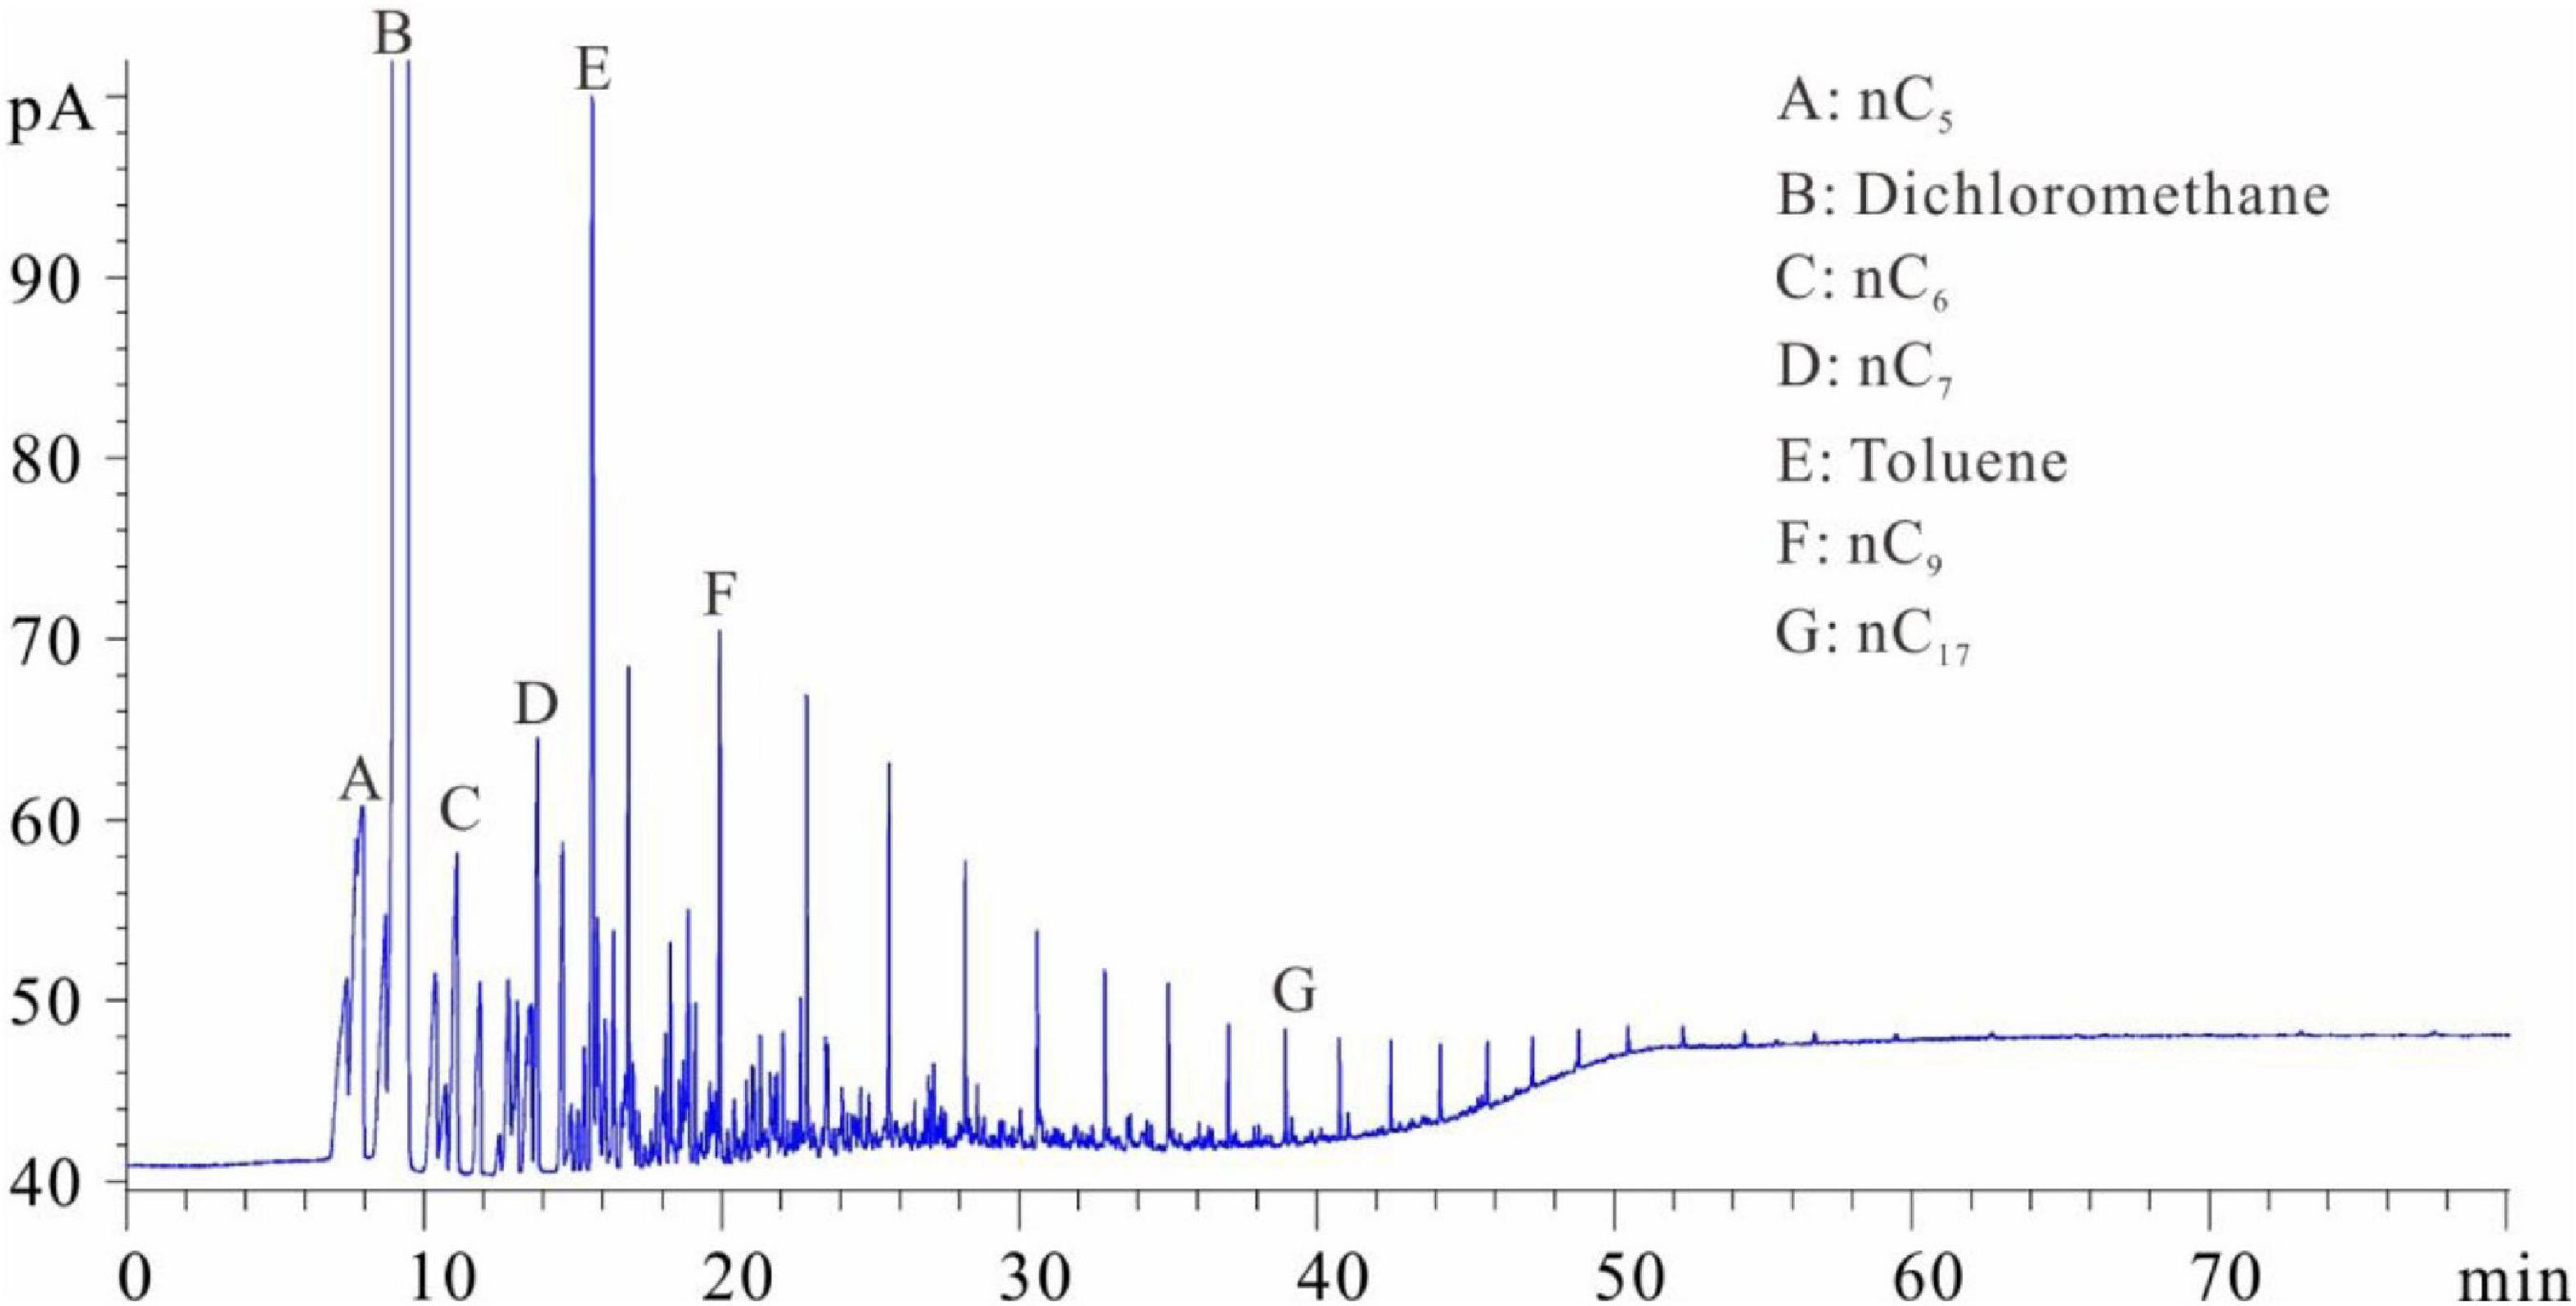
Figure 1. Chromatogram of samples that were soaked first and then crushed (chromatogram after step 1).
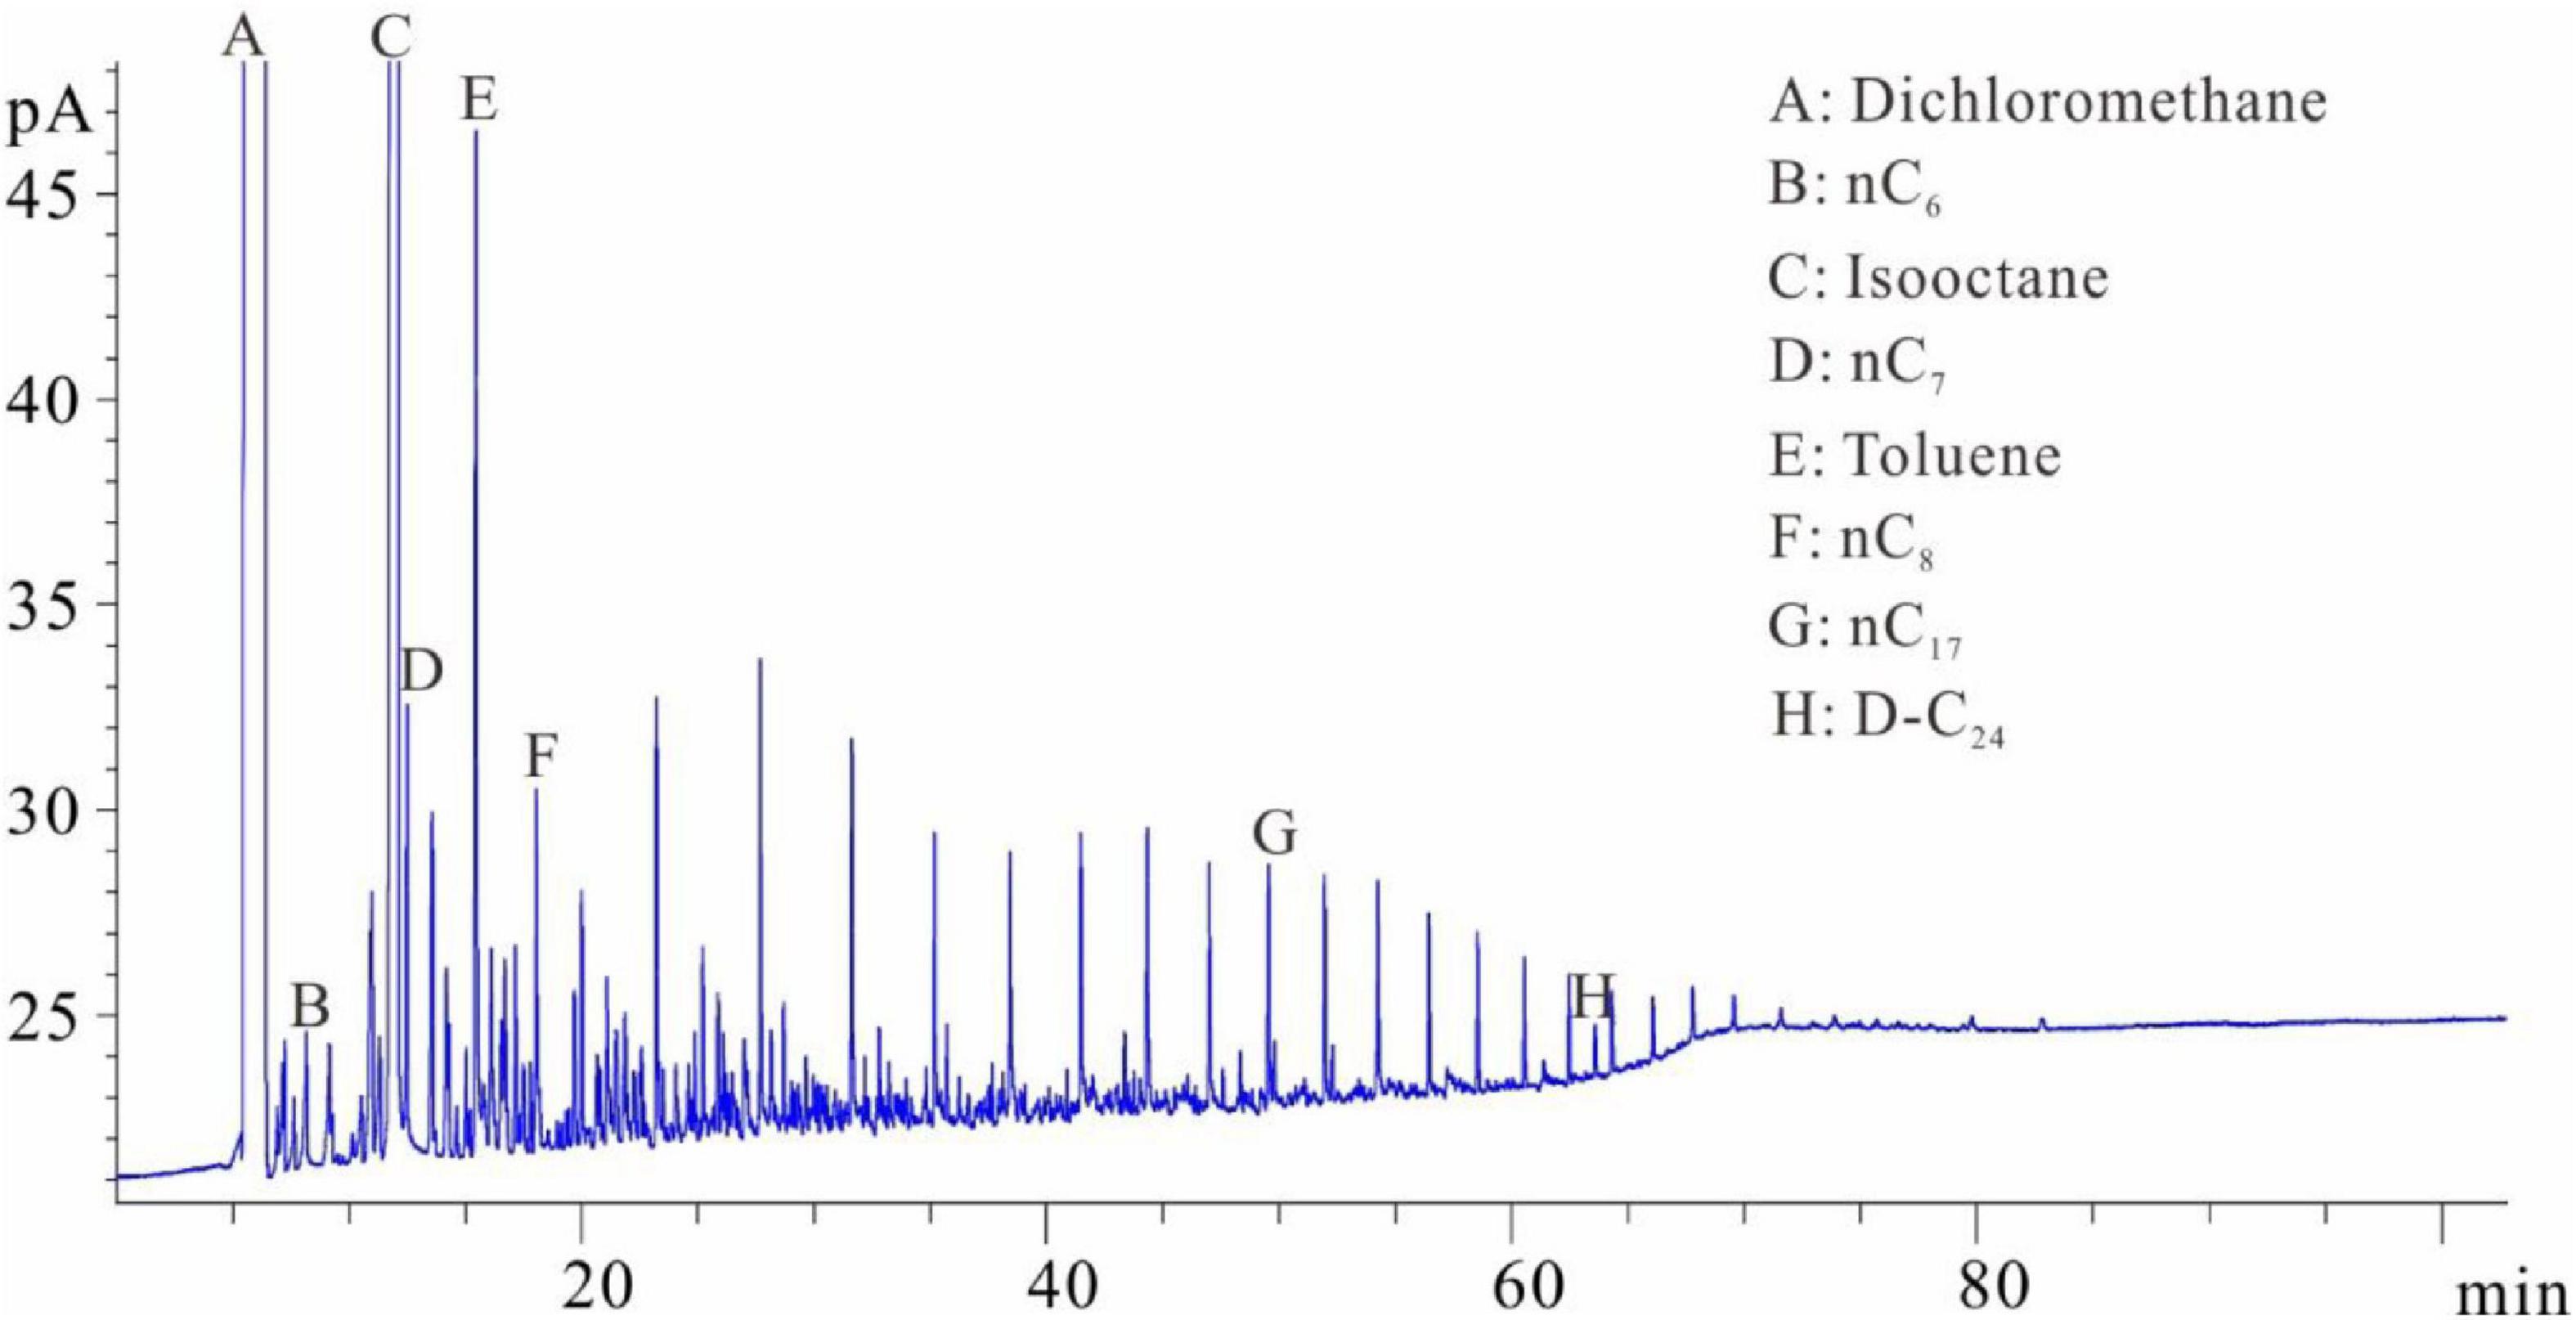
Figure 2. Chromatogram of samples that were crushed first and then soaked (chromatogram after step 2).
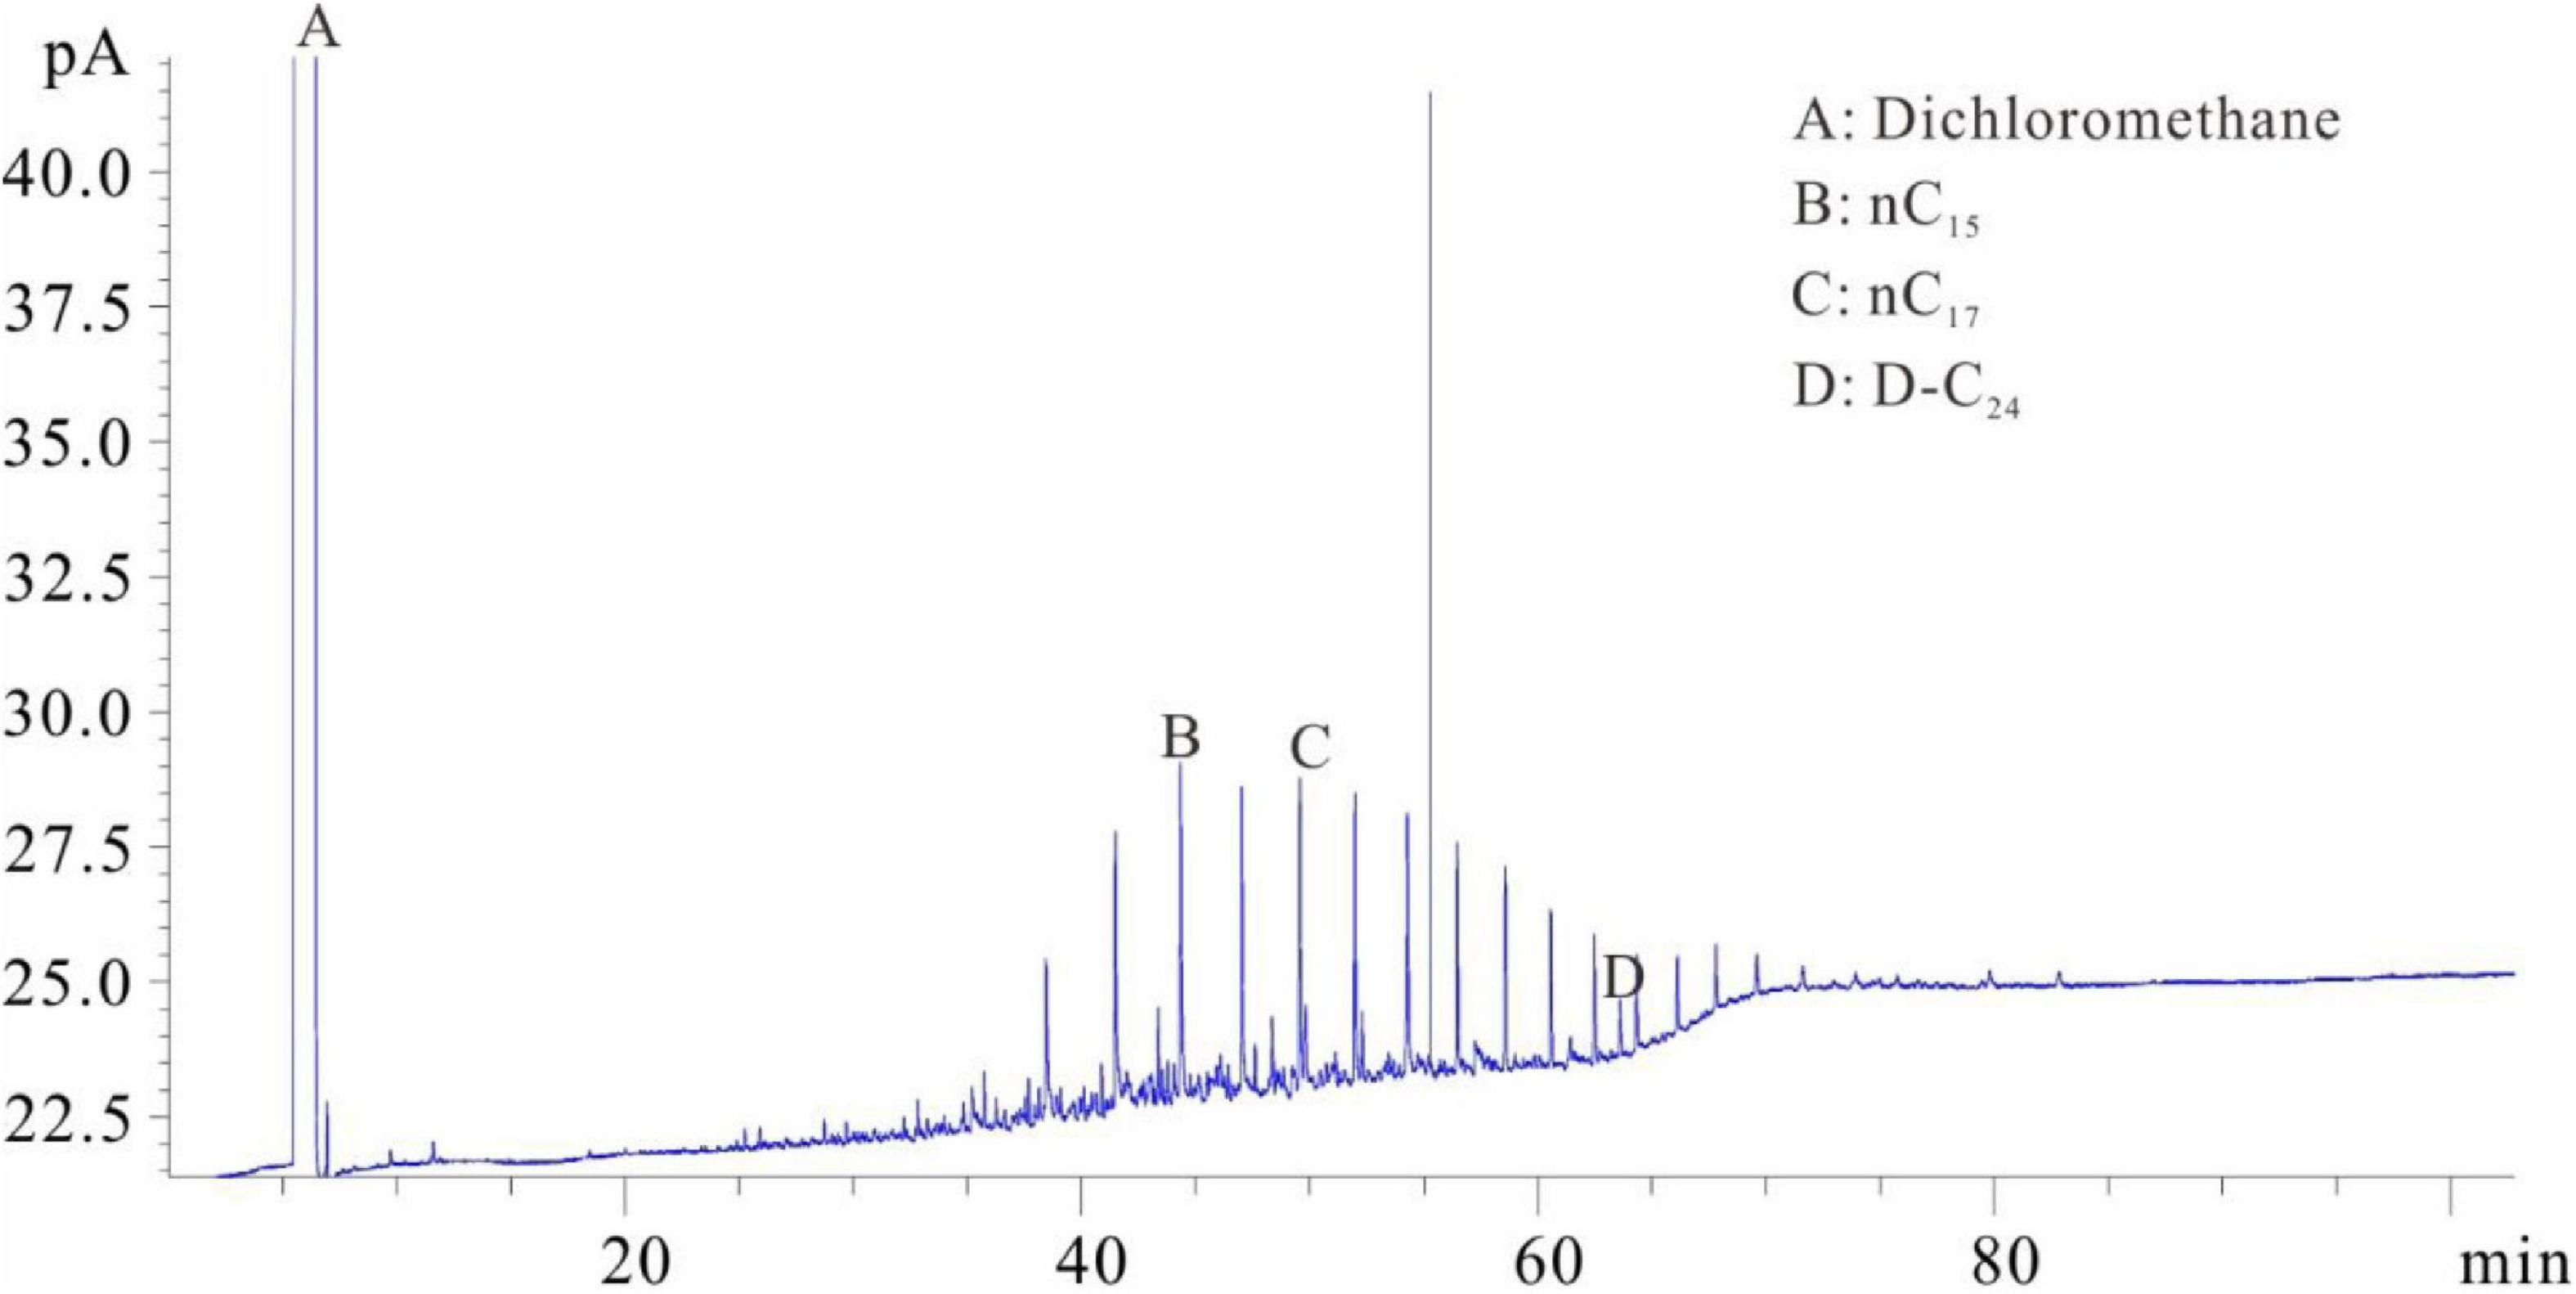
Figure 3. Chromatogram of samples that were soaked first and then evaporated (chromatogram after step 3).
The samples were placed into the dichloromethane solution for extraction after separating the solution from the crushed sample. One milliliter of the extracted solution was collected and placed into flasks C and D with internal rulers after the isochoric process. Quantitative analysis of total hydrocarbon gas chromatography was directly conducted in flask C (similar to flask A) (see the result in Figure 4). The shales were soaked in dichloromethane and then extracted. The extraction product is divided into two parts: one part is that of hydrocarbons after C10 and the other part is of the isomeric hydrocarbons of C6–C7 (Figure 4). The molecular radius of this part of the hydrocarbons is small. The hydrocarbons in this part are stored in the shale nanopores and cannot be completely precipitated by the dichloromethane. One milliliter solvent was added into flask D after fully evaporating and chromatographic analysis was conducted (similar to flask B) (Figure 5). The D volumetric flask is not easy to volatilize completely during the experiment, so the storage time is very long. Due to the long storage time, the normal alkanes before nC17 have all been lost. However, the C6–C7 isomeric alkanes in Figure 4 are not significantly reduced in Figure 5. It is speculated that these C6–C7 isomeric alkanes may coexist with resins and asphaltenes and are extremely difficult to volatilize.
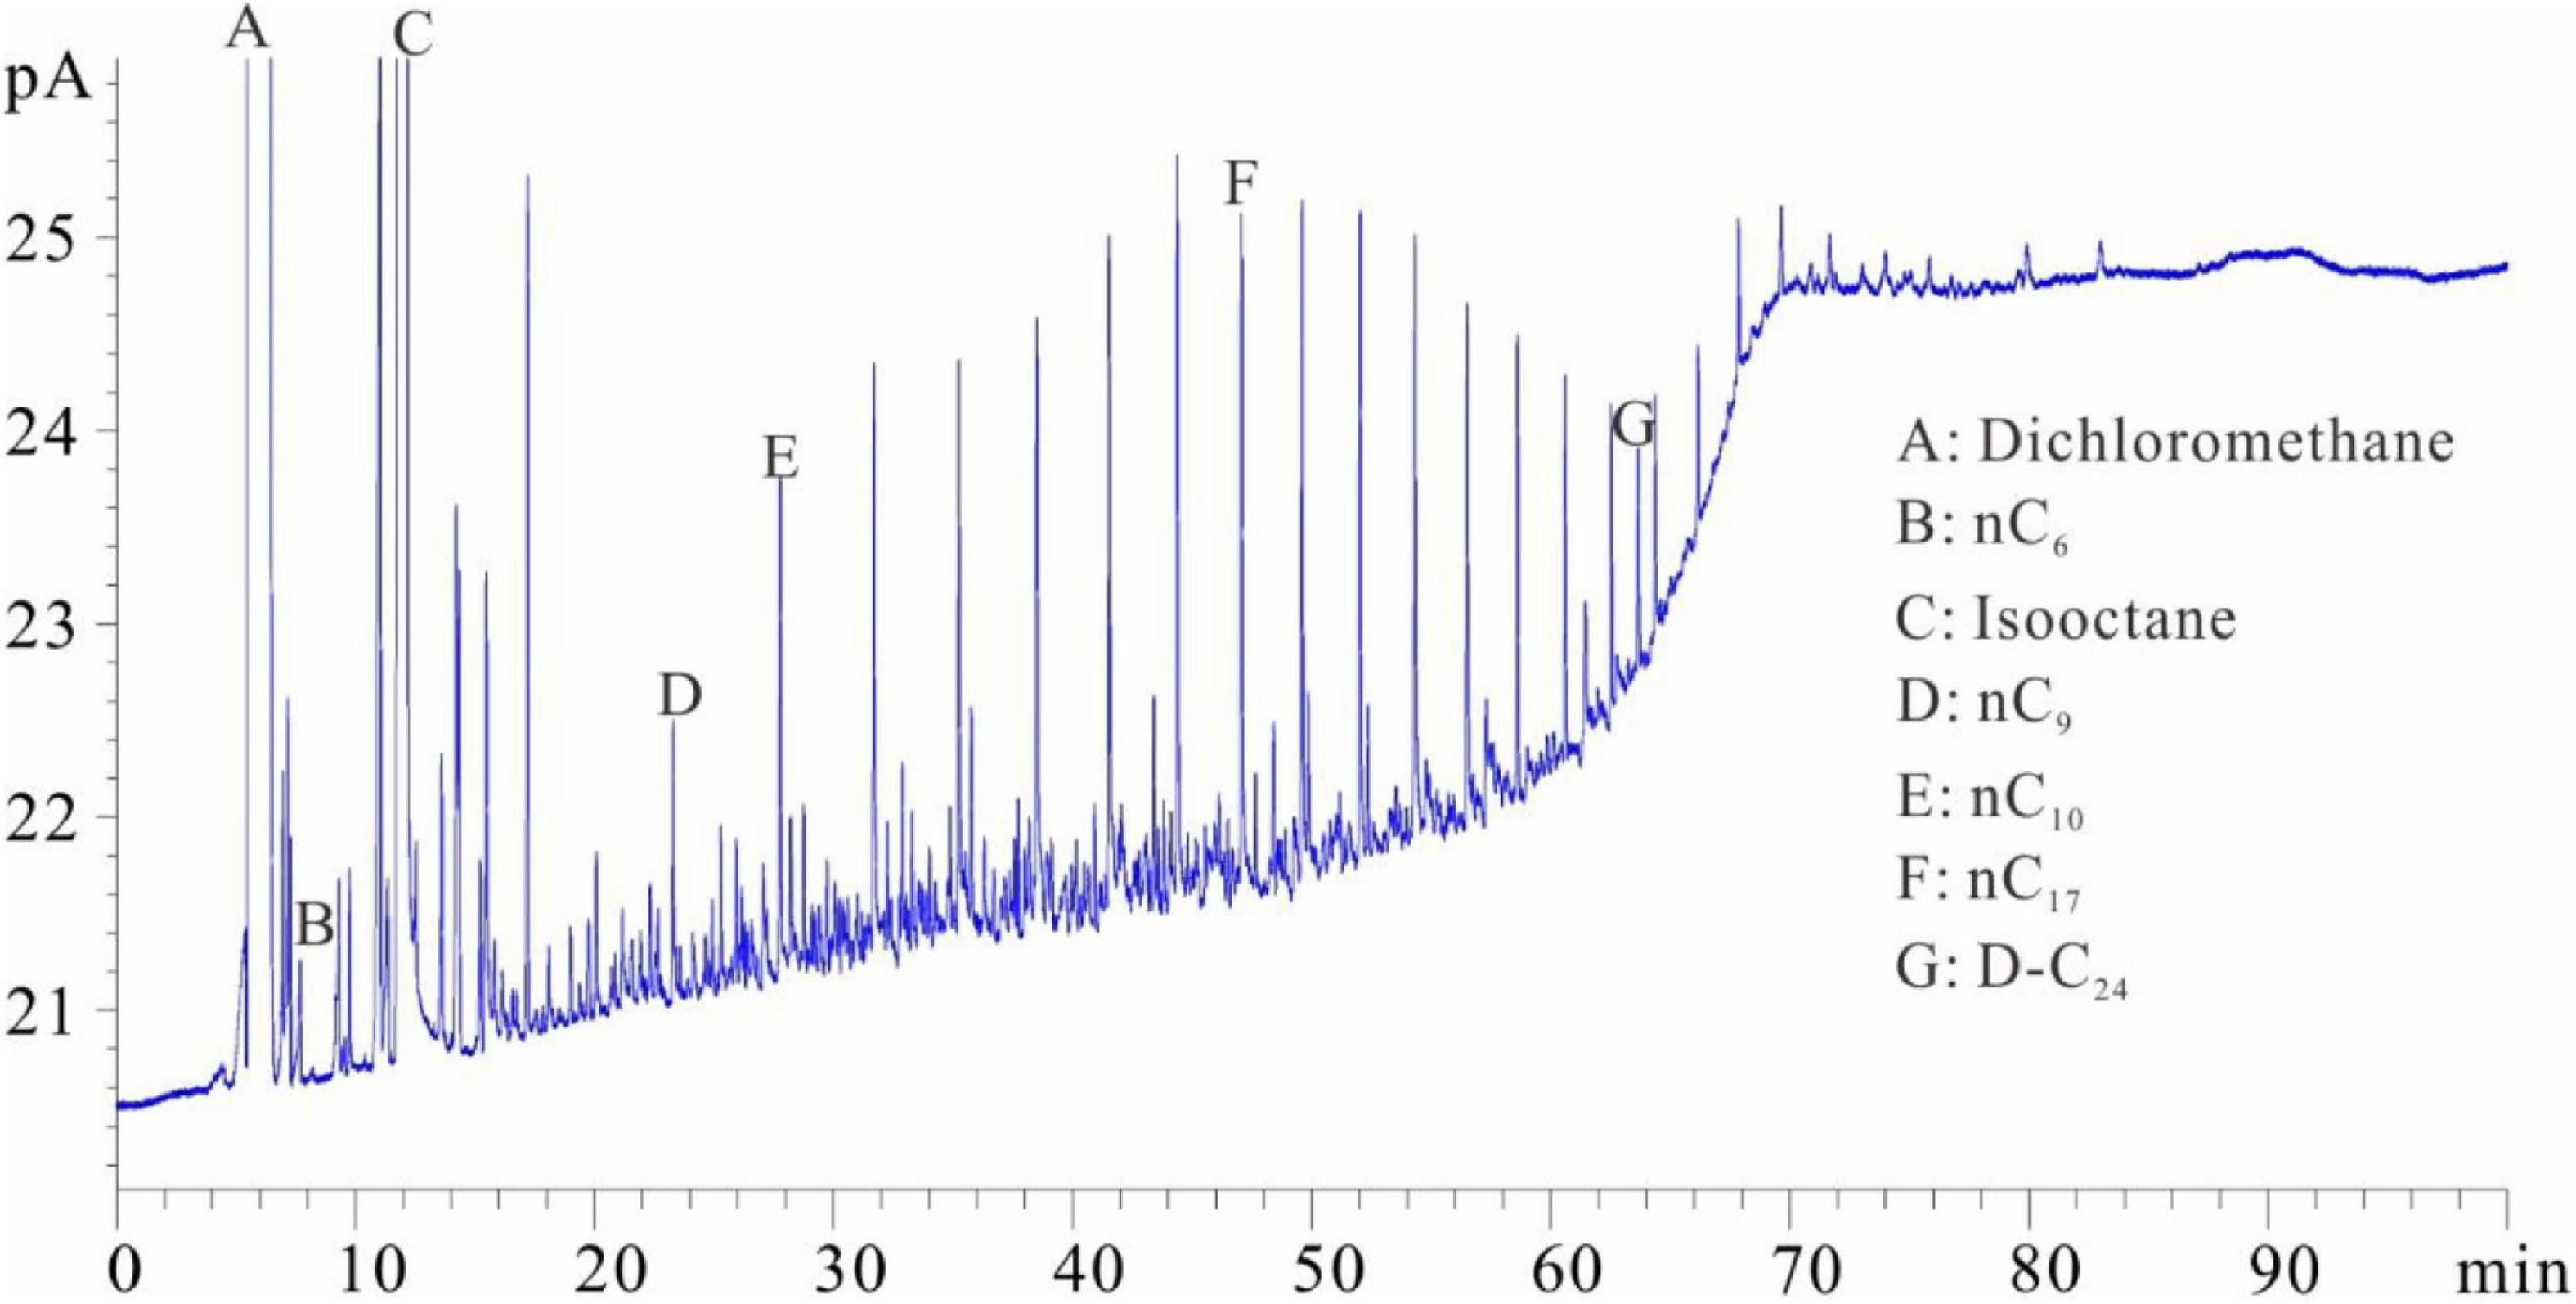
Figure 4. Chromatogram of samples after dichloromethane extractions (chromatogram after step 4).
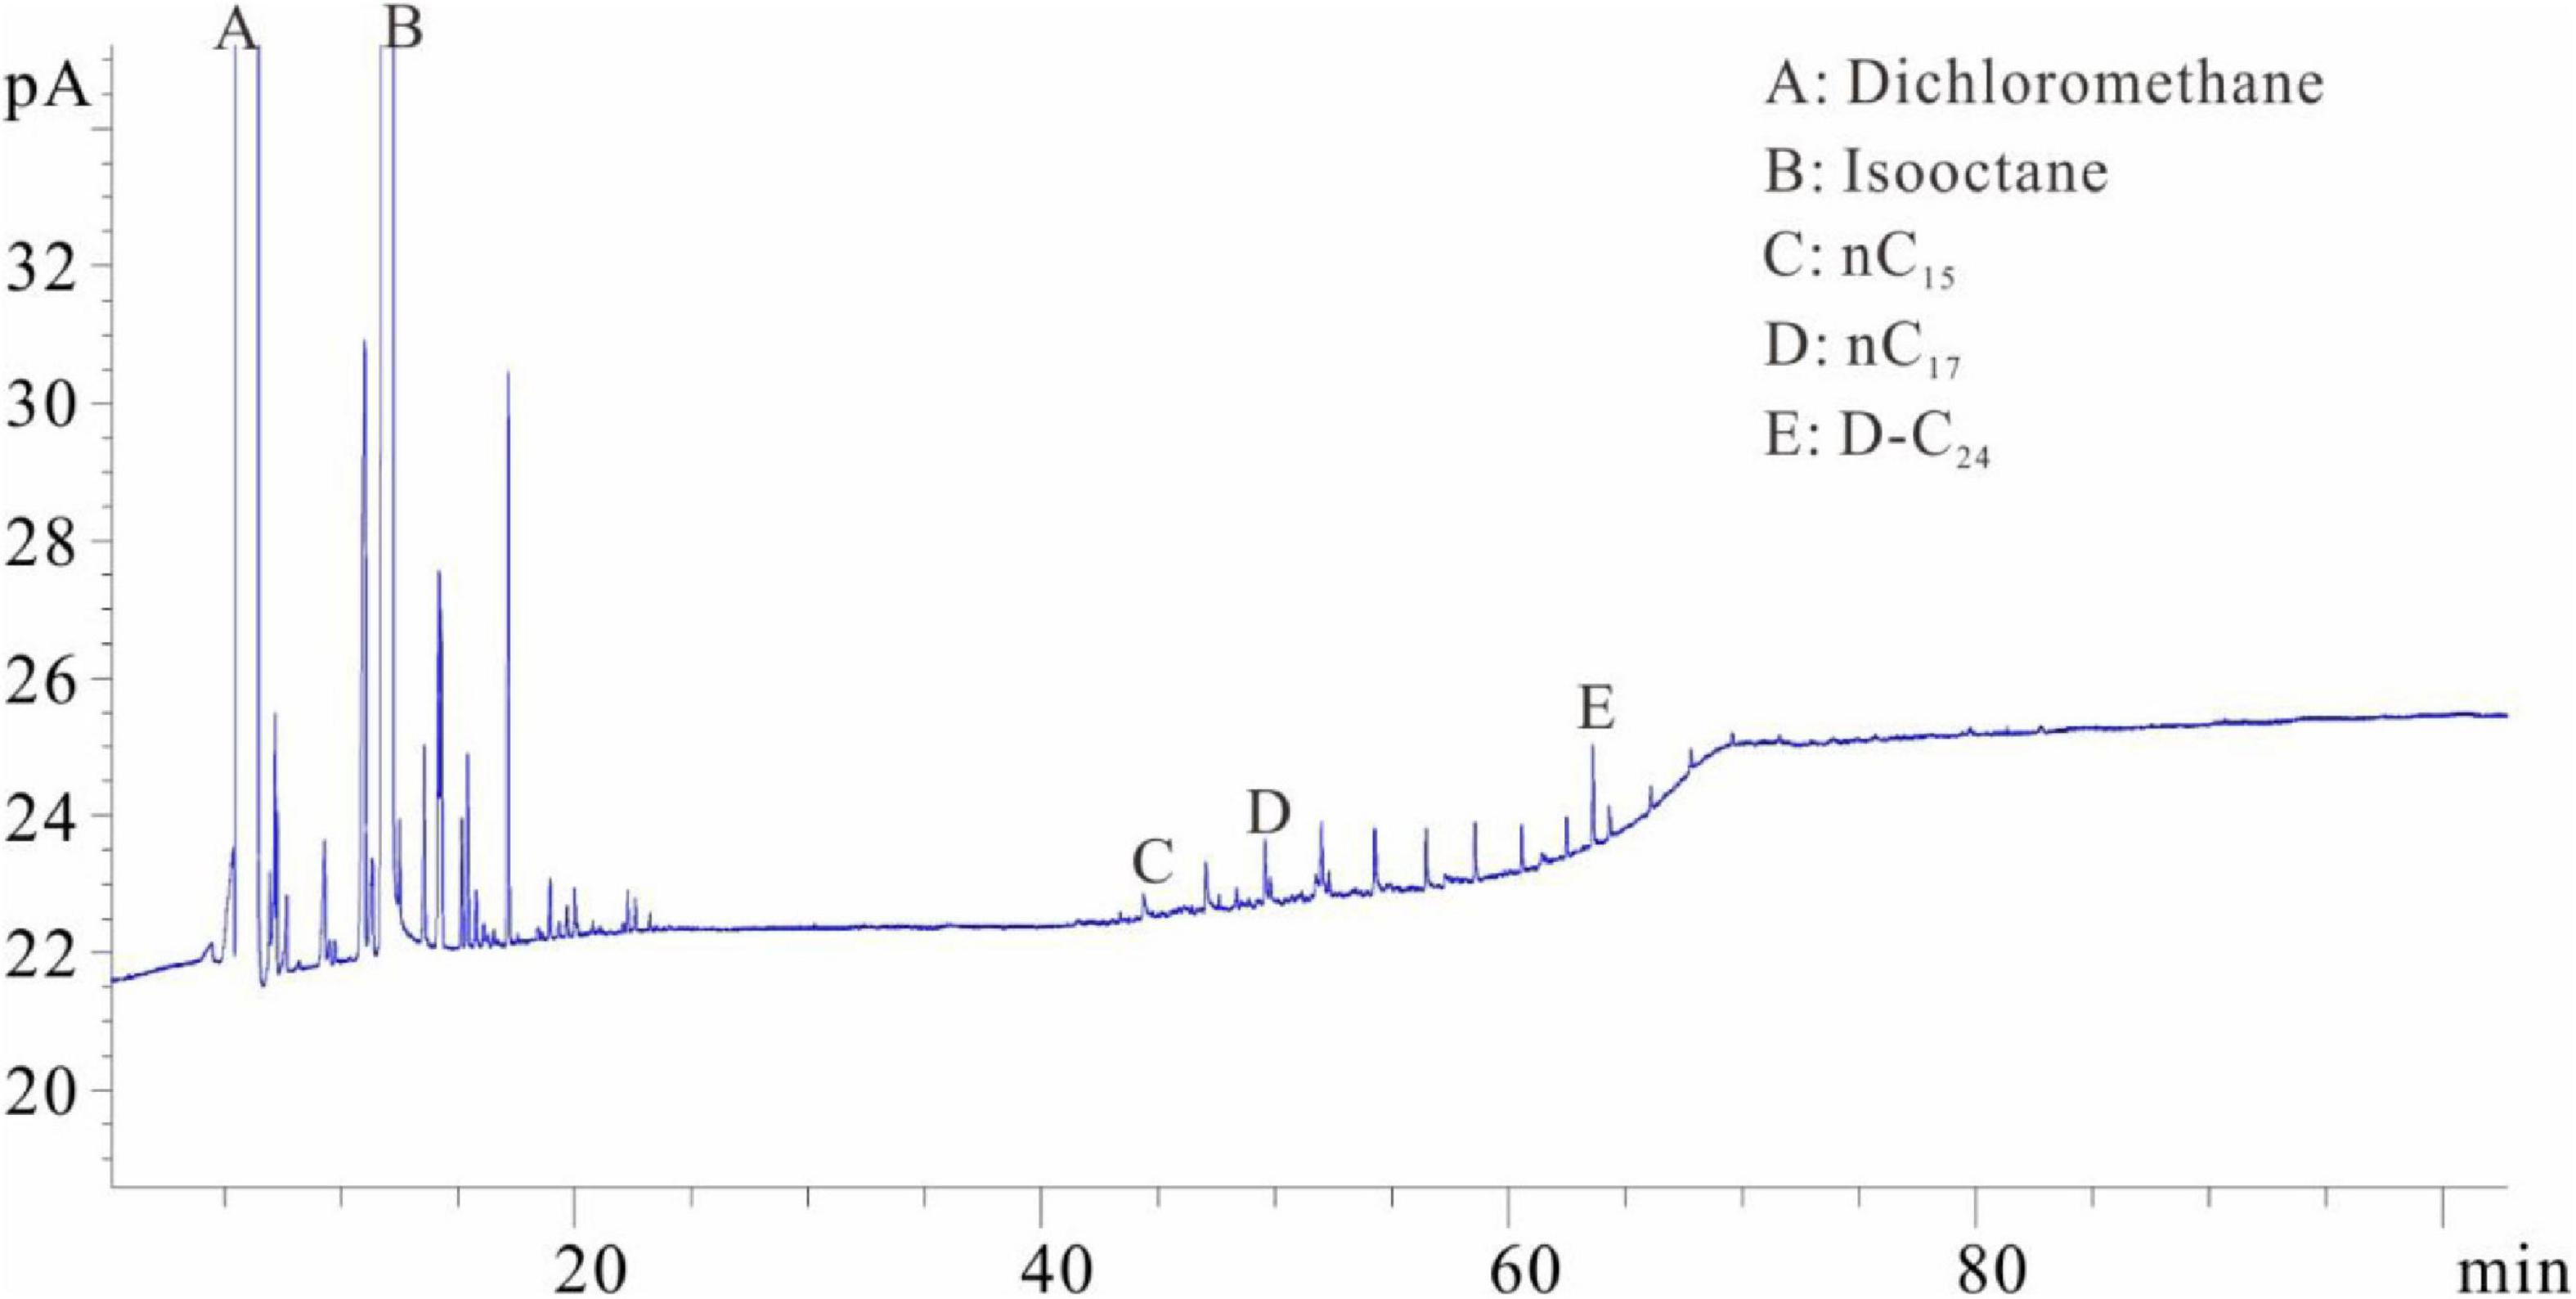
Figure 5. Chromatogram of samples after chloroform extractions (chromatogram after step 5).
After drying the rock samples, pyrolysis analysis was immediately conducted. The results are denoted as S01, S02, and Tmax0 (Table 2). Pyrolysis analysis was conducted for the second time after the samples were extracted by dichloromethane and dried by fully evaporating (after REP 1) (Jiang et al., 2017; Li et al., 2018; Li M. W. et al., 2019; Li J. B. et al., 2019). The results are denoted as S11, S12, and Tmax1 (Table 2). After weighing, the remaining sample powder was placed in chloroform solution for extraction. Then, after chloroform evaporated, the samples were weighed and dried (after REP 2). Finally, pyrolysis experiment was done for the third time (Sun et al., 2019; Hou et al., 2020). The results are denoted as S21, S22, and Tmax2 (Table 2).
We conducted sealed coring to organic shale that has a maturity level of%Ro = 0.8 in the Ordos Basin to calculate the total retained oil content. The core sample went through procedures including low-temperature soaking, multiple extractions, multiple pyrolysis, and multiple chromatographic analyses (refer to Section “Samples and Methods” for detailed experiment procedures). This study developed an integrated approach to measuring the total retained oil content in organic-rich shale (Chen and Jiang, 2016; Chen et al., 2018; Li et al., 2018; Li M. W. et al., 2019; Ma et al., 2019; Hou et al., 2020). The workflow is shown as follows (Figure 6).
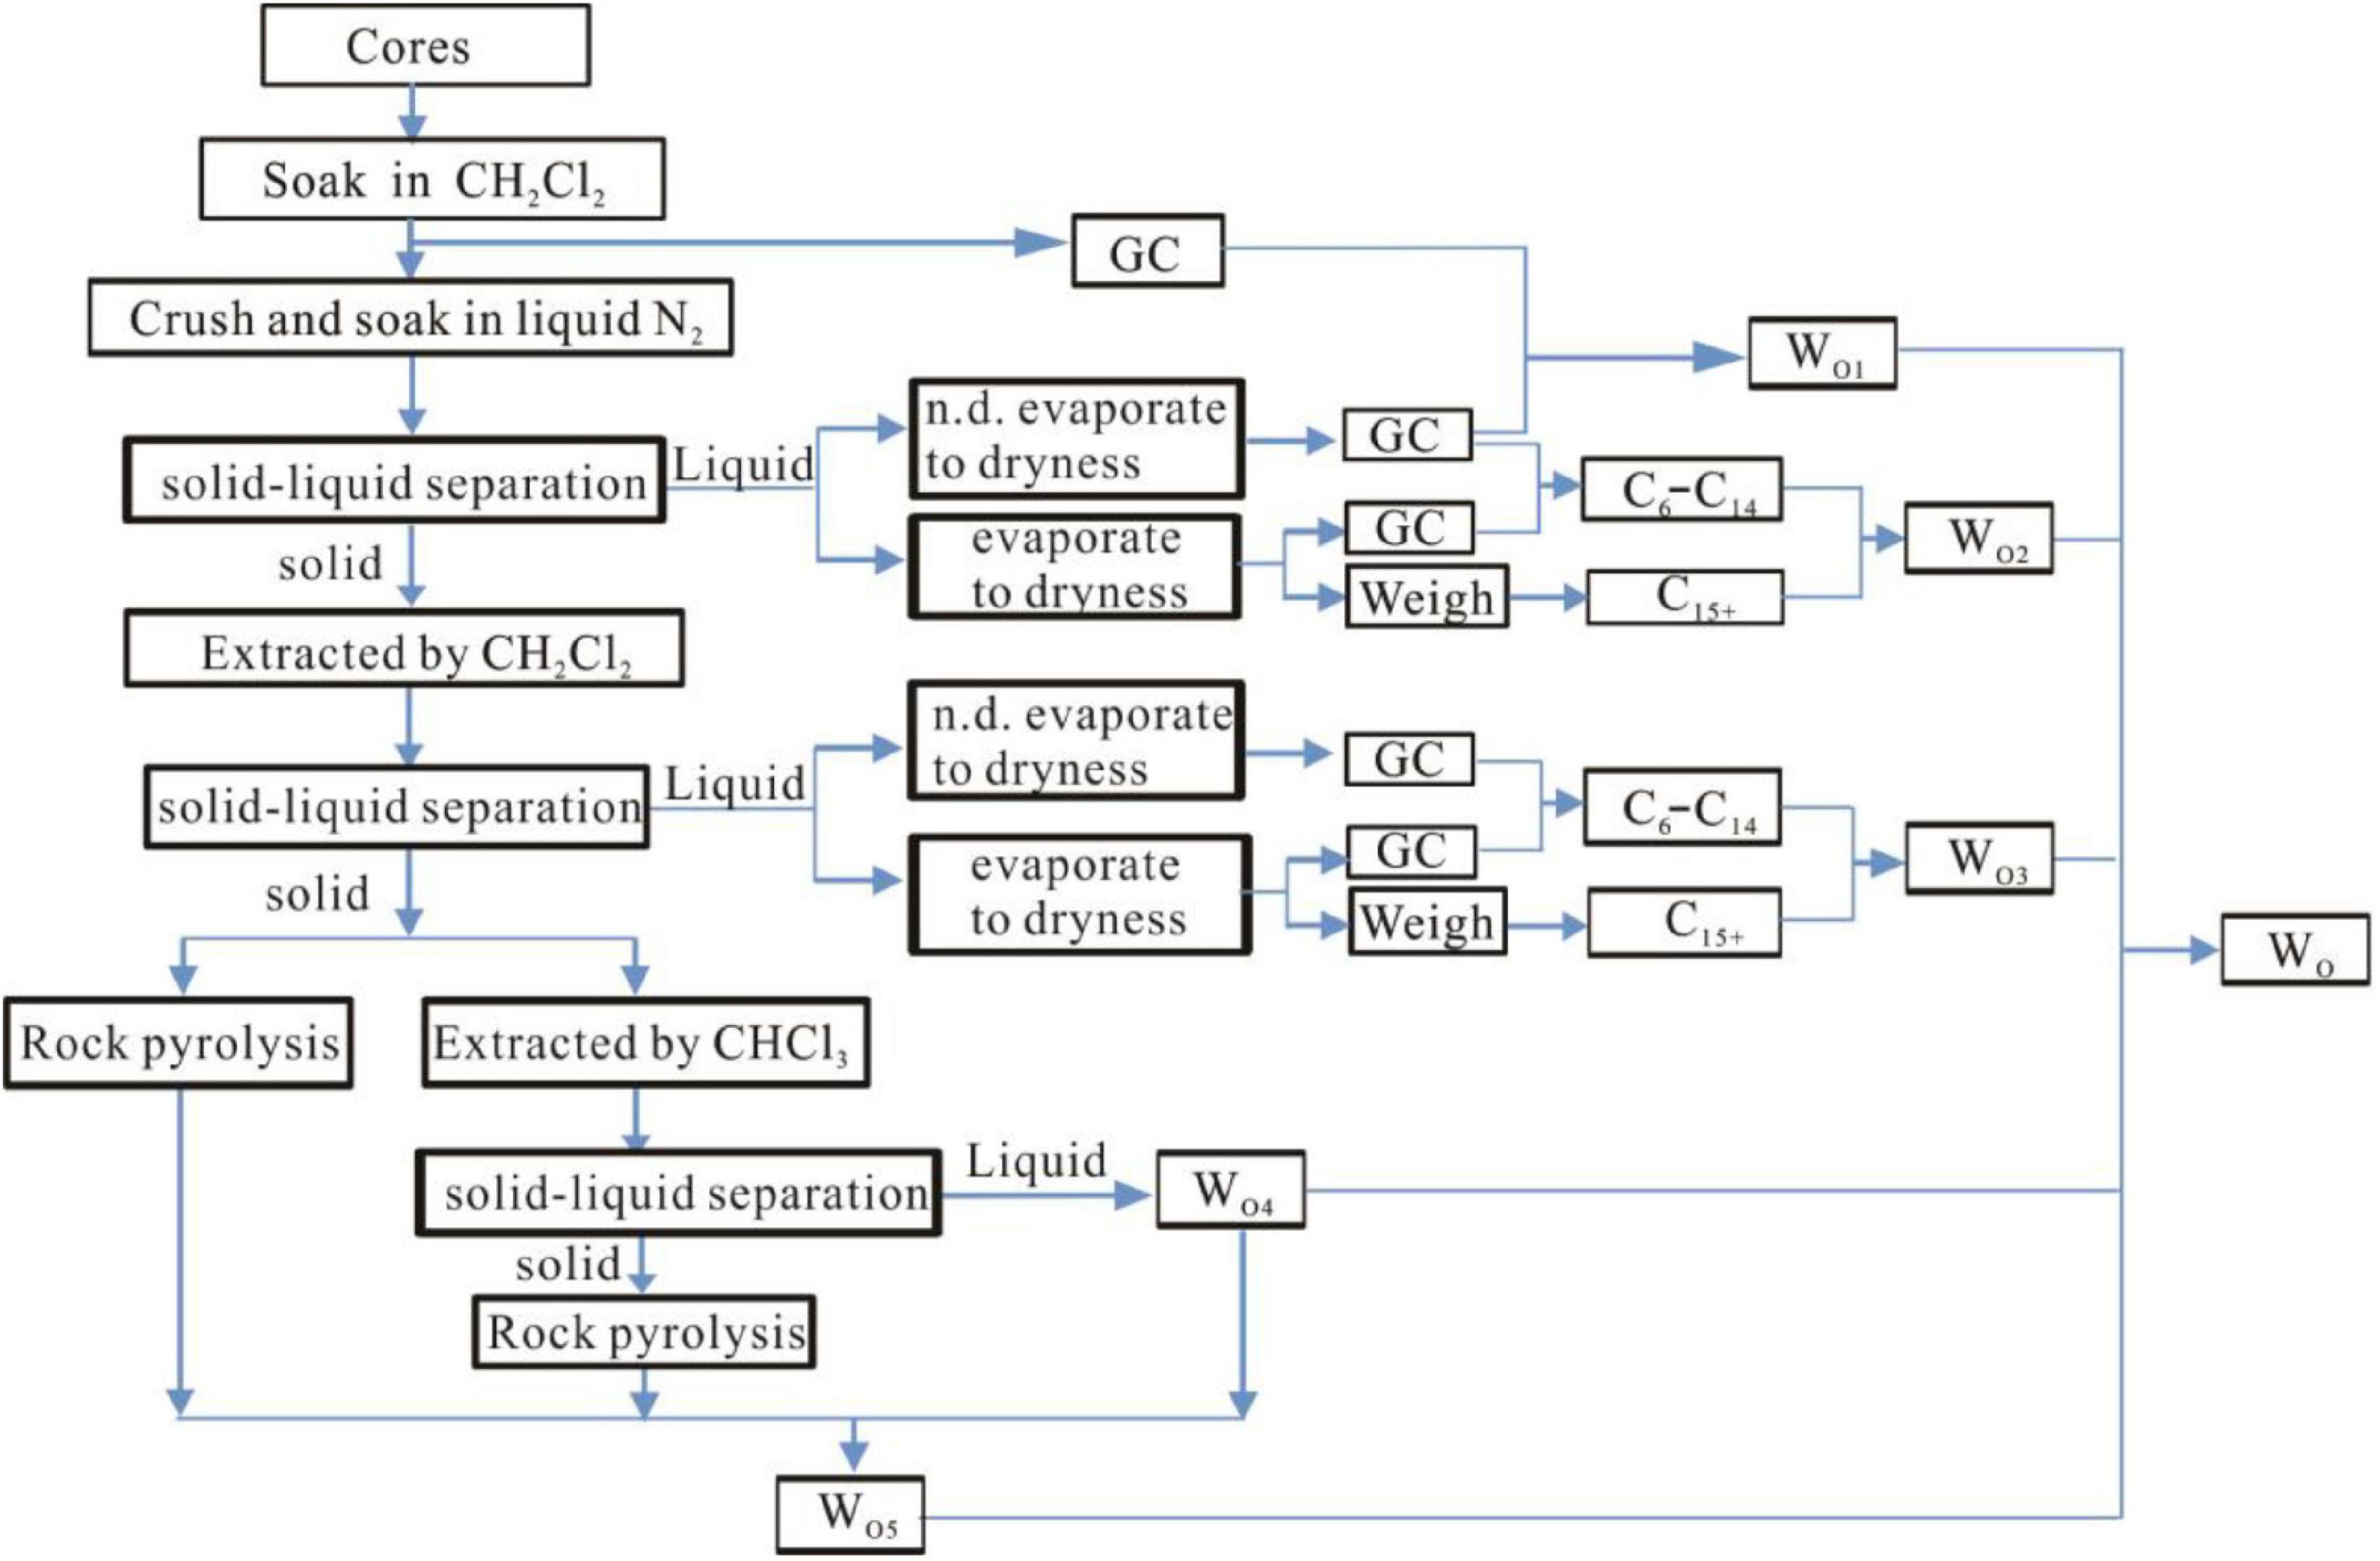
Figure 6. Measuring procedures of the retained oil content in organic-rich shale.
The detailed calculation process is as follows:
WO1 refers to the difference (C5–C7) between the core samples after step 2 and after step 1 (in flask A#).
WO2 refers to the difference (C6–C14) between the core samples after step 3 (flask B#) and after step 2 (flask A#), plus the weight WV1 of the evaporated solution remaining after step 2. ST3 - ST2 refers to the light hydrocarbon in the sample.
WO3 represents the difference (C6–C14) between the core samples after step 5 (D#) and after step 4 (C#), plus the weight WV2 of the evaporated solution remaining after step 5. ST5 - ST4 refers to the light hydrocarbon in the sample.
The solution, after extracted by chloroform, filtered, and evaporated completely, is weighed to be WO4. The hydrocarbons retained in the shale after chloroform extraction is defined as WO5, and this part of hydrocarbons can be calculated from Figure 7. After the shale is extracted by dichloromethane and chloroform, the difference of the two pyrolysis S1 values and the amount of chloroform extraction show a positive relationship. Therefore, pyrolysis analysis of the rock after chloroform extraction can infer the retained hydrocarbon content in the rock according to the S1 content.
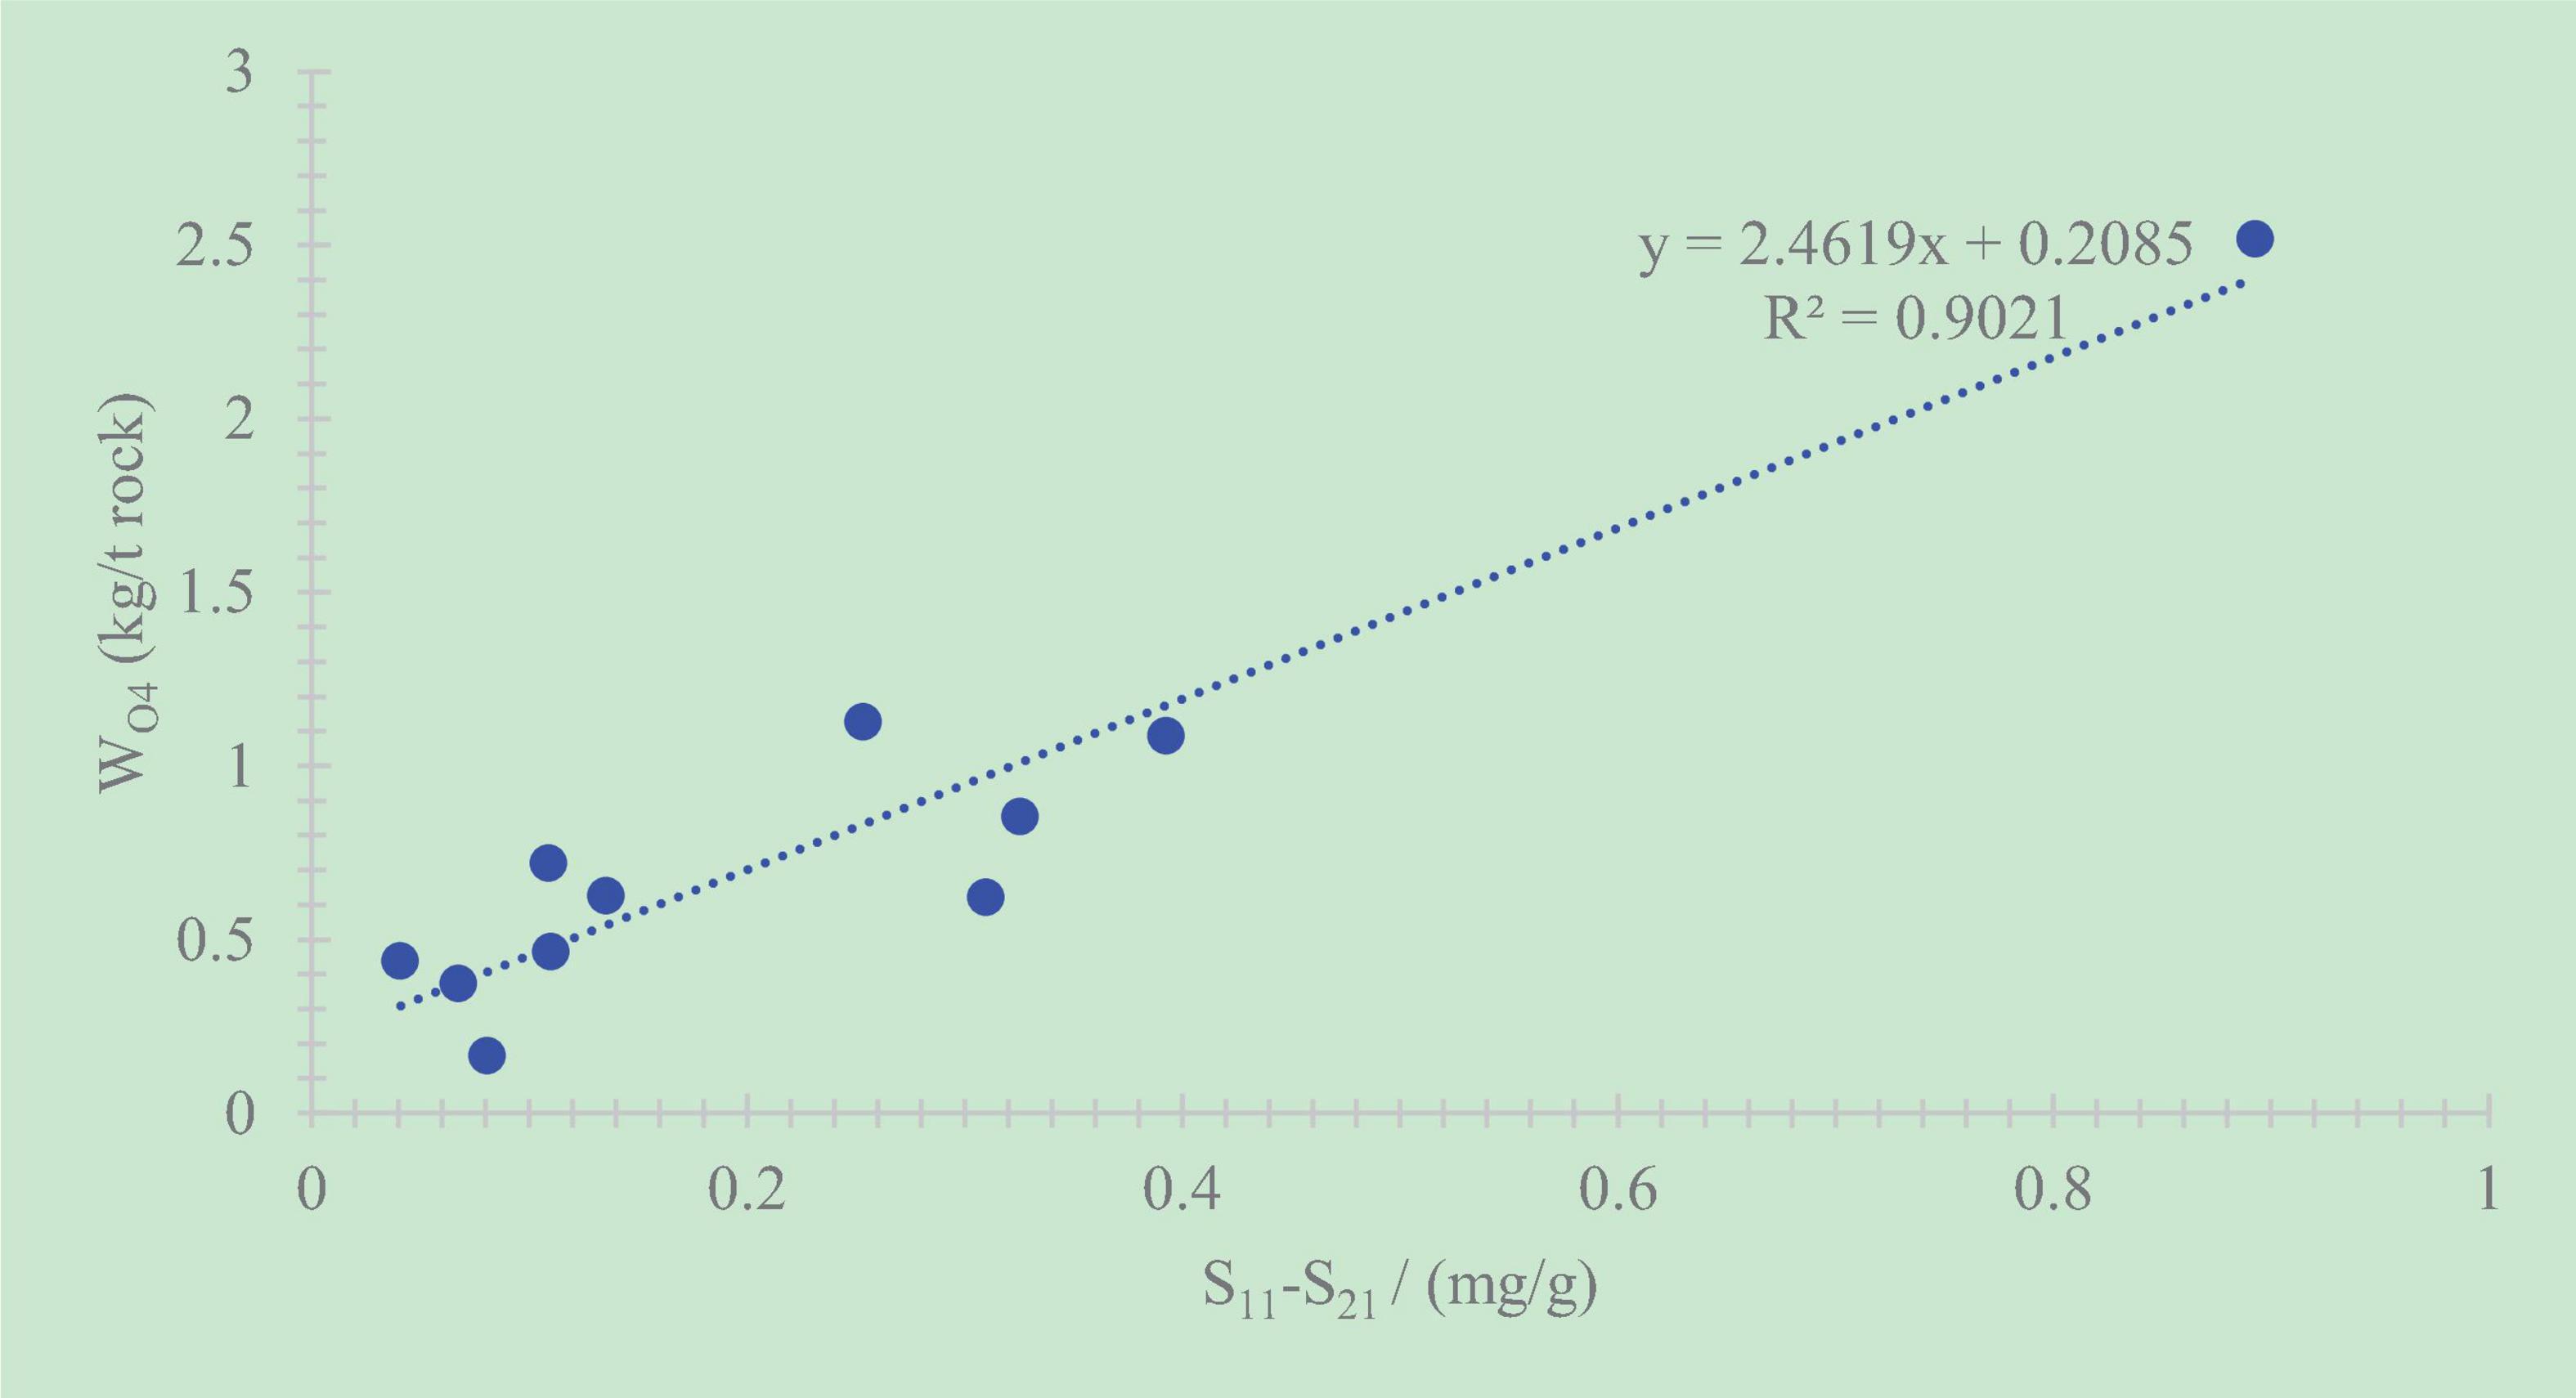
Figure 7. Diagram between WO4 and S11–S21.
Therefore, the calculated oil content in shale should include five parts (Table 3), namely:
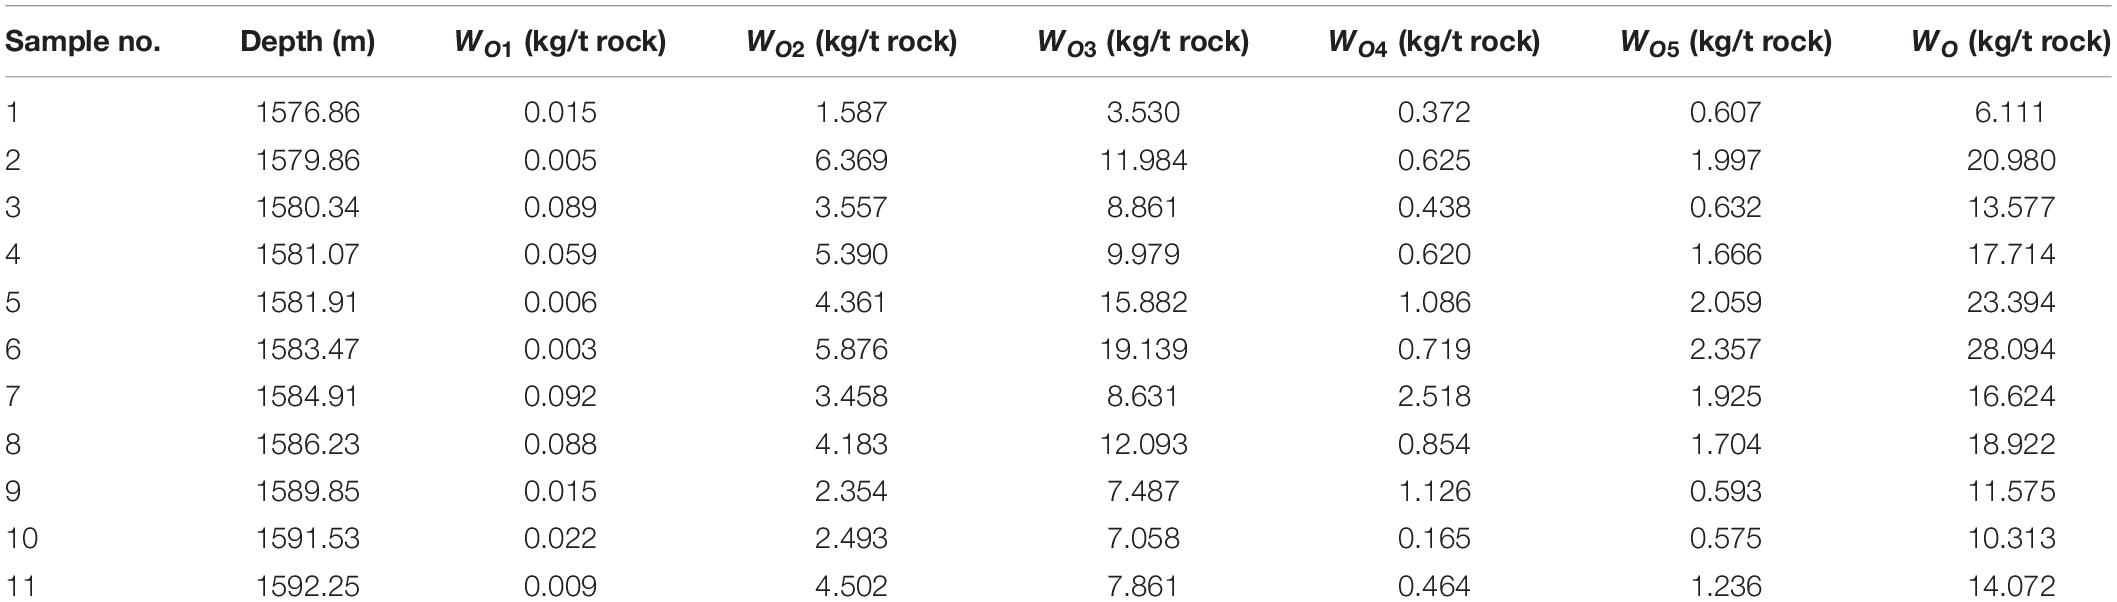
Table 3. Calculation of oil content in organic-rich shale.
The retained oil WO4 in organic-rich shale after extracted by dichloromethane and chloroform accounts for 4.65–11.58%. In other words, there is 4.65–11.58% of retained oil that can hardly be soluble in organic solvent in organic-rich shale, and this part of retained oil can hardly be extracted.
The total retained oil content shows good correlations with the extracted sum of dichloromethane and chloroform, whose correlation coefficient is R2 = 0.96 (Figure 8). This phenomenon illustrates that the primary components in the total retained oil are mainly soluble organic matter that can be extracted by dichloromethane and chloroform. In other words, the retained oil in organic-rich shale can be extracted using some techniques.
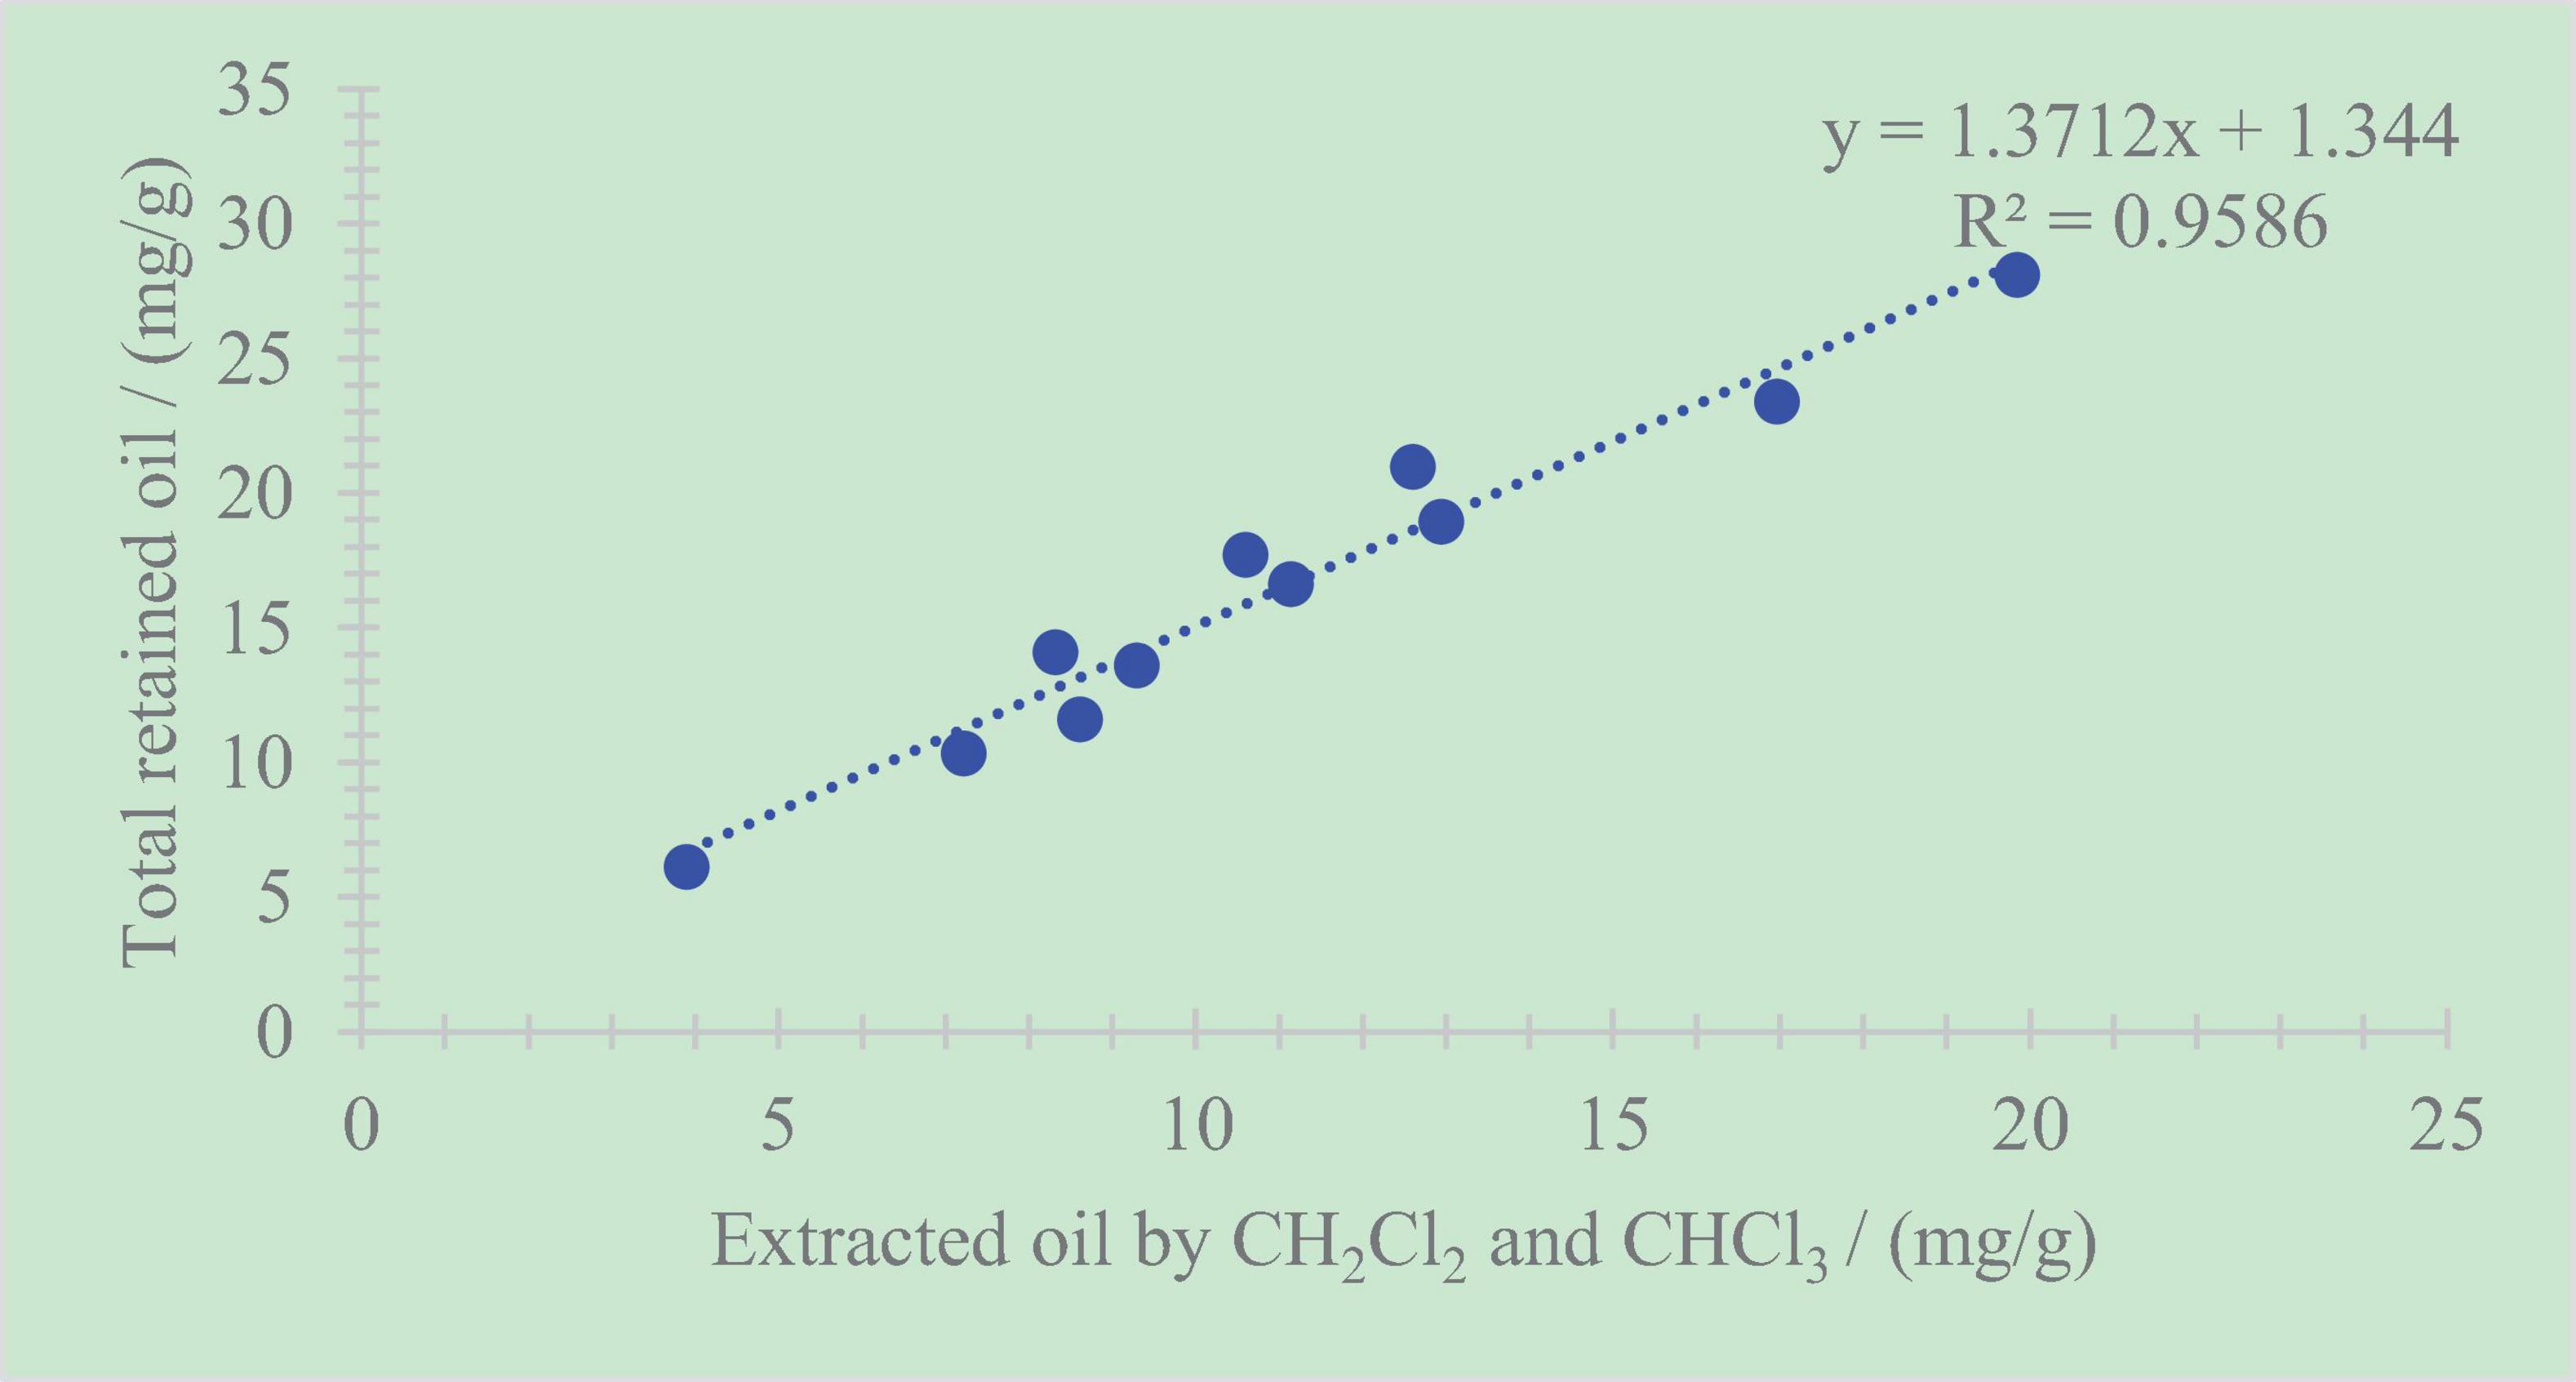
Figure 8. Relationship between the total retained oil content and the extracted sum of dichloromethane and chloroform.
A positive correlation between the total retained oil content and TOC exists, with R2 = 0.82 (Figure 9). This phenomenon demonstrates that the increase in TOC may cause more shale oil remaining in rock, namely, retained oil (Hou et al., 2020; Shao et al., 2020; Zhao et al., 2020b). To explore shale oil, shale with a higher TOC is the target.
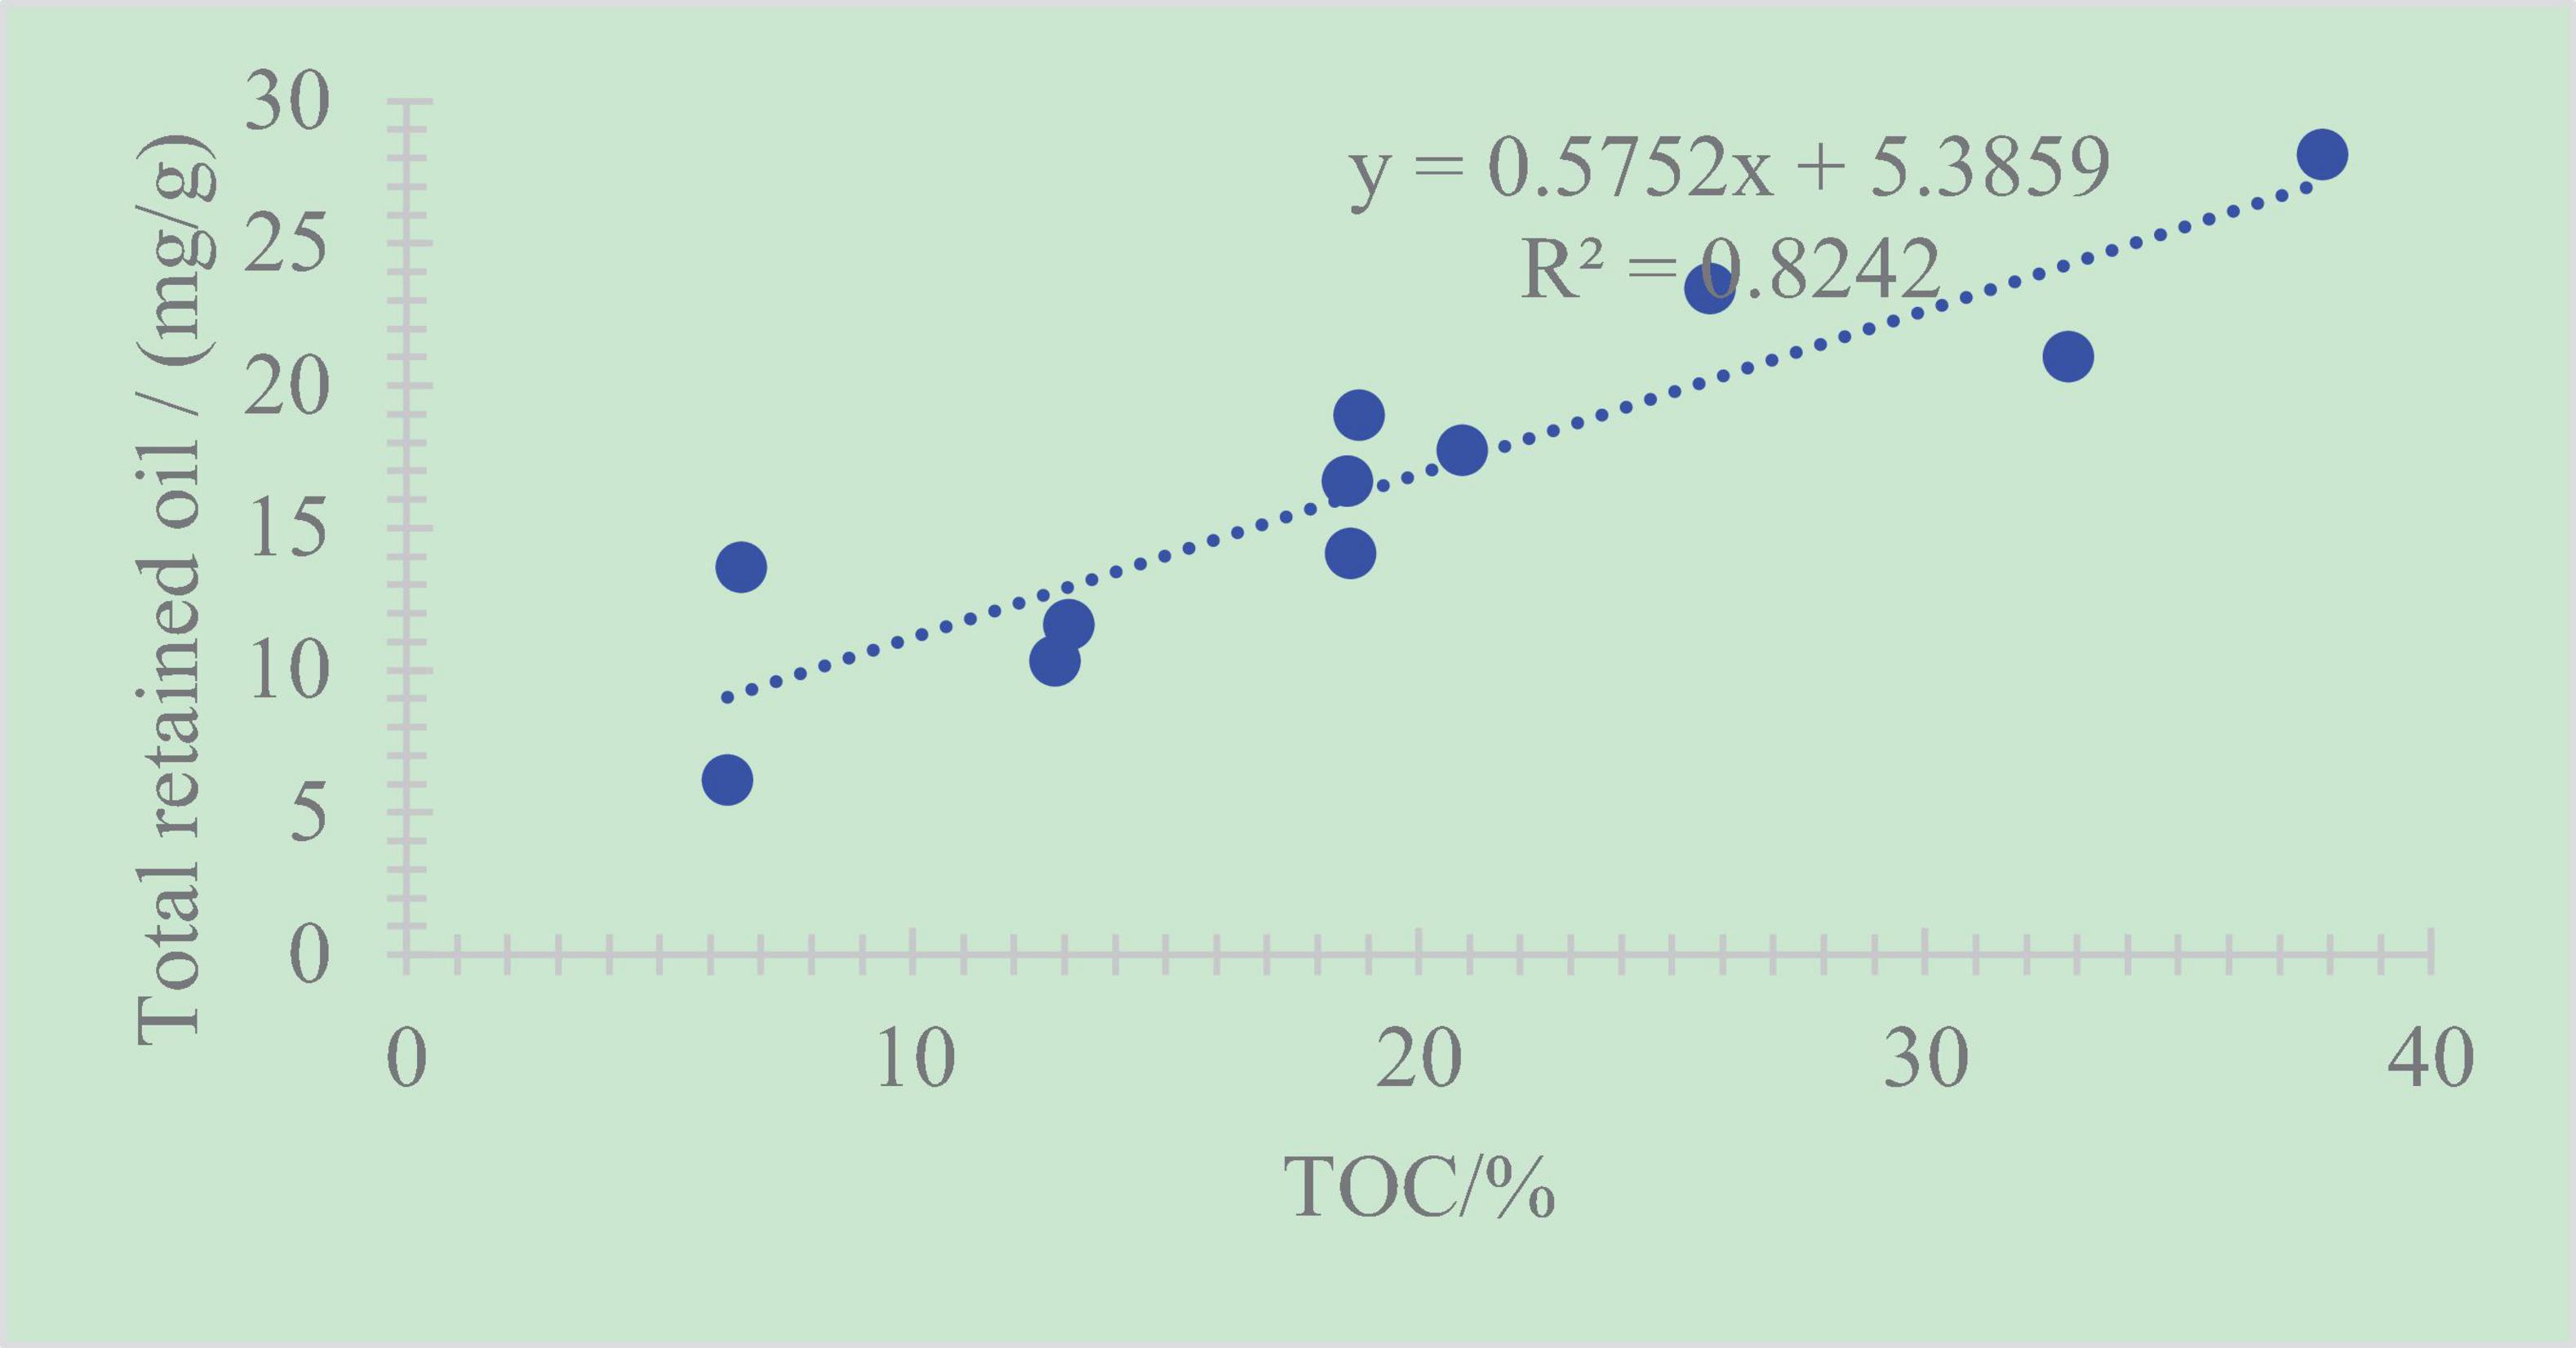
Figure 9. Relationship between the total retained oil content and TOC.
A positive correlation exists between the total retained oil content and S1 (Chen et al., 2017; Chen et al., 2018; Li et al., 2018; Li M. W. et al., 2019; Ma et al., 2019). The correlation coefficient is R2 = 0.66 (Figure 10). The relatively weak correlation also shows that the retained oil in shale cannot be calculated objectively only by the method of conventional rock pyrolysis.
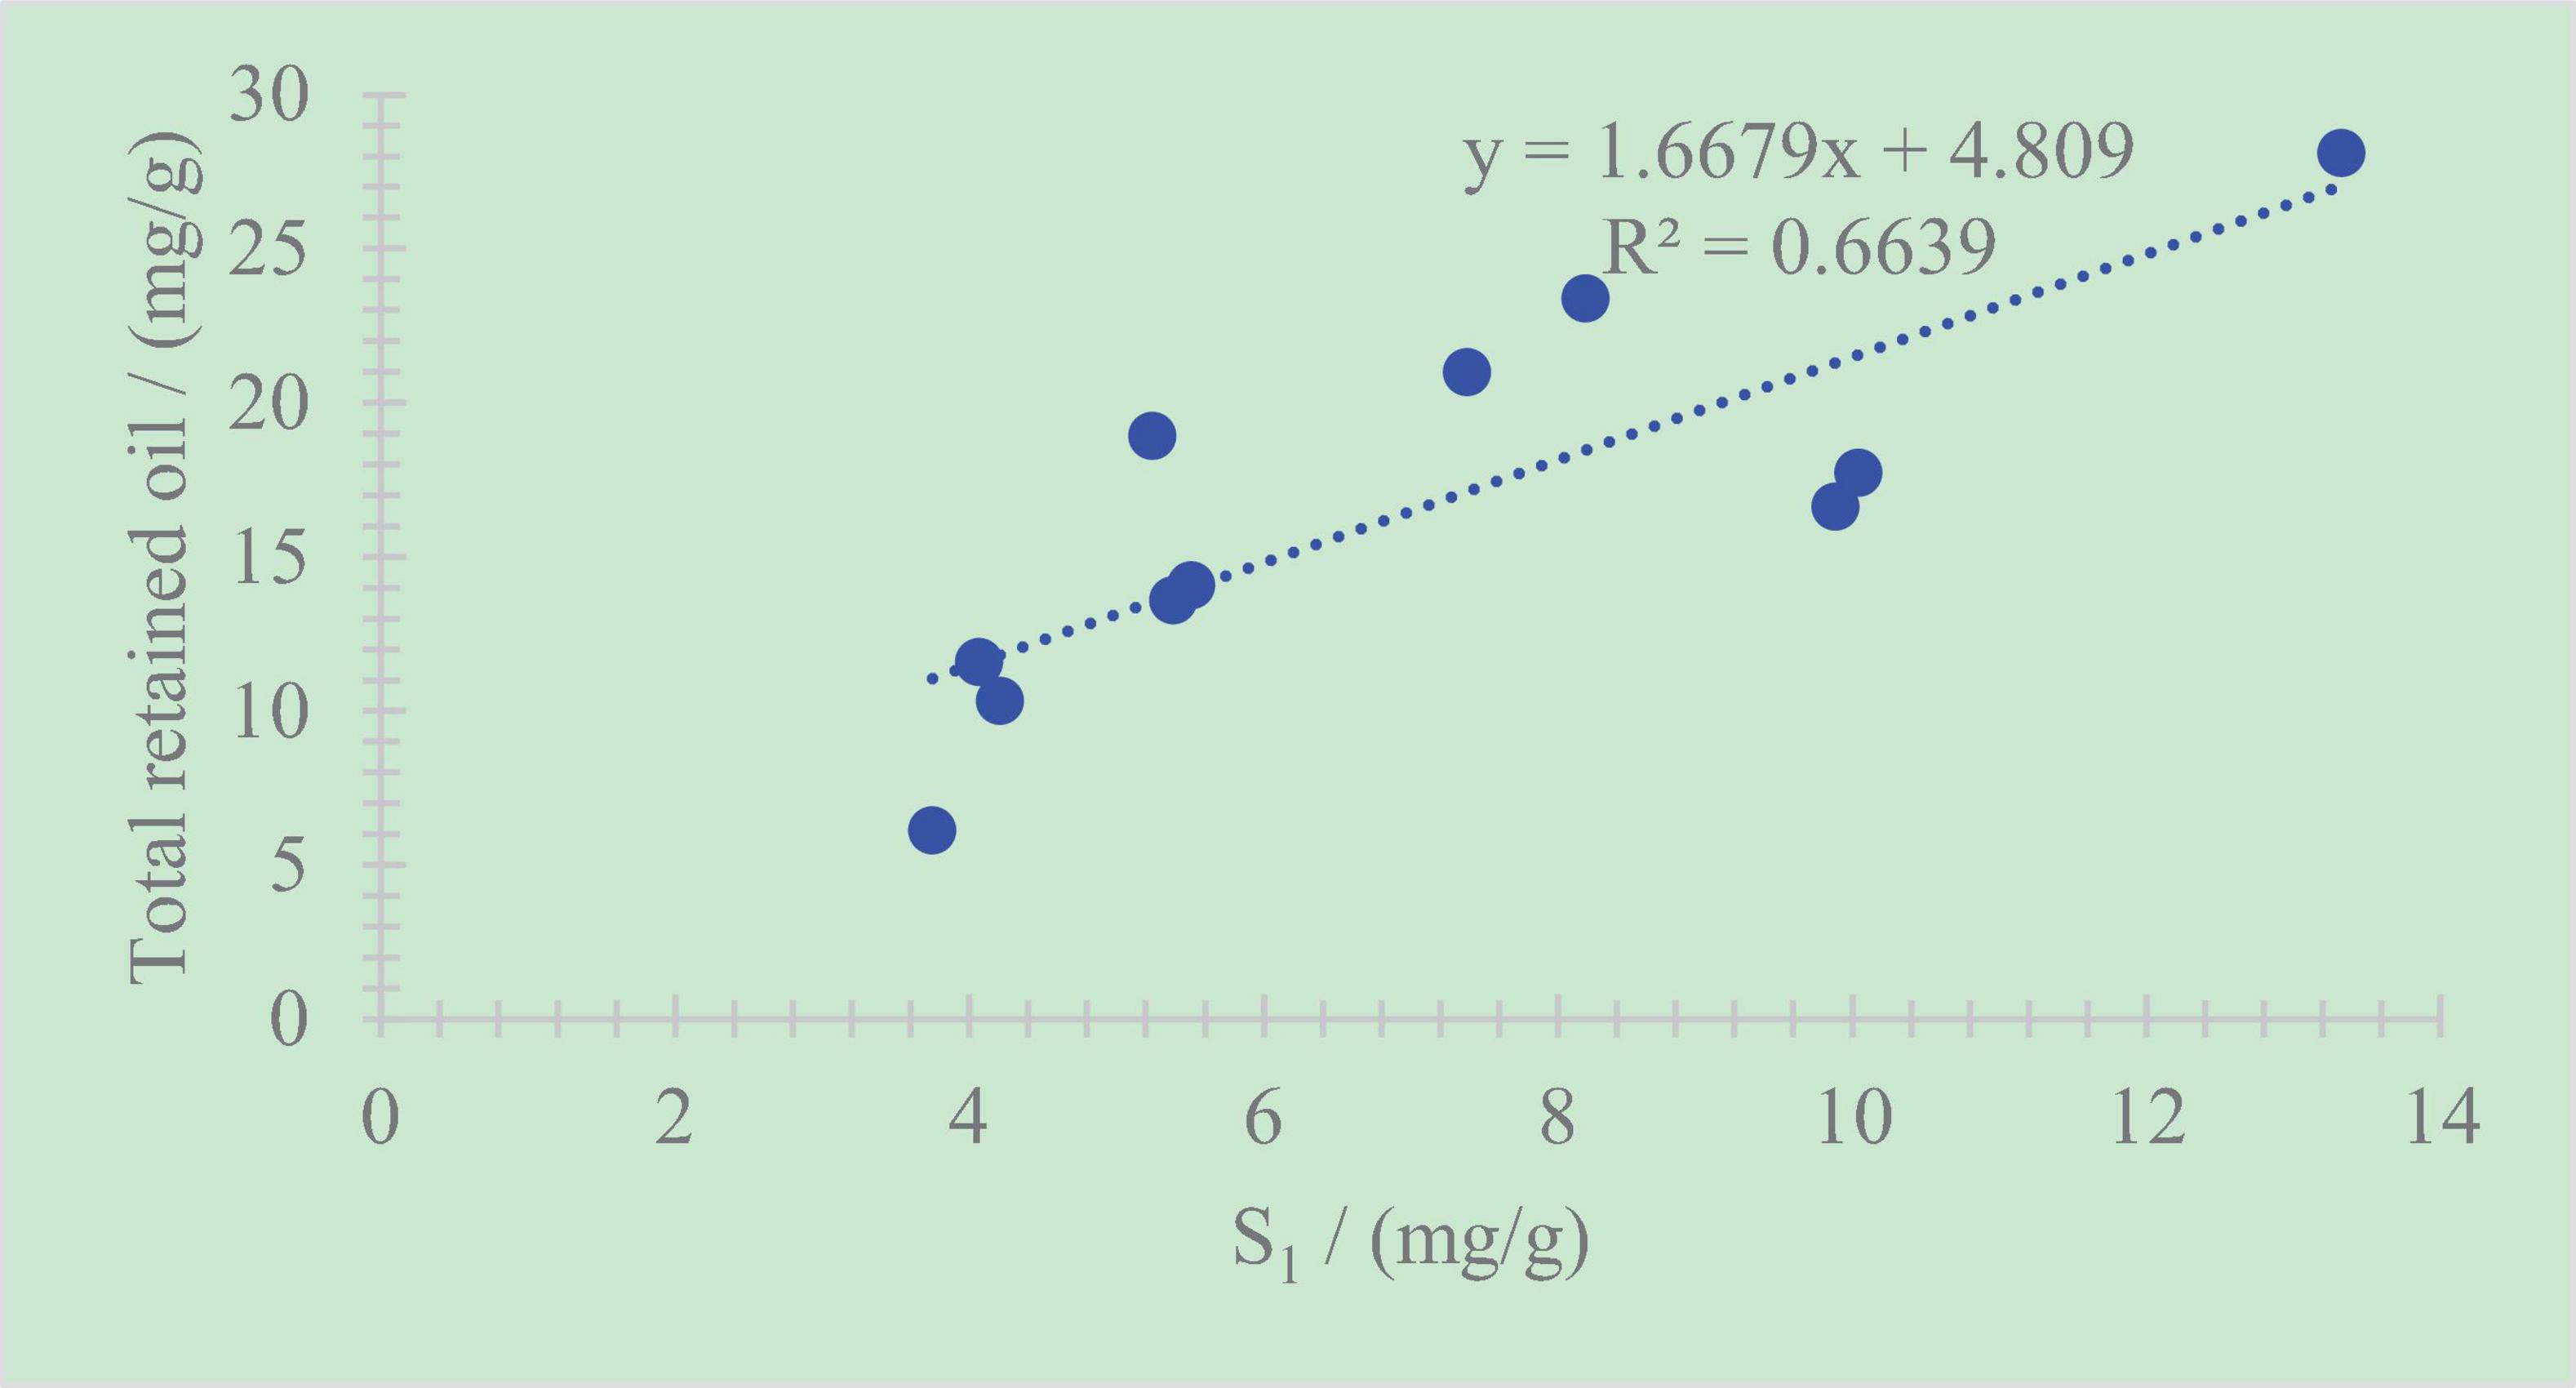
Figure 10. Relationship between the total retained oil content and S1.
This study took sealed cores of organic-rich shale in the Ordos Basin and measured the total retained oil (WO) via approaches including low-temperature soaking, multiple extractions, multiple pyrolysis, and multiple chromatographic analyses. The WO value obtained from the new method is 60–260% higher than that obtained from conventional pyrolysis and 34–69% higher than the sum of the extractions by dichloromethane (WO3) and chloroform (WO4). Even after extraction by dichloromethane and chloroform, there remains 4.7–11.6% hydrocarbon retained in the organic-rich shale (WO5). The total retained oil content (WO) in the organic-rich shale exhibits a positive relationship with the sum of the extractions using dichloromethane and chloroform (WO3 + WO4), with R2 reaching 0.96. This indicates that the primary composition in the total retained oil is soluble organic matter and is extractable via dichloromethane and chloroform. Positive correlations can also be observed between WO and TOC, and S1 through coefficients of 0.82 and 0.66, respectively.
The original contributions presented in the study are included in the article/supplementary material, further inquiries can be directed to the corresponding author/s.
LH: conceptualization, methodology, investigation, and writing – original draft. XL: data curation, writing – review and editing. SL: formal analysis, resources. ZZ: software, validation, and project administration. YL: funding acquisition. All authors contributed to the article and approved the submitted version.
This study was funded by PetroChina Co., Ltd. (grant nos. 2015D-4810-02 and 2018ycq03), the Research on Exploration and Development Technology of Unconventional Oil and Gas Resources (2012A-4802-02), and the Formation Mechanism and Enrichment Regularity of Terrestrial Tight Oil (Shale Oil) in China (2014CB239000).
LH, XL, SL, and ZZ are employed by PetroChina Co., Ltd. The authors declare that this study received funding from PetroChina Co., Ltd. The funder was not involved in the study design, collection, analysis, interpretation of data, the writing of this article, or the decision to submit it for publication.
The remaining author declares that the research was conducted in the absence of any commercial or financial relationships that could be construed as a potential conflict of interest.
We express our genuine appreciation to Professor Jones and Harris for their constructive comments and revisions. We also thank Dr. Johnson for his language editing and polishing work.
Abrams, M. A., Gong, C. Y., Garnier, C., and Sephton, M. A. (2017). A new thermal extraction protocol to evaluate liquid rich unconventional oil in place and in-situ fluid chemistry. Mar. Pet. Geol. 88, 659–675. doi: 10.1016/j.marpetgeo.2017.09.014
Chen, Z. H., Guo, Q. L., Jiang, C. Q., Liu, X. J., Reyes, J., Mort, A., et al. (2017). Source rock characteristics and Rock-Eval-based hydrocarbon generation kinetic models of the lacustrine chang-7 Shale of triassic Yanchang Formation, Ordos Basin, China. Int. J. Coal Geol. 182, 52–65. doi: 10.1016/j.coal.2017.08.017
Chen, Z. H., and Jiang, C. Q. (2016). A revised method for organic porosity estimation in shale reservoirs using rock-eval data: example from Duvernay Formation in the western Canada sedimentary basin. AAPG Bull. 100, 405–422. doi: 10.1306/08261514173
Chen, Z. H., Li, M. W., Ma, X. X., Cao, T. T., Liu, X. J., Li, Z. M., et al. (2018). Generation kinetics based method for correcting effects of migrated oil on rock-eval data – an example from the eocene Qianjiang Formation, Jianghan Basin, China. Int. J. Coal Geol. 195, 84–101. doi: 10.1016/j.coal.2018.05.010
Hackley, P. C., Dennen, K. O., Garza, D., Lohr, C. D., Valentine, B. J., Hatcherian, J. J., et al. (2020). Oil-source rock correlation studies in the unconventional Upper Cretaceous Tuscaloosa marine shale (TMS) petroleum system, Mississippi and Louisiana, USA. J. Pet. Sci. Eng. 190:107015. doi: 10.1016/j.petrol.2020.107015
Han, H., Zhong, N. N., Huang, C. X., and Zhang, W. (2015). Pyrolysis kinetics of oil shale from northeast China: implications from thermogravimetric and rock–eval experiments. Fuel 159, 776–783. doi: 10.1016/j.fuel.2015.07.052
Hou, L. H., Luo, X., Han, W. X., Lin, S. H., Pang, Z. L., and Liu, J. Z. (2020). Geochemical evaluation of the hydrocarbon potential of shale oil and its correlation with different minerals-a case study of the TYP shale in the Songliao Basin, China. Energy Fuels 34, 11998–12009. doi: 10.1021/acs.energyfuels.0c01285
Hou, L. H., Ma, W. J., Luo, X., Liu, J. Z., Lin, S. H., and Zhao, Z. Y. (2021a). Hydrocarbon generation-retention-expulsion mechanism and shale oil producibility of the Permian lucaogou shale in the Junggar Basin as simulated by semi-open pyrolysis experiments. Mar. Pet. Geol. 125:104880. doi: 10.1016/j.marpetgeo.2020.104880
Hou, L. H., Luo, X., Zhao, Z. Y., and Zhang, L. J. (2021b). Identification of oil produced from shale and tight reservoirs in the permian lucaogou shale sequence, Jimsar Sag, Junggar Basin, NW China. ACS Omega 6, 2127–2142. doi: 10.1021/acsomega.0c05224
Jarvie, D. M. (2012). “Shale resource systems for oil and gas: part 1- shale-gas resource systems,” in Shale Reservoirs Giant Resources for the 21st Century, Vol. 97, ed. J. A. Breyer (Tulsa: AAPG Memoir), 69–87.
Jiang, C. Q., Chen, Z. H., Lavoie, D., Percival, J. B., and Kabanov, P. (2017). Mineral carbon MinC (%) from Rock-Eval analysis as a reliable and cost-effective measurement of carbonate contents in shale source and reservoir rocks. Mar. Pet. Geol. 83, 184–194. doi: 10.1016/j.marpetgeo.2017.03.017
Johannes, I., Kruusement, K., and Veski, R. (2007). Evaluation of oil potential and pyrolysis kinetics of renewable fuel and shale samples by Rock-Eval analyzer. J. Anal. Appl. Pyrol. 79, 183–190. doi: 10.1016/j.jaap.2006.12.001
Kang, Z. Q., Zhao, Y. S., and Yang, D. (2020). Review of oil shale in-situ conversion technology. Appl. Energy 269:115121. doi: 10.1016/j.apenergy.2020.115121
Li, M. W., Chen, Z. H., Cao, T. T., Ma, X. X., Liu, X. J., Li, Z. M., et al. (2018). Expelled oils and their impacts on Rock-Eval data interpretation, Eocene Qianjiang Formation in Jianghan Basin, China. Int. J. Coal Geol. 191, 37–48. doi: 10.1016/j.coal.2018.03.001
Li, M. W., Chen, Z. H., Ma, X. X., Cao, T. T., Qian, M. H., Jiang, Q. G., et al. (2019). Shale oil resource potential and oil mobility characteristics of the Eocene-Oligocene Shahejie Formation, Jiyang Super-Depression, Bohai Bay Basin of China. Int. J. Coal Geol. 204, 130–143. doi: 10.1016/j.coal.2019.01.013
Li, J. B., Wan, M., Chen, Z. H., Lu, S. F., Jiang, C. Q., Chen, G. H., et al. (2019). Evaluating the total oil yield using a single routine Rock-Eval experiment on as-received shales. J. Anal. Appl. Pyrol. 144:104707. doi: 10.1016/j.jaap.2019.104707
Ma, W. J., Hou, L. H., Luo, X., Liu, J. Z., Tao, S. Z., Guan, P., et al. (2020a). Generation and expulsion process of the chang 7 oil shale in the ordos basin based on temperature-based semi-open pyrolysis: implications for in-situ conversion process. J. Pet. Sci. Eng. 190:107035. doi: 10.1016/j.petrol.2020.107035
Ma, W. J., Hou, L. H., Luo, X., Tao, S. Z., Guan, P., Liu, J. Z., et al. (2020b). Role of bitumen and NSOs during the decomposition process of a lacustrine Type-II kerogen in semi-open pyrolysis system. Fuel 259:116211. doi: 10.1016/j.fuel.2019.116211
Ma, X. X., Li, M. W., Pang, X. Q., Wei, X. Y., Qian, M. H., Tao, G. L., et al. (2019). Paradox in bulk and molecular geochemical data and implications for hydrocarbon migration in the inter-salt lacustrine shale oil reservoir, Qianjiang Formation, Jianghan Basin, central China. Int. J. Coal Geol. 209, 72–88. doi: 10.1016/j.coal.2019.05.005
Nady, M. M. E., and Hammad, M. M. (2015). Organic richness, kerogen types and maturity in the shales of the Dakhla and Duwi formations in Abu Tartur area, Western Desert, Egypt: implication of rock–eval pyrolysis. Egypt. J. Pet. 24, 423–428. doi: 10.1016/j.ejpe.2015.10.003
Shao, D. Y., Zhang, T. W., Ko, L. T., Li, Y. F., Yan, J. P., Zhang, L. L., et al. (2020). Experimental investigation of oil generation, retention, and expulsion within Type II kerogen-dominated marine shales: insights from gold-tube nonhydrous pyrolysis of Barnett and Woodford Shales using miniature core plugs. Int. J. Coal Geol. 217:103337. doi: 10.1016/j.coal.2019.103337
Soeder, D. J. (2018). The successful development of gas and oil resources from shales in North America. J. Pet. Sci. Eng. 163, 399–420. doi: 10.1016/j.petrol.2017.12.084
Solarin, S. A., Gil-Alana, L. A., and Lafuente, C. (2020). An investigation of long range reliance on shale oil and shale gas production in the U.S. market. Energy 195:116933. doi: 10.1016/j.energy.2020.116933
Stroup, C. H. (1987). The effect of organic matter type and organic carbon content on Rock-Eval hydrogen index in oil shales and source rocks. Org. Geochem. 11, 351–369. doi: 10.1016/0146-6380(87)90068-4
Sun, J., Xiao, X. M., Cheng, P., and Tian, H. (2019). Formation and evolution of nanopores in shales and its impact on retained oil during oil generation and expulsion based on pyrolysis experiments. J. Pet. Sci. Eng. 176, 509–520. doi: 10.1016/j.petrol.2019.01.071
Ulrich-Schad, J. D., Larson, E. C., Fernando, F., and Abulbasher, A. (2020). The Goldilocks view: support and skepticism of the impacts and pace of unconventional oil and gas development in the bakken shale of the United States. Energy Res. Soc. Sci. 70:101799. doi: 10.1016/j.erss.2020.101799
Zhao, W. Z., Zhu, R. K., Hu, S. Y., Hou, L. H., and Wu, S. T. (2020a). Accumulation contribution differences between lacustrine organic-rich shales and mudstones and their significance in shale oil evaluation. Pet. Explor. Dev. 47, 1160–1171. doi: 10.1016/s1876-3804(20)60126-x
Zhao, X. Z., Zhou, L. H., Pu, X. G., Jin, F. M., Shi, Z. N., Han, W. Z., et al. (2020b). Formation conditions and enrichment model of retained petroleum in lacustrine shale: a case study of the Paleogene in Huanghua depression, Bohai Bay Basin, China. Pet. Explor. Dev. 47, 916–930. doi: 10.1016/s1876-3804(20)60106-9
Zhu, J. Y., Yi, L. P., Yang, Z. Z., and Li, X. G. (2021). Numerical simulation on the in situ upgrading of oil shale reservoir under microwave heating. Fuel 287:119533.
Zink, K. G., Scheeder, G., Stueck, H. L., Biermann, S., and Blumenberg, M. (2016). Total shale oil inventory from an extended rock-eval approach on non-extracted and extracted source rocks from Germany. Int. J. Coal Geol. 163, 186–194. doi: 10.1016/j.coal.2016.06.023
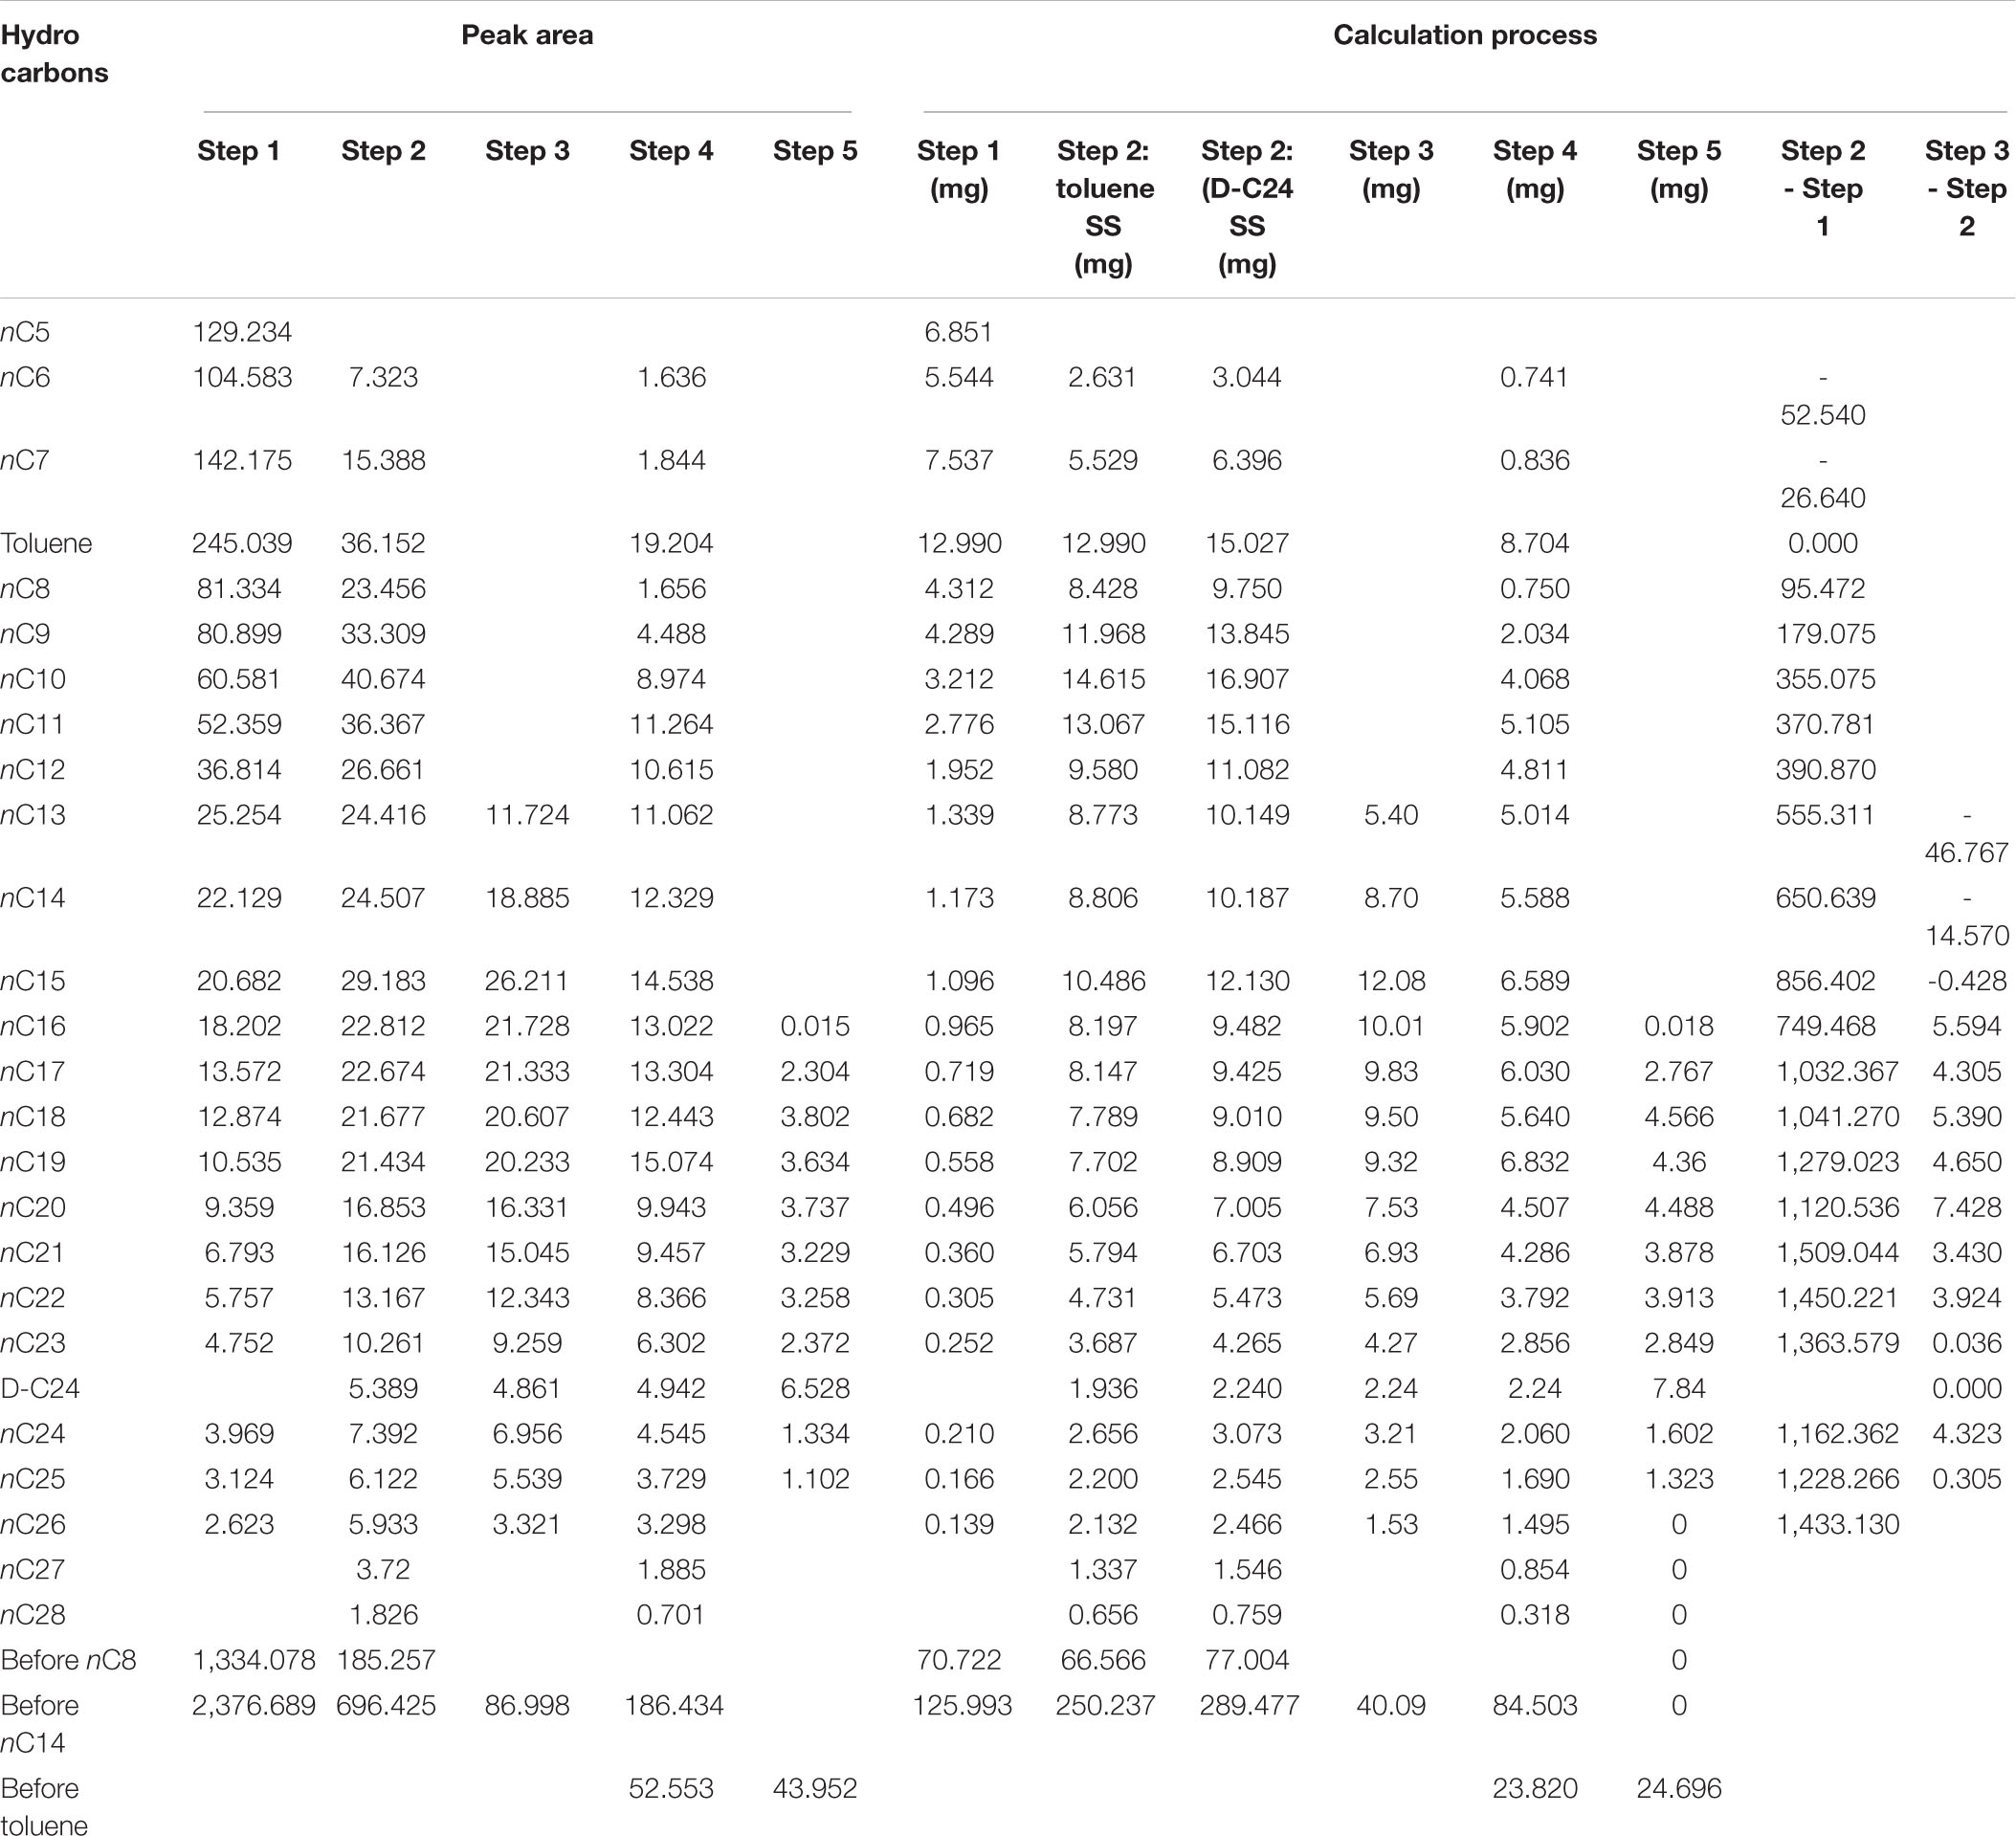
Table A1. Typical chromatogram table of sample 6 and the calculation process.
Keywords: organic-rich shale, retained oil, oil content calculation, pyrolysis, sealed coring
Citation: Hou L, Luo X, Lin S, Zhao Z and Li Y (2021) Quantitative Measurement of Retained Oil in Organic-Rich Shale—A Case Study on the Chang 7 Member in the Ordos Basin, China. Front. Earth Sci. 9:662586. doi: 10.3389/feart.2021.662586
Received: 01 February 2021; Accepted: 25 February 2021;
Published: 16 April 2021.
Edited by:
Dongdong Wang, Shandong University of Science and Technology, ChinaReviewed by:
Wenxue Han, Shandong University of Science and Technology, ChinaCopyright © 2021 Hou, Luo, Lin, Zhao and Li. This is an open-access article distributed under the terms of the Creative Commons Attribution License (CC BY). The use, distribution or reproduction in other forums is permitted, provided the original author(s) and the copyright owner(s) are credited and that the original publication in this journal is cited, in accordance with accepted academic practice. No use, distribution or reproduction is permitted which does not comply with these terms.
*Correspondence: Lianhua Hou, aG91bGhAcGV0cm9jaGluYS5jb20uY24=
Disclaimer: All claims expressed in this article are solely those of the authors and do not necessarily represent those of their affiliated organizations, or those of the publisher, the editors and the reviewers. Any product that may be evaluated in this article or claim that may be made by its manufacturer is not guaranteed or endorsed by the publisher.
Research integrity at Frontiers
Learn more about the work of our research integrity team to safeguard the quality of each article we publish.